The Impact of Sub-Resolution Porosity on Numerical Simulations of Multiphase Flow
Abstract
Sub-resolution porosity (SRP) is an ubiquitous, yet often ignored, feature in Digital Rock Physics. It embodies the trade-off between image resolution and field-of-view, and it is a direct result of choosing an imaging resolution that is larger than the smallest pores in a heterogeneous rock sample. In this study, we investigate the impacts of SRP on multiphase flow in porous rocks. To do so, we use our newly developed Multiphase Micro-Continuum model to perform first-of-a-kind direct numerical simulations of two-phase flow in porous samples containing SRP. We show that SRP properties (porosity, permeability, wettability) can impact predicted absolute permeabilities, fluid breakthrough times, residual saturations, and relative permeabilities by factors of up to 2, 1.5, 3, and 20, respectively. In particular, our results reveal that SRP can function as a persistent connector preventing the formation of isolated wetting fluid domains during drainage, thus dramatically increasing relative permeabilities to both fluids at low saturations. Overall, our study confirms previous evidence that the influence of SRP cannot be disregarded without incurring significant errors in numerical predictions or experimental analyses of multiphase flow in heterogeneous porous media.
keywords:
porous media , sub-resolution porosity , multiphase flow , relative permeability , multi-scale , micro-continuum1 Introduction
The recent emergence of Digital Rock Physics (DRP) has revolutionized the way we study porous media. It is now possible to directly characterize the pore structure of subsurface systems and perform three-dimensional direct numerical simulations of fluid flow in digital models of rock samples that approach the size of a Representative Elementary Volume (REV). As such, DRP has transformed our capacity to characterize and predict fluid flow in soils, sedimentary rocks, hydrocarbon reservoirs, and engineered porous systems (Mehmani et al., 2020; Han et al., 2020). The computation of rock transport parameters including absolute permeability (Spanne et al., 1994), dispersion coefficients (Bijeljic et al., 2013; Soulaine et al., 2021), relative permeabilities, and capillary pressures (Raeini et al., 2014; Prodanović et al., 2014) has had direct impacts in the fields of reservoir engineering, hydrology, and sequestration (Blunt et al., 2013; Soulaine et al., 2021).
1.1 Rock Imaging Techniques and Sub-Resolution Porosity
Digital Rock Physics is made possible by advances in high resolution imaging techniques, notably X-ray Microtomography (XCT) (Baker et al., 2012; Singh et al., 2018; Kohanpur and Valocchi, 2020) and focused ion beam scanning electron microscopy (FIB-SEM) (Cnudde and Boone, 2013; Kelly et al., 2016; Welch et al., 2017; Ruspini et al., 2021). The first method, XCT, involves recording hundreds or thousands of two-dimensional (2-D) X-ray scans through a sample that are then computationally reconstructed to create a 3-D image. This method enables detailed volumetric representations of rock core samples spanning several cubic millimeters with a resolution of about 1 cubic micrometer (Wildenschild and Sheppard, 2013; Blunt et al., 2013). The second method, FIB-SEM, involves repeated etching and imaging of a sample through alternating application of focused ion beams and scanning electron microscopy at considerably smaller scales. It yields images spanning 5 cubic micrometers with an associated resolution of 5 cubic nanometers (Dewers et al., 2012). These two techniques highlight an important limitation of current imaging techniques: the existence of an unavoidable trade-off between image resolution and field-of-view.
The inherent complexity of most natural rocks further complicates the imaging and characterization process. More often than not, rocks such as sandstones, carbonates, and shales exhibit heterogeneities that span several length scales (Bear, 1988; Mousavi et al., 2013; Akbarabadi et al., 2017; Beckingham et al., 2017), some of which cannot be properly resolved by the aforementioned imaging techniques. A common way to simplify the imaging process while accounting for these heterogeneities is to designate a “cutoff” voxel size that resolves the largest pores within a given rock sample (or other features of interest such as cracks or fractures) while simultaneously acting as a “filter” for any pores smaller than that particular size. These small pores, which are not individually resolved, are then designated “sub-resolution porosity” (SRP) and labeled as a third phase in the rock-pore-SRP system during the eventual segmentation of sample images. The final result is a reconstructed image with an acceptable trade-off between resolution and field of view (Scheibe et al., 2015).
Until recently, and despite its abundance in reconstructed natural rock scans, SRP was generally assumed to have little influence on rock hydraulic properties predicted from flow simulations. Most computational models were based on the simplifying assumption that transport within the SRP is dominated by diffusion and thus contributes negligibly to fluid flow (Haggerty and Gorelick, 1995; Carrera et al., 1998; Gouze et al., 2008; Shabro et al., 2011; Gjetvaj et al., 2015). However, recent studies have shown that this assumption breaks down whenever SRP contributes significantly to the rock’s percolating path by forming bridges between resolved pore spaces. In these cases, SRP can impact permeability by a factor larger than 2 even when contributing only 2% of the total porosity (Churcher et al., 1991; Tanino and Blunt, 2012; Soulaine et al., 2016; Wu et al., 2019). In addition, recent evidence suggests that SRP also can have important impacts on multiphase flow, as shown by observations of dramatic changes in relative permeability curves and overall flow behaviour associated with differences in SRP wetting properties in mixed-wet or strongly-wetting rocks (Zou et al., 2018; Rücker et al., 2019; Fan et al., 2020; Garfi et al., 2020).
1.2 Multiscale Models
A potential path towards resolving the influence of SRP on hydrologic processes is provided by sustained efforts to develop numerical techniques designed to account for this feature combined with steady advances in high-performance parallel computing (Arbogast, 1993a, b; Moctezuma-Berthier et al., 2004; Javadpour, 2009; Bauer et al., 2011; Jiang et al., 2013). In particular, the development of multiscale/dual-porosity pore network models (D-PNM) has allowed for relatively fast and accurate assessment of the permeability of rocks containing multiscale heterogeneity (Békri et al., 1995). Classical PNMs rely on approximating the 3-dimensional resolved pore space through a series of ideally-shaped pore “nodes” and “throats” (Fatt, 1956). The result is a system where the relevant fluid dynamics can be readily solved through idealized equations for flow (Dong and Blunt, 2009; Joekar-Niasar and Hassanizadeh, 2012; Jiang et al., 2012; Blunt et al., 2013; Huang et al., 2016; Suo et al., 2020). In D-PNMs, the presence of SRP is accounted for through the implementation of an additional fine-scale pore network (Ioannidis and Chatzis, 2000; Jiang et al., 2013; Prodanović et al., 2014; Sadeghnejad and Gostick, 2020; Moslemipour and Sadeghnejad, 2020) or through the creation of “micro-links” forming percolation paths between large pores (Bultreys et al., 2015; Xu et al., 2021). Accurate definition of SRP connectivity within these networks remains a challenge (Zhao et al., 2017; Petrovskyy et al., 2020), as, by definition, there are no discernible features from which to inform assignments of pore network topology within the SRP.
The expansion of multiscale models into multiphase flow further complicates matters, as the effects of capillarity and wettability need to be modeled through representative relative permeability and capillary pressure models in order to obtain accurate flow representations within the SRP (Carrillo et al., 2020). For this reason, the few studies that implemented multiphase D-PNMs have relied on the assumption of quasi-static fluid displacement, an assumption valid for simulating flow at low capillary numbers (Mehmani et al., 2013; Bultreys et al., 2015; Xu et al., 2021) and where both phases are effectively set at a given saturation. These studies have leveraged D-PNMs to study how the amount and distribution of SRP affects the relative permeability behaviour of artificial rock samples (Mehmani and Prodanović, 2014) and how SRP characterization and connectivity affect the wetting properties of natural rocks (Bultreys et al., 2016; Song et al., 2021; Isah et al., 2020). Unfortunately, due to the simplifying assumptions of D-PNMs outlined above, extension of these studies to dynamic systems with mixed-wet SRP or systems with viscously-dominated flow remains impossible.
The Micro-Continuum approach presents an alternative route to simulating dynamic flow processes in systems with SRP. This approach relies on locally-averaged Navier-Stokes equations that asymptotically approach Darcy’s law in regions with SRP and the Navier-Stokes equations in fully resolved pores. This model has proven fairly flexible and has been used to evaluate the effects of static (Knackstedt et al., 2006; Apourvari and Arns, 2014; Scheibe et al., 2015; Soulaine and Tchelepi, 2016; Guo et al., 2018; Kang et al., 2019; Singh, 2019), reactive (Soulaine et al., 2017; Noiriel and Soulaine, 2021), and deformable (Carrillo and Bourg, 2019) SRP on the permeability of heterogeneous porous media. Furthermore, through careful consideration of capillary and viscous effects within the SRP (i.e., fluid mobility, relative permeabilities, and capillary pressures), recent investigations have successfully expanded and validated the Micro-Continuum Approach for situations involving the flow of multiple fluids in multiscale porous media (Soulaine et al., 2018; Carrillo et al., 2020; Carrillo and Bourg, 2021b, a). In this approach, the impact of simplifying model assumptions is greatly reduced relative to the D-PNM approach at the expense of relatively high computational costs. As such, this approach allows for the simulation of dynamic multiscale systems in domain sizes that approach that of an REV.
1.3 Objective of this Paper
In this study, we leverage the capabilities of the Multiphase Micro-Continuum Approach to systematically examine the influence of SRP properties (permeability, porosity, wettability) on Direct Numerical Simulation predictions of multiphase flow in a digital model of a carbonate rock. In particular, we characterize the rock’s absolute permeability, relative permeability curves, residual permeabilities, and fluid breakthrough times on the 30 mm3 scale of an XCT image. We hypothesise that the SRP properties outlined above have even greater impacts on multiphase flow than on single phase flow, such that their neglect or misrepresentation leads to inaccurate predictions of rock hydraulic properties. To the best of our knowledge, this is the first application of Direct Numerical Simulations to multiphase flow in rock samples containing unresolved porosity and the first computational effort to systematically examine the impacts of SRP wetting properties on the aforementioned rock flow properties.
2 Materials and Methods
2.1 Mathematical model
The Multiphase Micro-Continuum framework for incompressible immiscible flow in rigid porous media consists of three volume-averaged partial differential equations. They describe the conservation and transport of fluid mass (Eqn. 1), fluid saturation (Eqn. 2), and fluid momentum (Eqn. 3). Once implemented in a suitable numerical solver, these equations are used to solve for the single-field pressure (), the single-field fluid velocity (), and the wetting-fluid saturation (). A full description of the model can be found in Carrillo et al. (2020). Here, we have:
| (1) |
| (2) |
| (3) |
where the subscripts and refer to the wetting and non-wetting fluids, is the cell porosity, is the single-field density, is the drag coefficient of the unresolved porous media (a function of the cell permeability, saturation, and fluid viscosities), are the capillary forces, and is the averaged single-field shear stress tensor. Here, gravity is neglected and the phrase “single-field” refers to averaged variables that depend on the properties of both fluids (Maes and Soulaine, 2019).
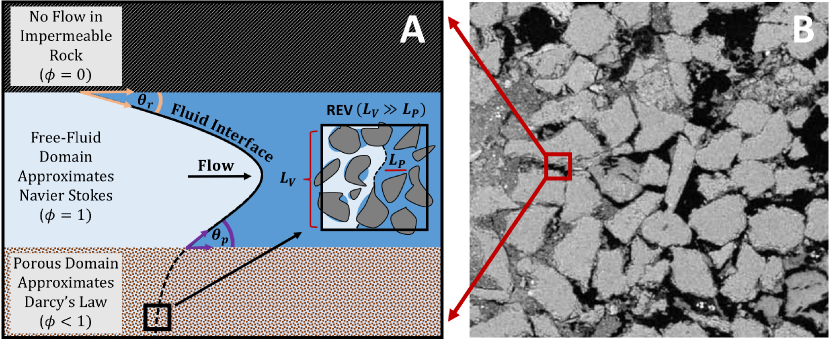
A key feature of Eqns. 1-3 is that they are valid in control volumes that contain any combination of the three relevant phases (porous solid, wetting fluid, non-wetting fluid), meaning that they can be applied to systems that contain both solid-free () and porous regions (). Due to the scale separation hypothesis (Whitaker, 1986), this unique set of equations tends towards distinct solutions in solid-free and porous regions. Notably, the single-field momentum equation tends to a solution that can be asymptotically matched to the two-phase Navier-Stokes equations in solid-free regions and to two-phase Darcy’s law in porous regions (Carrillo et al., 2020):
| (4) |
As such, the Multiphase Micro-Continuum model is ideally suited for simulating multiphase flow in XCT images that contain SRP, as illustrated schematically in Figure 1.
The asymptotic matching noted above requires appropriate definitions of the relative velocity , drag force , and capillary forces . These variables reflect the influence of sub-grid-scale structure and dynamics, including the fluid distribution and the impact of porous micro-structure on flow within the SRP. For this reason, these parameters are defined differently in the solid-free region () and porous regions (). In particular, the single-field drag force is negligible in solid-free regions and, in porous regions, depends on absolute () and relative permeabilities () within the SRP:
| (5) |
The capillary forces within the solid-free region are proportional to the surface tension and the curvature of the fluid-fluid interface as described by the Continuum Surface Force formulation (Brackbill et al., 1992). In the porous region, capillary forces are a function of the fluid mobilities () and the average capillary pressure :
| (6) |
where the normal at the fluid-fluid interface, , is given by
| (7) |
Equation 7 imposes a contact angle at the SRP surface following the approach developed by Horgue et al. (2014), where and are the tangential and normal directions relative to the SRP surface. The specification of the contact angle at non-porous rock surfaces, , follows a similar implementation.
The relative fluid velocity is given by:
| (8) |
where is an interface compression parameter used in the Volume-of-Fluid method (typically set to values between 1 and 4), and the expression within the SRP is imposed by asymptotic matching to two-phase Darcy’s law (Carrillo et al., 2020).
Lastly, closure of the system of equations presented above requires appropriate constitutive models to solve for and within the SRP. For simplicity, we use the well-known Van Genuchten model (van Genuchten, 1980):
| (9) |
| (10) |
| (11) |
where is a wetting parameter that controls the internal wettability of the SRP and is the entry capillary pressure of the SRP. The SRP is internally water-wet if and oil-wet if . Note that the sign of the entry capillary pressure was changed for values of to prevent unphysical parameterizations where the SRP is both water-wet and oil-wet at the same time.
2.2 Numerical Implementation
The mathematical model presented in Section 2.1 was numerically implemented in OpenFOAM®, a free, parallel, C++ simulation platform that uses the Finite Volume Method to discretize and solve partial differential equations in three-dimensional grids. Mass conservation and incompressibility (Eqns. 1 and 3) were ensured through the Pressure Implicit Splitting-Operator (PISO) algorithm (Issa, 1986). The evolution of the fluid-fluid interface (Eqn. 2) was solved using the Multidimensional Universal Limiter of Explicit Solution (MULES) algorithm (Márquez and Fich, 2013) and a Piecewise-Linear Interface Calculation (PLIC) compression scheme. Extensive validation of the modeling framework is presented in Carrillo et al. (2020) and the open-source implementation is available from the author’s GitHub repository (Carrillo, 2020).
2.3 Studied Rock Sample
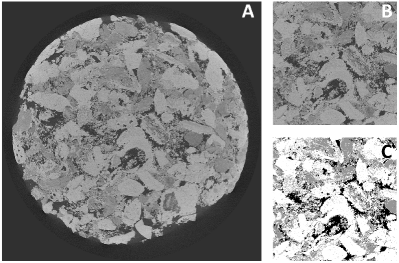
Simulations were performed on a reconstructed 3-D XCT scan of an Estaillades Carbonate sample obtained from Bultreys (2016) through the Digital Rock Portal. This set of images has been used in several previous D-PNM studies (Bultreys et al., 2015; Bultreys et al., 2016). The sample (1000 by 1000 by 1000 voxels, per voxel) is ideally suited for our purposes, as it is a mono-mineralic calcite rock containing both intergranular macropores and unresolved intragranular micropores (i.e., SRP). Voxels containing solid rock, resolved pores, and unresolved pores were identified through a 3-phase segmentation procedure following the steps outlined in Bultreys et al. (2015). This yielded a sample with solid rock voxels, porous voxels, and microporous voxels (Figure 2).
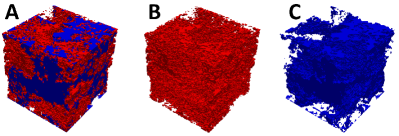
Due to the computational cost associated with performing direct numerical simulations on such a large physical space, we extracted a 200 by 200 by 200 voxel sub-sample from the original scan in order to perform our simulations. The computational cost was further reduced by removing all grid cells corresponding to solid rock voxels in the resulting computational mesh, yielding a sample of about 3.2 million cells (see Fig. 3). In order to maintain adequate mesh resolution while properly representing the mobile fluid-fluid interface within the open pore space, we implemented a dynamic mesh refinement algorithm that allowed the mesh to become up to 16 times finer at said interface. No mesh refinement was carried out within the SRP. Lastly, as is customary for these types of simulations and to properly control the flow rate into the sample, we added two “buffer” regions at the inlet and outlet boundaries of our samples. All other boundaries were defined with no-flow boundary conditions.
3 Base Simulation Setup and Upscaling
3.1 Base Simulation Parameterization
The main purpose of our simulations is to perform a sensitivity analysis of the impact of SRP properties on single and multiphase flow at the scale of the full digital rock image, hereafter referred to as the macroscopic scale. For this, we first introduce a “base” simulation that will be parameterized using experimental values and then used as a template for the systematic variation of SRP properties. This workflow is conceptually similar to the one performed in Hashemi et al. (2021).
Our base simulation involves the injection of oil into a fully-water-saturated rock sample at a constant rate of 0.1 L s-1 until the simulation reaches a steady-state. The choice of the labels “oil” and “water” is an arbitrary one: our main goal is to examine the flow of two immiscible and incompressible fluids. The advancing fluid is non-wetting in our base simulation, but the wettability of the solid by the two fluids is reversed in some of our simulations. The rock and fluid properties are summarized in Tables 1 and 2. The subsequent sensitivity analysis was performed by independently modifying the SRP’s porosity ( to ), absolute permeability ( to ), internal wetting properties ( to in Eqns. 9-11), and the contact angles formed by fluid-fluid interfaces on the external surface of SRP and impermeable rock domains ( and to ). The decoupling of the contact angle at the SRP and impermeable rock surfaces allows the investigation of mixed-wet systems (Song and Kovscek, 2015; Huang et al., 2016; Akbarabadi et al., 2017) and establishes the possibility of defining a roughness- or saturation-dependent contact angle in future studies (Wenzel, 1936; Whyman et al., 2008). The decoupling of internal () and surface () wetting properties allows us to differentiate between macroscopic and microscopic wetting effects, where impacts multiphase flow in large pores and impacts multiphase flow within the SRP.
Lastly, we carried out additional single-phase flow simulations for each case where we varied the SRP porosity and permeability. This was necessary to calculate each case’s absolute permeability and relative permeability curves (see Section 3.2). On average, each multiphase simulation ran for approximately 120 hours on ten 28-core Broadwell Xeon nodes.
| Property | Value |
| Property | Base Value | Range |
| 0.5 | ||
| 1 | ||
| n/a |
3.2 Calculation of Absolute Permeability and Relative Permeability Curves
Relative permeabilities were calculated through modification of the upscaling approach presented in Raeini et al. (2014), where macroscopic relative permeability is defined as the ratio between the apparent permeability calculated from transient, multi-phase flow experiments and the upscaled absolute permeability calculated from steady-state, single-phase flow experiments:
| (12) |
In Equation 12, the subscript identifies properties pertaining to either fluid and the subscript refers to quantities obtained from single-phase experiments. Furthermore, is the volumetric fluid flow rate of phase passing through an area into the porous medium, and is the pressure drop in phase across said medium. The latter is defined as follows:
| (13) | ||||
where is the fluid volume of the sample excluding the buffer zones. A drag term () is included Equation 13 to account for the momentum dissipation (i.e. pressure drop) induced by the presence of SRP in the sample. The calculation of follows Eqn. 13 sans the capillary force term.
Relative permeability curves were constructed by matching each value to the corresponding saturation in the porous medium at a specific point in time. This so-called “unsteady” approach, where values are not calculated at steady state (Amaefule and Handy, 1982; Johnson et al., 1959), enables calculating relative permeability curves without needing to carry out a distinct steady-state multiphase simulation for each data point, a current necessity across numerical frameworks for rock models with realistically complex pore structures given current computational capabilities. However, this comes at the expense of accuracy or, more precisely, at a risk that the resulting relative permeability curves may be sensitive to fluid flow rate (Diamantopoulos and Durner, 2012). To minimize the impact of this approximation, we focus on characterizing the sensitivity of to different SRP properties, as opposed to absolute values of . In other words, we aim to gain insight into the magnitude of the different impacts of SRP on multiphase flow, as opposed to quantitatively matching experimental results.
4 Impact of SRP on Absolute Permeability
In the following three sections, we quantify the effects of SRP properties on the rock’s overall absolute permeability (this section), relative permeability curves (Section 5), and time-dependent saturation profiles (Section 7). For the remainder of this study, each simulation case is identified by the variable that is changed with respect to the base simulation established in Section 3.1 and parameterized according to Tables 1 and 2. We now start by evaluating the effect of SRP on the rock’s absolute permeability.
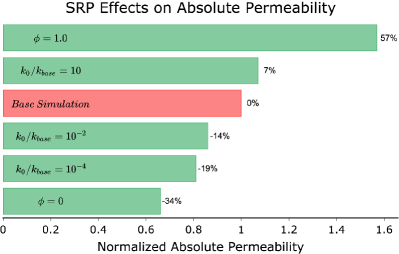
Figure 4 shows that the sample’s absolute permeability is overestimated by if the SRP is neglected and assumed to be open pore space () and underestimated by if it is ignored and assumed to be impermeable (), where the former’s permeability more than doubles the latter. The overall trend in Figure 4 is fairly intuitive: as the SRP’s porosity and/or permeability increase, so does the rock’s absolute permeability. This is in line with the findings of Mehmani and Prodanović (2014), and Soulaine et al. (2016). However, whereas some previous studies have observed that SRP can have a disproportionately large impact on permeability, implying that it forms key percolation pathways for single-phase flow (Soulaine et al., 2016), the factor of 2 impact of SRP on absolute permeability observed here is roughly consistent with the predictions of the well-known Kozeny-Carman equation, implying that SRP is relatively uniformly distributed in the studied rock sample (in close agreement with Bultreys et al. (2016)). As examined in the following sections, greater impacts of SRP are observed in systems with multiple fluid phases, where SRP wettability and relative permeability become key factors controlling fluid flow.
5 Impact of SRP on Relative Permeability Curves
Changes in sample relative permeability as a function of SRP porosity, wetting properties, and absolute permeability are not particularly intuitive. These often involve non-linear behaviors brought about by the combination of capillary forces and the sample’s geometry. Throughout the following discussion we will see that the SRP has two primarily competing effects: it enhances flow by connecting otherwise-isolated macroscopic flow paths, but it reduces flow by being less permeable than the open pore space. We will show that the balance between these two roles is strongly dictated by SRP properties.
The four sets of relative permeability curves present in Figure 5 exhibit two distinct behaviors reflecting different responses to changes in SRP properties. In one observed behavior, the curves for both fluids shift up (or down) in the same direction with respect to the y-axis. This implies that the sample becomes more (or less) permeable to both phases simultaneously. In the other observed behavior, the water and oil relative permeability curves shift up or down in opposite directions, indicating that an increased permeability to one fluid is associated with a decreased permeability to the other fluid.
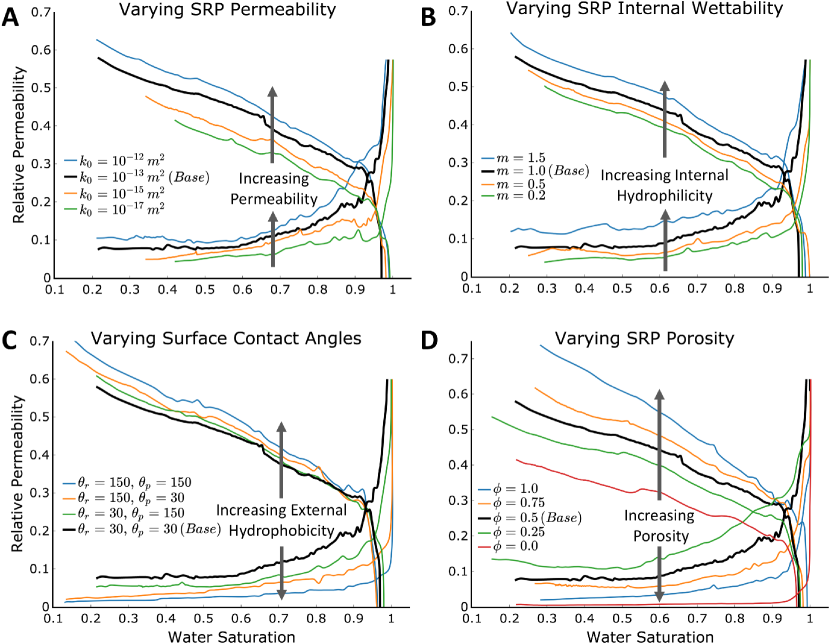
5.1 Sensitivity to SRP Absolute Permeability
Figure 5A demonstrates that an increase in SRP absolute permeability enhances the relative permeability curves of both oil and water. This enhancement occurs in addition to the enhancement in absolute permeability presented in Fig. 4. The enhancement of water relative permeability is entirely expected as the SRP is water-wet (and mostly water-saturated) in this scenario, such that greater SRP permeability naturally facilitates the flow of water. The enhancement of oil permeability is less intuitive. Since oil minimally accesses the SRP in this scenario, this enhancement is likely indirect, i.e., greater SRP permeability facilitates water drainage from the open pore space, which in turn facilitates the flow of oil.
We note, that both effects essentially disappear at SRP permeabilities below 10-17 m2 as shown in Fig. SI1 in the Supporting Information. In short, SRP permeability is only important if it is sufficiently large that flow can actually occur within the SRP.
5.2 Sensitivity to SRP’s internal wettability
Figure 5B shows that an increase in SRP internal wettability, from oil-wetting () to water-wetting (), also enhances the flow potential of both fluids. This effect is likely analogous to that observed for SRP absolute permeability: a more hydrophilic SRP should remain more fully water-saturated, and hence more permeable to water (because of impact of saturation on relative permeability within the SRP). As in Fig. 5A, this greater ability of water to flow through the SRP indirectly facilitates oil flow, likely by aiding water drainage from the open pore space.
5.3 Sensitivity to SRP and rock surface contact angles
Figure 5C shows that the relative permeability curves shift in opposite directions in response to changes in the external wettability of the rock or SRP surfaces. Specifically, as the pore walls become more hydrophobic, permeability to water decreases, while permeability to oil increases. The impact on oil flow is relatively small, likely because of the partial cancellation of two competing effects: more hydrophobic surfaces should inhibit oil flow by causing this flow to occur preferentially in smaller pores or closer to the pore walls; simultaneously more hydrophobic surfaces should enhance oil flow by minimizing the tendency towards trapping of oil droplets through capillary effects. Therefore, we posit that a decrease in capillary number (Ca) or sample homogeneity would likely enhance the trapping effect and may reverse the order of the oil relative permeability curves.
The impact on water flow is larger, a counter-intuitive observation. If water flows predominantly within the SRP, the impact of surface contact angles on water flow should be minimal. Alternatively, if water flows predominantly in the open pore space, surface contact angles should have relatively minor impact on relative permeability to water because of the competing effects noted above in the case of oil. In fact, an increase in water relative permeability with (opposite to that observed here) was reported by Fan et al. (2020). A possible explanation of our results is that residual water flow in our simulated system relies on the combination of SRP and residual macropore water flow (previous studies have largely ignored the presence of SRP). In systems with no microporosity, water can be retained in the open pore space through capillary forces, such as in capillary film coatings on rough pore walls (Tokunaga and Wan, 1997; Khishvand et al., 2016). Hydrophobic microporous walls would eliminate the capillary macropore water component of these residual flow paths.
5.4 Sensitivity to SRP Porosity
The effects of modulating SRP internal porosity between 0 to 1 are shown in Figure 5D. The overall magnitude of the relative permeability changes is in close agreement with Mehmani and Prodanović (2014), where the authors found that the addition of pore-clogging SRP can modify the relative permeability of the wetting and non-wetting phases by about a factor of 2. We note, again, that this effect occurs in addition to the significant impact of SRP porosity on absolute permeability presented in Fig. 4.
In addition to this significant influence of SRP porosity on relative permeability, our results also show unexpected complexity. In particular, the impact of SRP porosity on water flow is non-monotonous, with minimum water relative permeabilities observed at either or 1 and larger water relative permeabilities observed at intermediate values. This observation is consistent with the expected trend if residual water flow relies on a combination of both SRP and residual macropore water as suggested above: values or 1 would inhibit water flow by eliminating the SRP water component of these residual flow paths.
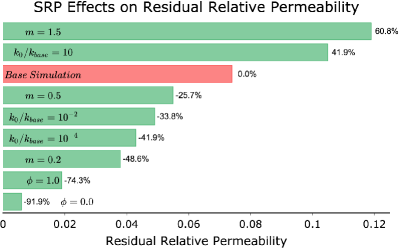
6 Impact of SRP on Residual Relative Permeability
As noted above, our results strongly suggest that the SRP can function as an efficient and persistent connector between otherwise-disconnected water bodies, particularly at low water saturations. We call this increase in permeability the ‘SRP-enhanced relative permeability’. A key manifestation of this is the persistence of significant relative permeability in the water phase at water saturations below 0.5, in agreement with experimental observations for rocks with significant microporosity (Bennion and Bachu, 2010). In contrast, pore network model simulations of multiphase flow generally predict that relative permeability to water is nearly zero at water saturations below 0.2 to 0.5 (Prodanović et al., 2014; Huang et al., 2016).
A convenient way to characterize this effect is by ranking the relative permeabilities of water once each system has achieved a steady state, as seen in Figure 6. The overarching trend is clear: increasing the SRP’s permeability to water also increases the steady-state relative permeability of said fluid (up to 20 times). The reason for this is not obvious, higher SRP permeability should lead to higher displacement of the defending fluid, lower residual saturations, and thus, lower (not higher!) steady-state permeabilities. This leads us to believe that increasing the flow capability of the SRP also leads to the creation of enhanced percolation pathways that are persistent and remain connected throughout the sample, even at low water saturations. This phenomenon is consistent with experiments in mixed-wet porous media (AlRatrout et al., 2018) and somewhat analogous to thin-film flow in soils, where small amounts of water facilitate transport above the soil’s water table (Tokunaga and Wan, 1997; Lebeau and Konrad, 2010). This persistence of significant residual relative permeability to water has potentially important implications in the physics of soil drying (Or et al., 2013) and in hydrocarbon recovery from tight sandstone formations (Tian et al., 2019).
7 Impact of SRP on Dynamic Saturation Evolution
The presence of SRP has the following competing effects on the evolution of oil saturation within the sample during oil-flooding: 1) It increases the residual saturation of its wetting phase (be it oil or water) by acting as a fluid reservoir that “defends” itself against the non-wetting phase. 2) It decreases the residual saturation of the defending fluid phase by adding additional inter-pore connectivity and outflow routes (Mehmani and Prodanović, 2014). The balance between these two effects is dictated by the flow properties of the SRP.
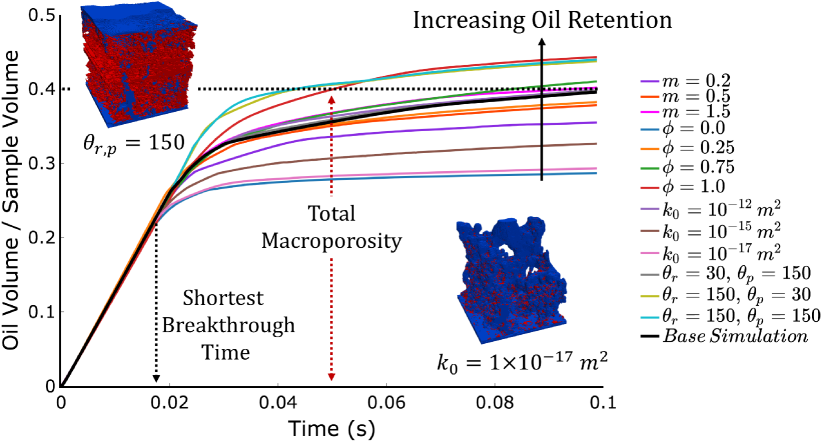
Figure 7 shows that fluid injection into the sample follows two characteristic behaviours: 1) An initial linear increase in saturation, where the slope is primarily dictated by the injection rate. 2) A non-linear plateauing slope dictated by the slow drainage of the defending fluid through the SRP and flow of the injected fluid into the SRP, which are influenced by the SRP’s flow properties. The transition point between these two primary flow mechanisms is dictated by the “breakthrough time”, the point at which the injected fluid first reaches the sample’s outlet boundary. The next two sections will leverage the information within the oil-flooding saturation curves in Figure 7 to study the effects of the SRP on the dynamic and static properties of these experiments.
7.1 Impact on Breakthrough Time
We now present a general ranking of the breakthrough times for oil flooding as a function of SRP properties obtained from the results in Figure 7 (and Figure SI2). The samples are well distributed around the standard base case and obey the following trends: The slowest breakthrough times correspond to cases with oil-wetting surface contact angles, where the oil explores more of the porous medium before reaching the outlet, in agreement with experimental observations of multiphase flow in bead-packs and micromodels with no SRP (Zhao et al., 2016; Hu et al., 2017). These are followed by the sample case with no SRP, where the reasoning is the same as above. Sample cases with a less water-wet SRP (decreasing ) or with lower SRP permeability or porosity further decrease the breakthrough times by limiting the ability of water to drain through the SRP, such that the oil explores less of the sample before reaching the outlet. Overall, our results show that oil breakthrough times are sensitive to SRP parameters () even though drainage occurs predominantly in the larger pores, a result that has potentially important implications in enhanced oil recovery and geologic CO2 sequestration.
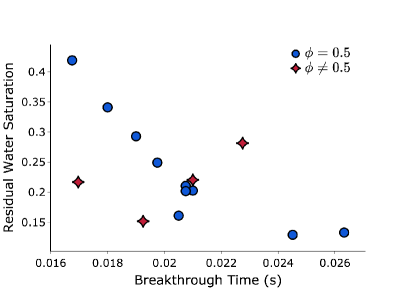
7.2 Impact on Residual Saturations
Finally, we observe in Figure 8 (and Fig. SI3) that residual water saturations are highly correlated with oil breakthrough times: samples with faster breakthrough times generally have higher residual water saturations at steady state. The reasoning behind this behaviour is very similar to the one developed to explain the difference in oil breakthrough times: if more residual defending fluid is present, the invading fluid explores less of the available space and hence travels through the sample more rapidly. Overall, this analysis indicates that SRP has a considerable impact on a sample’s residual saturations (), strongly implying that it should not be neglected during the design of subsurface fluid extraction and sequestration processes.
8 Conclusions
In this paper we studied the effects of XCT Sub-Resolution Porosity (SRP) on a rock’s absolute permeability, relative permeability, residual saturations, and fluid breakthrough times. Our results quantify how these four properties react to changes in the porosity, permeability, and wettability of the SRP. One notable finding is that SRP can function as a persistent connector between otherwise-isolated fluid clusters during multiphase flow, even at low saturations. These results were obtained from numerical simulations performed with our newly-developed Multiphase Micro-Continuum framework. To the best of our knowledge, this is the first two-phase flow model and study to take into account SRP without having to rely on a quasi-static assumption or simplified pore-network models.
As such, this investigation establishes a framework for performing two-phase flow simulations in digital rock systems that have two characteristic length-scales. Potential improvements to our methodology include the simulation of larger and more diverse rock samples, a very attainable task due to the current continuous and massive growth of high-performance computing. Finally, our results suggest potentially fruitful opportunities for future work aimed at quantifying the effects of SRP on upscaled capillary pressure curves, and broadening the investigated parameter space to different types of rocks involving different geometries, different amounts of SRP, and different SRP-induced connectivity. These avenues will more extensively test the conclusions presented in this study and lead the way towards greater understanding of multiscale rock physics and the development of more accurate and predictive upscaled permeability models.
Acknowledgements
This work was supported by the National Science Foundation, Division of Earth Sciences, Early Career program through Award EAR-1752982. F.J.C. was additionally supported by a Mary and Randall Hack ‘69 Research Award from the High Meadows Environmental Institute at Princeton University. C.S was sponsored by the French Agency for Research (Agence Nationale de la Recherche, ANR) through the labex Voltaire ANR-10-LABX-100-01 and the grant FraMatI ANR-19-CE05-0002. We do not report any conflicts of interest. The code for the computational model used in this manuscript is archived at https://doi.org/10.5281/zenodo.4013969 (Carrillo, 2020) and can also be found at https://github.com/Franjcf. The Estaillades Carbonate rock sample was obtained from Bultreys (2016) through the Digital Rock Portal.
9 Nomenclature
References
- Akbarabadi et al. (2017) Akbarabadi, M., S. Saraji, M. Piri, D. Georgi, and M. Delshad (2017). Nano-scale experimental investigation of in-situ wettability and spontaneous imbibition in ultra-tight reservoir rocks. Advances in Water Resources 107, 160–179.
- AlRatrout et al. (2018) AlRatrout, A., M. J. Blunt, and B. Bijeljic (2018). Wettability in complex porous materials, the mixed-wet state, and its relationship to surface roughness. Proceedings of the National Academy of Sciences of the United States of America 115(36), 8901–8906.
- Amaefule and Handy (1982) Amaefule, J. O. and L. L. Handy (1982). Effect of interfacial tensions on relative oil/water permeabilities of consolidated porous media. Society of Petroleum Engineers journal 22(3), 371–381.
- Apourvari and Arns (2014) Apourvari, S. N. and C. H. Arns (2014). An assessment of the influence of micro-porosity for effective permeability using local flux analysis on tomographic images. International Petroleum Technology Conference, 19-22 January, Doha, Qatar.
- Arbogast (1993a) Arbogast, T. (1993a). Gravitational forces in dual-porosity systems: I. Model derivation by homogenization. Transport in Porous Media 13(2), 179–203.
- Arbogast (1993b) Arbogast, T. (1993b). Gravitational forces in dual-porosity systems: II. Computational validation of the homogenized model. Transport in Porous Media 13(2), 205–220.
- Baker et al. (2012) Baker, D. R., L. Mancini, M. Polacci, M. D. Higgins, G. A. Gualda, R. J. Hill, and M. L. Rivers (2012). An introduction to the application of X-ray microtomography to the three-dimensional study of igneous rocks. Lithos 148, 262–276.
- Bauer et al. (2011) Bauer, D., S. Youssef, M. Han, S. Bekri, E. Rosenberg, M. Fleury, and O. Vizika (2011). From computed microtomography images to resistivity index calculations of heterogeneous carbonates using a dual-porosity pore-network approach: Influence of percolation on the electrical transport properties. Physical Review E 84(1), 1–12.
- Bear (1988) Bear, J. (1988). Dynamics of Fluids in Porous Media. Dover Civil and Mechanical Engineering Series. Dover.
- Beckingham et al. (2017) Beckingham, L. E., C. I. Steefel, A. M. Swift, M. Voltolini, L. Yang, L. M. Anovitz, J. M. Sheets, D. R. Cole, T. J. Kneafsey, E. H. Mitnick, S. Zhang, G. Landrot, J. B. Ajo-Franklin, D. J. DePaolo, S. Mito, and Z. Xue (2017). Evaluation of accessible mineral surface areas for improved prediction of mineral reaction rates in porous media. Geochimica et Cosmochimica Acta 205, 31–49.
- Békri et al. (1995) Békri, S., J. F. Thovert, and P. M. Adler (1995). Dissolution of porous media. Chemical Engineering Science 50(17), 2765–2791.
- Bennion and Bachu (2010) Bennion, D. B. and S. Bachu (2010). Drainage and imbibition CO2/brine relative permeability curves at reservoir conditions for carbonate formations. SPE Annual Technical Conference and Exhibition, Paper SPE 134028.
- Bijeljic et al. (2013) Bijeljic, B., A. Raeini, P. Mostaghimi, and M. J. Blunt (2013). Predictions of non-Fickian solute transport in different classes of porous media using direct simulation on pore-scale images. Physical Review E 87(1).
- Blunt et al. (2013) Blunt, M. J., B. Bijeljic, H. Dong, O. Gharbi, S. Iglauer, P. Mostaghimi, A. Paluszny, and C. Pentland (2013, jan). Pore-scale imaging and modelling. Advances in Water Resources 51, 197–216.
- Brackbill et al. (1992) Brackbill, J. U., D. B. Kothe, and C. Zemach (1992). A continuum method for modeling surface tension. Journal of Computational Physics 100(2), 335–354.
- Bultreys (2016) Bultreys, T. (2016). Estaillades carbonate 2. http://www.digitalrocksportal.org/projects/58.
- Bultreys et al. (2016) Bultreys, T., J. V. Stappen, T. D. Kock, W. D. Boever, M. A. Boone, L. V. Hoorebeke, and V. Cnudde (2016). Investigating the relative permeability behavior of microporosity-rich carbonates and tight sandstones with multiscale pore network models. Journal of Geophysical Research: Solid Earth 121(11), 7929–7945.
- Bultreys et al. (2015) Bultreys, T., L. Van Hoorebeke, and V. Cnudde (2015). Multi-scale, micro-computed tomography-based pore network models to simulate drainage in heterogeneous rocks. Advances in Water Resources 78, 36–49.
- Carrera et al. (1998) Carrera, J., X. Sánchez-Vila, I. Benet, A. Medina, G. Galarza, and J. Guinerà (1998). On matrix diffusion: Formulations, solution methods and qualitative effects. Hydrogeology Journal 6(1), 178–190.
- Carrillo (2020) Carrillo, F. J. (2020, mar). hybridPorousInterFoam.
- Carrillo and Bourg (2019) Carrillo, F. J. and I. C. Bourg (2019). A Darcy-Brinkman-Biot Approach to Modeling the Hydrology and Mechanics of Porous Media Containing Macropores and Deformable Microporous Regions. Water Resources Research 55(10), 8096–8121.
- Carrillo and Bourg (2021a) Carrillo, F. J. and I. C. Bourg (2021a). Capillary and viscous fracturing during drainage in porous media. Phys. Rev. E 103, 063106.
- Carrillo and Bourg (2021b) Carrillo, F. J. and I. C. Bourg (2021b). Modeling Multiphase Flow Within and Around Deformable Porous Materials: A Darcy‐Brinkman‐Biot Approach. Water Resources Research 57(2), e2020WR028734.
- Carrillo et al. (2020) Carrillo, F. J., I. C. Bourg, and C. Soulaine (2020). Multiphase Flow Modeling in Multiscale Porous Media: An Open-Source Micro-Continuum Approach. Journal of Computational Physics: X 8, 100073.
- Churcher et al. (1991) Churcher, P. L., P. R. French, J. C. Shaw, and L. L. Schramm (1991). Rock properties of Berea sandstone, Baker dolomite, and Indiana limestone. In SPE International Symposium on Oilfield Chemistry, pp. 431–446. Society of Petroleum Engineers.
- Cnudde and Boone (2013) Cnudde, V. and M. N. Boone (2013). High-resolution X-ray computed tomography in geosciences: A review of the current technology and applications. Earth-Science Reviews 123, 1–17.
- Dewers et al. (2012) Dewers, T. A., J. Heath, R. Ewy, and L. Duranti (2012). Three-dimensional pore networks and transport properties of a shale gas formation determined from focused ion beam serial imaging. International Journal of Oil, Gas and Coal Technology 5, 229–248.
- Diamantopoulos and Durner (2012) Diamantopoulos, E. and W. Durner (2012). Dynamic nonequilibrium of water flow in porous media: A review. Vadose Zone Journal 11, vzj2011.0197.
- Dong and Blunt (2009) Dong, H. and M. J. Blunt (2009). Pore-network extraction from micro-computerized-tomography images. Physical Review E 80(3), 1–11.
- Fan et al. (2020) Fan, M., J. E. McClure, R. T. Armstrong, M. Shabaninejad, L. E. Dalton, D. Crandall, and C. Chen (2020). Influence of Clay Wettability Alteration on Relative Permeability. Geophysical Research Letters 47(18), 1–10.
- Fatt (1956) Fatt, I. (1956). The network model of porous media. Petroleum Transactions, AIME 207, 144–181.
- Garfi et al. (2020) Garfi, G., C. M. John, Q. Lin, S. Berg, and S. Krevor (2020). Fluid Surface Coverage Showing the Controls of Rock Mineralogy on the Wetting State. Geophysical Research Letters 47(8), 1–9.
- Gjetvaj et al. (2015) Gjetvaj, F., A. Russian, P. Gouze, and M. Dentz (2015). Dual control of flow field heterogeneity and immobile porosity on non-Fickian transport in Berea sandstone. Water Resources Research 51(10), 8273–8293.
- Gouze et al. (2008) Gouze, P., Y. Melean, T. Le Borgne, M. Dentz, and J. Carrera (2008). Non-Fickian dispersion in porous media explained by heterogeneous microscale matrix diffusion. Water Resources Research 44(11).
- Guo et al. (2018) Guo, B., L. Ma, and H. A. Tchelepi (2018). Image-based micro-continuum model for gas flow in organic-rich shale rock. Advances in Water Resources 122, 70–84.
- Haggerty and Gorelick (1995) Haggerty, R. and S. M. Gorelick (1995, oct). Multiple‐Rate Mass Transfer for Modeling Diffusion and Surface Reactions in Media with Pore‐Scale Heterogeneity. Water Resources Research 31(10), 2383–2400.
- Han et al. (2020) Han, J., S. Han, D. H. Kang, Y. Kim, J. Lee, and Y. Lee (2020). Application of digital rock physics using X-ray CT for study on alteration of macropore properties by CO2 EOR in a carbonate oil reservoir. Journal of Petroleum Science and Engineering 189, 107009.
- Hashemi et al. (2021) Hashemi, L., M. Blunt, and H. Hajibeygi (2021). Pore-scale modelling and sensitivity analyses of hydrogen-brine multiphase flow in geological porous media. Nature News 11, 8348.
- Horgue et al. (2014) Horgue, P., M. Prat, and M. Quintard (2014). A penalization technique applied to the ”Volume-Of-Fluid” method: Wettability condition on immersed boundaries. Computers and Fluids 100, 255–266.
- Hu et al. (2017) Hu, R., J. Wan, Y. Kim, and T. K. Tokunaga (2017). Wettability effects on supercritical CO2-brine immiscible displacement during drainage: Pore-scale observation and 3D simulation. International Journal of Greenhouse Gas Control 60, 129–139.
- Huang et al. (2016) Huang, X., K. W. Bandilla, and M. A. Celia (2016). Multi-physics pore-network modeling of two-phase shale matrix flows. Transport in Porous Media 111, 123–141.
- Ioannidis and Chatzis (2000) Ioannidis, M. A. and I. Chatzis (2000). A Dual-Network Model of Pore Structure for Vuggy Carbonates. Proceedings of the Annual Symposium of the Society of Core Analysts.
- Isah et al. (2020) Isah, A., A. R. Adebayo, M. Mahmoud, L. O. Babalola, and A. El-Husseiny (2020). Drainage mechanisms in gas reservoirs with bimodal pores – a core and pore scale study. Journal of Natural Gas Science and Engineering 86, 103652.
- Issa (1986) Issa, R. I. (1986). Solution of the implicitly discretised fluid flow equations by operator-splitting. Journal of Computational Physics 62(1), 40–65.
- Javadpour (2009) Javadpour, F. (2009). Nanopores and apparent permeability of gas flow in mudrocks (shales and siltstone). Journal of Canadian Petroleum Technology 48(8), 16–21.
- Jiang et al. (2013) Jiang, Z., M. I. van Dijke, S. Geiger, D. Kronbauer, I. F. Mantovani, and C. P. Fernandes (2013). Impact of the spatial correlation of microporosity on fluid flow in carbonate rocks. Society of Petroleum Engineers - SPE Reservoir Characterisation and Simulation Conference and Exhibition, RCSC 2013: New Approaches in Characterisation andModelling of Complex Reservoirs 2, 637–646.
- Jiang et al. (2013) Jiang, Z., M. I. van Dijke, K. S. Sorbie, and G. D. Couples (2013). Representation of multiscale heterogeneity via multiscale pore networks. Water Resources Research 49(9), 5437–5449.
- Jiang et al. (2012) Jiang, Z., M. I. van Dijke, K. Wu, G. D. Couples, K. S. Sorbie, and J. Ma (2012). Stochastic Pore Network Generation from 3D Rock Images. Transport in Porous Media 94(2), 571–593.
- Joekar-Niasar and Hassanizadeh (2012) Joekar-Niasar, V. and S. M. Hassanizadeh (2012). Analysis of fundamentals of two-phase flow in porous media using dynamic pore-network models: A review. Critical Reviews in Environmental Science and Technology 42(18), 1895–1976.
- Johnson et al. (1959) Johnson, E. F., D. Bossler, and V. N. Bossler (1959, dec). Calculation of Relative Permeability from Displacement Experiments. Transactions of the AIME 216(01), 370–372.
- Kang et al. (2019) Kang, D. H., E. Yang, and T. S. Yun (2019). Stokes-Brinkman Flow Simulation Based on 3-D -CT Images of Porous Rock Using Grayscale Pore Voxel Permeability. Water Resources Research 55(5), 4448–4464.
- Kelly et al. (2016) Kelly, S., H. El-Sobky, C. Torres-Verdín, and M. T. Balhoff (2016). Assessing the utility of FIB-SEM images for shale digital rock physics. Advances in Water Resources 95, 302–316.
- Khishvand et al. (2016) Khishvand, M., A. H. Alizadeh, and M. Piri (2016). In-situ characterization of wettability and pore-scale displacements during two- and three-phase flow in natural porous media. Advances in Water Resources 97, 279–298.
- Knackstedt et al. (2006) Knackstedt, M. A., C. H. Arns, A. Ghous, A. Sakellariou, T. J. Senden, A. P. Sheppard, R. M. Sok, V. Nguyen, and W. V. Pinczewski (2006). 3D imaging and characterization of the pore space of carbonate core; implications to single and two phase flow properties. In SPWLA 47th Annual Logging Symposium, pp. 1–15. Society of Petrophysicists and Well-Log Analysts.
- Kohanpur and Valocchi (2020) Kohanpur, A. H. and A. J. Valocchi (2020). Pore-network stitching method: A pore-to-core upscaling approach for multiphase flow. Transport in Porous Media 135, 659––685.
- Lebeau and Konrad (2010) Lebeau, M. and J. M. Konrad (2010). A new capillary and thin film flow model for predicting the hydraulic conductivity of unsaturated porous media. Water Resources Research 46(1), 1–15.
- Maes and Soulaine (2019) Maes, J. and C. Soulaine (2019). A unified single-field Volume-of-Fluid-based formulation for multi-component interfacial transfer with local volume changes. Journal of Computational Physics 402, 109024.
- Márquez and Fich (2013) Márquez, S. and D. Fich (2013). An Extended Mixture Model for the Simultaneous Treatment of Short and Long Scale Interfaces. Ph. D. thesis, Universidad Nacional del Literal.
- Mehmani et al. (2020) Mehmani, A., S. Kelly, and C. Torres-Verdín (2020). Leveraging digital rock physics workflows in unconventional petrophysics: A review of opportunities, challenges, and benchmarking. Journal of Petroleum Science and Engineering 190, 107083.
- Mehmani and Prodanović (2014) Mehmani, A. and M. Prodanović (2014). The effect of microporosity on transport properties in porous media. Advances in Water Resources 63, 104–119.
- Mehmani et al. (2013) Mehmani, A., M. Prodanović, and F. Javadpour (2013). Multiscale, Multiphysics Network Modeling of Shale Matrix Gas Flows. Transport in Porous Media 99(2), 377–390.
- Moctezuma-Berthier et al. (2004) Moctezuma-Berthier, A., O. Vizika, J. F. Thovert, and P. M. Adler (2004). One- and two-phase permeabilities of vugular porous media. Transport in Porous Media 56(2), 225–244.
- Moslemipour and Sadeghnejad (2020) Moslemipour, A. and S. Sadeghnejad (2020). Dual-scale pore network reconstruction of vugular carbonates using multi-scale imaging techniques. Advances in Water Resources 147, 103795.
- Mousavi et al. (2013) Mousavi, M., M. Prodanovic, and D. Jacobi (2013). New classification of carbonate rocks for process-based pore-scale modeling. SPE Journal 18(2), 243–263.
- Noiriel and Soulaine (2021) Noiriel, C. and C. Soulaine (2021). Pore-scale imaging and modelling of reactive flow in evolving porous media: tracking the dynamics of the fluid-rock interface. Transport in Porous Media.
- Or et al. (2013) Or, D., P. Lehmann, E. Shahraeeni, and N. Shokri (2013). Advances in soil evaporation physics–A review. Vadose Zone Journal 12, vzj2012–0163.
- Peters (2009) Peters, C. A. (2009). Accessibilities of reactive minerals in consolidated sedimentary rock: An imaging study of three sandstones. Chemical Geology 265(1-2), 198–208.
- Petrovskyy et al. (2020) Petrovskyy, D., M. v. Dijke, Z. Jiang, and S. Geiger (2020). Phase connectivity in pore-network models for capillary-driven flow. Advances in Water Resources 147, 103776.
- Prodanović et al. (2014) Prodanović, M., A. Mehmani, and A. P. Sheppard (2014). Imaged-based multiscale network modelling of microporosity in carbonates. Geological Society, London, Special Publications 406(1), 95–113.
- Raeini et al. (2014) Raeini, A. Q., M. J. Blunt, and B. Bijeljic (2014). Direct simulations of two-phase flow on micro-CT images of porous media and upscaling of pore-scale forces. Advances in Water Resources 74, 116–126.
- Rücker et al. (2019) Rücker, M., W. B. Bartels, K. Singh, N. Brussee, A. Coorn, H. A. van der Linde, A. Bonnin, H. Ott, S. M. Hassanizadeh, M. J. Blunt, H. Mahani, A. Georgiadis, and S. Berg (2019). The Effect of Mixed Wettability on Pore-Scale Flow Regimes Based on a Flooding Experiment in Ketton Limestone. Geophysical Research Letters 46(6), 3225–3234.
- Ruspini et al. (2021) Ruspini, L. C., P. E. Øren, S. Berg, S. Masalmeh, T. Bultreys, C. Taberner, T. Sorop, F. Marcelis, M. Appel, J. Freeman, and et al. (2021). Multiscale digital rock analysis for complex rocks. Transport in Porous Media 2, 1573–1634.
- Sadeghnejad and Gostick (2020) Sadeghnejad, S. and J. Gostick (2020). Multiscale reconstruction of vuggy carbonates by pore-network modeling and image-based technique. SPE Journal 25, 253––267.
- Scheibe et al. (2015) Scheibe, T. D., W. A. Perkins, M. C. Richmond, M. I. McKinley, P. D. J. Romero-Gomez, M. Oostrom, T. W. Wietsma, J. A. Serkowski, and J. M. Zachara (2015). Pore-scale and multiscale numerical simulation of flow and transport in a laboratory-scale column. Water Resources Research 51(2), 1023–1035.
- Shabro et al. (2011) Shabro, V., C. Torres-Verdín, and F. Javadpour (2011). Numerical simulation of shale-gas production: From pore-scale modeling of slip-flow, Knudsen diffusion, and Langmuir desorption to reservoir modeling of compressible fluid. In Society of Petroleum Engineers - SPE Americas Unconventional Gas Conference 2011, UGC 2011, pp. 706–716. Society of Petroleum Engineers (SPE).
- Singh (2019) Singh, K. (2019). How Hydraulic Properties of Organic Matter Control Effective Liquid Permeability of Mudrocks. Transport in Porous Media 129(3), 761–777.
- Singh et al. (2018) Singh, K., H. Menke, M. Andrew, C. Rau, B. Bijeljic, and M. J. Blunt (2018). Data descriptor: Time-resolved synchrotron X-ray microtomography datasets of drainage and imbibition in carbonate rocks. Scientific Data 5(1), 1–8.
- Song and Kovscek (2015) Song, W. and A. R. Kovscek (2015). Functionalization of micromodels with kaolinite for investigation of low salinity oil-recovery processes. Lab Chip 15(16), 3314–3325.
- Song et al. (2021) Song, W., J. Yao, K. Zhang, H. Sun, and Y. Yang (2021). The impacts of pore structure and relative humidity on gas transport in shale: A numerical study by the image-based multi-scale pore network model. Transport in Porous Media 2, 1573–1634.
- Soulaine et al. (2021) Soulaine, C., L. Girolami, L. Arbaret, and S. Roman (2021). Digital Rock Physics: Computation of hydrodynamic dispersion. Oil and Gas Science and Technology 76, 51.
- Soulaine et al. (2016) Soulaine, C., F. Gjetvaj, C. Garing, S. Roman, A. Russian, P. Gouze, and H. A. Tchelepi (2016). The Impact of Sub-Resolution Porosity of X-ray Microtomography Images on the Permeability. Transport in Porous Media 113(1), 227–243.
- Soulaine et al. (2021) Soulaine, C., J. Maes, and S. Roman (2021). Computational microfluidics for geosciences. Frontiers in Water 3, 1–11.
- Soulaine et al. (2017) Soulaine, C., S. Roman, A. Kovscek, and H. A. Tchelepi (2017). Mineral dissolution and wormholing from a pore-scale perspective. Journal of Fluid Mechanics 827, 457–483.
- Soulaine et al. (2018) Soulaine, C., S. Roman, A. Kovscek, and H. A. Tchelepi (2018). Pore-scale modelling of multiphase reactive flow: application to mineral dissolution with production of. Journal of Fluid Mechanics 855, 616–645.
- Soulaine and Tchelepi (2016) Soulaine, C. and H. A. Tchelepi (2016). Micro-continuum Approach for Pore-Scale Simulation of Subsurface Processes. Transport in Porous Media 113(3), 431–456.
- Spanne et al. (1994) Spanne, P., J. F. Thovert, C. J. Jacquin, W. B. Lindquist, K. W. Jones, and P. M. Adler (1994). Synchrotron computed microtomography of porous media: Topology and transports. Physical Review Letters 73(14), 2001–2004.
- Suo et al. (2020) Suo, S., M. Liu, and Y. Gan (2020). An LBM-PNM framework for immiscible flow: With applications to droplet spreading on porous surfaces. Chemical Engineering Science 218, 115577.
- Tanino and Blunt (2012) Tanino, Y. and M. J. Blunt (2012). Capillary trapping in sandstones and carbonates: Dependence on pore structure. Water Resources Research 48(8), 8525.
- Tian et al. (2019) Tian, L., B. Feng, S. Zheng, D. Gu, X. Ren, and D. Yang (2019). Performance evaluation of gas production with consideration of dynamic capillary pressure in tight sandstone reservoirs. Journal of Energy Resources Technology 141, 022902.
- Tokunaga and Wan (1997) Tokunaga, T. K. and J. Wan (1997). Water film flow along fracture surfaces of porous rock. Water Resources Research 33, 1287–1295.
- van Genuchten (1980) van Genuchten, M. T. (1980). A Closed-form Equation for Predicting the Hydraulic Conductivity of Unsaturated Soils. Soil Science Society of America Journal 44(5), 892–898.
- Welch et al. (2017) Welch, N. J., F. Gray, A. R. Butcher, E. S. Boek, and J. P. Crawshaw (2017). High-Resolution 3D FIB-SEM Image Analysis and Validation of Numerical Simulations of Nanometre-Scale Porous Ceramic with Comparisons to Experimental Results. Transport in Porous Media 118(3), 373–392.
- Wenzel (1936) Wenzel, R. N. (1936). Resistance of solid surfaces to wetting by water. Industrial and Engineering Chemistry 28(8), 988–994.
- Whitaker (1986) Whitaker, S. (1986). Flow in porous media I: A theoretical derivation of Darcy’s law. Transport in Porous Media 1(1), 3–25.
- Whyman et al. (2008) Whyman, G., E. Bormashenko, and T. Stein (2008). The rigorous derivation of Young, Cassie-Baxter and Wenzel equations and the analysis of the contact angle hysteresis phenomenon. Chemical Physics Letters 450(4-6), 355–359.
- Wildenschild and Sheppard (2013) Wildenschild, D. and A. P. Sheppard (2013). X-ray imaging and analysis techniques for quantifying pore-scale structure and processes in subsurface porous medium systems. Advances in Water Resources 51, 217–246.
- Wu et al. (2019) Wu, Y., P. Tahmasebi, C. Lin, M. J. Munawar, and V. Cnudde (2019). Effects of micropores on geometric, topological and transport properties of pore systems for low-permeability porous media. Journal of Hydrology 575, 327–342.
- Xu et al. (2021) Xu, Z., M. Lin, W. Jiang, L. Ji, and G. Cao (2021). Rapid multiscale pore network modeling for drainage in tight sandstone. Journal of Petroleum Science and Engineering 204, 108682.
- Zhao et al. (2016) Zhao, B., C. W. MacMinn, and R. Juanes (2016). Wettability control on multiphase flow in patterned microfluidics. Proceedings of the National Academy of Sciences 113, 10251–10256.
- Zhao et al. (2017) Zhao, B., Y. Shang, L. Jin, and B. Jia (2017). Characterizing connectivity of multiscale pore structure in unconventional reservoirs by the complex network theory. OnePetro.
- Zou et al. (2018) Zou, S., R. T. Armstrong, J. Y. Arns, C. H. Arns, and F. Hussain (2018). Experimental and Theoretical Evidence for Increased Ganglion Dynamics During Fractional Flow in Mixed-Wet Porous Media. Water Resources Research 54(5), 3277–3289.