Learning Ideological Embeddings from Information Cascades
Abstract.
Modeling information cascades in a social network through the lenses of the ideological leaning of its users can help understanding phenomena such as misinformation propagation and confirmation bias, and devising techniques for mitigating their toxic effects.
In this paper we propose a stochastic model to learn the ideological leaning of each user in a multidimensional ideological space, by analyzing the way politically salient content propagates. In particular, our model assumes that information propagates from one user to another if both users are interested in the topic and ideologically aligned with each other. To infer the parameters of our model, we devise a gradient-based optimization procedure maximizing the likelihood of an observed set of information cascades. Our experiments on real-world political discussions on Twitter and Reddit confirm that our model is able to learn the political stance of the social media users in a multidimensional ideological space.
1. Introduction
The widespread adoption of social-media platforms has altered the landscape of societal debates in unprecedented ways: an immense amount of content is delivered to social-media users in their timelines, allowing them to quickly access information and participate in political discourse. However, with their algorithmically curated and virally propagating content, social-media platforms are suspected of contributing to the polarization of opinions by means of the so-called “echo chamber” effect, due to which users tend to interact with like-minded individuals, reinforcing their own ideological viewpoint (Bakshy et al., 2015; Garimella et al., 2018). Hence, understanding the interplay between the ideological leanings of social media users and the information they consume and propagate, is of crucial importance towards devising techniques for limiting misinformation, echo chambers, and for designing public information campaigns (Garimella et al., 2017; Aslay et al., 2018).
Therefore, modeling opinions and their dynamics in social media has attracted considerable interest in the last years. The bulk of the literature on opinion modeling (Del Vicario et al., 2017; Monti et al., 2020) and opinion mining (Barberá, 2015; Garimella et al., 2018; Wong et al., 2016) is however limited to analyze ideological leanings along a one-dimensional political spectrum, i.e., the traditional left-right spectrum, or country-specific axis (e.g., United States’ Democrat-Republican). Instead, political scientists have long noted that a single left-right axis assumption is inadequate for describing the existing variation in ideological profiles, and risks to ignore important distinctions between ideological groups (Davis et al., 1970; Eysenck, 1975). Only recently, opinion dynamics research has started to unveil the complex multidimensional nature of opinion formation (Baumann et al., 2020).
| Input | Output | |
| Item 1 | Item 2 | Polarity |
| 0.9 economy + | 0.9 economy + | on economy |
| 0.1 minorities | 0.1 minorities | |
 |
 |
 |
| Item 3 | Item 4 | Polarity |
| 0.1 economy + | 0.1 economy + | on minorities |
| 0.9 minorities | 0.9 minorities | |
 |
 |
 |
| = user, = user sharing an item | ||
 |
 |
 |
 |
 |
In this paper, combining ideas from different areas – i.e., network embeddings, information propagation, and opinion mining – we propose to learn ideological embeddings of social media users in a multidimensional ideological space from information cascades. To this end, we propose a stochastic propagation model, dubbed Multidimensional Ideology-aware Propagation (MIP) model, formalizing how politically salient content spreads in a social network as a function of the ideological embeddings of users under homophily-driven interactions. Our model assumes that information propagates from one node in a social network to another if both are interested in the topic and ideologically aligned with each other. Such a scenario can describe for instance information propagations in Twitter, where clusters of retweets have been found to correlate with the political leanings of users (Garimella et al., 2018; Barberá, 2015; Conover et al., 2011b; Cossard et al., 2020). Accordingly, the ideological embedding of a node is characterized by a topic distribution and polarity for each topic, in a multidimensional space defined by the input topics. As a result, our embeddings have the nice feature of being interpretable, and can be therefore used to make explainable predictions on unobserved behavior.
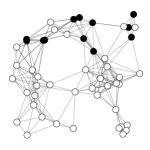
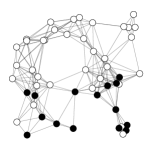
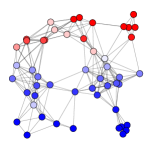
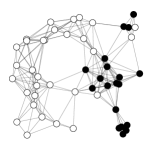
Figure 1 provides an abstraction of our proposal: the input to our model is the propagation of 4 items, each with a known topic distribution. These observations can be explained by the latent polarities of the users over each topic: in the right part of the figure we indicate the spectrum of polarities on the axis defined by the first topic with colors going from red to blue, and for the second axis from green to purple. These polarities are our output.
As a concrete example, consider the topics: “economy”, “emailgate”111“Emailgate” is the term coined by the media to refer to the controversy around Hillary Clinton’s use of a private email server for official public communications. This was used as an argument against her by her opponents in the 2016 U.S. elections., “foreign policy”, and “minority rights”. Assume that and are neighbors in a given network (e.g., they are “friends” or ”follow” each other) but they disagree on each of these topics. In this case, regardless of how much interested they are in these topics, any content coming from will hardly be further propagated by and vice versa. Alternatively, if and are aligned on “economy”, then propagation of content about this topic from, e.g., to will be likely, as long as is also exhibiting an interest in the topic.
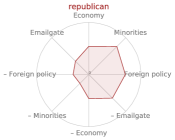
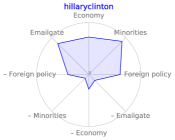
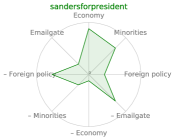
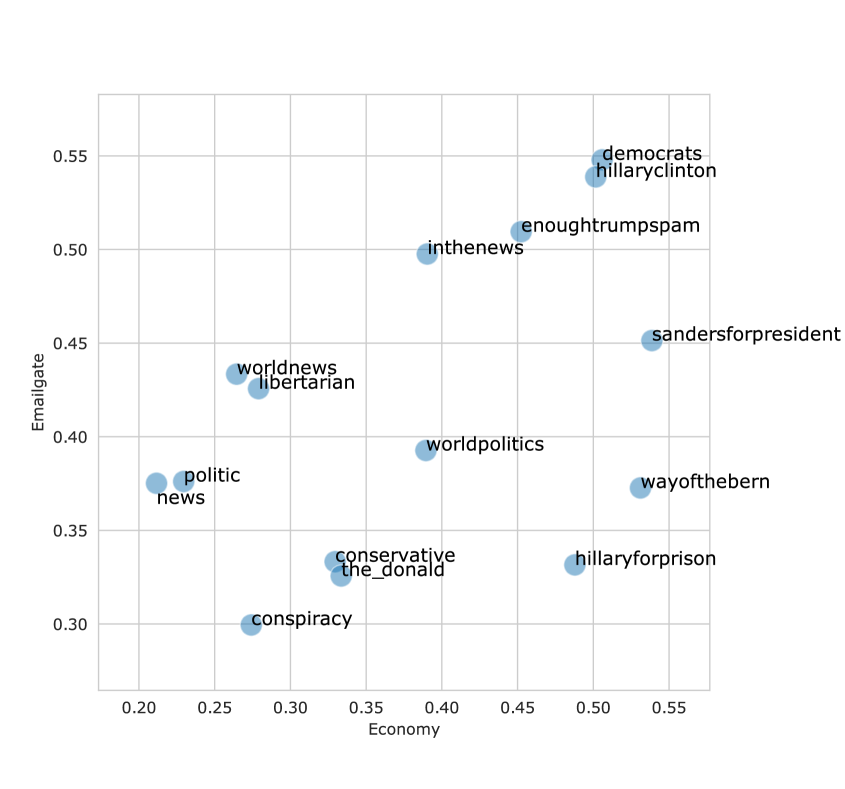
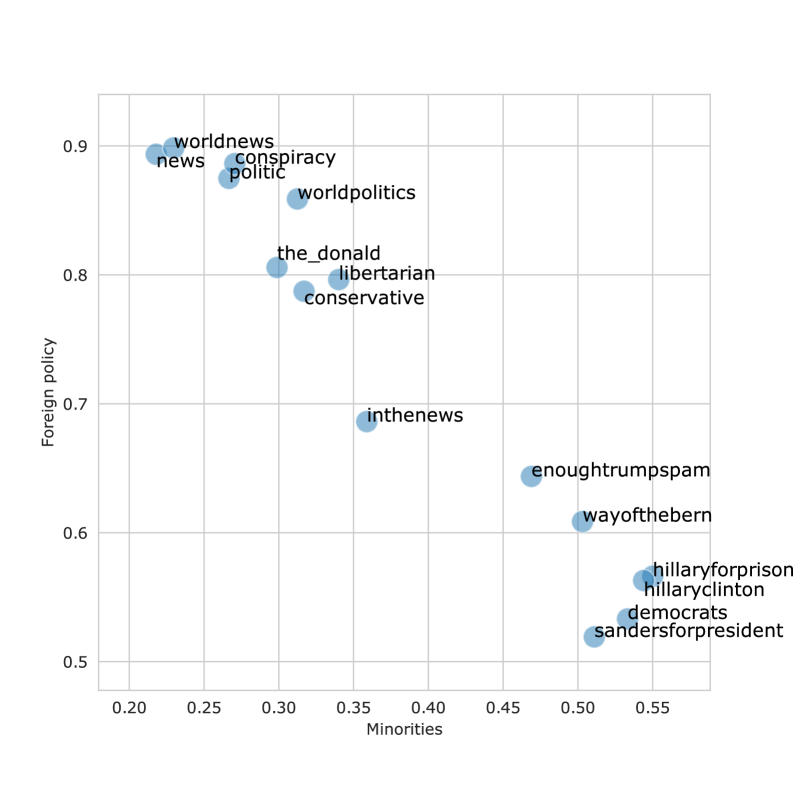
Notably, the joint explicit modeling of interest and ideological leaning eases the interpretability of nodes’ behavior and ultimately the explainability of propagation process. Figure 2 provides a preview of some of the results of our method on real-world Reddit data. In particular it reports the polarities learned for some popular subreddits related to 2016 election, along the four axes “economy”, “minorities”, “foreign policy”, and “emailgate”. The polarities modeled by our method correspond to expected ones for these subreddits: for instance, along the axis “emailgate”, the subreddit sandersforpresident is much closer to subreddits republican and the_donald than to subreddit hillaryclinton; while on “economy” subreddit hillaryclinton is closer to subreddit republican than to sandersforpresident.
Paper contributions and roadmap. The contributions of this paper can be summarized as follows:
Next section discusses the most relevant related literature.
2. Related work
Learning ideological leaning. Early studies tackling this problem treated it as a classification task and devised methods for predicting the binary political alignment of Twitter users (Conover et al., 2011a; Pennacchiotti and Popescu, 2011). Apart from the inherent limitation of one-dimensional political spectrum assumption common to all the existing approaches, Cohen and Ruths (2013) showed that another limitation arose from their need for large amounts of manually annotated data, and their dependence on politically active users. Some studies looked into content-aware analysis of users’ social interactions (Lu et al., 2015; Lahoti et al., 2018) as we do in our work: none of these approaches, however, exploits information propagation. In particular, with respect to Lahoti et al. (2018) our model is (i) multidimensional, since we jointly estimate ideological scores for multiple topics; (ii) based on information propagation rather than content; (iii) model-driven: our estimation algorithm stems from a principled model of how content propagate in a network.
A related research direction, topical stance detection (Dey et al., 2018; Du et al., 2017; Lin et al., 2019; Sun et al., 2018), aims at assigning a polarity label to a post towards a specific topic. We note that these models are only concerned with extracting topics and sentiments from a text corpora; instead, we characterize information propagation by looking at ideological embeddings.
Influence-driven propagation models. Barbieri et al. (2013b) introduced topic-aware social influence propagation models that take into account the topical interest profiles of the users and the topic distribution of the content that propagates in a social network. Topic-aware social influence modeling is crucial to accurately capture the propagation pattern of content in many applications, ranging from viral marketing and social advertising (Aslay et al., 2014, 2015; Aslay et al., 2017) to who-to-follow recommendations (Barbieri et al., 2014). However, for politically salient content, these models are not sufficient to correctly capture the propagation probabilities, as ideological alignment also plays a role.
Homophily-based models. Homophily is a well-known phenomenon is social networks: users tend to interact with users from the same social group (McPherson et al., 2001; Himelboim et al., 2013). As such, it is a common assumption in machine learning on social networks (Barbieri et al., 2013a; Garimella et al., 2018) and in propagation models (Del Vicario et al., 2017). In this work, we assume that information is more likely to propagate between nodes that, on a specific topic, share the same ideological views. While the validity of this assumption depends on the specific context and action (replies, follows, etc), it is in general well supported by the current literature. In the case of Twitter, retweets – the act of resharing a piece of content – have been shown to follow this pattern very closely: when a user retweets, it is likely that they share the same ideological background with the source regarding that specific topic (Garimella et al., 2018). For example, Conover et al. (2011b) found that retweets about U.S. politics had odds ratios higher than one for intra-partisan interactions and lower than for cross-partisan interactions. Lai et al. (2019) analyzed users involved in the debate about the 2016 referendum on the reform of the Italian Constitution on Twitter, and found that 98.6% of retweets happen between users with the same stance on this topic. However, this assumption is very general, and it has shown its validity in many other contexts, from blogs (Adamic and Glance, 2005) to Facebook (Schmidt et al., 2018).
Interpretable embeddings. We leverage this idea to produce interpretable ideological embeddings. Literature on graph embeddings is vast; we refer to Goyal and Ferrara (2018) for a review. However, most of the techniques from this area offer embeddings that are sub-symbolic, lacking a precise, natural language explanation (Škrlj et al., 2020). For instance, Feng et al. (2018) devised a technique to learn embeddings from information cascades: however, their embeddings are not directly interpretable; they do not attempt to model polarities, topics, or opinions. Some works have tried to deal with the problem of interpretability in graph embeddings. For instance, Idahl et al. (2019) use an external knowledge base to find interpretable subspaces in a given node embedding space. Mehta et al. (2019) implement the stochastic block model as a graph neural networks to learn an interpretable embedding for community detection.
To the best of our knowledge, our work is the first to devise an inference algorithm able to extract interpretable embeddings from information cascades; it is also the first to provide a data-driven model for the interplay between topic-aware opinions and information propagation on social media.
3. Model
In this section, we present the Multidimensional Ideology-aware Propagation Model (MIP for short). The model embodies the following set of assumptions:
-
(1)
Nodes share items, and each item spans a variety of topics.
-
(2)
Each topic corresponds to an ideological axis, where each node could be placed.
-
(3)
Nodes adopt the same behavior of the nodes they follow on each item, as long as they agree with each other on the topics of that item.
These assumption are general, they combine aspects from previous works, and are easily applicable to real-world data, as seen in Sec. 2. We next formalize these assumptions in a probabilistic framework.
Information cascades. We consider a directed social graph where and denote the set of nodes and edges, respectively, and a directed edge represents being a follower of . As such, receives in their timeline the pieces of content (we call them items) shared by and can be influenced by to share further, thus allowing the propagation of information. We use the term “sharing” here in a loose sense, i.e., to represent any action which is likely to express an alignment with the original node, following the assumptions outlined at the beginning of this section. For example, a retweet on Twitter or a like on Facebook. We denote the set of all items as . We represent the action of node sharing an item at time with a triplet , and call such a triplet an activation. We assume that no node adopts the same item more than once, that is, if a node shares an item , it becomes active on that item, and it will stay so forever. In this way, we can focus on observing whether supports item or not, and ignore the subtleties regarding multiple sharing behavior; moreover, in some contexts (e.g. a like on Facebook) an activation can happen at most once by definition.
We use to denote the set of activations observed and to refer to the set of nodes that became active on (i.e, the cascade of item ).
Likelihood of a set of cascades. Our approach relies on modeling the set of observed activations as a result of the stochastic process governed by a set of latent factors that span over a multidimensional space, representing the ideological tendencies of each node. By assuming that each cascade is independent from the others, the likelihood of can be expressed as , where in turn we can devise as
| (1) |
Here, is the ordered set of all in-neighbors of in cascade . In other words, the likelihood of a cascade is given by the probability of obtaining the successful and failed activations. The dependency on for modeling the activation probability is fundamental here: resharing an item depends on those who have already shared that item. In other words, node is exposed to by the nodes followed by that shared before. We consider as activations only those such that ; that is, we ignore the initiator of a cascade, as we are only interested in modeling propagation.
Multidimensional ideological space. The core of our approach is then the proper definition of so that it reflects the intuition that activations only happen within the context of ideological alignment. Since items have different topics which span a low-dimensional space, we assume that
-
•
an individual only adopts an item if it matches a topic of interest for them,
-
•
besides interest, an action is only likely to happen if there is an ideologically alignment on that topic between the individual and the other individuals who shared the item before.
These concepts are reflected in the specification of the model parameters and consequently in the definition of the activation probability as follows. First, we assume that each item exhibits a multinomial distribution over topics (dimensions), where represents the relevance of item to topic . A node can exhibit an interest on topic with probability . The parameter set represents how much is interested in each of the topics. Note that, in principle, a node might even be interested in all the considered topics, as well as in none of them.
Finally, each of the topics defines an ideological axis: given a topic , we assume that can exhibit either positive or negative leaning within the context of that topic. The terms “positive” and “negative” only indicate that the leanings are opposing each other. We model the probability of node exhibiting positive leaning on topic as and the probability of negative leaning as .
The parameter set represents the set of all polarities, i.e., alignment probabilities for each topic relative to , and therefore it defines the position of in the multidimensional ideological space defined by the topics. We can then express the probability that node is ideologically aligned with on topic as
| (2) |
where is the probability that both nodes exhibit positive leaning on dimension and, by contrast, is the probability that they exhibit negative leaning. Using this topic-specific alignment probability , we define
| (3) |
to be the probability that will activate on item given that their predecessor already did. In other words, there must be a topic picked from the topic distribution of the item such that (i) is of interest to , and (ii) is ideologically aligned on with .
Now, we express the probability that a node becomes active on as a mixture over all possible activators
| (4) |
The term here represent a prior probability that causes an activation in . As such, it must respect ; for instance, it can be the uninformative prior . In general, this term adds additional flexibility to our model, by allowing for a pre-defined relevance for . For example, it can be used to model bias towards popular nodes, or the initiators of the cascade.
MIP generative model. We can devise a simple generative stochastic process for data generation that adheres to the aforementioned assumptions. First, we introduce the hyper-parameters that govern such a generative process. We define to control the polarization of the nodes’ opinions: high values of lead to polarity which are closer to the extremes (i.e., being closer to or ); lower values lead to polarities closer to neutrality (i.e., being closer to ). We also define and to control the generated distribution of the interests. Finally, we define as the prior distribution of the topics of items. Then, given an underlying graph , we take the following steps to generate a propagation dataset.
Within the main loop each active node tries to activate its neighbors, and the process stops when no further nodes become active. For simplicity, we presented the model assuming that each active node has an equal chance of activating its neighbors: this corresponds to assuming a uniform prior within Eq. 4.
4. Inference and Learning
Our goal is to have an algorithm that given a set of items represented in a -dimensional topic space, is able to estimate the interests and the polarities of each node—that is, our ideological embeddings. We do so by maximizing the likelihood of our model w.r.t. , given all and .
We can easily see the problem of maximizing the likelihood we defined in the previous section as a learning problem, in which we predict whether a certain node will activate or not. To obtain a scalable learning algorithm, we would like to treat each possible propagation of an item from to as an independent example. To do so, we resort to an approximation of the likelihood in Eq. 1. First, for the active users, we notice that, by Jensen inequality:
By virtue of this inequality, we can consider the prior as a predefined sampler that selects users from and approximates the activation probability according to them. In practice, we can focus on a subset of predefined potential activators, and measure the probability of alignment to them.
Different choices of which nodes to sample suit different contexts. For example, considering only the first activator is appropriate in some real cases, where the ideological alignment is likely to happen mostly between the creator of the item and whoever adopts it, more than between followers. In our algorithm, however, we wish to treat as equal every pair among those that reshared an item . This assumption comes from the empirical observation that political communities tend to form groups with a high homophily, often described as echo chambers (Del Vicario et al., 2016); these appear in retweet networks as clusters with a homogeneous opinion (Garimella et al., 2018; Barberá, 2015; Conover et al., 2011b; Cossard et al., 2020). Therefore, we expect aligned nodes to activate collectively – i.e., if is aligned with a neighbor who shared , they are also probably aligned with another neighbor who shared the same item.
Based on this practical consideration, we further choose to approximate the negative terms as
As a matter of fact, since ideological communities tend to be homogenous, then if is not aligned with a neighbor who shared , we expect them in practice to be unaligned with all their neighbors who shared the same item. This approximation allows us first to better learn from real-world propagations, clustering together users who reshared an item and separate those who did not. Secondly, it allows us to factorize the likelihood and hence to obtain a scalable algorithm. We can therefore rewrite the overall log-likelihood as
Thanks to this approximation, we can employ stochastic gradient descent in the following way. The basic instance of the learning problem is an example where and iff and otherwise, given that . In other words, from the topic distribution of an item and one of the nodes active on it, we try to predict whether one of its followers will activate or not. Then, given a sequence of examples sampled from the set of observed activations , maximizing the likelihood is equivalent to minimizing the log loss of each example:
where is the likelihood of a single example given the latent variables and .
Input: ; items with topics , activations . Output: Polarities and interests for all .
The learning procedure is outlined in Algorithm 1. In real data sets, non-activated nodes largely outnumber the activated ones for a given item. For this reason, we use negative undersampling (line 8) to reduce the number of negatives. In practice, we undersample negative examples at random so that they are two times the number of positives. In experiments, this implies an average precision of in expectation when predictions are performed randomly.
We also found that considering a random sample of of fixed size (line 4) seems to work well in practice. For gradient descent, we employed AdaGrad (Duchi et al., 2011) with a linearly decreasing learning rate (stopping at ) to avoid undesirable local minima.
| Num. items | AUC ROC | Avg. Prec. |
|---|---|---|
| 1000 | 0.570 | 0.497 |
| 10000 | 0.754 | 0.717 |
| 100000 | 0.826 | 0.797 |
| Num. items | AUC ROC | Avg. Prec. |
|---|---|---|
| 1000 | 0.607 | 0.543 |
| 10000 | 0.773 | 0.733 |
| 100000 | 0.840 | 0.815 |
| AUC ROC | Avg. Prec. | |
|---|---|---|
| 1 | 0.609 | 0.530 |
| 4 | 0.754 | 0.717 |
| 16 | 0.889 | 0.870 |
| AUC ROC | Avg. Prec. | |
|---|---|---|
| 1 | 0.601 | 0.534 |
| 4 | 0.773 | 0.733 |
| 16 | 0.884 | 0.857 |
5. Experimental Assessment
We conduct an extensive empirical evaluation of the proposed model and the inference algorithm on synthetic and real-world datasets. Our goal is to answer to the following research questions:
- •
-
•
RQ2. Are the predictions from our algorithm explainable? More precisely: are the embeddings inferred by our algorithm from a real-world scenario interpretable and meaningful, compared to well-known facts about ideological positioning of political groups? (Section 5.2)
-
•
RQ3. In real-world scenarios, can ideological embeddings be used to predict unobserved behavior? How does their predictive power compare to less interpretable state-of-the-art embeddings? (Section 5.3)
In order to foster reproducibility, we publicly release all the data and code necessary to reproduce our experiments.222https://github.com/corradomonti/ideological-embeddings
5.1. Experiments on synthetic data
To answer the first question, we wish to verify that our inference algorithm can make correct predictions whenever activations follow the assumptions outlined in Section 3. To this end, we conduct experiments on multiple synthetic datasets in which activations are generated according to our model. We show that Algorithm 1, despite the approximations we assumed to make it scalable, is consistent with the generative process proposed in Section 3. Furthermore, we study under which conditions the predictions made by the algorithm are accurate: it turns out that polarization affects greatly its accuracy, as does the number of items; the topology of the underlying graph, instead, seems to have less impact.
Experimental setting. In all our experiments, we consider the items as divided into training (%) and test (%) sets. We run our inference algorithm on the training set to estimate the values of the variables and which are then used to compute the likelihood of activations in the test set. In particular, we consider the following prediction task: given that a node has activated on an item with topic distribution , what is the probability that node will also activate on item ?
To generate the synthetic dataset, we follow the procedure described in Section 3 with the following hyper-parameters. We set topics. We set and , in order to have a high () probability of users having topic-aware interests greater than . As a prior for items, we set for all the topics. We use two different graphs , both with nodes: (i) a complete graph, with density ; (ii) a graph generated by the Barabási-Albert network model, with and density .
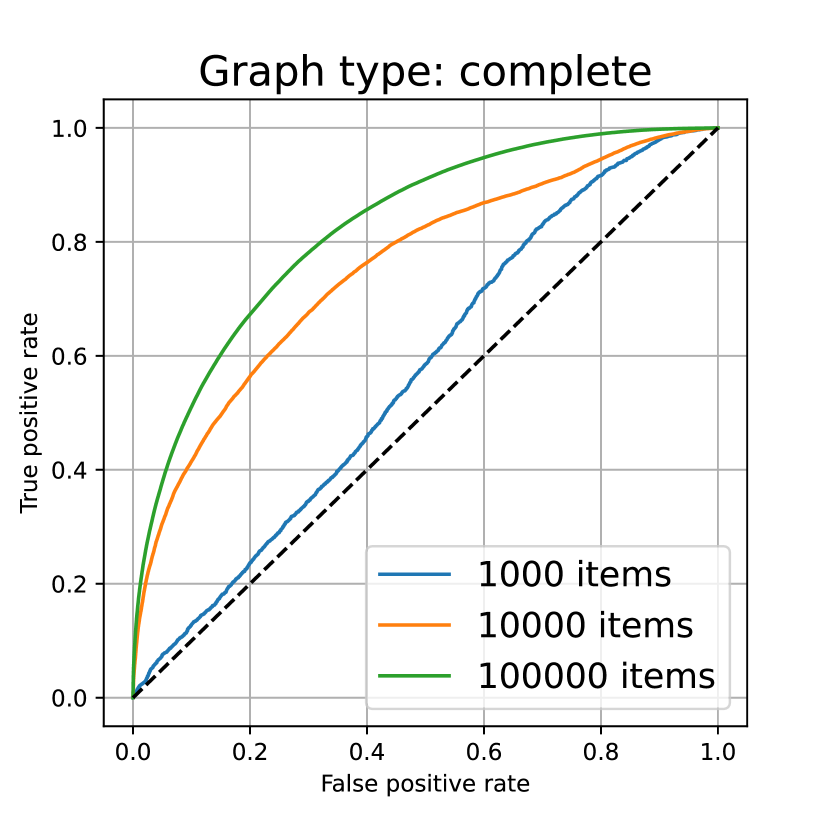
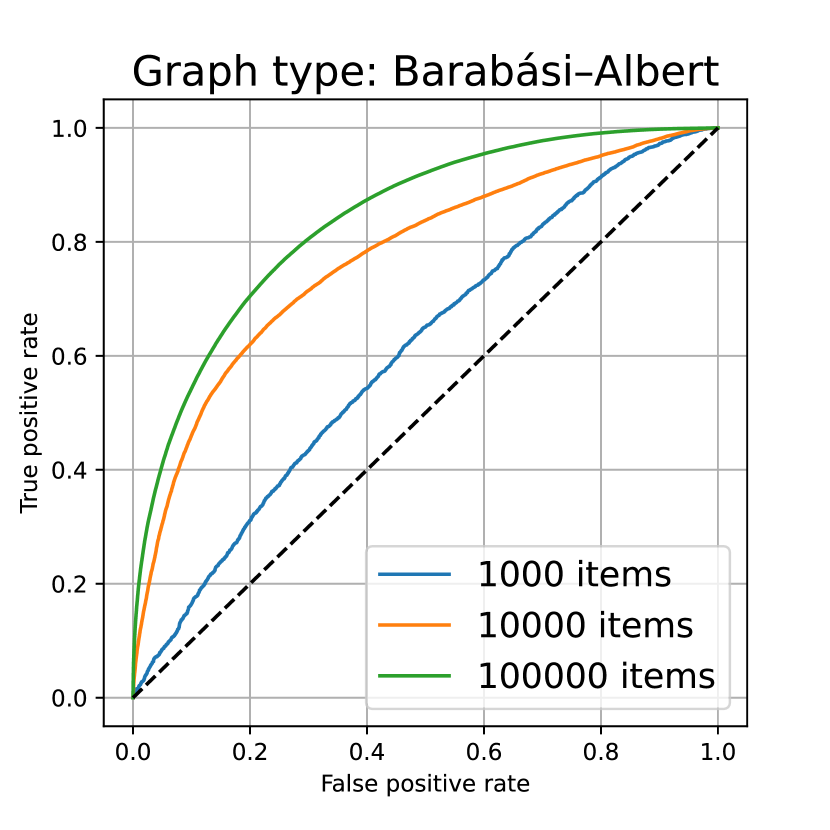
Results. We first compare the accuracy of the inference process when varying the number of items propagated through the network. To this end, we set and perform inference with , items. We report the results in Fig. 3(a) and 3(b). As expected, the inference accuracy increases with the number of items since every new item introduces a new cascade to the sample, improving the accuracy of parameter estimations. Surprisingly, the results are similar for both the complete graph and the Barabási-Albert network model, suggesting that the topology does not seem to affect the performance of our algorithm.
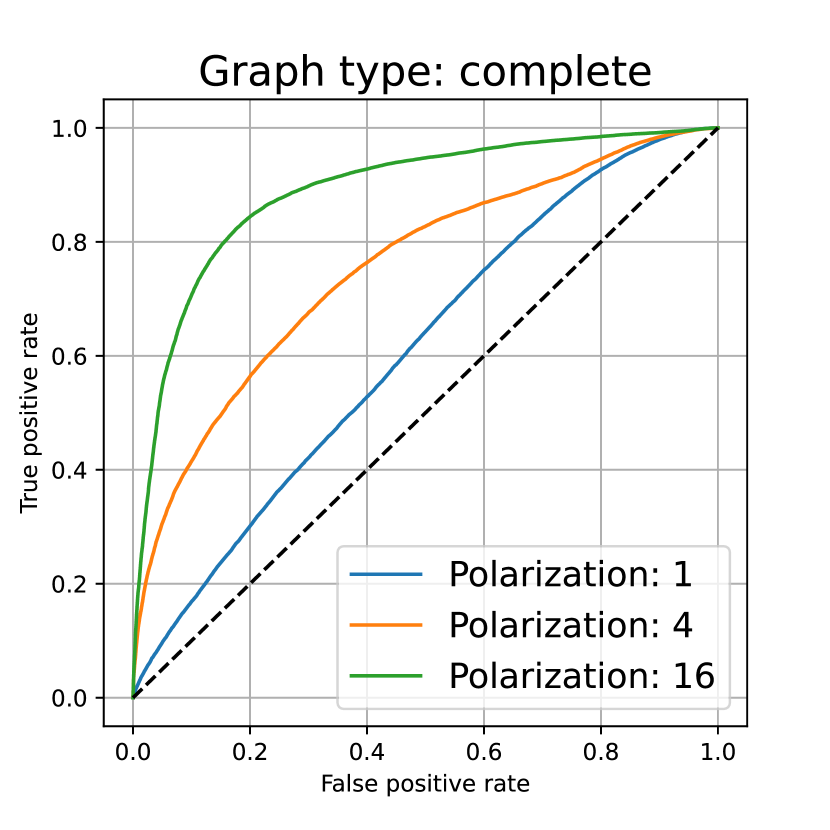
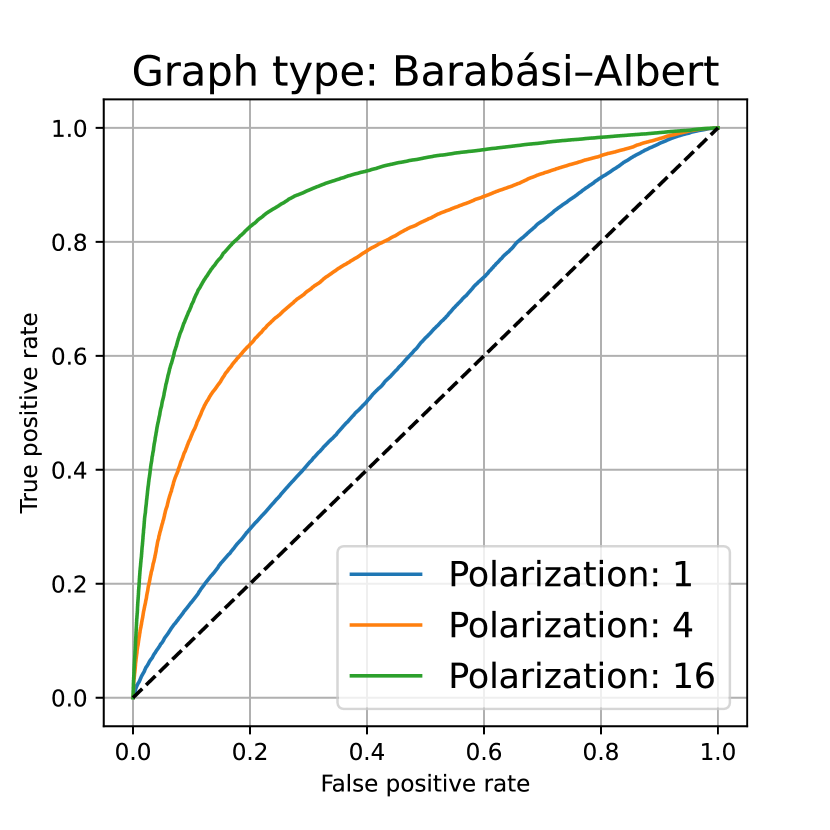
We then measure the inference accuracy with regards to the distribution on the polarization of the individuals. To this end, we set and perform inference on the datasets generated by setting the hyper-parameter . We report the results in Fig. 3(c) and 3(d). We can clearly see that our inference algorithm performs better in highly polarized scenarios (i.e., higher values of ) when items induce great controversy. This result shows that more polarized nodes lead to different behavior in the propagation of the content, making it easier for the inference algorithm to distinguish the leaning of the nodes. As a result, we see that the polarization has a profound effect on the quality of the estimations. Overall, we can conclude that our inference algorithm is effective in estimating polarities and interests in order to make predictions about new unseen activations.
5.2. Interpretable Embeddings
In this section, we answer RQ2, that is: are the predictions made by our algorithm explainable? Or, in other words, is our algorithm able to extract interpretable embeddings when applied to a real-world dataset? Is the interpretation of those embeddings in line with known facts about a real world dataset? We operationalize these questions by employing a dataset based on well-studied (Massachs et al., 2020; Soliman et al., 2019; Mills, 2018) communities from Reddit. We will show how the embeddings we find correspond to known political positions of these communities. We refer to Section 5.3 for an analysis of the predictive power of such embeddings.
Reddit dataset. The real-world dataset we consider in this part is extracted by crawling the social news aggregation website Reddit. Here, we aim at capturing how different Reddit communities (subreddits) share political news items. In fact, we focus on subreddits as nodes, while we ignore individual users: in this way, we can use their known political position as a validation of the interpretability of our embeddings.
To this end, we interpreted an item to be a specific URL posted on Reddit. Each subreddit community is a node that can propagate (i.e. post) an item. We consider subreddits as nodes of a complete graph (i.e., each subreddit can reshare news from all the others). We say that a node is activated on an item when the URL that corresponds to item is posted on the subreddit .
We identified subreddit communities that are most similar to r/politics (the main community for U.S. politics) in terms of their cosine similarity over users.We then collected the URLs that have been shared by at least of these subreddits between the years and , obtaining a set of items.
We are therefore assuming that this dataset fits the assumptions we outlined at the beginning of Section 3: i.e., each posted item spans a variety of topics; subreddits share an item already shared on another subreddit if they are interested in it and if the two communities are aligned on the topics of that specific item.
| Subreddit | Economy |
|---|---|
| libertarian | 0.278960 |
| the_donald | 0.333547 |
| hillaryclinton | 0.501605 |
| democrats | 0.505838 |
| wayofthebern | 0.531154 |
| sandersforpresident | 0.538688 |
| Subreddit | Foreign policy |
|---|---|
| sandersforpresident | 0.519180 |
| democrats | 0.533123 |
| hillaryclinton | 0.562925 |
| wayofthebern | 0.608667 |
| libertarian | 0.796325 |
| the_donald | 0.805734 |
| Subreddit | Minorities |
|---|---|
| the_donald | 0.298800 |
| libertarian | 0.340077 |
| wayofthebern | 0.503109 |
| sandersforpresident | 0.511015 |
| democrats | 0.533224 |
| hillaryclinton | 0.544002 |
| Subreddit | Emailgate |
|---|---|
| the_donald | 0.325649 |
| wayofthebern | 0.372663 |
| libertarian | 0.425686 |
| sandersforpresident | 0.451363 |
| hillaryclinton | 0.538760 |
| democrats | 0.547866 |
Ideological axes. To define the ideological axes of our model we explored the dataset using doc2vec (Le and Mikolov, 2014). We trained the doc2vec algorithm using the titles of the posts associated to each considered URL in our dataset. Then, we used the soft K-means clustering algorithm (Kim et al., 2007) to group the obtained doc2vec vectors into clusters. We then defined the topic distribution as the soft assignment of item to the clusters. We found meaningful results with this method for . A textual representation of these topics is shown in Table 1. We observed that the identified topics are well differentiated, allowing to provide intuitive naming as follows: economy, Emailgate, foreign policy, campaigning, and minorities’ rights. These five topics are evenly distributed in the data.
Economy World, America, Tax, Americans, Income, American Emailgate Emails, Dnc, Russian, Campaign, Email, Foundation Foreign policy Nsa, War, Syria, Government, Russian, Cia Campaign Democrats, Vote, Party, Democratic, Why, Poll Minorities Police, Muslim, Man, Black, Year, Video
In order to evaluate how explainable are the predictions made by our algorithm, and therefore how interpretable are the embeddings we find, we investigate how well the polarities estimated from the content that the nodes’ propagate reflect known political leanings of each subreddit333To reach the best possible representation, we used the full reddit dataset, and we re-run our model times and picked the outcome that obtained the largest likelihood.. Given that the topics we identified (Table 1) fairly represent different axes of the U.S. political debate and divisions, we expect these divisions to be reflected in the estimated embeddings. To do so, we focus in this analysis on the most active subreddits, reflecting discussions to support a U.S. politician or political party. The political positions typically expressed in these subreddit are well-known and have been analyzed in the literature (Massachs et al., 2020; Soliman et al., 2019; Roozenbeek and Palau, 2017; Hendricks and Schill, 2017). These include, among the others:
-
•
democrats, subreddit affiliated to the U.S. Democratic Party.
-
•
the_donald, a subreddit (now banned) dedicated to supporters of Republican president Donald Trump.
-
•
sandersforpresident and wayofthebern are both communities of supporters of Bernie Sanders, democratic candidate in 2016 and 2020 primary elections. While the former subreddit is official, the second one was created by supporters after Sanders lost the primary election in 2016, in opposition to Hillary Clinton and the Democratic Party establishment.
-
•
libertarian is a community focused on libertarianism, close but not affiliated to the U.S. Libertarian Party.
 Algorithm
AUC ROC
Difference
Avg. Precision
Time (s)
Our MIP model
7.1
Barbera model
6.4
Original inf. + Topics
10.1
Original information
9.5
node2vec, d=128
11.6
node2vec + Topics, d=128
14.5
node2vec + Topics, d=11
8.7
node2vec, d=11
7.3
Algorithm
AUC ROC
Difference
Avg. Precision
Time (s)
Our MIP model
7.1
Barbera model
6.4
Original inf. + Topics
10.1
Original information
9.5
node2vec, d=128
11.6
node2vec + Topics, d=128
14.5
node2vec + Topics, d=11
8.7
node2vec, d=11
7.3
Results. We first consider the topics economy, minorities rights, and Emailgate due to the ease in their interpretability and their similarity with axis identified as divisive in the 2016 elections (i.e. economy, identity issues, and anti-establishment disaffection (Drutman, 2017)). We report the estimated polarities for each of these topics in both the plots and the tables of Figure 4.
On the “economy” ideological axis, we see that the most extreme positions among the aforementioned subreddits are filled by libertarian on one side and Bernie Sanders’ on the other. This accurately represent the deep division between the pro-business libertarian ideology and the more pro-welfare ideas of democrats (Drutman, 2017), and even more with the socialist ideas of Bernie Sanders supporters (Mills, 2018). the_donald correctly appears to be on the same side of the axis as libertarians. On the minorities’ rights ideological axis, instead, we found that the_donald lies on one extreme, democrats on the other, while libertarian have more moderate views. These reflects common readings of the positions of these groups on the economical axis (Drutman, 2017). On the “Emailgate” axis, the divisions reflect how different communities perceived the controversy: in particular, the_donald (together with conspiracy and hillaryforprison) lies on the very extreme end of the spectrum, while democrats on the other. libertarians on this axis are very separated from the_donald. It is known that Donald Trump has been using extensively the so-called Emailgate controversy to attack Hillary Clinton, while the Democratic Party defended her; Libertarians did not attack Clinton on the topic444https://www.washingtonpost.com/news/post-politics/wp/2016/07/07/libertarian-rivals-wont-attack-clinton-over-emails/. These positions are all well-represented in our ideological embeddings. Moreover, we find a separation between wayofthebern, created in opposition with Hillary Clinton’s victory of the 2016 primaries, and democrats: the former lies in the middle on the issue, while the latter is in the most extreme spot. Their embeddings in this axis, again, echo known facts from the literature that studied these communities: the_donald and conspiracy pushed these accusations, while wayofthebern occasionally “[tried] to leverage the dual valence of the deep state frame – appealing to the older, more general anti-national-security-establishment frame – even as the frame continues to do work on the right” (Benkler et al., 2018). Moreover, these findings reflect survey measurements on anti-establishment disaffection between Clinton and Sanders supporters (Drutman, 2017). Finally, beside these three axes, we find that the foreign policy axis is highly correlated with the minorities’ rights one. This matches with previous observations from political surveys (Baumann et al., 2020).
We summarize some of these examples in Figure 2; there, we visualize the position of a subreddit on an axis by indicating its rank among the considered subreddits on that axis. From these examples, this evaluation shows how our representation of nodes in multidimensional ideological space can provide an intuitive and interpretable representation of the opinion and beliefs of each node.
5.3. Prediction accuracy on real-world data
 Algorithm
AUC ROC
Difference
Avg. Precision
Time (s)
Our MIP model
83.1
node2vec, d=11
480.5
node2vec + Topics, d=128
561.7
node2vec + Topics, d=11
485.3
node2vec, d=128
523.1
Original inf. + Topics
985.7
Original information
965.4
Barbera model
75.9
Algorithm
AUC ROC
Difference
Avg. Precision
Time (s)
Our MIP model
83.1
node2vec, d=11
480.5
node2vec + Topics, d=128
561.7
node2vec + Topics, d=11
485.3
node2vec, d=128
523.1
Original inf. + Topics
985.7
Original information
965.4
Barbera model
75.9
Our final goal is to check whether our inference algorithm is able to capture the real-world activation dynamics and to make accurate predictions on unseen cascades. In order to evaluate the tradeoff between explainability and predictive power, we compare our model with the following representative popular baselines:
- node2vec (Grover and Leskovec, 2016)::
-
we define a weighted graph by considering an arc for each instance of “node activates on an item after node ”. Then, we embed this graph using the node2vec algorithm into a representation of the same dimension as our ideological space, i.e. dimensions (corresponding to and ). The idea is to check whether the resulting embedding is capable of summarizing the same information provided by our embeddings. We also perform the same experiments with embedding dimension , usually employed in literature (Goyal and Ferrara, 2018). After computing these embeddings, we train a logistic regression classifier on the Hadamard product of the embeddings, as suggested by Grover and Leskovec (2016). We remark that, despite node2vec being one of the most popular and well-performing graph embeddings (Goyal and Ferrara, 2018), the results it provides are not directly interpretable (Škrlj et al., 2020).
- Barbera’s model (Barberá, 2015)::
-
the goal of this algorithm is to embed nodes of a given graph into a one-dimensional bipolar ideological spectrum (e.g. left-right) which models homophily and divergence. We apply it on the same activation graph defined for node2vec. This model is usually applied to networks, and it is not specific to information cascades. Also, it provides weaker representation capabilities, since its output falls in the mono-axis opinion mining line of research discussed in Section 2.
- Original information::
-
for this approach, we do not use any embedding. We train a logistic classifier directly on a one-hot encoding representation of and (i.e., in dimensions, a much larger space than the ones we use for embeddings). The classifier is given the concatenated one-hot representations of a pair of nodes and it is trained to predict whether that pair of nodes correspond to a successful propagation. The approach is therefore not scalable for very large graphs, and we use it as a naive baseline.
Since our model leverages the topic distribution of each item as input, we also tested baselines using the same information, by concatenating the topic distribution of each item to each input vector of the logistic regression models (node2vec, original information). Barbera’s model, instead, does not offer an immediate way to use this kind of information.
To train and evaluate each algorithm, we divided the dataset in 10 folds by splitting independent items into equally sized groups. We used the first two folds as a validation set to tune the parameters of node2vec, and . We chose the best parameters according to the average AUC ROC in these two folds. Then, we used the remaining folds in cross-validation to assess results. The evaluation is performed on two datasets, namely the Reddit dataset previously described, and a Twitter dataset we describe in detail next.
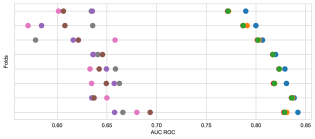
Prediction results on Reddit. Figure 5 reports a comparison of the results obtained on the Reddit dataset. On this dataset, our approach results substantially in line with state-of-the-art. Moreover, on each single fold it consistently outperforms the baselines (Difference column in Figure 5). In practice, the richness and interpretability of our embeddings, illustrated in the previous section, do not come at the expense of predictive power. The explicit modeling of polarities on ideological axes still enables, in fact, useful predictions of unobserved behavior. Notably, on this network node2vec falls significantly below all the other baselines.
Prediction results on Twitter. We then proceed to evaluating our predictive performance on a larger dataset representing Twitter resharing behavior in a polarized setting. For the construction of this dataset, we considered the accounts of Twitter users extracted by Cossard et al. (2020), along with all their posted tweets. These users have mainly posted about Italian politics hence are in the same weakly connected component of a retweet network. We consider as potential propagations all the instances of user retweeting a tweet after user . We manually selected hashtags related to public political opinions to be used as topics: three politicians (#Salvini, #DiMaio, #Renzi) and three debates (#Vaccini, #Migranti, #Tav). We constructed the dataset from the tweets that contain these hashtags. From this subset, we iteratively removed users and tweets with fewer cascades, so that every Twitter user in the dataset has at least 100 retweets and every retweet has been shared by at least 10 users. This way, we obtained the final dataset with Twitter users and retweets.
We define the topic distribution of each item simply by counting the appearances of hashtags as follows. Denoting as the set of selected hashtags and as the set of selected hashtags mentioned by tweet , we define the topic distribution of tweet as and otherwise.
The retweet graph, built according to the procedure illustrated in the previous section and needed by node2vec, exhibits an extremely high () density. In order to make it tractable by node2vec, we have to filter out all edges representing a number of retweets less than the average (), thus obtaining a final density of .
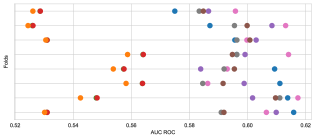
Figure 6 reports the results of the evaluation. This dataset seems noisy and difficult to predict, but still our model is able to recover some information: we measure an average AUC ROC () significantly higher than the simpler baselines “original information” and Barbera’s model. We conjecture that considering different ideological axes in a meaningful way is essential in predicting behavior in such a dataset, confirming that it respects the general assumptions of our model. In sharp contrast with the previous dataset, node2vec is instead the best performing model, essentially tied to our approach (their AUC ROCs are within one standard deviation from each other). We highlight, however, the clear advantage of our model in terms of computing time, beside its interpretability.
These two datasets show that our model is able to combine the interpretability of simpler models on smaller datasets with the prediction accuracy of state-of-the-art embeddings on larger ones.
6. Conclusions and Future Work
In this paper, taking an information-propagation standpoint, we introduce ideological embeddings, i.e., the mapping of the ideological leanings of social media users in a multidimensional ideological space. To this end, we propose a stochastic propagation model, which formalizes how politically salient content spreads in a social network as a function of the ideological embeddings of users under homophily-driven interactions, and we devise a scalable gradient-based optimization procedure to learn the ideological embeddings that maximize an approximation of the likelihood of a set of information cascades.
We show through experiments on real-world as well as synthetic datasets, that the learnt ideological embeddings are coherent with our model, that they are interpretable, and that they can offer reliable and explainable predictions of unseen behavior.
In general, our framework can aid studies on how polarizing content spreads on social networks: since controversy and confirmation bias are important elements of misinformation spread, our model could help to get a better understanding of the topics that are prone to misinformation. However, we do not claim that our model is in general the best way to predict unobserved behavior in information cascades: its performance relies on the validity of its assumptions to a particular context. Instead, it provides a novel angle to the problem, able to turn raw information cascades into an interpretable embedding with user-defined axes.
Under this perspective it could be extended to adapt to other contexts, or to test different assumptions. For instance, modeling replies on Twitter instead of retweets would need a different set of assumptions because of their different characteristics in terms of homophily (Lai et al., 2019). Since replies can be antagonizing, propagation can be driven by either alignment or misalignment. Another direction is to extend our framework to jointly infer the ideological leanings of social media users and content (by directly modeling items’ polarity as latent variables), as well as the axes of the ideological space and the underlying topic distribution.
Acknowledgments
CM and FB acknowledge support from Intesa Sanpaolo Innovation Center. GM acknowledges support from the EU H2020 ICT48 project ”HumanE-AI-Net” under contract #952026. The funders had no role in study design, data collection and analysis, decision to publish, or preparation of the manuscript.
References
- (1)
- Adamic and Glance (2005) Lada A Adamic and Natalie Glance. 2005. The political blogosphere and the 2004 US election: divided they blog. In Procs. Int. Work. on Link Discovery. 36–43.
- Aslay et al. (2014) Çigdem Aslay, Nicola Barbieri, Francesco Bonchi, and Ricardo Baeza-Yates. 2014. Online Topic-aware Influence Maximization Queries. In EDBT Conf. 295–306.
- Aslay et al. (2017) Çigdem Aslay, Francesco Bonchi, Laks V. S. Lakshmanan, and Wei Lu. 2017. Revenue Maximization in Incentivized Social Advertising. Proc. VLDB Endow. 10, 11 (2017), 1238–1249.
- Aslay et al. (2015) Çigdem Aslay, Wei Lu, Francesco Bonchi, Amit Goyal, and Laks V. S. Lakshmanan. 2015. Viral Marketing Meets Social Advertising: Ad Allocation with Minimum Regret. Proc. VLDB Endow. 8, 7 (2015), 822–833.
- Aslay et al. (2018) Cigdem Aslay, Antonis Matakos, Esther Galbrun, and Aristides Gionis. 2018. Maximizing the Diversity of Exposure in a Social Network. In IEEE ICDM Conf. 863–868.
- Bakshy et al. (2015) Eytan Bakshy, Solomon Messing, and Lada Adamic. 2015. Exposure to Ideologically Diverse News and Opinion on Facebook. Science (2015).
- Barberá (2015) Pablo Barberá. 2015. Birds of the Same Feather Tweet Together: Bayesian Ideal Point Estimation Using Twitter Data. Political Analysis 23, 1 (2015), 76–91.
- Barbieri et al. (2013a) Nicola Barbieri, Francesco Bonchi, and Giuseppe Manco. 2013a. Cascade-based community detection. In WSDM Conf. 33–42.
- Barbieri et al. (2013b) Nicola Barbieri, Francesco Bonchi, and Giuseppe Manco. 2013b. Topic-Aware Social Influence Propagation Models. Knowledge and information systems 37, 3 (2013), 555–584.
- Barbieri et al. (2014) Nicola Barbieri, Francesco Bonchi, and Giuseppe Manco. 2014. Who to follow and why: link prediction with explanations. In ACM SIGKDD Conf. 1266–1275.
- Baumann et al. (2020) Fabian Baumann, Philipp Lorenz-Spreen, Igor M Sokolov, and Michele Starnini. 2020. Emergence of polarized ideological opinions in multidimensional topic spaces. Physical Review X (2020).
- Benkler et al. (2018) Yochai Benkler, Robert Faris, and Hal Roberts. 2018. Network propaganda: Manipulation, disinformation, and radicalization in American politics. Oxford University Press.
- Cohen and Ruths (2013) R. Cohen and D. Ruths. 2013. Classifying political orientation on Twitter: It’s not easy!. In ICWSM Conf.
- Conover et al. (2011b) Michael Conover, Jacob Ratkiewicz, Matthew Francisco, Bruno Goncalves, Filippo Menczer, and Alessandro Flammini. 2011b. Political polarization on twitter. In ICWSM Conf.
- Conover et al. (2011a) Michael D Conover, Bruno Gonçalves, Jacob Ratkiewicz, Alessandro Flammini, and Filippo Menczer. 2011a. Predicting the political alignment of twitter users. In Int. Conf. on Social Computing. 192–199.
- Cossard et al. (2020) Alessandro Cossard, Gianmarco De Francisci Morales, Kyriaki Kalimeri, Yelena Mejova, Daniela Paolotti, and Michele Starnini. 2020. Falling into the echo chamber: the italian vaccination debate on twitter. In ICWSM Conf. 130–140.
- Davis et al. (1970) Otto A Davis, Melvin J Hinich, and Peter C Ordeshook. 1970. An expository development of a mathematical model of the electoral process. American political science review 64, 2 (1970), 426–448.
- Del Vicario et al. (2017) Michela Del Vicario, Antonio Scala, Guido Caldarelli, H Eugene Stanley, and Walter Quattrociocchi. 2017. Modeling confirmation bias and polarization. Scientific reports 7, 1 (2017), 1–9.
- Del Vicario et al. (2016) Michela Del Vicario, Gianna Vivaldo, Alessandro Bessi, Fabiana Zollo, Antonio Scala, Guido Caldarelli, and Walter Quattrociocchi. 2016. Echo chambers: Emotional contagion and group polarization on facebook. Scientific reports 6 (2016), 37825.
- Dey et al. (2018) Kuntal Dey, Ritvik Shrivastava, and Saroj Kaushik. 2018. Topical Stance Detection for Twitter: A Two-Phase LSTM Model Using Attention. In ECIR Conf.
- Drutman (2017) Lee Drutman. 2017. Political Divisions in 2016 and Beyond. Voter Study Group (2017).
- Du et al. (2017) Jiachen Du, Ruifeng Xu, Yulan He, and Lin Gui. 2017. Stance Classification with Target-specific Neural Attention. In IJCAI Conf. 3988–3994.
- Duchi et al. (2011) John Duchi, Elad Hazan, and Yoram Singer. 2011. Adaptive subgradient methods for online learning and stochastic optimization. Journal of Machine Learning Research 12 (2011).
- Eysenck (1975) Hans J Eysenck. 1975. The Structure of Social Attitudes. British Journal of Social and Clinical Psychology 14, 4 (1975), 323–331.
- Feng et al. (2018) S. Feng, G. Cong, A. Khan, X. Li, Y. Liu, and Y. M. Chee. 2018. Inf2vec: Latent Representation Model for Social Influence Embedding. In ICDE Conf. 941–952.
- Garimella et al. (2018) K. Garimella, G. De Francisci Morales, A. Gionis, and M. Mathioudakis. 2018. Quantifying Controversy on Social Media. ACM Trans. on Social Computing 1, 1 (2018).
- Garimella et al. (2017) K. Garimella, A. Gionis, N. Parotsidis, and N. Tatti. 2017. Balancing Information Exposure in Social Networks. In NIPS Conf.
- Goyal and Ferrara (2018) Palash Goyal and Emilio Ferrara. 2018. Graph embedding techniques, applications, and performance: A survey. Knowledge-Based Systems 151 (2018), 78–94.
- Grover and Leskovec (2016) Aditya Grover and Jure Leskovec. 2016. node2vec: Scalable feature learning for networks. In ACM SIGKDD Conf.
- Hendricks and Schill (2017) John Allen Hendricks and Dan Schill. 2017. The social media election of 2016. The 2016 US Presidential Campaign (2017), 121–150.
- Himelboim et al. (2013) Itai Himelboim, Stephen McCreery, and Marc Smith. 2013. Birds of a feather tweet together: Integrating network and content analyses to examine cross-ideology exposure on Twitter. Journal of Computer-Mediated Communication 18, 2 (2013), 154–174.
- Idahl et al. (2019) Maximilian Idahl, Megha Khosla, and Avishek Anand. 2019. Finding interpretable concept spaces in node embeddings using knowledge bases. In ECMLPKDD Conf. 229–240.
- Kim et al. (2007) Jaehwan Kim, Kwang-Hyun Shim, and Seungjin Choi. 2007. Soft geodesic kernel k-means. In ICASSP’07.
- Lahoti et al. (2018) Preethi Lahoti, Kiran Garimella, and Aristides Gionis. 2018. Joint Non-Negative Matrix Factorization for Learning Ideological Leaning on Twitter. 351–359.
- Lai et al. (2019) Mirko Lai, Marcella Tambuscio, Viviana Patti, Giancarlo Ruffo, and Paolo Rosso. 2019. Stance polarity in political debates: A diachronic perspective of network homophily and conversations on Twitter. Data & Knowledge Engineering 124 (2019).
- Le and Mikolov (2014) Quoc Le and Tomas Mikolov. 2014. Distributed representations of sentences and documents. In ICML. 1188–1196.
- Lin et al. (2019) Junjie Lin, Qingchao Kong, Wenji Mao, and Lei Wang. 2019. A topic enhanced approach to detecting multiple standpoints in web texts. Information Sciences 501 (2019), 483–494.
- Lu et al. (2015) H. Lu, J. Caverlee, and W. Niu. 2015. Biaswatch: A Lightweight System for Discovering and Tracking Topic-Sensitive Opinion Bias in Social Media. In ACM CIKM Conf.
- Massachs et al. (2020) Joan Massachs, Corrado Monti, Gianmarco De Francisci Morales, and Francesco Bonchi. 2020. Roots of Trumpism: Homophily and Social Feedbackin Donald Trump Support on Reddit. In Int. Conf. on Web Science. 49–58.
- McPherson et al. (2001) Miller McPherson, Lynn Smith-Lovin, and James M Cook. 2001. Birds of a feather: Homophily in social networks. Annual review of sociology 27, 1 (2001), 415–444.
- Mehta et al. (2019) Nikhil Mehta, Lawrence Carin Duke, and Piyush Rai. 2019. Stochastic blockmodels meet graph neural networks. In ICML Conf. 4466–4474.
- Mills (2018) Richard A Mills. 2018. Pop-up political advocacy communities on reddit. com: SandersForPresident and The Donald. AI & SOCIETY 33, 1 (2018), 39–54.
- Monti et al. (2020) Corrado Monti, Gianmarco De Francisci Morales, and Francesco Bonchi. 2020. Learning Opinion Dynamics From Social Traces. In ACM SIGKDD Conf. 764–773.
- Pennacchiotti and Popescu (2011) Marco Pennacchiotti and Ana-Maria Popescu. 2011. Democrats, republicans and starbucks afficionados: user classification in twitter. In ACM SIGKDD Conf.
- Roozenbeek and Palau (2017) Jon Roozenbeek and Adrià Salvador Palau. 2017. I read it on reddit: Exploring the role of online communities in the 2016 us elections news cycle. In Int. Conf. on Social Informatics. 192–220.
- Schmidt et al. (2018) Ana Lucía Schmidt, Fabiana Zollo, Antonio Scala, Cornelia Betsch, and Walter Quattrociocchi. 2018. Polarization of the Vaccination Debate on Facebook. Vaccine 36, 25 (2018), 3606–3612.
- Škrlj et al. (2020) Blaž Škrlj, Matej Martinc, Jan Kralj, Nada Lavrač, and Senja Pollak. 2020. tax2vec: Constructing interpretable features from taxonomies for short text classification. Computer Speech & Language 65 (2020), 101104.
- Soliman et al. (2019) Ahmed Soliman, Jan Hafer, and Florian Lemmerich. 2019. A characterization of political communities on reddit. In HT’19. 259–263.
- Sun et al. (2018) Qingying Sun, Zhongqing Wang, Qiaoming Zhu, and Guodong Zhou. 2018. Stance Detection with Hierarchical Attention Network. In COLING Conf. 2399–2409.
- Wong et al. (2016) Felix Ming Fai Wong, Chee Wei Tan, Soumya Sen, and Mung Chiang. 2016. Quantifying Political Leaning from Tweets, Retweets, and Retweeters. IEEE TKDE 28, 8 (2016), 2158–2172.