Quasi-harmonic temperature dependent elastic constants: applications to silicon, aluminum, and silver
Abstract
We present ab-initio calculations of the quasi-harmonic temperature dependent elastic constants. The isothermal elastic constants are calculated at each temperature as second derivatives of the Helmholtz free energy with respect to strain and corrected for finite pressure effects. This calculation is repeated for a grid of geometries and the results interpolated at the minimum of the Helmholtz free energy. The results are compared with the quasi-static elastic constants. Thermodynamic relationships are used to derive the adiabatic elastic constants that are compared with the experimental measurements. These approaches are implemented for cubic solids in the thermo_pw code and are validated by applications to silicon, aluminum, and silver.
-
December 2019
1 Introduction
Elastic constants (ECs) characterize the mechanical and thermodynamic behaviors of materials. They determine the speed of sound, the crystal stability, and allow the calculation of properties such as the thermal expansion (TE) or the thermal stresses. They have also practical applications as, for instance, the prediction of seismic properties of materials, a basic information to probe the interior of planets in geophysics [1].
First-principles calculations of the ECs [2] help to interpret experiments and might be useful complements at extreme conditions of temperature and pressure that are difficult or impossible to realize in laboratory. Density Functional Theory (DFT) has been employed for several decades to estimate the ECs of materials and usually provides values that are within 10% of the experiments [3, 4, 5, 6, 7, 8].
Temperature might have a not negligible effect on ECs, nevertheless DFT calculations are usually limited to zero temperature ( K) since a significant computational effort is necessary to evaluate the ECs including both temperature and quantum effects. In the literature there are two main approaches based on lattice dynamics and the computation of the phonon dispersions of solids. In the quasi-static approximation (QSA) temperature dependent ECs (TDECs) are computed assuming that temperature produces only a TE. At each temperature the ECs are calculated at the geometry that minimizes the Helmholtz free energy but the ECs themselves are calculated as second derivatives of the DFT total energy with respect to strain or from the derivative of the stress with respect to strain (at K). For instance, Y. Wang et al. computed the TDECs of seven cubic metals [9] and S-L. Shang et al. [10] computed TDECs of - and -Al2O3 within the QSA. K. Kádas et al. [11] used the same approximation for the TDECs of -beryllium deriving the temperature dependence of the volume from the Debye model. Within the second approach, which is based on the quasi-harmonic approximation (QHA), the ECs are calculated from second derivatives of the Helmholtz free energy with respect to strain and can be calculated at the temperature dependent geometry. This approximation has been applied for instance to the TDECs of MgO [12, 13], hexagonal close-packed (h.c.p.) beryllium and cubic and h.c.p. diamond [14], -iron [15] and Fe3Ga alloys [16]. Recently, M. Destefanis et al. [17] computed TDECs for the Forsterite mineral using the QHA.
In this paper we present our implementation of TDECs in the thermo_pw code [18], a driver of Quantum ESPRESSO [19, 20] routines for the calculation of the thermodynamic properties of solids. This code has been used for the K elastic constants of beryllium [21], the thermodynamic properties of h.c.p. metals rhenium, technetium, [22] ruthenium, and osmium [23] and recently to account for anharmonic contributions to the mean square atomic displacements within the QHA [24] 111 Further tests are reported in the supplementary material: we show the computed K ECs of indium, TiO2 rutile, -Al2O3.. We implemented TDECs both within the QSA and the QHA. The latter can be calculated at a single reference geometry or for a set of reference geometries and further interpolated at the temperature dependent geometry.
We validate our implementation by studying the TDECs of three elemental solids: silicon with the diamond structure and the face-centered cubic metals aluminum and silver 222Moreover in the supplementary material we check our method by computing the TDECs of MgO within the QHA and by comparing our results with those of Refs. [12, 13].. Derivatives of the Helmholtz free energy give the isothermal ECs, while usually experiments measure the adiabatic ECs. We calculate the latter through thermodynamic relationships and find good agreement with the available experiments. The low temperature ECs ( K for silicon, K for aluminum and silver) are within from experimental values for both QSA and QHA. Increasing temperature, the QHA gives almost the same percentage change as the experiment while the QSA gives a somewhat smaller softening.
Finally we tested the accuracy of our TDECs by comparing the TE computed using mode-Grüneisen parameters that depend on the TDECs through the bulk modulus with the TE obtained by differentiation of the temperature dependent lattice constant which we take as a reference. We find that the two methods are in good agreement when using the QHA TDECs, while some differences are introduced by the QSA. In the literature the TE is usually evaluated from mode-Grüneisen parameters, using temperature independent ECs (for instance the K ECs) since this approach is numerically more efficient than the differentiation of the crystal parameters especially in anisotropic solids. We computed the TE also within this approximation finding reasonable agreement with the reference but discrepancies larger than those obtained by the QHA or the QSA TDECs.
2 Theory
We consider a crystal deformed with a symmetric strain , where and are Cartesian coordinate indices. To maintain the solid in a strained configuration, forces have to be applied in order to balance those exerted by the solid. These forces per unit area give the stress tensor which, for small strains, is proportional to the strain:
| (1) |
where are the components of the ECs tensor. Equivalently:
| (2) |
At K the ECs can be written also as the second derivatives of the energy with respect to strain:
| (3) |
where is the volume of the reference system and is the DFT total energy. If the reference geometry minimizes the energy (the equilibrium condition) , while for a reference geometry in which a pressure is acting on the solid (in this paper we do not consider the possibility of having a generic stress on the solid) and differ and we have [25]:
| (4) |
Eqs. 2 and 4 provide two equivalent ways to compute the stress-strain ECs at K.
In cubic solids and in Voigt notation (see for instance chapter VIII of [26]) the ECs tensor has the following form:
| (5) |
with three independent ECs, , , and (a dot indicates a zero entry).
From Eq. 3 the total energy (at K) contains a term quadratic in the strain:
| (6) |
In order to derive the three independent ECs we use the following strains:
| (7) | ||||
The strain does not change the shape of the cubic cell, while transforms it into a tetragonal cell and into a rhombohedral cell.
Since the tensor has the form as in Eq. 5, applying Eq. 6 we obtain for each strain the following relationships:
| (8) | ||||
We compute the ECs by fitting these equations with polynomials and taking the analytic second derivatives.
In order to introduce zero-point quantum effects and temperature, we can use the same formulation by replacing in Eq. 3 the total energy with the Helmholtz free energy :
| (9) |
The Helmholtz free energy is the sum of the total energy and the vibrational free energy (neglecting the electronic contribution): . The latter is given by:
| (10) | |||||
where the sums are over the phonon modes identified by wave-vectors in the first Brillouin zone and mode indices . indicates the phonon frequencies, the volume of the reference unit cell, the Boltzmann constant, the Planck constant divided by , the absolute temperature and the number of unit cells in the solid. The first term on the right-hand side is the zero-point energy while the second is the vibrational contribution at finite temperature.
Within the QHA the phonon frequencies depend on the applied strain . In the QHA calculation at fixed reference geometry the phonon dispersions and free energies are computed at different strained configurations. For each temperature the free energy-strain function is fitted with polynomials whose second derivatives at zero strain give the ECs of Eq. 9. In general the reference configuration is not at the minimum of the Helmholtz free energy so there is a pressure and we correct the with the generalization of Eq. 4 at finite temperature in order to obtain the . Finally we call QHA TDECs those obtained by performing QHA calculations on a few fixed reference geometries and interpolating the at each temperature at the geometry that minimizes the Helmholtz free energy. In other works (see for instance [15]) the QHA ECs are evaluated with a slightly different procedure. First for each type of strain the Helmholtz free energy is fitted by a polynomial in a grid of the lattice constants and strain values and then the ECs are calculated as second derivatives of the Helmholtz free-energy with respect to the strain at the temperature dependent lattice constant. We have verified that the results obtained by this more conventional method are very similar to those obtained by our procedure and both approaches are available in thermo_pw.
QSA TDECs are derived in a similar way using the second derivatives of instead of the derivatives of , in this way avoiding to compute the phonon dispersions for all strained configurations. The phonon dispersions are instead computed at the reference geometries in order to obtain the temperature dependent crystal parameters.
These procedures give for each temperature the isothermal ECs . However, many experimental setups using for instance ultrasonic pulse techniques, measure the adiabatic ECs . The latter can be readily obtained using the thermal stresses and the isochoric heat capacity [27]:
| (11) |
is obtained from:
| (12) |
where is the TE tensor that, in the cubic case is isotropic: . We have:
| (13) |
where is the temperature dependent cubic lattice constant. The calculation of as well as the calculation of are explained in Ref. [22] and summarized in the supplementary material.
As a further check of the consistence of our ECs we recalculate the TE using the mode-Grüneisen parameters. This formula requires the isothermal bulk modulus that can be obtained either from the QSA or from the QHA TDECs. The resulting TE can be compared with the TE given by Eq. 13. In cubic solids the TE written in terms of the Grüneisen parameters is given by
| (14) |
The are the mode-Grüneisen parameters:
| (15) |
and are the mode contributions to the isochoric specific heat:
| (16) |
In order to apply Eq. 14 the phonon frequencies calculated at the selected geometries are interpolated with a polynomial as a function of the lattice constant. Then, for each temperature T, we evaluate the interpolating polynomial (to obtain the frequencies) and its first derivative (proportional to the mode-Grüneisen parameters) at the . The are evaluated from the interpolated frequencies at that temperature. is the isothermal bulk modulus which for cubic solids can be written in terms of the isothermal ECs as:
| (17) |
This bulk modulus can be compared also with the bulk modulus derived at each temperature from the fit of the free-energy as a function of the volume with the Murnaghan equation. The calculation of the TE using Eq. 14 and TDECs is not very efficient since it requires first the evaluation of the temperature dependent crystal parameters (and hence implicitly of the TE itself). This problem is usually solved in the literature neglecting the variation of the ECs with temperature. We verified also this approximation as discussed below.
Finally the isothermal bulk modulus can be converted into the adiabatic one with the following formula:
| (18) |
where is the isothermal compressibility, is the isobaric compressibility, is the volume thermal expansion and is the isobaric heat capacity computed as in Ref. [22].
A flow-chart and further details on the computation of the TDECs with the thermo_pw code are reported in the supplementary material.
| T=0 K | T=0 K+ZPE | T=300 K | Expt. | |
|---|---|---|---|---|
| Silicon (LDA) | ||||
| Aluminum (PBEsol) | ||||
| Silver (PBEsol) |
| Silicon | ||||
|---|---|---|---|---|
| LDAa | 5.40 | 1618 | 640 | 761 |
| LDAb | 5.41 | 1580 | 639 | 746 |
| LDAc | 5.40 | 1590 | 610 | 850 |
| LDAd | 5.38 | 1621 | 635 | 773 |
| LDAe | 5.40 | 1610 | 650 | 760 |
| PBEe | 5.47 | 1530 | 570 | 740 |
| PBEsole | 5.44 | 1560 | 620 | 740 |
| Expt.l | 5.43 | 1675 | 650 | 801 |
| Aluminum | ||||
| PBEsola | 4.01 | 1192 | 643 | 365 |
| PBEsolb | 4.03 | 1146 | 632 | 353 |
| LDAg | 3.97 | 1222 | 608 | 374 |
| LDAh | 4.04 | 1104 | 545 | 313 |
| PBEf | 4.06 | 1093 | 575 | 301 |
| PWi | 4.05 | 1010 | 610 | 254 |
| Expt.m | 4.05 | 1143 | 619 | 316 |
| Silver | ||||
| PBEsola | 4.06 | 1450 | 1067 | 540 |
| PBEsolb | 4.07 | 1425 | 1054 | 531 |
| GGAh | 4.02 | 1612 | 1191 | 581 |
| PWi | 4.16 | 1159 | 851 | 421 |
| Expt.n | 4.09 | 1315 | 973 | 511 |
3 Method
The calculations presented in this work were carried out using DFT as implemented in the Quantum Espresso package [19, 20]. The exchange and correlation functional is approximated by the local density approximation (LDA) for silicon [38] and the generalized gradient approximation of Perdew-Burke-Ernzerhoff modified for densely packed solids (PBEsol) [39] for aluminum and silver. We took the exchange and correlation functionals that, on the basis of previous theoretical calculations, give a better agreement with the experiment for the TE and/or phonon dispersion curves.
We employed the projector augmented wave (PAW) method and a plane waves basis set with pseudopotentials [40] from [41]. For silicon we used the pseudopotential Si.pz-nl- kjpaw_psl.1.0.0.UPF, the cutoff for the wave functions was Ry, the one for the charge density Ry, and the k-points mesh was . For aluminum we used the pseudopotential Al.pbesol-n-kjpaw_psl.1.0.0.UPF, the cutoff for the wave functions was Ry, the one for the charge density Ry, and the k-points mesh was . For silver we used the pseudopotential Ag.pbesol-n-kjpaw_psl.1.0.0.UPF, the cutoff for the wave functions was Ry, the one for the charge density Ry, and the k-points mesh was . In the case of aluminum and silver, the presence of the Fermi surface has been dealt with by a smearing approach [42] with a smearing parameter Ry. Density functional perturbation theory (DFPT) [43, 44] was used to calculate the dynamical matrices on a q-points grid for silicon while for the metals we employed a q-points grid. These dynamical matrices have been Fourier interpolated on a q-points mesh to evaluate the free-energy.
The calculation of the TDECs can be done automatically by the thermo_pw program. The user chooses the relevant parameters: the number of strained configurations, the interval of strain values between two geometries, the degree of the fitting polynomials used in the calculation (further details for the calculations are reported in the thermo_pw user’s guide and in the file , released with the package). For our three materials the grid of the reference geometries were centered at the K lattice constants reported in Table 1. We used reference geometries for silicon with lattice constants separated from each other by a.u., for aluminum separated by a.u., and for silver separated by a.u.. The same grid is used for the calculation of the and the TE. For all three materials we used 6 strained configurations for each type of strain with a strain interval . In total we computed the phonon dispersions for geometries for silicon and geometries for aluminum and silver. In order to fit the energy (for the QSA) or the free-energy (for the QHA) as a function of strain we use a polynomial of degree two. To fit the ECs computed at the various reference configurations at the temperature dependent geometry we use a polynomial of degree four.
4 Applications
In Table 1 we report the theoretical lattice constants for silicon, aluminum, and silver: the equilibrium values at K with and without zero point energy and the values at K. The latter is in good agreement with the room temperature experimental value [28]: for all three elements, the experimental values being slightly larger (with differences of Å in silicon, Å in aluminum, and even less in silver).
In Table 2 we compare our ECs computed at K with those obtained considering the zero point energy given by QHA. We also report the comparison with experiment and other works. In Figure 1 the TDECs of silicon computed by means of the QSA (blue curves) and the QHA (red curves) are shown. The dashed lines indicate isothermal ECs, the continuous lines the adiabatic ECs obtained by Eq. 11. The experimental points (black line) are adiabatic ECs obtained from ultrasonic experiments [33].
At the temperature corresponding to the experimental points the difference between isothermal and adiabatic ECs and is quite small and it remains small also at higher temperatures. For there is no difference as expected for cubic solids with a diagonal TE tensor. In general the theoretical values are slightly below the experimental data (see also Table 2): in particular these differences are about % for , % for , and % for at the lowest experimental temperature K. Our K EC agrees with almost all LDA ECs reported in Table 2 with typical differences of about 2 %. Only Ref. [2] has larger discrepancies. The PBE and PBEsol values are lower than LDA and hence more distant from experiment. The experimental ECs decreases by for , for , and for from K to K. The theoretical softening in the same temperature range are (QHA) and (QSA) for , (QHA) and (QSA) for , (QHA) and (QSA) for . The theoretical QHA reproduces better the experimental trend than the QSA.
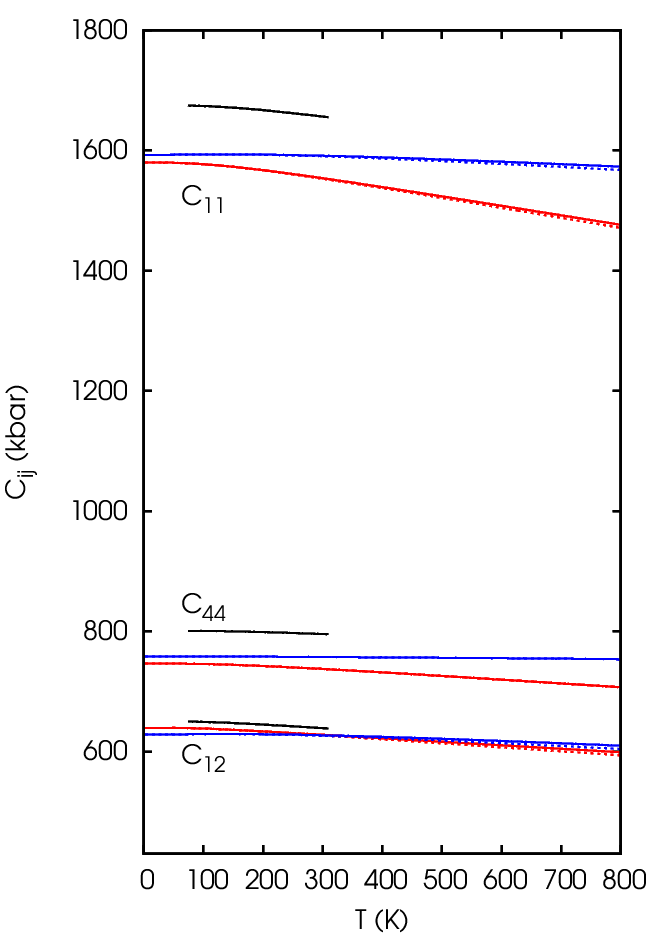
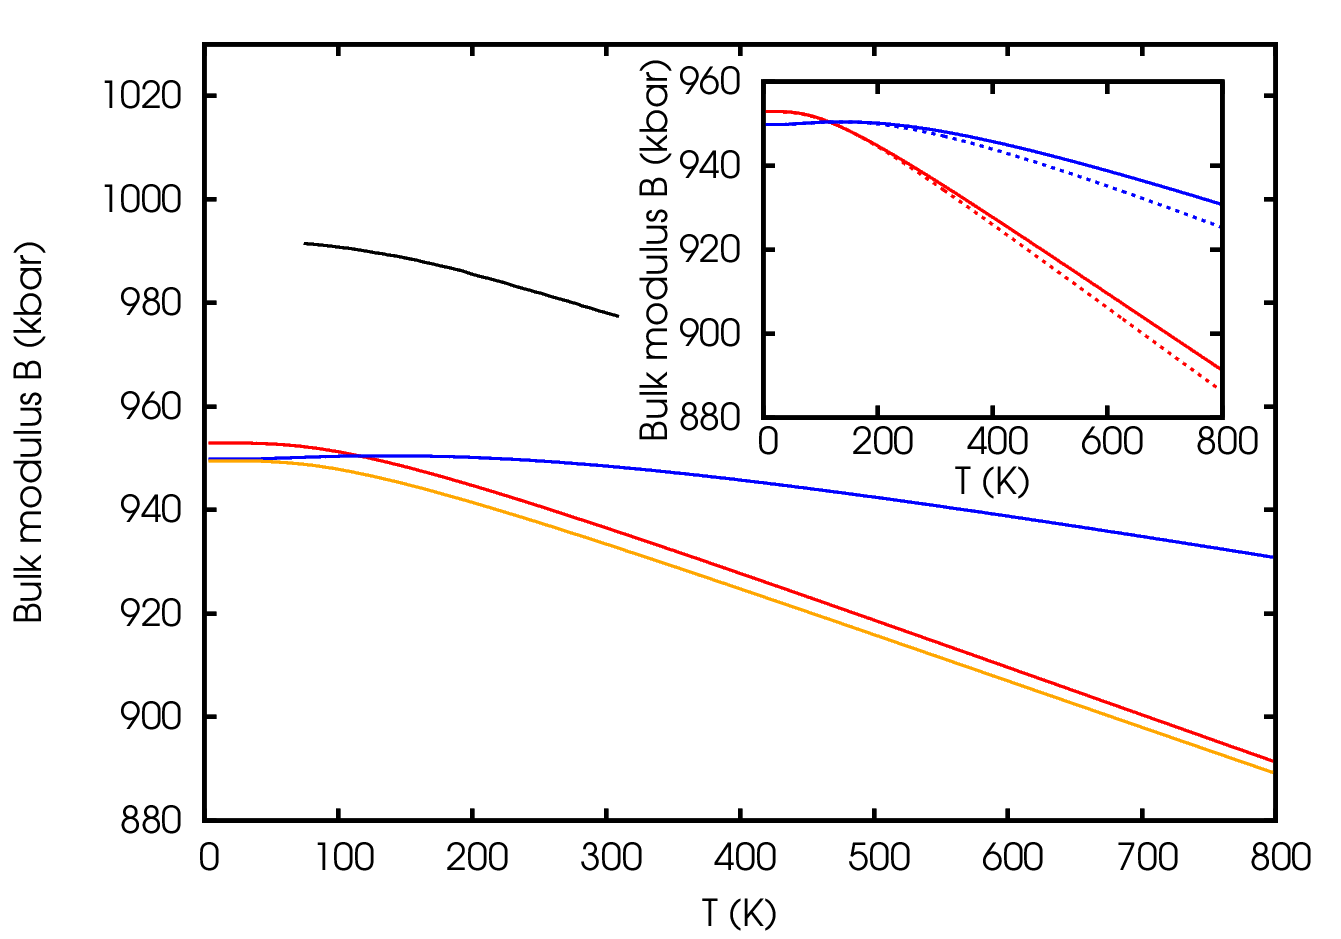
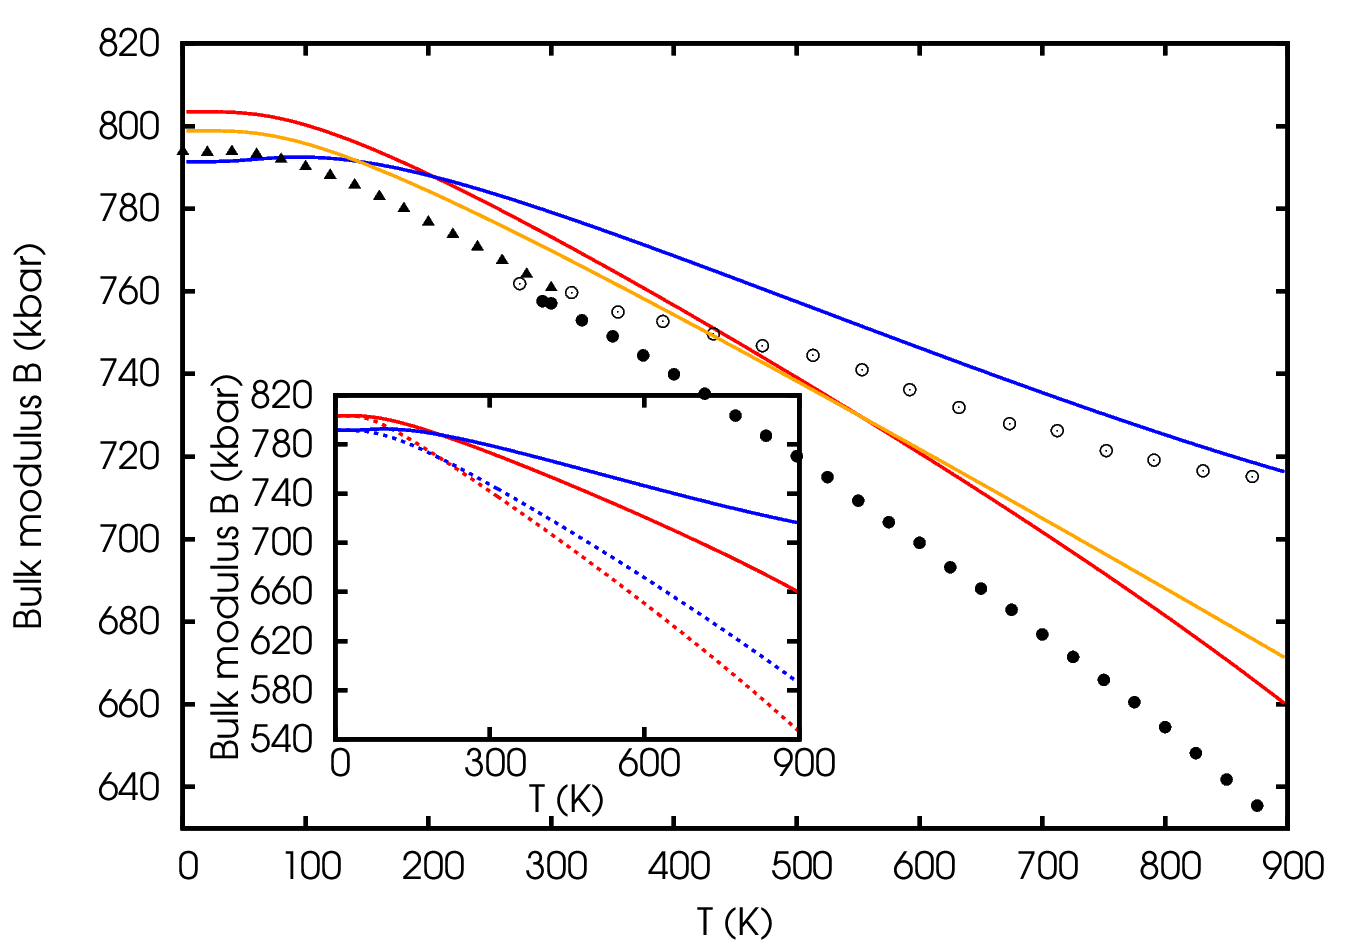
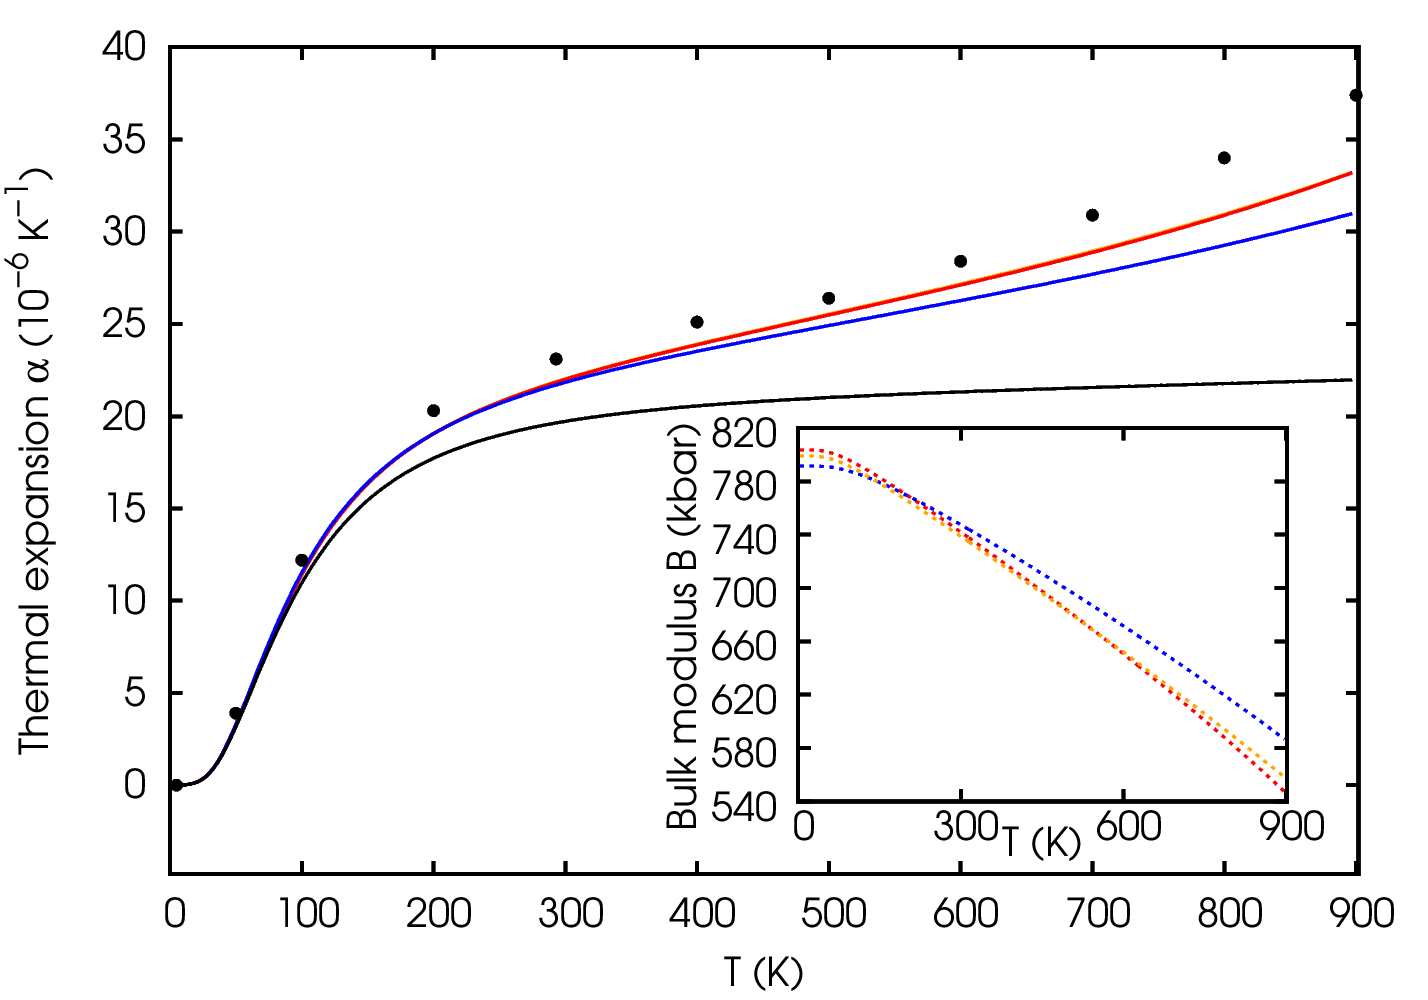
Although in the experimental temperature range the decrease of the ECs is small, in the whole temperature range K - K considered in the plot, the QHA ECs have a not negligible variation: and decrease of about 7 % and of 5 %. In Figure 2 we show the bulk modulus obtained from these TDECs. The comparison between theoretical and experimental adiabatic bulk moduli obtained from the experimental ECs using Eq. 17 (left) reflects the behavior of the ECs: the temperature dependence is more in agreement with QHA (red curve) than QSA (blue curve). Moreover, the QHA is much more in agreement with the bulk modulus obtained from the Murnaghan equation (orange curve) and differs from the experiment (black line) by an almost constant amount.
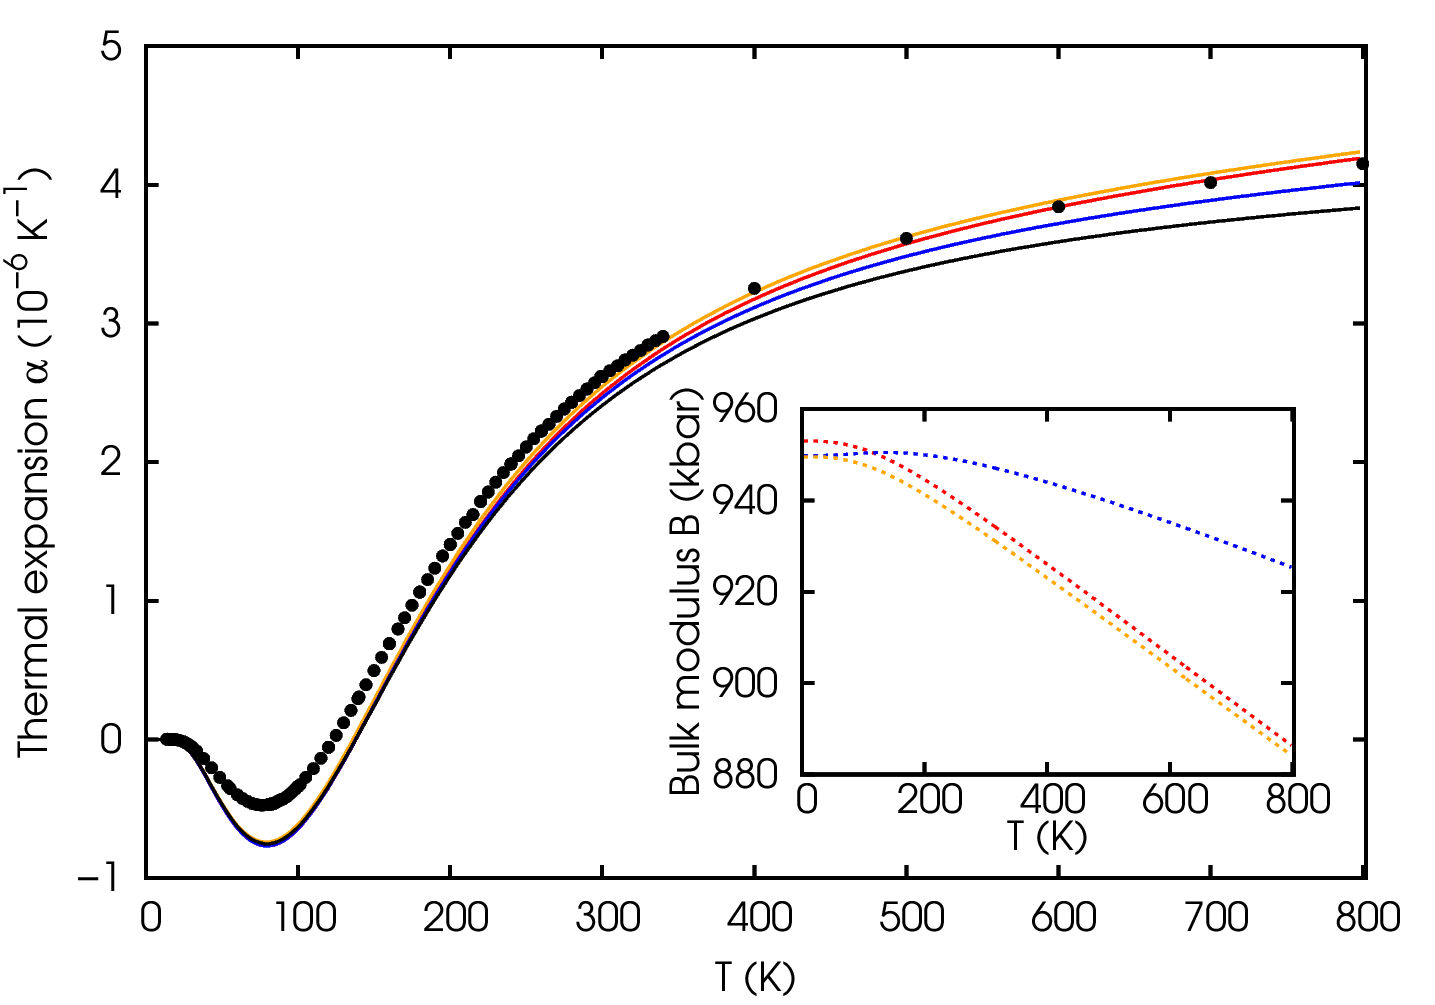
Finally we present the TE calculated by the Grüneisen’s formula (Eq.14). In order to gauge our TDECs we take as reference the TE coefficient computed via Eq. 13. This curve is reported in the right side of Figure 2 (orange). The difference of the TEs with the reference is quantified by computing the area percentage error (APE) that is the percentage difference of the areas under the TE curves. The TE obtained with the isothermal bulk modulus derived from the Murnaghan equation (orange dashed line in the inset) differs by less than 0.04%. The TE derived from QHA almost overlaps with the previous one (it is slightly lower) since the two corresponding bulk moduli (orange and red dashed lines in the inset) are very close to each other: in this case the APE is about 1.7%. The isothermal QSA bulk modulus (blue dashed line in the inset) is larger so the corresponding TE is smaller at higher temperatures with an APE . The black line is the TE computed with fixed ECs ( K without zero point contributions). It gives the smallest TE with an APE of about . In general, in silicon the different methods give very similar results, especially at temperature lower than 200 K for which an almost perfect overlap is found. Finally, the theoretical TEs are in good agreement with experimental points [36, 37] as already found in previous literature [45].
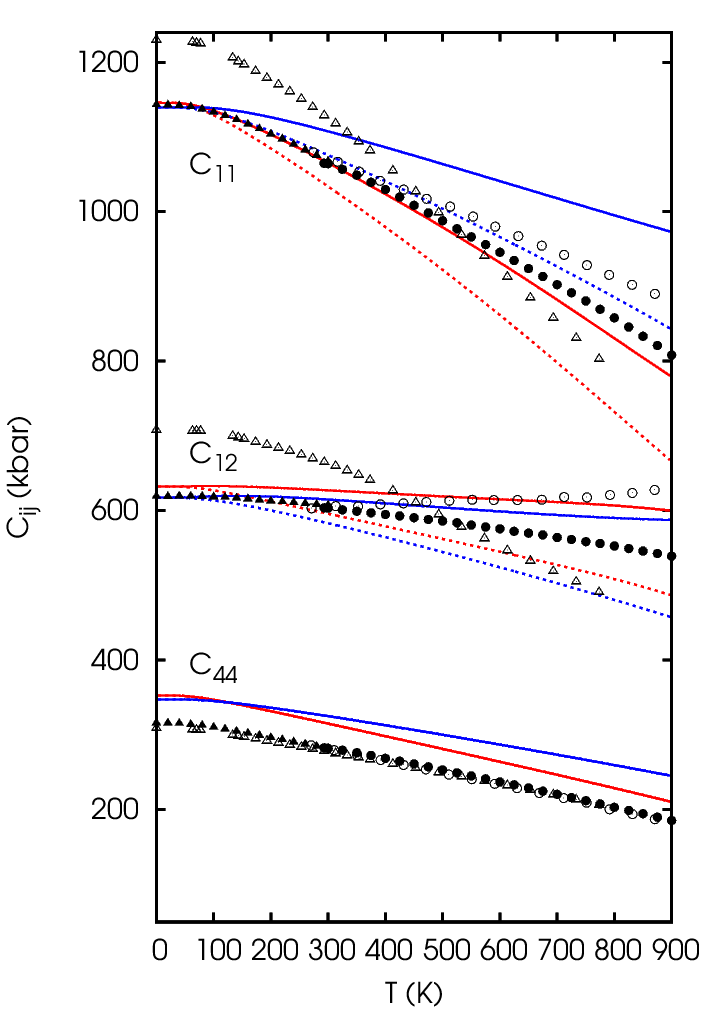
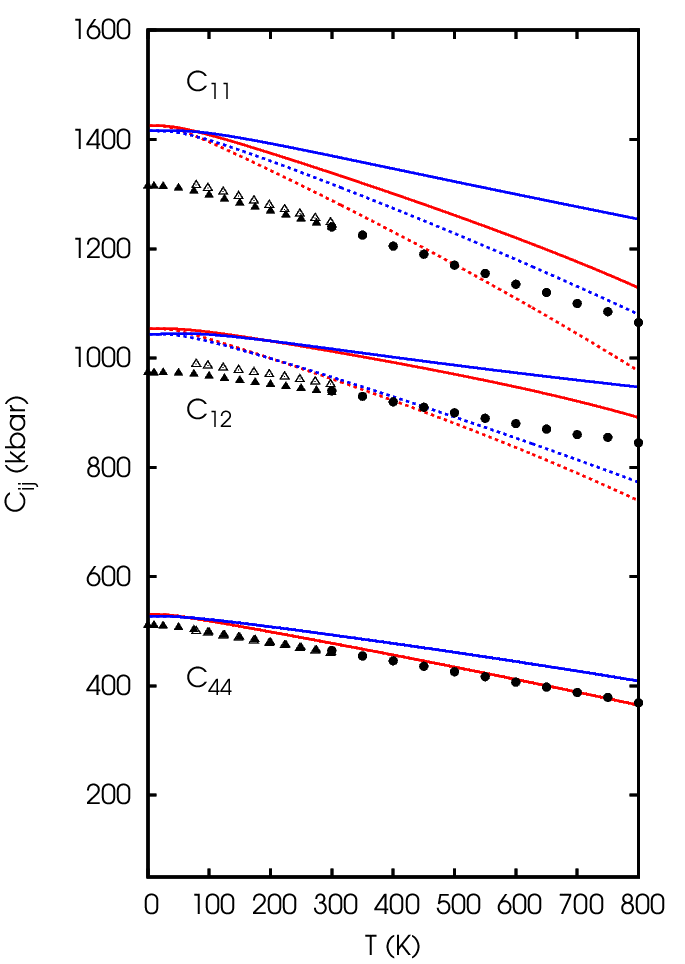
In Figure 3 we report TDECs of aluminum with the same meaning for the lines and colors as for silicon. In aluminum there are several ultrasonic experiments which do not totally agree with each other. We report these experimental points in the same figure. Sutton data [46] are in the temperature range K - K (open triangles), Kamm and Alers [34] data are in the range K - K (full triangles), Gerlich and Fisher [47] data are in the range K - K (full circles), and Tallon and Wolfenden [48] data are in the range K - K (full circles). All experimental ECs are adiabatic and must be compared with the continuous lines. The temperature dependence and also the actual values measured by Sutton are quite distant from the other measurements for and (while the agreement improves for ). For this reason we do not further discuss these data in the rest of the paper. The QHA is in satisfactory agreement with both the data of Kamm and Alers, and Gerlich and Fisher. The data of Tallon and Wolfenden indicate less softening in than Gerlich and Fisher and report a which is approximately constant within the experimental errors, very similar to the theory in this case. Moreover, recent measurements of resonant ultrasound spectroscopy [52] of Young’s modulus and shear modulus found good agreement with those derived from Gerlich and Fisher. On the other hand, the QSA shows a smaller softening in and than the QHA, while smaller differences between the two approximations are present for .
The percentage differences between theoretical ECs (red continuous curves) and experimental points at K (Kamm data) are % (QHA) and % (QSA) for , % (QHA) and % (QSA) for , % (QHA) and % (QSA) for . The K ECs are also reported in Table 2 and compared with previous literature. In the temperature range K - K the experiment of Kamm and Alers, and Gerlich and Fisher taken together show a softening of for , for and for While taking together the experiments of Kamm and Alers, and Tallon and Wolfenden in the same range of temperatures the percentage variations are: for , for and for .
The theoretical softening in the same temperature range are (QHA) and (QSA) for , (QHA and QSA) for , (QHA) and (QSA) for . As for silicon, in aluminum the QHA reproduces better the experimental trend than QSA. Similar results have been obtained in Reference [52] with the PW functional.
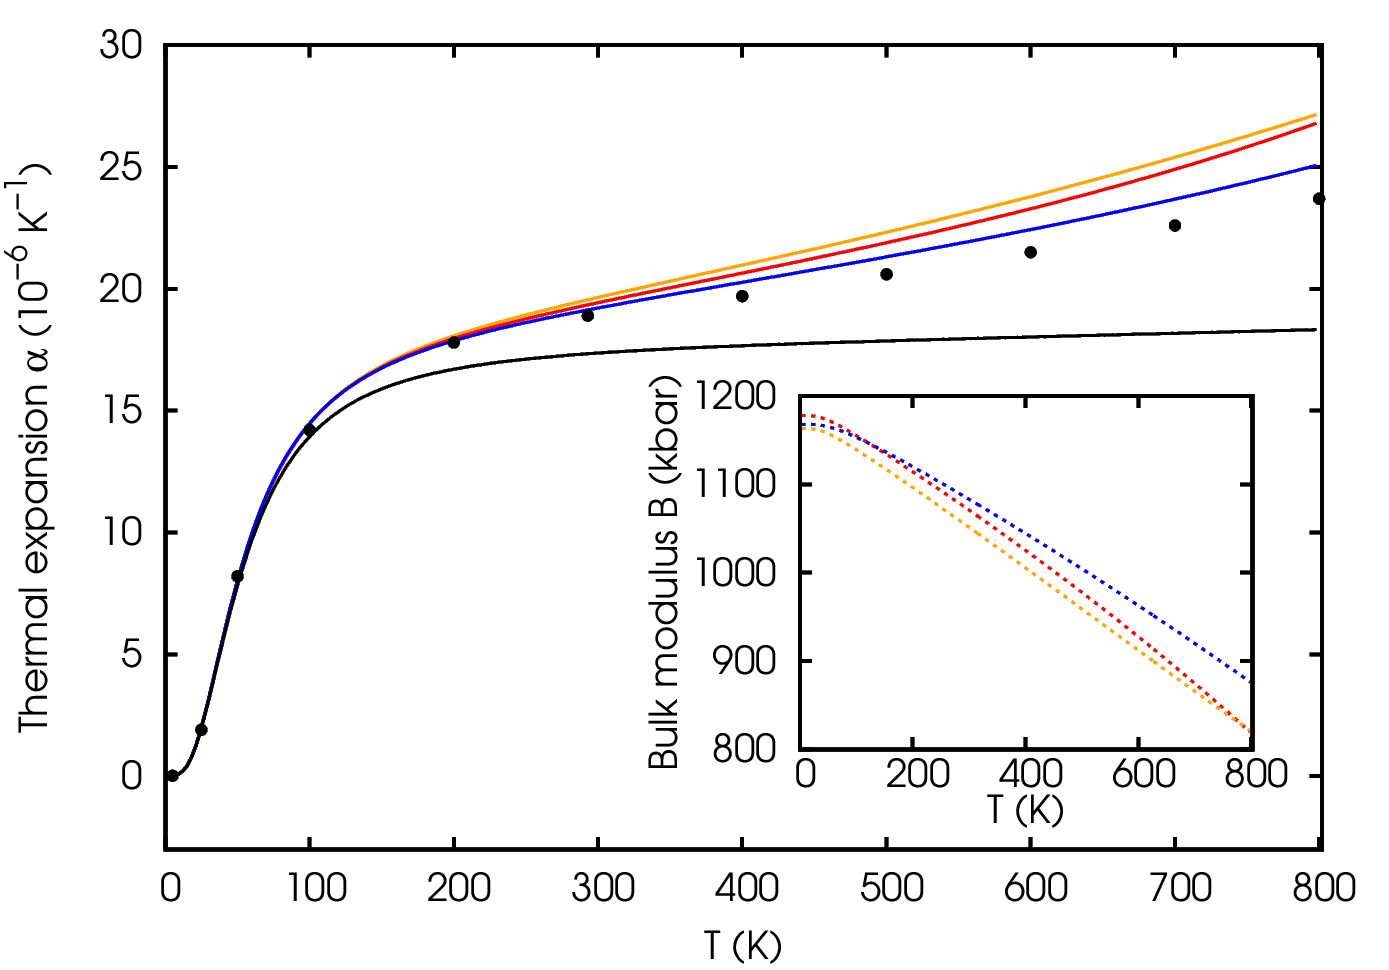
We report in Figure 4 (left) the bulk modulus of aluminum computed with the different sets of ECs with the same meaning for the lines and colors as for silicon. The adiabatic bulk modulus derived from the Murnaghan equation is also reported (orange curve): it is in good agreement with the bulk modulus computed from QHA TDECs (red curve) while larger differences are present with the QSA (blue curve) which remains higher at larger temperatures. In order to check the consistency of our ECs we calculate the TE by using Grüneisen’s formula using the isothermal bulk modulus obtained from the TDECs (the comparison between adiabatic and isothermal bulk moduli is shown in the inset). We take as reference the TE coefficient computed from finite differences and compute the APE as done for silicon. The TE obtained from mode-Grüneisen parameters (Eq. 14) with the bulk modulus derived from the Murnaghan equation (orange dashed line in the inset) gives an APE . The result of the TE derived from QHA TDECs (red curve) gives a remarkable agreement with the reference with an APE , while an APE is found using QSA. Finally, the calculation of the TE with a fixed bulk modulus obtained from the KECs has an APE , even if the agreement remains good at temperature up to K.
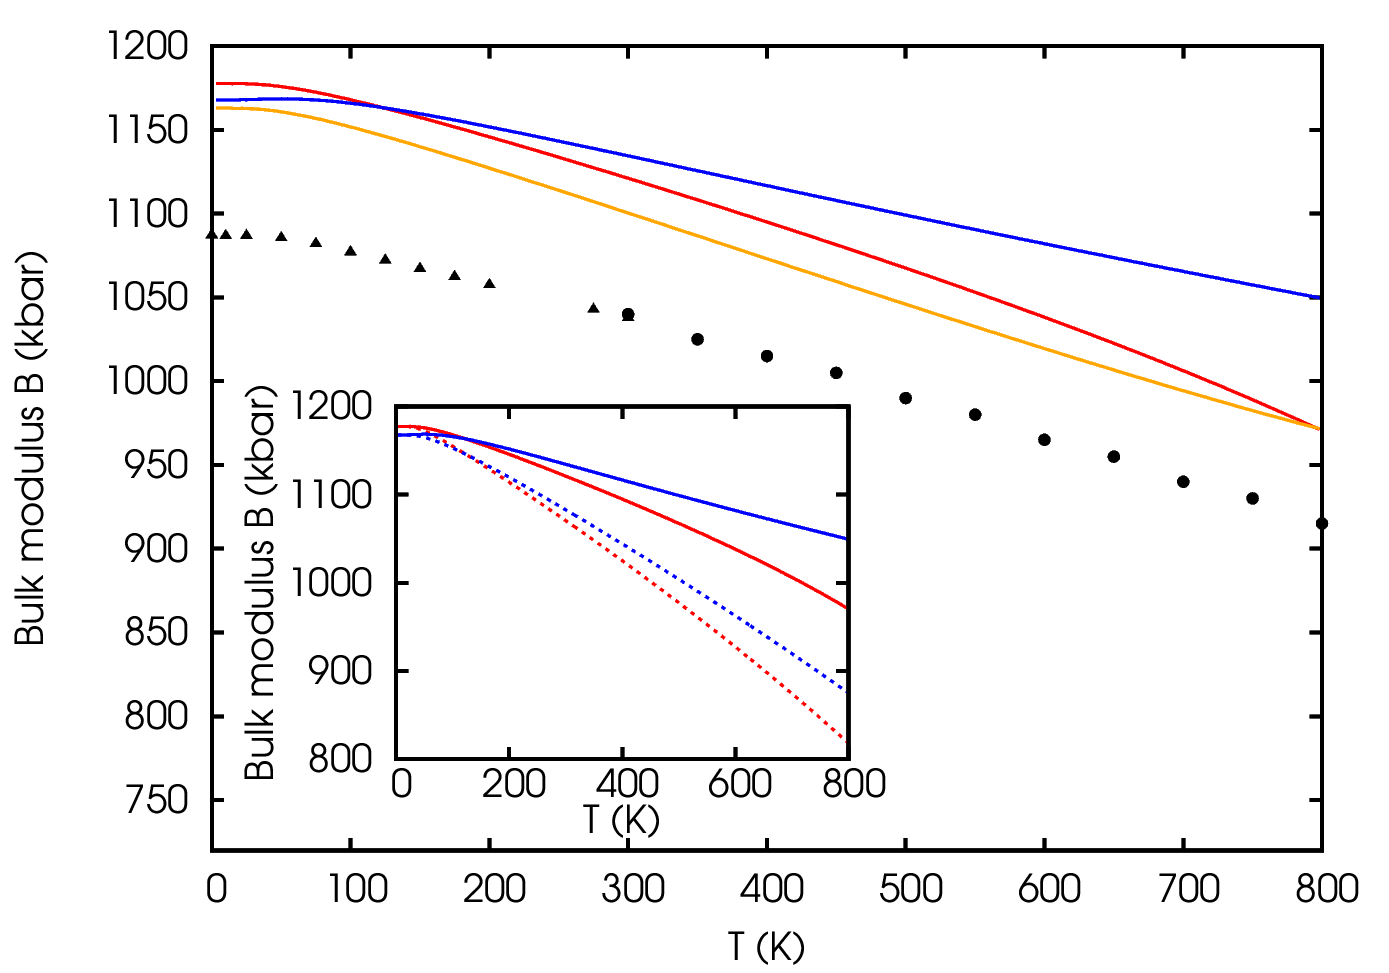
In Figure 5 we report the TDECs of silver with the same meaning for the lines and colors of previous plots. The points are taken from ultrasonic experiments that provide adiabatic ECs and must be compared with the continuous lines: reference [35] is in the range of temperatures K - K (full triangles), reference [50] is in the range K - K (open triangles) and reference [51] is in the range K - K (circles). Since the two sets of data below room temperature are very similar, in the following we limit the comparison with the first one. The percentage differences between QHA ECs (red continuous curves) and experimental points at K are about % for and and % for . Almost the same values are found for QSA ECs. Our values of the K ECs are between the ECs of Refs. [9] and Ref. [10] both using GGA functionals and are slightly closer to experiment (see Table 2). The experiments show a softening of for , for , and for in the temperature range K - K. In the same range of temperatures the theoretical softening of the adiabatic ECs is (QHA) and (QSA) for , (QHA) and (QSA) for and (QHA) and (QSA) for . As for silicon and aluminum the QHA reproduces slightly better the experimental trend. We report in Figure 6 (left) the adiabatic bulk modulus of silver computed with the different sets of ECs and the one derived from the Murnaghan equation (orange curve). The QHA bulk modulus is the closest to the orange curve, even if a small artificial descent is present in the high temperature part of the red curve ( 600 K). This may be due to a not perfect convergence in the k-point sampling but since the variation is small and the selected k-point grid was already close to the largest one we could afford we have not investigated further this issue. Finally we check the consistency of our ECs by computing the TE using the Grüneisen’s formula and the isothermal bulk modulus obtained from the TDECs (the comparison between adiabatic and isothermal bulk moduli is shown in the inset). The APE is computed as for the previous two materials. The TE computed using the isothermal bulk modulus derived from the Murnaghan equation (orange dashed curve in the inset) has an APE of the order of , being practically identical to the finite differences method. Also QHA TDECs give a very good agreement, the associated APE is , while the QSA TE has slightly smaller values at higher temperatures with an APE of . Finally, by using a temperature independent bulk modulus obtained from the K ECs (black line) the TE is more distant from the reference with an APE .
5 Conclusions
In this paper we presented our implementation of the TDECs in the thermo_pw code. Isothermal and adiabatic ECs can be computed within the framework of DFT and DFPT within both the QSA and the QHA. The two approaches have been compared in this paper. The first method is less computationally demanding and takes into account only the TE effect. The second method, more accurate, obtains the ECs from the derivatives of the Helmholtz free-energy with respect to the strain and requires the computation of the phonon dispersions in all strained geometries. The two methods were validated computing the TDECs of three cubic crystals: silicon, aluminum, and silver. The computed ECs were systematically compared with experiment. It was found that the experimental temperature dependence agrees very well with QHA and also QSA gives often reasonable results. The actual values of the ECs depend on the exchange and correlation functionals: with our choices the values are usually within 10 % from experiment but for some element and EC component the error can be even lower (for instance it is % for in aluminum below room temperature).
As a further check we use the TDECs to estimate the TE using the mode Grüneisen parameters. The QHA ECs allow to reproduce with remarkable accuracy the TE given by differentiation of the temperature dependent lattice constant.
The method is currently available and tested for cubic solids. As in many theoretical calculations of the TDECs presented so far, internal degrees of freedom are optimized only at K negleting the dependence of the free energy on them. The extension of the method to anisotropic solids and to a complete QHA treatment of the internal degrees of freedom will be the subject of future investigations.
References
References
- [1] M. J. Gillan, D. Alfè, J. Brodholt, L. Vočadlo, and G. D. Price. Reports on Progress in Physics, 69:2365, 2006.
- [2] O. H. Nielsen and Richard M. Martin. Phys. Rev. B, 32:3792, 1985.
- [3] Hao Wang and Mo Li. Phys. Rev. B, 79:224102, 2009.
- [4] Jijun Zhao, J. M. Winey, and Y. M. Gupta. Phys. Rev. B, 75:094105, 2007.
- [5] R. Golesorkhtabar, P. Pavone, J. Spitaler, P. Puschnig, and C. Draxl. Comput. Phys. Commun., 184:1861, 2013.
- [6] W.F. Perger, J. Criswell, B. Civalleri, and R. Dovesi. Comput. Phys. Commun., 180:1753, 2009.
- [7] M. Jamal, S. Jalali-Asadabadi, Iftikhar Ahmad, and H. A. Rahnamaye Aliabad. Comput. Mater. Sci., 95:592, 2014.
- [8] M. Jamal, M. Bilal, Iftikhar Ahmad, and S. Jalali-Asadabadi. J. Alloys Compd., 735:569, 2018.
- [9] Y Wang, J J Wang, H Zhang, V R Manga, S L Shang, L-Q Chen, and Z-K Liu. J. Phys.: Condens. Matter, 22:225404, 2010.
- [10] S-L. Shang, H. Zhang, Y. Wang, and Z-K. Liu. J. Phys.: Condens. Matter, 22:375403, 2010.
- [11] K. Kádas, L. Vitos, R. Ahuja, B. Johansson, and J. Kollár. Phys. Rev. B, 76:235109, 2007.
- [12] B. B. Karki, R. M. Wentzcovitch, S. de Gironcoli, and S. Baroni. Phys. Rev. B, 61:8793, 2000.
- [13] B. B. Karki, R. M. Wentzcovitch, S. de Gironcoli, and S. Baroni. Science, 286:1705, 1999.
- [14] T. Shao, B. Wen, R. Melnik, S. Yao, Y. Kawazoe, and Y. Tian. J. Appl. Phys., 111:083525, 2012.
- [15] Daniele Dragoni, Davide Ceresoli, and Nicola Marzari. Phys. Rev. B, 91:104105, 2015.
- [16] X. Yan, Y. Lin, L. Li, and F. Sun. Phys. Status Solidi B, 253:2236, 2016.
- [17] Maurizio Destefanis, Corentin Ravoux, Alessandro Cossard, and Alessandro Erba. Minerals, 9:16, 2019.
- [18] https://dalcorso.github.io/thermo_pw.
- [19] P. Giannozzi, S. Baroni, N. Bonini, M. Calandra, R. Car, C. Cavazzoni, D. Ceresoli, G. L. Chiarotti, M. Cococcioni, and I. Dabo et al. J. Phys.: Condens. Matter, 21:395502, 2009.
- [20] P. Giannozzi, O. Andreussi, T. Brumme, O. Bunau, M. Buongiorno Nardelli, M. Calandra, R. Car, C. Cavazzoni, D. Ceresoli, and M. Cococcioni et al. J. Phys.: Condens. Matter, 29:465901, 2017.
- [21] Andrea Dal Corso. Journal of Physics: Condensed Matter, 28(7):075401, jan 2016.
- [22] M. Palumbo and A. Dal Corso. J. Phys.: Condens. Matter, 29:395401, 2017.
- [23] M. Palumbo and A. Dal Corso. Phys. Status Solidi B, 254:1700101, 2017.
- [24] Cristiano Malica and Andrea Dal Corso. Acta Cryst. Section A, 75:624, 2019.
- [25] T. H. K. Barron and M. L. Klein. Proc. Phys. Soc., 85:523, 1965.
- [26] J. F. Nye. Physical properties of crystals. New York: Oxford science publications, 1985.
- [27] D. C. Wallace. Thermodynamics of Crystals. John Wiley and Sons, 1972.
- [28] R. W. G. Wyckoff. Crystal structure 1. Interscience Publishers New York, 1963.
- [29] J. P. Perdew, K. Burke, and M. Ernzerhof. Phys. Rev. Lett., 77:3865, 1996.
- [30] J. P. Perdew and Y. Wang. Phys. Rev. B, 45:13244, 1992.
- [31] M. Rasander and M. A. Moram. J. Chem. Phys., 143:144104, 2015.
- [32] Weixue Li and Tzuchiang Wang. J. Phys.: Condens. Matter, 10:9889, 1998.
- [33] H J. McSkimin. J. Appl. Phys., 24:988, 1953.
- [34] G. N. Kamm and G. A. Alers. J. App. Phys., 35:327, 1964.
- [35] J. R. Neighbours and G. A. Alers. Phys. Rev., 111:707, 1958.
- [36] K. G. Lyon, G. L. Salinger, C. A. Swenson, and G. K. White. J. Appl. Phys., 48:865, 1977.
- [37] R. Hull. Properties of crystalline silicon. INSPEC London, 1999.
- [38] J. P. Perdew and A. Zunger. Phys. Rev. B, 23:5048–5079, 1981.
- [39] John P. Perdew, Adrienn Ruzsinszky, Gábor I. Csonka, Oleg A. Vydrov, G E. Scuseria, L A Constantin, Xiaolan Zhou, and Kieron Burke. Phys. Rev. Lett., 100:136406, 2008.
- [40] P. E. Blöchl. Phys. Rev. B, 50:17953, 1994.
- [41] https://github.com/dalcorso/pslibrary.
- [42] M. Methfessel and A. T. Paxton. Phys. Rev. B, 40:3616–3621, 1989.
- [43] S. Baroni, S. de Gironcoli, A. Dal Corso, and P. Giannozzi. Rev. Mod. Phys., 73:515, 2001.
- [44] A. Dal Corso. Phys. Rev. B, 82:075123, 2010.
- [45] G.-M. Rignanese, J.-P. Michenaud, and X. Gonze. Phys. Rev. B, 53:4488, 1996.
- [46] P. M. Sutton. Phys. Rev., 91:816, 1953.
- [47] D. Gerlich and E. S. Fisher. J. Phys. Chem. Solids, 30:1197, 1969.
- [48] J. L. Tallon and A. Wolfenden. J. Phys. Chem. Solids, 40:831–837, 1979.
- [49] Y. S. Touloukian, R. K. Kirby, R. E. Taylor, and P. D. Desai. Thermal expansion: Metallic elements and alloys. IFI/Plenum, 1975.
- [50] P. Mohazzabi. J. Phys. Chem. Solids, 46:147, 1985.
- [51] Y. A. Chang and L. Himmel. J. Appl. Phys., 37:3567, 1966.
- [52] Hieu H. Pham, Michael E. Williams, Patrick Mahaffey, Miladin Radovic, Raymundo Arroyave, and Tahir Cagin. Phys. Rev. B, 84:064101, 2011.