The role of Hi in regulating size growth of local galaxies
Abstract
We study the role of atomic hydrogen (Hi) in regulating size growth of local galaxies. The size of a galaxy, , is characterized by the diameter at which the band surface brightness reaches . We find that the positions of galaxies in the size ()stellar mass () plane strongly depend on their Hi-to-stellar mass ratio (). In the Hi-rich regime, galaxies that are more rich in Hi tend to have larger sizes. Such a trend is not seen in the Hi-poor regime, suggesting that size growth is barely affected by the Hi content when it has declined to a sufficiently low level. An investigation of the relations between size, and star formation rate (SFR) suggests that size is more intrinsically linked with , rather than SFR. We further examine the Hi-to-stellar disk size ratio () of galaxies and find that at log(, is weakly correlated with . These findings support a picture in which the Hi-rich galaxies live in an inside-out disk growing phase regulated by gas accretion and star formation. The angular momentum of the accreted materials is probably the key parameter in shaping the size of an Hi-rich galaxy.
1 Introduction
The sizes of galaxies play a critical role in our understanding of how they form and evolve. Observationally, the absence of a clear border of a galaxy makes the measuring of its extent a non-trivial task. In the literature, there are two popular approaches for characterizing the size of a galaxy. The first, which is also the most popular approach, is defining the size of a galaxy as the radial distance that enclosing half of its light, i.e., the effective radius (de Vaucouleurs, 1948). A second commonly used approach is defining galaxy size at the radial location of a given isophote (for example , the radius at which the surface brightness reaches ). Each approach has its superiority and shortcoming. As already known, is barely affected by the depth of image but is quite sensitive to the light profile of a galaxy, making it incapable of describing the global extension of a galaxy (Graham, 2019). The second approach performs better in describing the global size of a galaxy but requires the image to reach a certain depth.
Observational studies have demonstrated that the sizes of galaxies evolve across cosmic time (e.g., van der Wel et al., 2014). On the one hand, mergers are believed to significantly contribute to this evolution, especially at the high mass end. Simulations suggest that the size of the emerged galaxy is strongly dependent on the physical conditions (stellar mass, gas mass, etc) of progenitor galaxies before merging (Hopkins et al., 2009). On the other hand, in a merger-free case, theoretical studies predict that star-forming galaxies (SFGs) grow from the inside out via gas accretion and star formation (e.g., Pichon et al., 2011). This inside-out galaxy formation picture is supported by a growing body of observational studies (Wang et al., 2011; Dale et al., 2016; Frankel et al., 2019; Chen et al., 2020).
The second scenario points out a potential link between size growth and the cold gas content of a galaxy. Neutral atomic hydrogen (Hi) gas is the raw material from which molecular gas and then star formation form. Studying the scaling relations between galaxy properties and their Hi content thus provides important insights on understanding galaxy formation. Based on the data provided by the GALEX Arecibo SDSS Survey (GASS), Catinella et al. (2010) showed that the concentration of galaxies is only weakly correlated with their Hi content. Subsequent studies found that Hi-rich galaxies have bluer outer disk than the Hi-normal ones, implying continuous growth of the outer disks supplied by rich Hi gas reservoirs (Wang et al., 2011; Huang et al., 2014; Kauffmann, 2015; Yıldız et al., 2017). Recently, Chen et al. (2020) study the relations between the properties of bulge/disk component and the Hi content of galaxies. They found that the color of disk is bluer in Hi rich galaxies, whereas a similar trend is not found for the bulge component. This finding suggests that Hi gas is closely related to the formation of disks but not necessarily fuel the star formation of bulges in an efficient way.
Given the fact that Hi content is closely related to the formation of disk component of galaxies, it is worthy to further investigate at what condition the Hi gas could efficiently impact on size growth. In this paper, we aim to study how size growth is regulated by the Hi gas of galaxies based on the data from the extended GASS (xGASS, Catinella et al. 2018 ) and Arecibo Legacy Fast ALFA (ALFALFA) survey. Throughout this paper, we adopt a concordance CDM cosmology with , , Mpc-1 and a Kroupa (2001) initial mass function (IMF).
2 Data
2.1 The ALFALFA sample
One of the Hi sample used in this work is drawn from the Arecibo Legacy Fast ALFA (ALFALFA) survey (Giovanelli et al., 2005). We use the catalog, which includes HI sources exacted from 70% of the final survey area111http://egg.astro.cornell.edu/alfalfa/data/index.php. This catalog contains 25,000 HI sources at , with more than 95% having identified optical counterparts. The Hi mass () was calculated by
| (1) |
where is the luminosity distance of the source, is redshift and is the integrated 21-cm line flux density. is determined using the Hubble Law for the sources that with . For sources with , is derived using the local universe peculiar velocity model of Marsters (2005). The catalog also provides the coordinates of the matched optical counterparts and the signal-to-noise ratio (S/N) of the Hi sources.
The optical data are drawn from the Sloan Digital Sky Survey (SDSS, York et al. 2000). We cross-matched the ALFALFA sources that with confident (or marginal) Hi detections (with Hi line detection flag 1 (or 2), see the catalog) with the SDSS data release 7 (DR7) database via the SDSS online SQL tool 222http://skyserver.sdss.org/dr7/en/tools/crossid/crossid.asp, yielding a sample of 17,134 galaxies.
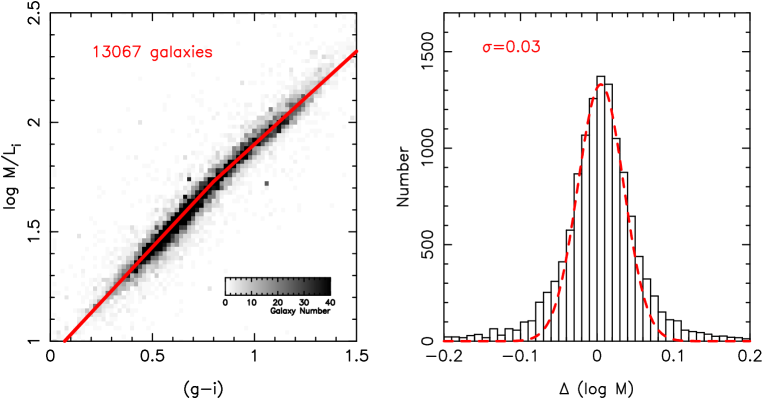
Of the 17,134 SDSS-ALFALFA matched galaxies, 13,067 ones have spectroscopic redshifts and stellar mass () estimates 333The of the spec-z galaxies are available at http://www.mpa-garching.mpg.de/SDSS/DR7/.. In this paper we wish to estimate the of the 17,134 galaxies in a uniform way. We first derive the -band absolute magnitude of individual galaxies using the SDSS photometry and the distance information given in the ALFALFA catalog. As confirmed by previous works, the optical broad-band color is in good correlation with the mass-to-light ratio () of galaxies (Bell et al., 2003; Taylor et al., 2011; Fang et al., 2013). In the left panel of Figure 1, we show as a function of color for the 13,067 galaxies that with estimates. The color has been corrected for Galactic extinction based on the extinction map of Schlegel et al. (1998). Since the log vs. () relation appears to have a slightly shallower slope at red colors, we fit this relation with a broken linear function:
| (2) |
We compare the stellar masses derived using equation (2) with those of the MPA catalog and show the result in the right panel of Figure 1. As can be seen, stellar masses derived from equation (2) are well consistent with those from the JHU/MPA catalog. In the following sections, is referred to which we estimated using equation (2). We further restrict galaxies to have and , yielding a final sample of 11,378 galaxies.
2.2 The xGASS representative sample
The ALFALFA survey is relatively shallow and biased to Hi-rich galaxies. To extend our study to more Hi-deficient galaxies, we supplement the Hi sample with galaxies drawn from xGASS (extended GALEX Arecibo SDSS Survey, see Catinella et al. 2018). xGASS is a census of the Hi content of 1179 galaxies using the Arecibo telescope, and the galaxies are selected from the intersected area of SDSS, GALEX and ALFALFA. The galaxy sample of xGASS spans a mass range of at redshift . To optimize the survey efficiency, galaxies that with reliable Hi detection in ALFALFA were not observed again. The rest galaxies are observed until the Hi line is detected, or a limit in is reached. The HI spectrum of each galaxy is flagged according to its quality. A catalog containing the Hi and other properties (such as star formation rates (SFRs), concentration index, etc.) of the 1179 galaxies is compiled by Catinella et al. (2018) 444The catalog is available at https://xgass.icrar.org/data.html. We draw data from the xGASS catalog and convert from Chabrier (2003) to Kroupa (2001) IMF by multiplying a factor of 1.06. A (1+) factor is multiplied to the xGASS to ensure that both the of ALFALFA and xGASS are calculated with a same method. In the following analysis, we only use the 804 galaxies that with reliable Hi detections.
3 Result
3.1 Impacts of Hi on the size-mass relation
In this paper, the size of a galaxy is defined as , where is the radius at which the SDSS band surface brightness reaches . We use this size indicator because it gives a better description to the global size of a galaxy than the effective radius , as mentioned above. The quality of SDSS imaging data allows a robust measurement of surface brightness profile of galaxies down to (Pohlen & Trujillo, 2006; Wang et al., 2018). In this work, is drawn from the SDSS DR7 photometric database. We have checked the quality of the SDSS-measured and confirmed that it is suitable for our statistical study (see Appendix A).
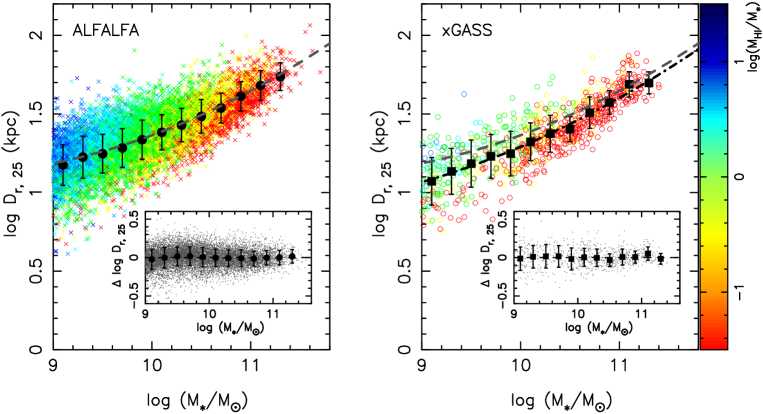
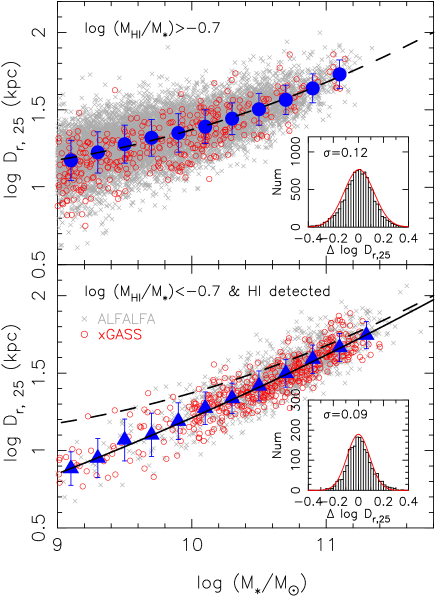
In Figure 2, we show the relation for the ALFALFA and xGASS galaxy samples. Symbols are color coded by Hi gas fraction, defined as . Since the relations of the two samples both show a shallower slope at the low-mass end, we use a second-order polynomial to fit this relation over log. As shown in the small panels of Figure 2, the residual of the fitting is independent of stellar mass. The dispersion of the relation is dex, which is significantly smaller than that of the classical relation (Shen et al., 2003; van der Wel et al., 2014), as also reported by some previous studies (Cortese et al., 2012; Trujillo et al., 2020). A most important new feature revealed in Figure 2 is that, at fixed , galaxies that are more rich in Hi tend to have larger sizes. This feature also holds when a new size indicator defined by the radial position of a given isomass contour is utilized (see Appendix C).
As shown in previous studies, at fixed , galaxies that with larger tend to have bluer colors and younger stellar ages (Shen et al., 2003; Lange et al., 2015; Scott et al., 2017). Since blue galaxies also tend to be rich in gas, the trend between the sizes and gas fraction of galaxies shown in Figure 2 is expected.
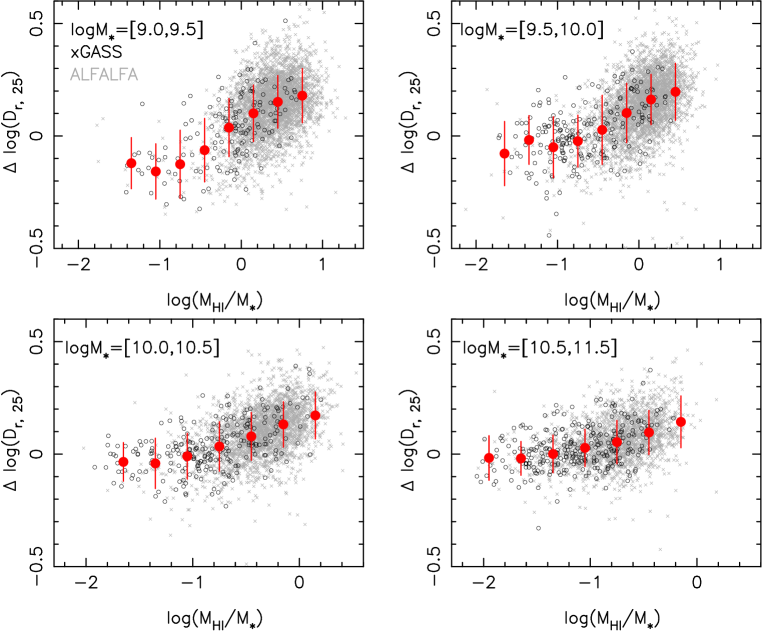
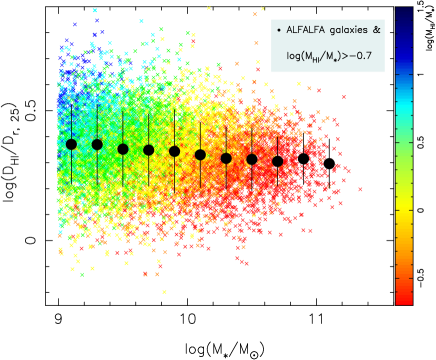
We further divide our samples into 4 stellar mass bins and examine the relation between log and . log is defined as the offset of a galaxy from the sizemass relation, i.e., log=loglog, where log is the median size of galaxies as fitted from the xGASS sample. The results are shown in Figure 3. When replacing log with that fitted from the ALFALFA sample, the conclusion is unchanged. Overall, the trends between log and are similar in all panels. In the high regime, galaxies that are more rich in Hi tend to have larger log. However, when gets sufficiently low, this correlation breaks down, i.e., log no longer depends on .
The turn over gas fraction () at which the log begins to break down seems to depend on . A visual inspection of Figure 3 suggests that at log, log, while at log, log. We speculate that could be somewhat related to the depth of the Hi survey used. Nevertheless, for the mass range we probed, it should be safe to conclude that log positively correlates with at log.
Figure 3 clearly demonstrates that there exists a positive correlation between size and Hi fraction at log. If an isomass-defined size indicator is used, this trend slightly weakens but still exists (see Appendix C). This suggests that the effect also contributes to dispersion of at fixed . We do not use an isomass-defined size indicator in the main body of this paper because this will significantly narrow down the dynamical range of size at fixed , making it difficult to examine the trend between size and Hi fraction. However, if an isomass-defined size indicator is used, the main conclusions of this work should also hold.
For convenience, we refer galaxies with log and log as Hi-rich and Hi-poor galaxies, respectively. For Hi-rich galaxies, we interpret the positive correlation between log and as a natural consequence of the “inside-out” disk formation scenario (e.g., Chiappini et al., 1997; Wang et al., 2011; Pérez et al., 2013; Pan et al., 2015). In theory, normal SFGs are assumed to live in a quasi-equilibrium phase balanced by gas accretion, star formation and outflows. In this case, galaxies with a high preferentially have a higher gas accretion rate (Wang et al., 2013). In the cold mode accretion, the accreted materials usually have high specific angular momentum that help forming an extended disk component (Stewart et al., 2011, 2013), which naturally results in a positive log correlation.
The weak correlation between log and exhibited in the Hi-poor regime implies that Hi-poor galaxies have a different disk growth mode compared to their gas-rich counterparts. As shown below, Hi-poor galaxies mainly distribute below the star formation main sequence (SFMS). This suggests that many Hi-poor galaxies are quenching their star formation, or have been quenched. During the quenching phase, external cold gas replenishment is expected to be blocked and galaxies have left the star-forming quasi-equilibrium phase (Peng et al., 2015). In this case, simply reflects the amount of the residual gas reservoirs of galaxies. We thus suggest that the weak correlation between size and Hi content shown in the log regime is not at odds with the inside-out disk formation scenario.
3.2 The Hi-to-stellar size ratio
Observationally, a SFG typically has an Hi gaseous disk that is more extended than its stellar disk. As stars are formed from cold gas, a comparison between the sizes of Hi disk and stellar disk may provide insights in understanding the role of Hi in regulating size growth. In the literature, the Hi size of a galaxy, , is defined as the diameter at which the Hi surface density reaches . Since both the ALFALFA and xGASS do not provide resolved Hi images, in this work we use an indirect method to estimate for individual galaxies. As first reported by Broeils & Rhee (1997), there exists a tight correlation between and . With a sample of galaxies compiled from literatures, Wang et al. (2016) revisited the relation and found
| (3) |
which is very close to the one reported by Broeils & Rhee (1997).
With the large galaxy sample in hand, Wang et al. (2016) further quantified the dispersion of the relation, finding dex (or 14%). This scatter is independent of other galactic properties, such as luminosity, , Hi-to-luminosity ratio, etc. Remarkably, galaxies across the Hubble types (from early-type, Sa-Sd, dIrr to even ultra-diffuse galaxies) all follow a same relation (Wang et al., 2016; Leisman et al., 2017). Since the galaxy samples of Wang et al. (2016) and this work cover a similar range in redshift and , in this paper we use equation (3) to infer for the ALFALFA and xGASS galaxies. We discuss in more detail in Appendix B to show that this application should be valid.
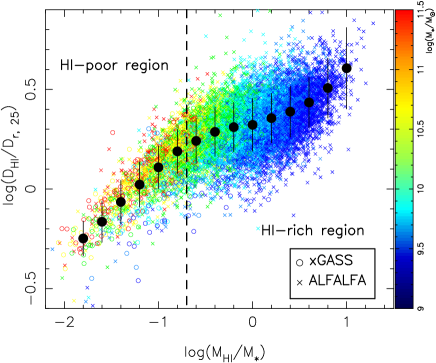
Figure 4 shows as a function of . Inspired by Figure 3, we first divide the galaxies into 2 subsamples according to , with a demarcation line of log. For the Hi-poor sample, is quite tightly correlated with , in the sense that more Hi-poor galaxies have a lower ratio. For the Hi-rich sample, the correlation between these two quantities significantly weakens. Note that there exists an up-bending in the relation at the high end. This feature is due to selection effect. We have checked and confirmed that a significant fraction of the galaxies with have similar but lower compared to their massive counterparts. When galaxies with galaxies are included, the up-bending feature shown at the high is absent.
At the low- end, Figure 4 should have missed some very low- galaxies due to the Hi detection limits of xGASS and ALFALFA. In the log regime, the ratio is mainly driven by (or ) since is no longer sensitive to (see Figure 3). Therefore, the Hi-undetected galaxies are expected to display in the extrapolation of the sequence defined by the Hi-detected galaxies with log.
Since is inferred from , Figure 4 thus also shows the interplay between , and similar to Figure 2 and Figure 3. After transforming into , one can find that the gas disk shrinks more significantly compared to the stellar disk once galaxies entering the gas-poor phase. This is likely due to the different disk growth behaviors at different galaxy evolutional phases, as we will argue below.
To investigate the Hi-to-stellar size ratio of Hi-rich galaxies more specifically, we show as a function of in Figure 5. Interestingly, the Hi-to-stellar size ratio of these galaxies is weakly correlated with . With a sample of 108 galaxies observed by the Westerbork Synthesis Radio Telescope, Broeils & Rhee (1997) found that is only weakly correlated with luminosity. We confirm the finding of Broeils & Rhee (1997) with a much larger sample and emphasize that this trend only holds for Hi-rich galaxies.
At this point, it is worthy to revisit the sizemass relation separately for the Hi-rich and Hi-poor galaxies. The results are shown in Figure 6. To be consistent with the previous sections, we also use a second-order polynomial to fit the sizemass relation. Overall, the sizemass relation of Hi-rich galaxies has a shallower slope and a larger dispersion than the one of Hi-poor galaxies. These features resemble those of the sizemass relations of star-forming and quiescent galaxies (see Figure 3 of van der Wel et al. 2014). On the one hand, this similarity is straightforward to interpret because the SFRs and Hi richness of galaxies are correlated, in the sense that SFGs tend to be more rich in Hi compared to quiescent galaxies. On the other hand, an Hi view of the sizemass relation provides new insights in understanding the origin of size scatter at fixed (also see Figure 3). In the next section, we will show that the size scatter of SFGs is correlated with Hi richness, rather than SFRs.
3.3 connections between Star formation rate, Hi fraction and Size
In a merger-free case, the size of a galaxy grows through in-situ star formation. This naturally predicts a link between size growth and star formation activity. To our knowledge, star formation is more physically correlated with molecular gas, rather than Hi gas. Why the size of Hi-rich galaxies strongly correlate with the Hi content? Is the size growth of Hi-rich galaxies due to enhanced star formation activities?
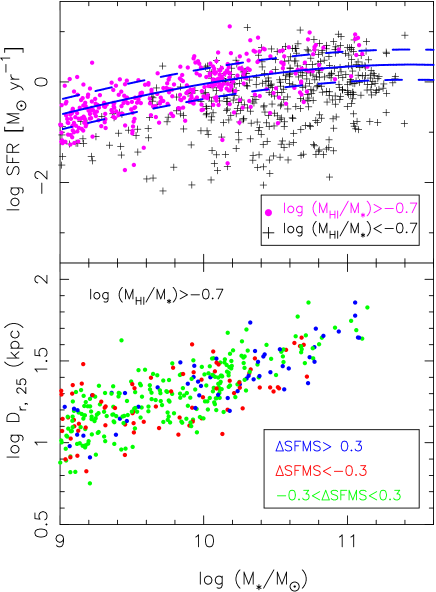
To answer these questions, we first examine the distribution of xGASS galaxies in the SFR plane to explore the correlation between Hi-richness and SFRs. The SFMS of xGASS galaxies is fitted by Saintonge et al. (2016), as shown in the blue solid line of Figure 7. It can be seen that Hi-rich galaxies distribute along the SFMS, i.e, they are mostly SFGs. In contrast, Hi-poor galaxies distribute more broadly, and the majority of them distribute below the SFMS. In low-mass regime of log, the Hi-poor galaxies mainly distribute below the SFMS. At the high-mass end, a significant fraction of the Hi-poor galaxies still distribute on the SFMS. This implies that many massive SFGs may be short in Hi gas supply. Saintonge et al. (2016) also argued that the flattening of the SFMS at the high mass end is primarily due to the decrease of cold gas reservoirs.
To explore the correlation between size and SFRs, we divide the Hi-rich xGASS galaxies into 3 subsamples according to their offset from the SFMS ridge line (, defined as ) and examine their locations in the sizemass plane. We only include Hi-rich galaxies since they are likely to live in an actively disk-growing phase, as discussed above. The result is shown in the bottom panel of Figure 7. Clearly, the location of galaxies in the sizemass plane is weakly dependent on , i.e, there is little correlation between SFR and size at fixed . This result is broadly consistent with that reported in Lin et al. (2020).
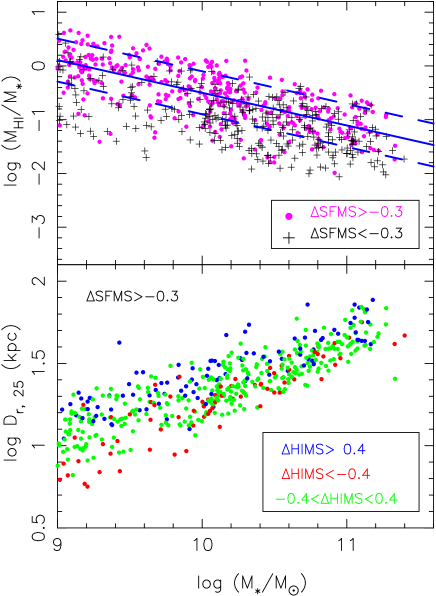
In the top panel of Figure 8, we show Hi fraction as a function of . Similar to the SFMS, we fit an Hi gas main sequence (HIMS) using xGASS galaxies near the SFMS (with ¿-0.3), as shown in the blue solid line. It can be seen that galaxies with ¿-0.3 generally have higher Hi fraction than those with ¡-0.3, but these two samples have significantly overlap in the diagram. Janowiecki et al. (2020) have investigated the HIMS based on the xGASS sample and reported a similar feature. When investigating the molecular gas fraction vs. stellar mass diagram, Janowiecki et al. (2020) found that the overlap is significantly reduced (see their Fig.2 and Fig.3).
In the bottom panel of Figure 8, we examine the sizemass relation of SFGs that with . Symbols are color coded by the offset of galaxies from the HIMS. As can be seen, at fixed , Hi-rich SFGs tend be more large in size. To conclude, at fixed , the size scatter of SFGs is more physically linked with their Hi content, rather than SFRs.
4 Discussion
4.1 size growth in the gas-rich phase
The central finding of this work is that the size of an Hi-rich galaxy is closely linked to its Hi fraction, rather than SFR. Since the majority of star formation occurs inside the stellar disk, a direct interpretation is that Hi-rich galaxies have a more extended star-forming disk than the Hi-normal ones. Previous works have studied the extension of star-forming disk through ultraviolet (UV) observations and investigated its relation to the Hi properties. Cortese et al. (2012) showed that the UV/optical size ratio of galaxies is tightly correlated with their Hi fraction, in the sense that Hi-rich galaxies tend to have larger UV/optical size ratios (see their Figure 6). This is qualitatively consistent with our findings.
In an inside-out disk growth scenario, the materials that build a stellar disk is primarily accreted from the surrounding environment. In this sense, the properties of a galaxy would be to a large extent shaped by the properties of the accreted material (such as specific angular momentum, accretion rate, etc). Based on a suite of 30 cosmological magneto-hydrodynamical zoom simulations, Grand et al. (2017) find that the sizes of galaxies are closely linked to the angular momentum of halo material. Galaxies with the largest disk size are produced by quiescent mergers that deposit high-angular momentum material into the pre-existing disc, simultaneously increasing the spin of dark matter and gas in the halo. In the observational work of Huang et al. (2012), the authors studied the spin parameter for the ALFALFA galaxies, finding that Hi-rich galaxies tend to reside in high halos. A similar conclusion is reached by the recent work of Mancera Piña et al. (2021), who show that gas-rich disk galaxies tend to have high specific angular momentum. This can be interpreted since gas with high specific angular momentum is more difficult to collapse and convert into stars, which naturally results in a high ratio. We thus suggest that angular momentum is the key parameter behind the relation between size and Hi fraction.
Our study also suggests that cold gas accretion should exist in the majority of Hi-rich galaxies. As shown in Figure 7, these galaxies are mostly normal SFGs. If gas replenishment does not exist, the Hi disks of galaxies will shrink due to continuous gas consumption via star formation. In addition, without the acquisition of angular momentum from accreted materials (Stewart et al., 2011, 2013), kinematic evolution will drive the remaining gas settling towards galactic central regions, leading to a shrink of the gaseous disk. As a result, will decrease towards lower . Figure 4 demonstrates that this is true at log, suggesting that Hi-poor galaxies likely have their Hi supply shut down.
In the “bathtub” model (e.g., Bouché et al., 2010; Davé et al., 2011; Lilly et al., 2013; Forbes et al., 2014; Peng & Maiolino, 2014), galaxies will approach a quasi-equilibrium phase when cold gas replenishment, star formation and gas outflows reach a balance. The weak correlation between and at log is likely a manifestation of this phase. There is other observational evidence supporting that galaxies will experience such a phase during their lifetime, for example, the existence of a tight SFMS among SFGs from to (e.g., Brinchmann et al., 2004; Noeske et al., 2007; Elbaz et al., 2007; Karim et al., 2011; Speagle et al., 2014; Tasca et al., 2015). Galaxies on the ridge of the SFMS typically have disk-like structures (Wuyts et al., 2011), suggesting that disk growth is actively occurring in this phase.
4.2 size growth in the gas-poor phase
In the Hi-poor regime, we find that size is weakly correlated with Hi fraction. As shown in Figure 7, galaxies that with log typically distribute below the SFMS. Note that a significant fraction of massive SFGs also have log, and we speculate many of them are undergoing star formation quenching. By modeling the galaxy number density in the NUV color space, Lian et al. (2016) concluded that at log()10.5 about 45% of the SFGs are undergoing quenching. For Milky-Way mass SFGs, Pan et al. (2017) suggested that their mass budget has been dominated by a quenched component, also implying on-going quenching processes are actively taking place at the massive end. Although many massive galaxies still appear “star-forming” at present, the quenching progress will push them migrating onto the “dead sequence” with a time scale of gigayears (Schawinski et al., 2014; Peng et al., 2015; Lian et al., 2016; Hahn et al., 2017).
In the scenario of star formation quenching, Hi-poor galaxies grow their sizes primarily via mergers. As shown in Catinella et al. (2010), Hi-poor galaxies preferentially have bulge-dominated (early-type) morphologies. Shen et al. (2003) show that the sizemass relation of SDSS early-type galaxies (ETGs) is consistent with the assumption that they are the remnants of major mergers of present-day disks. In this sense, the size scatter of ETGs should be more physically related with their merger histories, rather than the current gas content.
However, it should be noted that not every Hi-poor galaxy is necessarily to be quenched or undergoing quenching. For example, numerical studies show that SFGs in the lower envelope of the SFMS typically have lower gas fraction and longer gas depletion time scale () than their counterparts on the SFMS ridge (Tacchella et al., 2016). These galaxies will quench star formation if their gas replenishment time scale () is longer than . In the case of , they will evolve back to the SFMS ridge and become gas rich again. It is difficult to quantify the fraction of galaxies with in the Hi-poor regime, but the size growth of such galaxies should also follow the scenario discussed for the Hi-rich galaxies.
5 Summary
In this paper, we study the role of Hi gas in regulating size growth of local galaxies using galaxy samples from the xGASS and ALFALFA survey. In the Hi-rich regime, galaxies that are more rich in Hi tend to have larger sizes, which we interpret as a natural consequence of the “inside-out” disk assembly. This trend is absent in the Hi-poor regime, indicating that size growth is barely affected by Hi gas when it has declined to a sufficiently low level. We also study the relations between size, Hi-fraction and SFR, finding that size is more intrinsically linked with Hi fraction, rather than SFR. The Hi-to-stellar size ratio of Hi-rich galaxies is found to be weakly dependent on . We conclude that in the Hi-rich phase, size growth is primarily achieved by star formation. The size dispersion at fixed is probably driven by the angular momentum of the accreted materials.
Appendix A The reliability of SDSS-measured
It is known that the automatic SDSS photometry pipeline is not reliable for angularly large sources, which is mainly due to the problems in background substraction and blending large galaxies into multiple sources (West et al., 2010). Since in this work we are going to use as a size indicator, we first need to check whether is reliably measured by the SDSS photometry pipeline.
To do this, we compare the band isophotal radii at the surface brightness of 25.0 () provided by the SDSS pipeline with those measured by Wang et al. (2013) for the Blue disk sample, which contains 50 galaxies with log(. The result is shown in Figure 9. As can be seen, the SDSS-measured band is slightly smaller than those measured by the Wang’s pipeline (. This is due to the systematics of these two pipelines. Since the band is similar to that measured in the band, we conclude that the SDSS measurement is reliable at least for galaxies with arcsec.
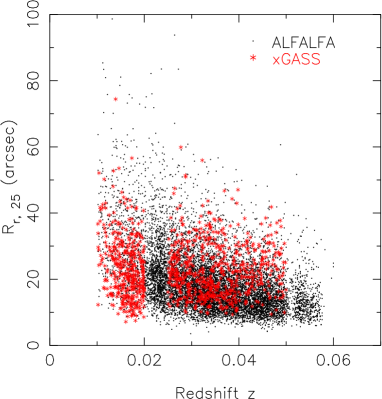
Figure 10 shows the band as a function of redshift for the ALFALFA and xGASS samples. As can be seen, the majority of the galaxies have arcsec, i.e., they are not very extended sources. We thus conclude that the provided by the SDSS database can be used in our statistical study.

Appendix B Do ALFALFA and xGASS galaxies follow the relation?
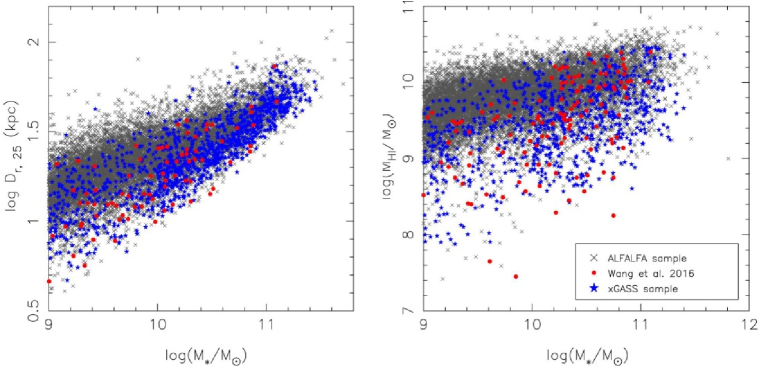
The presented in this work is inferred from the relation, rather than from direct measurements. To make our analysis work, we first need to verify that the ALFALFA and xGASS Hi-detected galaxies also follow the relation. Since spatially-resolved Hi imaging data are not available for ALFALFA and xGASS, a directly investigation of the relation for ALFALFA and xGASS is not feasible. We thus use an indirect approach to access whether the ALFALFA and xGASS galaxies follow the relation. We do this by placing the ALFALFA and xGASS galaxies together with Wang et al. (2016) sample in the and plane to examine the parameter distributions of these samples. At fixed , if ALFALFA and xGASS Hi-detected galaxies were more Hi-deficient than Wang’s sample, then it may be problematic to apply the relation to ALFALFA and xGASS. If not, the ALFALFA and xGASS galaxies should also follow the the same relation established by Wang et al. (2016).
To derive the stellar mass for Wang’s sample, we cross-identified the sample galaxies with SDSS footprints, yielding a sample of 195 galaxies. We then estimated the stellar masses of these galaxies using equation (2). In left and right panel of Figure 11, we show the parameter distribution of these three samples in the and space, respectively. Overall, the xGASS galaxies cover a similar region as Wang’s sample in both parameter spaces. It can be seen that at log, the ALFALFA galaxies appear to be systematically more gas rich than Wang’s sample. This is because the ALFALFA survey is biased to Hi rich galaxies. At high-masses, these two samples cover a similar parameter region, which is due to the fact that Wang’s sample includes 23 galaxies that with unusually high Hi mass fraction drawn from the Bluedisk project (Wang et al., 2013). Since Wang’s sample well follow the relation, we are thus confident that the Hi-detected galaxies from ALFALFA and xGASS should also follow this relation since they do not appear to be more Hi-deficient.
Appendix C Replacing with
In this work, the size of a galaxy is defined by . Taking the variation of mass-to-light ratio () among galaxies into account, a size definition with fixed stellar mass surface density could be more physically meaningful (Trujillo et al., 2020). We have selected a sample of 3700 ALFALFA galaxies with log to compute their stellar mass density profiles based on the SDSS public photometric data. The sample galaxies are selected to have minor-to-major axis ratio of , and . The SDSS pipeline measures the surface brightness profile of galaxies in five bands () in a series of circular annuli of fixed angular size. For each galaxy, we first corrected the annular photometry for Galactic extinction and correction for each annulus. Then a spline was fit to the cumulative light profile (to conserve flux), which was then differentiated to derive the surface brightness profile interpolated over a grid of angular sizes in . The surface brightness profile was then converted into stellar mass surface density profile using the mass-to-light ratio expressed in equation (2).
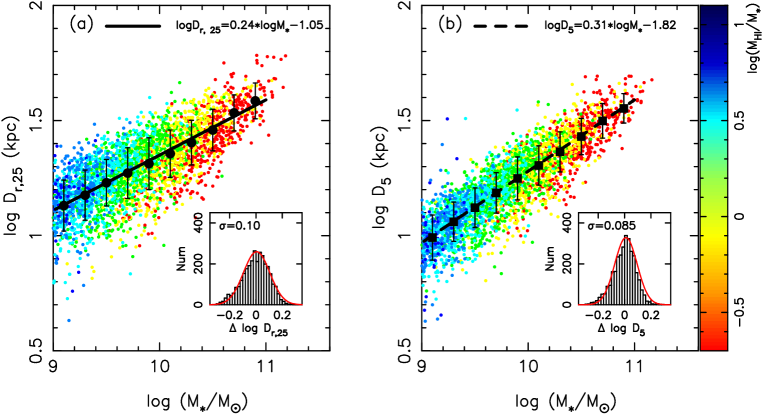
We select a new sample rather than use the original sample presented in the main body of the paper to do this test because: (1) only at log galaxy size shows a clear dependence on Hi richness; (2) it is difficult to measure the stellar mass density profile for edge-on galaxies. For this sample, we use to define the size of a galaxy, where is the diameter at which the stellar mass surface density reaches . In Trujillo et al. (2020), the authors use as a size indicator. We do not use because our photometric data is shallower than those used in Trujillo et al. (2020), which may result in large uncertainties in the measurement. In left and right panel of Figure 12, we show the and relations for our sample galaxies, respectively. To be consistent with Trujillo et al. (2020), we use a linear function to fit both relations. As can be seen, the relation is tighter and steeper than the relation. A similar feature is also reported by Trujillo et al. (2020). At fixed stellar mass, Hi-rich galaxies also tend to have larger , although this feature is less evident than that revealed in the relation. We thus conclude that the positive correlation between size and Hi richness for Hi-rich galaxies can not be fully due to the effect.
References
- Bell et al. (2003) Bell, E. F., McIntosh, D. H., Katz, N., & Weinberg, M. D. 2003, ApJS, 149, 289
- Bouché et al. (2010) Bouché, N., Dekel, A., Genzel, R., et al. 2010, ApJ, 718, 1001
- Broeils & Rhee (1997) Broeils, A. H., & Rhee, M.-H. 1997, A&A, 324, 877
- Brown et al. (2015) Brown, T., Catinella, B., Cortese, L., et al. 2015, MNRAS, 452, 2479
- Brinchmann et al. (2004) Brinchmann, J., Charlot, S., White, S. D. M., et al. 2004, MNRAS, 351, 1151
- Catinella et al. (2010) Catinella, B., Schiminovich, D., Kauffmann, G., et al. 2010, MNRAS, 403, 683
- Catinella et al. (2018) Catinella, B., Saintonge, A., Janowiecki, S., et al. 2018, MNRAS, 476, 875
- Chabrier (2003) Chabrier, G. 2003, PASP, 115, 763
- Chiappini et al. (1997) Chiappini, C., Matteucci, F., & Gratton, R. 1997, ApJ, 477, 765
- Chen et al. (2020) Chen, X., Wang, J., Kong, X., et al. 2020, MNRAS, 492, 2393
- Cortese et al. (2012) Cortese, L., Boissier, S., Boselli, A., et al. 2012, A&A, 544, A101
- Dale et al. (2016) Dale, D. A., Beltz-Mohrmann, G. D., Egan, A. A., et al. 2016, AJ, 151, 4.
- Davé et al. (2011) Davé, R., Finlator, K., & Oppenheimer, B. D. 2011, MNRAS, 416, 1354
- de Vaucouleurs (1948) de Vaucouleurs, G. 1948, Annales d’Astrophysique, 11, 247
- Elbaz et al. (2007) Elbaz, D., Daddi, E., Le Borgne, D., et al. 2007, A&A, 468, 33
- Fang et al. (2013) Fang, J. J., Faber, S. M., Koo, D. C., & Dekel, A. 2013, ApJ, 776, 63
- Frankel et al. (2019) Frankel, N., Sanders, J., Rix, H.-W., et al. 2019, ApJ, 884, 99
- Forbes et al. (2014) Forbes, J. C., Krumholz, M. R., Burkert, A., & Dekel, A. 2014, MNRAS, 438, 1552
- Giovanelli et al. (2005) Giovanelli, R., Haynes, M. P., Kent, B. R., et al. 2005, AJ, 130, 2598
- Graham (2019) Graham, A. W. 2019, PASA, 36, e035
- Grand et al. (2017) Grand, R. J. J., Gómez, F. A., Marinacci, F., et al. 2017, MNRAS, 467, 179
- Hahn et al. (2017) Hahn, C., Tinker, J. L., & Wetzel, A. 2017, ApJ, 841, 6
- Huang et al. (2012) Huang, S., Haynes, M. P., Giovanelli, R., & Brinchmann, J. 2012, ApJ, 756, 113
- Huang et al. (2014) Huang, S., Haynes, M. P., Giovanelli, R., et al. 2014, ApJ, 793, 40
- Hopkins et al. (2009) Hopkins, P. F., Hernquist, L., Cox, T. J., et al. 2009, ApJ, 691, 1424
- Janowiecki et al. (2020) Janowiecki, S., Catinella, B., Cortese, L., et al. 2020, MNRAS, 493, 1982
- Karim et al. (2011) Karim, A., Schinnerer, E., Martínez-Sansigre, A., et al. 2011, ApJ, 730, 61
- Kauffmann (2015) Kauffmann, G. 2015, MNRAS, 450, 618
- Yim & van der Hulst (2016) Yim, K. & van der Hulst, J. M. 2016, MNRAS, 463, 2092
- Kroupa (2001) Kroupa, P. 2001, MNRAS, 322, 231
- Lange et al. (2015) Lange, R., Driver, S. P., Robotham, A. S. G., et al. 2015, MNRAS, 447, 2603
- Leisman et al. (2017) Leisman, L., Haynes, M. P., Janowiecki, S., et al. 2017, ApJ, 842, 133
- Lian et al. (2016) Lian, J., Yan, R., Zhang, K., & Kong, X. 2016, ApJ, 832, 29
- Lilly et al. (2013) Lilly, S. J., Carollo, C. M., Pipino, A., Renzini, A., & Peng, Y. 2013, ApJ, 772, 119
- Lin et al. (2020) Lin, L., Faber, S. M., Koo, D. C., et al. 2020, ApJ, 899, 93
- Mancera Piña et al. (2021) Mancera Piña, P. E., Posti, L., Pezzulli, G., et al. 2021, arXiv:2107.02809
- Marsters (2005) Masters,K. L., 2005, PhD thesis, Cornell Univ.
- Noeske et al. (2007) Noeske, K. G., Weiner, B. J., Faber, S. M., et al. 2007, ApJ, 660, L43
- Pan et al. (2015) Pan, Z., Li, J., Lin, W., et al. 2015, ApJ, 804, L42
- Pan et al. (2017) Pan, Z., Zheng, X., & Kong, X. 2017, ApJ, 834, 39
- Peng & Maiolino (2014) Peng, Y.-j., & Maiolino, R. 2014, MNRAS, 443, 3643
- Peng et al. (2015) Peng, Y., Maiolino, R., & Cochrane, R. 2015, Nature, 521, 192
- Pérez et al. (2013) Pérez, E., Cid Fernandes, R., González Delgado, R. M., et al. 2013, ApJ, 764, L1
- Pichon et al. (2011) Pichon, C., Pogosyan, D., Kimm, T., et al. 2011, MNRAS, 418, 2493
- Pohlen & Trujillo (2006) Pohlen, M. & Trujillo, I. 2006, A&A, 454, 759
- Saintonge et al. (2016) Saintonge, A., Catinella, B., Cortese, L., et al. 2016, MNRAS, 462, 1749.
- Schawinski et al. (2014) Schawinski, K., Urry, C. M., Simmons, B. D., et al. 2014, MNRAS, 440, 889
- Scott et al. (2017) Scott, N., Brough, S., Croom, S. M., et al. 2017, MNRAS, 472, 2833
- Schlegel et al. (1998) Schlegel, D. J., Finkbeiner, D. P., & Davis, M. 1998, ApJ, 500, 525
- Shen et al. (2003) Shen, S., Mo, H. J., White, S. D. M., et al. 2003, MNRAS, 343, 978
- Speagle et al. (2014) Speagle, J. S., Steinhardt, C. L., Capak, P. L., & Silverman, J. D. 2014, ApJS, 214, 15
- Stewart et al. (2011) Stewart, K. R., Kaufmann, T., Bullock, J. S., et al. 2011, ApJ, 738, 39
- Stewart et al. (2013) Stewart, K. R., Brooks, A. M., Bullock, J. S., et al. 2013, ApJ, 769, 74
- Taylor et al. (2011) Taylor, E. N., Hopkins, A. M., Baldry, I. K., et al. 2011, MNRAS, 418, 1587
- Tacchella et al. (2016) Tacchella, S., Dekel, A., Carollo, C. M., et al. 2016, MNRAS, 457, 2790.
- Tasca et al. (2015) Tasca, L. A. M., Le Fèvre, O., Hathi, N. P., et al. 2015, A&A, 581, A54
- Trujillo et al. (2020) Trujillo, I., Chamba, N., & Knapen, J. H. 2020, MNRAS, 493, 87
- van der Wel et al. (2014) van der Wel, A., Franx, M., van Dokkum, P. G., et al. 2014, ApJ, 788, 28
- Wang et al. (2011) Wang, J., Kauffmann, G., Overzier, R., et al. 2011, MNRAS, 412, 1081
- Wang et al. (2013) Wang, J., Kauffmann, G., Józsa, G. I. G., et al. 2013, MNRAS, 433, 270
- Wang et al. (2016) Wang, J., Koribalski, B. S., Serra, P., et al. 2016, MNRAS, 460, 2143
- Wang et al. (2018) Wang, J., Zheng, Z., D’Souza, R., et al. 2018, MNRAS, 479, 4292
- West et al. (2010) West, A. A., Garcia-Appadoo, D. A., Dalcanton, J. J., et al. 2010, AJ, 139, 315
- Wuyts et al. (2011) Wuyts, S., Förster Schreiber, N. M., van der Wel, A., et al. 2011, ApJ, 742, 96
- Yıldız et al. (2017) Yıldız, M. K., Serra, P., Peletier, R. F., Oosterloo, T. A., & Duc, P.-A. 2017, MNRAS, 464, 329
- York et al. (2000) York, D. G., Adelman, J., Anderson, J. E., Jr., et al. 2000, AJ, 120, 1579