Interpretable Business Survival Prediction
Résumé
The survival of a business is undeniably pertinent to its success. A key factor contributing to its continuity depends on its customers. The surge of location-based social networks such as Yelp, Dianping, and Foursquare has paved the way for leveraging user-generated content on these platforms to predict business survival. Prior works in this area have developed several quantitative features to capture geography and user mobility among businesses. However, the development of qualitative features is minimal. In this work, we thus perform extensive feature engineering across four feature sets, namely, geography, user mobility, business attributes, and linguistic modelling to develop classifiers for business survival prediction. We additionally employ an interpretability framework to generate explanations and qualitatively assess the classifiers’ predictions. Experimentation among the feature sets reveals that qualitative features including business attributes and linguistic features have the highest predictive power, achieving AUC scores of 0.72 and 0.67, respectively. Furthermore, the explanations generated by the interpretability framework demonstrate that these models can potentially identify the reasons from review texts for the survival of a business.
I Introduction
“Customer Is King” is a ubiquitous motto followed by several businesses. With the rise of technology, online reviews regarding businesses have become increasingly relevant as a measurement of customer satisfaction. A working paper from Harvard Business School [1] concluded that non-chain restaurants in Yelp gain 5% to 9% in revenue with a one-star increase in rating. The online perception of businesses on social media thus has a bearing on their survival.
Recently, several works have leveraged location-based social network (LBSN) platforms to engineer features and inference models to predict business survival. Tayeen et al. [2] develop features to capture housing affordability, education, and tourism near restaurants in Yelp to predict their success. D’Silva et al. [3] and Lian et al. [4] model the geography and customer visitation patterns among businesses in Foursquare and Dianping, respectively. However, All the aforementioned features are quantitative involving complex formulations. Developing qualitative features are highly sought after as they are more comprehensible. Still, investigations on extracting qualitative features are limited to Lian et al. [4] who reveal that reviews possess high predictive power in this prediction task. In this work, we thus engineer an extensive feature set including quantitative features from geography and user mobility and qualitative features from (i) business attributes and (ii) linguistic modelling.
Nevertheless, we believe that simply predicting the survival of a business is not adequate. The classifiers must be augmented with interpretability to generate explanations for the predictions. These explanations can provide avenues for businesses to improve upon. For example, if the classifier predicts a lower chance of a business’s survival due to its pricing, the business may adjust to a more competitive pricing. Furthermore, applying interpretability to the classifier allows us to qualitatively assess whether it identifies human-intuitive features about business survival [5, 6].
Thus, this work tackles the following research questions:
-
—
RQ1: What qualitative features can be effectively incorporated to the business survival prediction problem?
-
—
RQ2: Can an interpretability framework provide human-intuitive explanations to the predictions of the classifiers?
First of all, we attempt to perform business survival prediction from the Yelp dataset. While the dataset includes businesses from several categories, we only consider restaurants. This work can still be generalised to other business categories. We then formulate a survival prediction task. We only consider restaurants in the dataset that are open till the end of 2017 and predict their survival by the end of 2019. This yields a total of 36,190 restaurants with 12.8% of them labelled dead by the end of 2019.
Then, we follow feature engineering performed by D’Silva et al. [3] to capture the geography and user mobility of the restaurants. The geographical features primarily represent competition, business category counts and attractiveness of the neighbourhood of a restaurant. The user mobility features represent the transitions of customers among these businesses by modeling the inflow and outflow, temporal popularity skew, temporal alignment with competitors and visit trends for each restaurant. We then employ several machine learning models to predict business survival. The best-performing model yields an AUC score of 0.62 with reasonable explanations for the predictions. We adopt the representative explainable machine learning method, LIME [7], which is a model-agnostic framework to generate explanations for predictions made by our models.
Next, our work explores several business attributes provided in the Yelp dataset for this task. These attributes include Pricing, Ambience, Restrictions, Amenities, Services as well as Image and Review counts. Improved performance is achieved when compared with survival prediction using geography and user mobility features. The best model achieved an AUC score of 0.72 along with qualitative interpretations of the predictions.
Additionally, for linguistic modelling, we follow Lian et al. [4] and take a bag-of-words approach for predicting business survival through customer reviews. As a further improvement, we also implement a recurrent neural network to better capture the long-term dependencies within the language of the reviews. We also explore an alternative prediction task of sentiment analysis of customers from reviews to better capture their perceptions regarding restaurants. Empirical results suggest that the sentiment analysis task yields a better AUC score of 0.98 while survival prediction only yields an AUC score of 0.67. Explanations from the linguistic models also demonstrate that the sentiment analysis models effectively capture customers’ impressions than the survival prediction counterparts.
Finally, we perform an ablation study to evaluate the performance of combining different features. Results reveal that business attributes and linguistic features perform the best among all the different combinations of the developed predictors, demonstrating the effectiveness of qualitative feature sets. Yet, these two features perform significantly better individually.
The rest of this paper is organised as follows. Section II discusses some recent literature that inspired the features and models employed in this work. Section III details the dataset utilised and formulates our problem statement. Sections IV through VI entail the feature extraction and prediction models implemented across the four feature sets and analyses of the results. We conclude and call for future work in Section VIII.
II Related Work
Early literature in this area originates from the finance and management field that investigates bankruptcy prediction [8, 9, 10]. However, these works utilise several financial variables which are difficult to acquire.
Alternatively, several recent investigations have leveraged the data generated by LBSNs for business survival prediction [11, 12, 3, 2, 4]. Works that are closest in spirit to our problem context include D’Silva et al. [3] and Lian et al. [4] who model the geography and customer visitation patterns among businesses in Foursquare and Dianping respectively. However, their proposed features are quantitative involving complex formulations. Developing more qualitative features are highly sought after as they are more comprehensible. Still, investigations on extracting qualitative features are limited to Lian et al. [4] who reveal that reviews possess high predictive power in this prediction task which bolsters our argument on the inclusion of qualitative features from reviews for this prediction task.
Another highly relevant area for this work is interpretable machine learning. The literature of interpretability is primarily focused on two approaches to provide explanations or more information about the models’ predictions [6]. One direction is to adopt « weight-box » models that are inherently explainable such as decision tree, logistic regression models. The other is to develop methods such as PDP [13], LIME [7], SHAP [14] to explain « black-box » models that produce a mere prediction result (e.g., deep neural networks). LIME is a model-agnostic framework that approximates the local neighbourhood of a prediction of interest to generate explanations for this prediction from a model. In this work, we employ LIME which is a representative framework for interpretable machine learning [15] to obtain interpretability for various feature sets and different models that we have employed.
At a glance, this work aims to develop interpretable classifiers to predict business survival using insights cultivated from user-generated content on an LBSN and derive the explanations for the classifiers’ predictions.
III Data and Problem Statement
In this section, we first describe the datasets employed for our analysis including some preliminary statistics on its attributes. We then formalise our business survival prediction task based on these datasets.
III-A Yelp Dataset
The principal dataset utilised in this work is the publicly available Yelp dataset. Yelp is the world’s largest platform for customer reviews and covers a wide range of data including business, geographical and meta information and customer engagement through reviews, check-ins and image uploads. Table I provides some basic statistics on this dataset.
| # businesses | # reviews | # check-ins | # images |
| 209,393 | 7,734,455 | 21,003,777 | 200,000 |
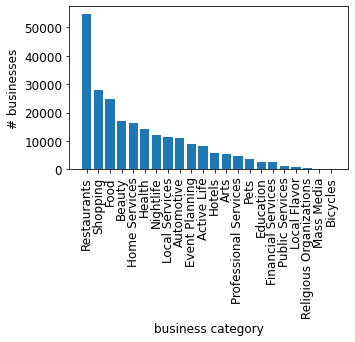
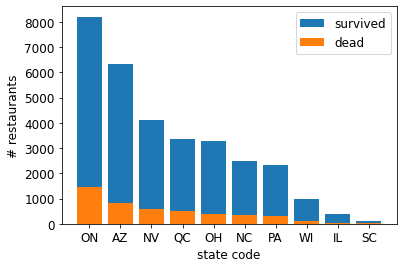
The businesses in the Yelp dataset are further divided into 22 categories as summarised in Figure 1. Furthermore, the dataset has a diverse set of attributes catered to the specific category of business. For example, restaurants have attributes such as TakeOut, Attire, Delivery, while hair salons have attributes such as HairSpecializesIn. There is no intersection in features among these two categories of businesses, i.e. HairSpecializesIn is set to null for restaurants and vice versa. This could lead to very sparse data. Hence, this study is only focused on the restaurants’ category because this category not only has the largest number of businesses but also the largest number of attributes, which then would aid our prediction in a way that it gives more data to process. Finally, the restaurants are also geographically grouped into 9 states and provinces across the United States and Canada as shown in Figure 2. This allows us to consider businesses under various socioeconomic conditions.
III-B Survival Prediction
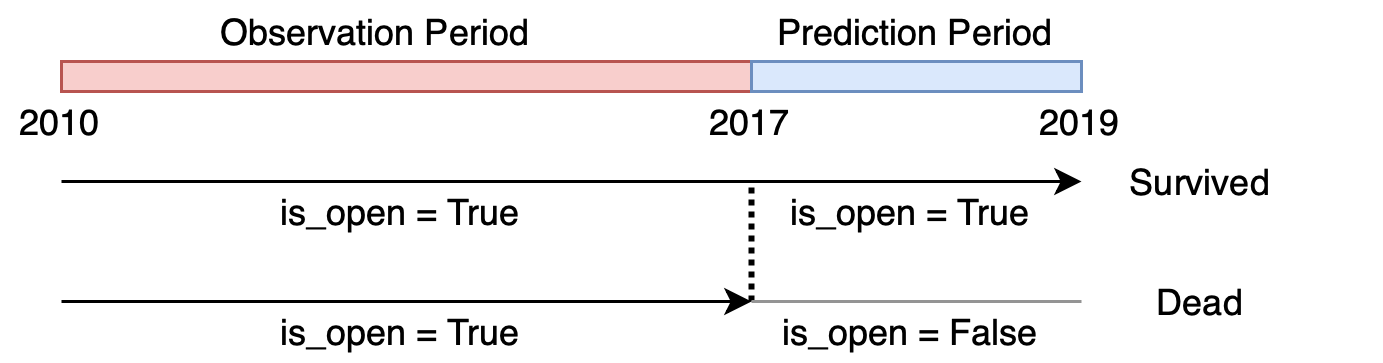
We now turn our attention to the definition of the business survival prediction problem. The objective is to predict whether a business will remain open or face closure after a fixed duration of time given several attributes regarding the business. The Yelp dataset provides a boolean attribute is_open which indicates the closure status of a business indefinitely in time. The date of the business closure must be known to define the start-of-future (SOF) for the prediction task. Hence, we leverage the fact that Yelp updates its dataset annually. This study employs two versions of the Yelp dataset from 2017 and 2019 and the survival label is determined as follows. We define the observation period to be from the date of inception of Yelp to the end of 2017 and the prediction period from the start of 2018 till the end of 2019. We only consider businesses that have is_open set to True in the observation period. A business is labelled as survived if it is then open at the end of the prediction period and dead otherwise. Figure 3 is a visual depiction of our problem statement. Based on the above timeframe, we obtain a dataset with the composition of survived and dead restaurants as shown in Table II.
| Dataset | # open | # closed |
|---|---|---|
| Yelp (2017) | 36,190 | 13,106 |
| Yelp (2019) | 31,617 | 17,679 |
| # survived | # dead | |
| Ours | 31,546 | 4,644 |
IV Geography and User Mobility Modelling
As investigated by [3, 4], the performance of a restaurant is highly dependent on its location and customer satisfaction. The two works thus perform extensive feature engineering to model these two aspects of a business’s success. Following D’Silva et al. [3], we develop locality profiles and user mobility features for restaurants in the Yelp dataset.
IV-A Locality Profiles
The locality or the neighbourhood of a restaurant is defined as the set of other businesses within a radius of 500m based on prior work [16]. Though the prediction is performed only for restaurants, businesses of all categories are considered for the neighbourhood. The following features are then employed.
IV-A1 Competition
The competition to a restaurant is the ratio of businesses in the neighbourhood that are restaurants.
| (1) |
returns true if is a restaurant.
IV-A2 Specific Competition
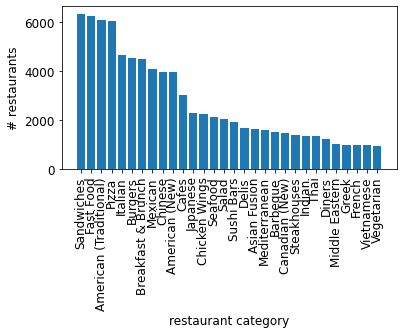
The restaurants’ category in the Yelp dataset is further divided into 145 subcategories based on the cuisines served and Figure 4 depicts the number of restaurants serving the top 30 cuisines in the dataset. The specific competition for a business is then the ratio of restaurants in its neighbourhood serving the same cuisine.
| (2) |
is true if restaurants and serve the same cuisine.
IV-A3 Category Counts
The business category and the restaurant sub-category counts within the neighbourhoods are also tallied as features. The category and sub-category counts are represented as 22-element and 145-element vectors respectively.
IV-A4 Place Entropy
To represent the diversity in competition within the neighbourhood, the place entropy measures the Shannon Entropy of the probabilities of the business categories in the restaurant’s neighbourhood.
| (3) |
IV-A5 Neighbourhood Attractiveness
This metric is developed to capture a more global view of a restaurant’s neighbourhood compared to other neighbourhoods by utilising a TF-IDF approach. This metric is measured both at the business category and restaurant sub-category level. The documents are analogous to the business categories and sub-categories and their constituent term frequencies are analogous to the category and sub-category counts discussed earlier. Thus, this metric yields two vectors at the category and sub-category levels with the same dimensions.
| (4) | |||||
| (5) |
IV-B User Mobility
The customer visit patterns among these restaurants will now be modelled. Prior works [3, 4] employ datasets from the platforms Foursquare and Dianping respectively which are similar to Yelp. These platforms include an additional type of customer engagement called transitions. A transition occurs when a user makes consecutive check-ins to the two businesses within a day. The check-ins in the Yelp dataset cannot be identified by the users that made them, yet the reviews can be identified by users. Hence, we utilise all consecutive pairs of reviews from a user as transitions from the user.
IV-B1 Inflow and Outflow
This class of metrics measure the number of transitions to and from a restaurant during the restaurant’s lifespan. Since the start date of a business is not available in Yelp, it is determined from the time of the first check-in or review received by the restaurant. The inflow and outflow are then formally defined as
| (6) | |||||
| (7) |
where M is the lifespan of the restaurant in months and is an identity function which returns 1 if there exists a transition between businesses and and 0 otherwise.
IV-B2 Distance and Speed Travel
The average distance and speed travelled across all transitions occurring to and from a restaurant are also measured.
| (8) | |||||
| (9) | |||||
| (10) | |||||
| (11) |
where and are sets of businesses with transitions to and from the restaurant and and return the distance and speed of transitions.
IV-B3 Temporal Popularity Skew
The temporal profile of a business is defined as the normalised number of check-ins for each hour of the day and is represented as a 24-element vector. The temporal popularity skew then measures the entropy of the restaurant’s temporal profile to determine if check-ins to the restaurant are local to a few hours within the day or spread evenly across the day.
| (12) |
IV-B4 Temporal Alignment with Competitors
This metric measures the distance between the temporal profile of the restaurant and the aggregated temporal profile of the businesses within the neighbourhood . The aggregation of temporal profiles is the average number of check-ins for each hour of the day across the neighbouring businesses.
| (13) |
IV-B5 Visit Trend
The visit trend determines the trend of the number of check-ins per month for a restaurant during the last six months of the observation period. This metric is measured by determining the slope of the linear trend between the month and the number of check-ins.
| (14) |
where returns the number of check-ins received by restaurant over the time-span .
IV-C Prediction Models
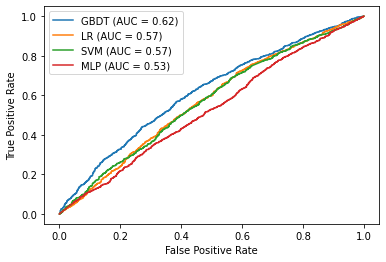
Since this is an imbalanced classification task as evidenced by Table II, we employ the SMOTE algorithm [17] to synthetically oversample the dead restaurant instances and evaluate the prediction models using the Area Under the ROC Curve (AUC) [18]. Both works [3, 4] employ four models namely Gradient Boosting Decision Trees (GBDT), Logistic Regression (LR), Support Vector Machine (SVM) and Multilayer Perceptron (MLP). Among them, GBDT performs best as demonstrated in Figure 6 with a reasonable AUC score of 0.62.
IV-D Explaining Results
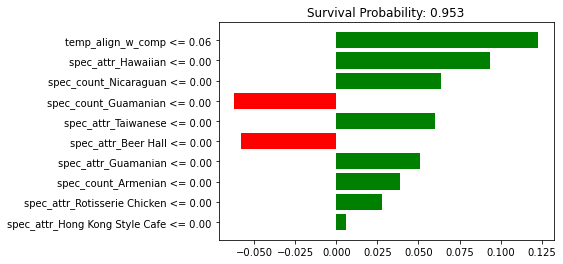
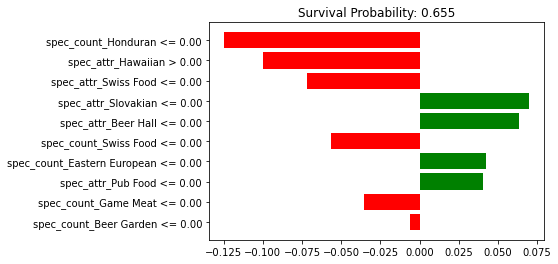
The focus of this work is not limited to demonstrating prediction models that outperform baselines. Qualitative explanations for the predictions must also be generated which would be highly insightful to business owners. To this end, the LimeTabularExplainer is employed on the GBDT model and predictions of certain example restaurants were explored. In most cases, it was observed that the neighbourhood attractiveness to different business categories and restaurant sub-categories constituted the top 10 most important features for the survival predictions.
Two examples were particularly interesting. As shown in Figure 5, a location of Planet Smoothie (the third largest American smoothie chain) in Arizona was predicted to survive with very low confidence of 65.5 % due to the presence of specific cuisines or the lack thereof in its neighbourhood. A more intriguing example is a seafood diner called Central Diner in Pennsylvania was predicted with very high confidence to survive due to its temporal alignment with its competitors and the lack of specific cuisines in its neighbourhood.
V Business Attributes
As discussed in section III, the Yelp dataset provides a plethora of business attributes. This work proposes to leverage these business attributes to predict business survival.
V-A Feature Extraction
Unlike the features discussed earlier, these features are qualitative and describe several aspects of restaurants.
V-A1 Pricing
pricing is an important aspect when deciding where to eat. The PriceRange attribute indicates the expensiveness of the restaurant’s menu and is represented as an integer-based rating with 1 being the least expensive and 4 being the most expensive.
V-A2 Ambience
The ambience of a restaurant is measured as a boolean vector of nine dimensions including Romantic, Intimate, Classy, Hipster, Divey, Touristy, Trendy, Upscale and Casual.
V-A3 Restrictions
Restrictions placed by the restaurants are also provided including DietaryRestrictions, AlcoholServed, GoodForKids, DogsAllowed and RestaurantAttire.
V-A4 Amenities
Several amenities available within the restaurant are also considered including OutdoorSeating, BikeParking, BusinessParking, Wifi and HasTV.
V-A5 Service
Restaurants also provide various auxillary services including TakesReservations, HappyHour.
V-A6 Image and Review counts
For each restaurant, we also aggregate the total number of images and reviews it received from its customers.
V-B Prediction Models
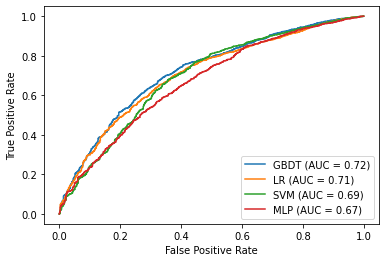
Similar to section IV, we evaluate the survival predictions from these business attributes across four models including GBDT, MLP, LR and SVM. The resulting ROC curves are reported in Figure 8. The GBDT model performs the best achieving an AUC score of 0.72. It is also interesting to note that, all models outperform their counterparts from figure 6. This suggests that business attributes are significantly better features at predicting business survival.
V-C Explaining Results
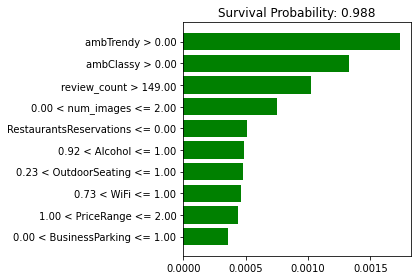
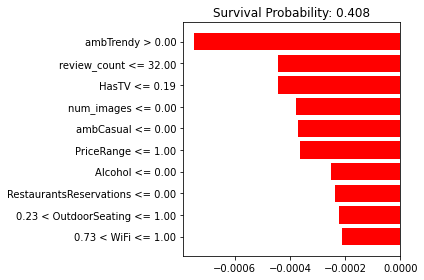
We now refer back to the case of Central Diner and Planet Smoothie. As shown in Figure 7, the former has been predicted with very high confidence of 98.8% to survive mainly due to its trendy as well as classy ambience. In addition, it also has more than 149 reviews indicating that customers know in advance what they should be expecting. However, as seen in Figure 7, the latter has been predicted to not survive with a confidence of 59.2% mainly due to its trendy ambience and having less than 33 reviews. It can be observed that both restaurants had a trendy ambience, but one survives and the other does not. This can be attributed to fact that a trendy ambience is sought after by customers Central Diner’s locality while the same cannot be deduced about Planet Smoothie’s locality. In contrast, there is a large disparity in the number of reviews that each of the respective restaurants had and this attribute is present in the top 3 attributes for the highest predictive power of survival prediction. Thus, the low number of reviews could account for the restaurant not being able to survive even though it has a trendy ambience.
VI Linguistic Modelling
The reviews posted by customers on Yelp provide detail of their experiences of the restaurants. This section further delves into extracting qualitative features from the text that can reveal a great deal of information regarding the survival of the business. Following the work of Lian et al. [4], two models are explored for survival prediction. As a further improvement, we implement a sentiment analysis model as we believe that this task better captures the impressions of customers from text.
VI-A Feature Extraction
This section details various textual representations employed alongside the three models explored.
VI-A1 Review Text
Each restaurant received at least three reviews in the Yelp dataset in which customers detail their visits. These review texts are shifted to lower case and pre-processed to remove stop words and punctuations.
VI-A2 Rating
Along with the review, the customers must also provide a rating that is an integer between 1 to 5. To perform sentiment analysis, we follow Zhang et al. [19] and transform the review ratings into polarity scores by considering ratings 1 and 2 as negative and 3 and 4 as positive.
VI-A3 Bag-of-Words
The Bag-of-Words (BOW) feature involves determining the word counts across all the processed reviews for each restaurant. The recommended vocabulary size of 1000 words is utilised [4].
VI-B Prediction Models
Three prediction models are implemented across two prediction tasks namely survival prediction and sentiment analysis.
VI-B1 Survival Prediction
Following Lian et al. [4], we employ the BOW features of a restaurant to predict its survival. Since the prediction model employed is not mentioned, we examine GBDT and MLP. Lian et al. had also implemented a recurrent neural network (RNN) which did not perform as well as the BOW model. As future work, they also suggested the long short-term memory (LSTM) [20] to capture long-term dependencies within the reviews [21]. Hence, we implemented a single layer LSTM model with learnable word embeddings.
The LSTM model differs from the BOW model in terms of input features as the former directly takes the review texts. It may seem intuitive to utilise the most recent review as input. However, we believe that this might narrow the textual information. Contrarily, concatenating all reviews received by the restaurant may yield very large texts. Instead, we utilise the rating that accompanies each review in the dataset to determine the worst and the best review received for each restaurant. If there are multiple best/worst reviews with the same rating, we pick one randomly. The two reviews are then concatenated using <SEP> token. This provides the model with a more balanced set of opinions when predicting survival.
VI-B2 Sentiment Analysis
The sentiment analysis task is performed to demonstrate that the customers’ perceptions are better captured by this task compared to applying survival prediction task. To this end, the same features and prediction models are employed for the sentiment analysis task with two differences. Firstly, the two prediction classes are now the polarity scores (positive or negative) of the reviews instead of the business survival. Since the polarity scores for the best and worst review for a restaurant are now different in this task, the two reviews are input to the LSTM model separately without the <SEP> token.
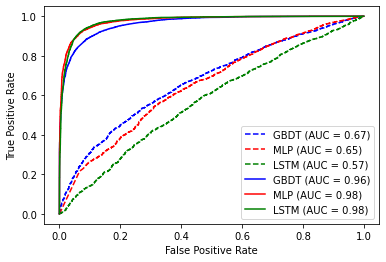
As shown in Figure 10, An immediate distinction in the performance of the models between the two tasks can be discerned. Applying the linguistic features for the sentiment analysis task significantly outperforms the survival prediction task. Additionally, LSTM performs the worst among the survival prediction models with an AUC score of 0.57, while it performs the best in sentiment analysis models with an AUC score of 0.98. Still, the GBDT and MLP models perform well on the survival prediction task with AUC scores of 0.67 and 0.65 respectively with a significantly smaller parameter size compared to LSTM.
VI-C Explaining Results
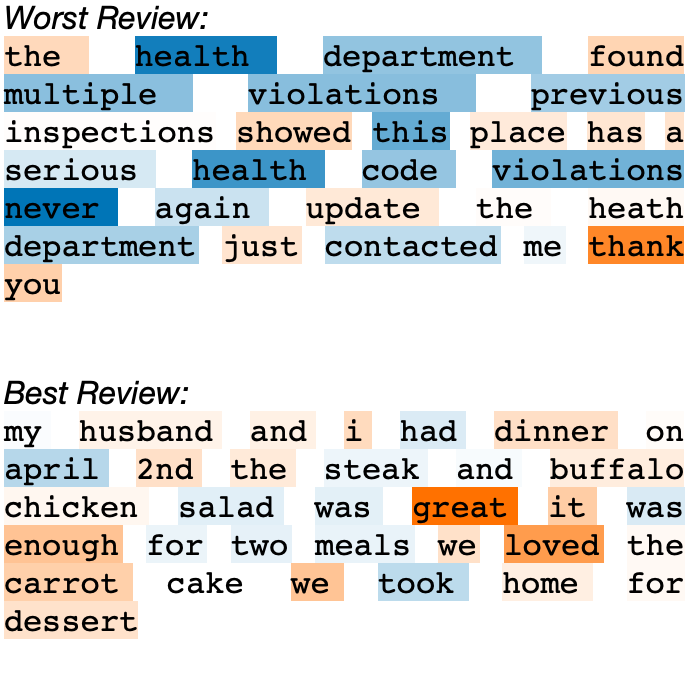
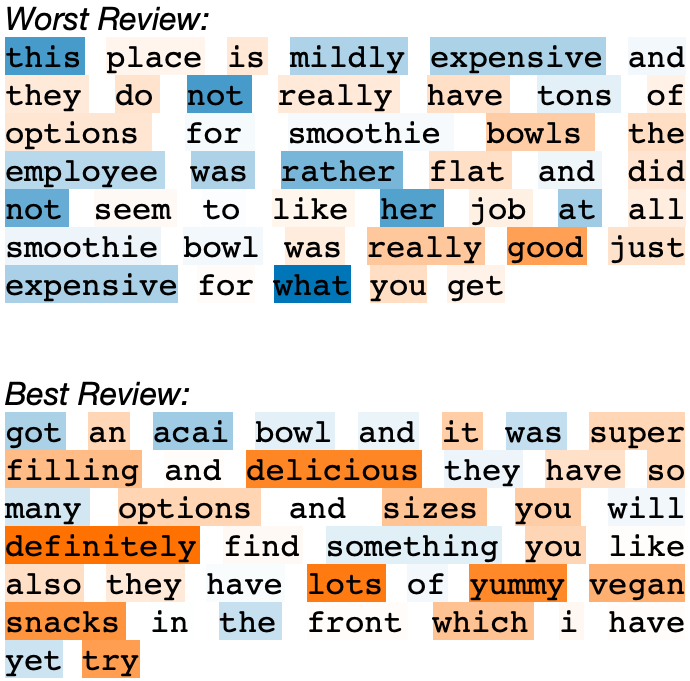
This is further exemplified by the text explanations generated by LimeTextExplainer for sentiment analysis from the LSTM model. Explanations were generated for the best and worst review of the two restaurants: Central Diner and Planet Smoothie. In both cases, the positive aspects of the two reviews laud their respective dishes: “buffalo chicken salad” at Central Diner and “acai bowl” at Planet Smoothie. Furthermore, the explanations also clearly highlight the avenues for the business owners to work on. For example, the business owners at Central Diner must work toward mitigating the “serious health code violations” whereas the decision-makers at Planet Smoothie will want to consider lowering their prices.
VII Combined Models
The previous sections evaluated the performance of features from each feature set individually. In this section, we perform an ablation study through experimentation on different combinations of features and quantitatively evaluate the combination with the best predictive power. All the features are evaluated by applying them to the GBDT and MLP models. Majority voting is then performed for amongst upto four GBDT/MLP models for each set of features. Equal weights in voting are provided to each model from each feature set.
| Features | GBDT | MLP |
|---|---|---|
| G | 0.62 | 0.52 |
| U | 0.56 | 0.54 |
| A | 0.72 | 0.67 |
| L | 0.65 | 0.67 |
| GU | 0.62 | 0.53 |
| ALL | 0.51 | 0.54 |
| -GU | 0.61 | 0.64 |
| -G | 0.54 | 0.57 |
| -U | 0.51 | 0.55 |
| -A | 0.52 | 0.55 |
| -L | 0.61 | 0.60 |
The AUC scores of models utilising different combinations of features are reported in Table III. Letters in the Feature column refer to individual features utilised - (G)eography, (U)ser Mobility, Business (A)ttributes and (L)inguistic. GU is a combination of geography and user mobility features. ALL refers to a model utilising all features. Feature names preceded by ‘-’ refers to a model with features except for those mentioned e.g. -G model utilised user mobility, business attributes and linguistic features. The best-performing model is the GBDT model with business attribute features. In general, it is realised that combining features is not as informative to the prediction models. Within the combined models, the GBDT and MLP that employ the qualitative features of business attributes and BOWs perform better than models that employ the quantitative features. This suggests that the qualitative features are very crucial in predicting business survival.
VIII Conclusion and Future Work
In conclusion, this work has investigated developing interpretable classifiers to predict business survival by utilising four feature sets including geography, user mobility, business attributes and linguistics. Among them, empirical results demonstrate that the qualitative features including business attributes and language hold the highest predictive power for this task. The explanations generated by LIME with these features for two restaurants (Planet Smoothie and Central Diner) suggested highly intuitive reasons underlying the predictions made.
Nonetheless, there are several shortcomings in this work. In the case of linguistic modelling, concatenation of the best and worst review received may not be ideal when there is a unbalanced number of positive and negative reviews. Instead of LSTM, Better prediction models could be employed that can take multiple texts as input. Additionally, the combined models did not perform as well as expected which can be ascribed to the majority voting applied among the classifiers while future works can delve into more complex ensemble learning methods.
Acknowledgments
This research has been supported in part by the 5GEAR project (Decision No. 318927) and the FIT project (Decision No. 325570) from the Academy of Finland.
Références
- [1] M. Luca, “Reviews, reputation, and revenue: The case of yelp.com,” Harvard Business School NOM Unit Working Paper, no. 12-016, 2016.
- [2] A. S. M. Tayeen, A. Mtibaa, and S. Misra, “Location, location, location! quantifying the true impact of location on business reviews using a yelp dataset,” in Proceedings of the 2019 IEEE/ACM International Conference on Advances in Social Networks Analysis and Mining, 2019.
- [3] K. D’Silva, K. Jayarajah, A. Noulas, C. Mascolo, and A. Misra, “The role of urban mobility in retail business survival,” Proc. ACM Interact. Mob. Wearable Ubiquitous Technol., vol. 2, no. 3, Sep. 2018.
- [4] J. Lian, F. Zhang, X. Xie, and G. Sun, “Restaurant survival analysis with heterogeneous information,” in Proceedings of the 26th International Conference on World Wide Web Companion, 2017.
- [5] S. Lapuschkin, S. Wäldchen, A. Binder, G. Montavon, W. Samek, and K. Müller, “Unmasking clever hans predictors and assessing what machines really learn,” CoRR, vol. abs/1902.10178, 2019.
- [6] C. Molnar, Interpretable machine learning. Lulu. com, 2020.
- [7] M. T. Ribeiro, S. Singh, and C. Guestrin, “Why should I trust you?: Explaining the predictions of any classifier,” CoRR, vol. abs/1602.04938, 2016.
- [8] M. Olsen, C. Bellas, and L. V. Kish, “Improving the prediction of restaurant failure through ratio analysis,” International Journal of Hospitality Management, vol. 2, no. 4, pp. 187–193, 1983.
- [9] H. Kim and Z. Gu, “Predicting restaurant bankruptcy: A logit model in comparison with a discriminant model,” Journal of Hospitality & Tourism Research, vol. 30, no. 4, pp. 474–493, 2006.
- [10] S. Y. Kim and A. Upneja, “Predicting restaurant financial distress using decision tree and adaboosted decision tree models,” Economic Modelling, vol. 36, pp. 354–362, 2014.
- [11] L. Wang, R. Gopal, R. Shankar, and J. Pancras, “On the brink: Predicting business failure with mobile location-based checkins,” Decision Support Systems, vol. 76, pp. 3–13, 2015.
- [12] P. Georgiev, A. Noulas, and C. Mascolo, “Where businesses thrive: Predicting the impact of the olympic games on local retailers through location-based services data,” Proceedings of the International AAAI Conference on Web and Social Media, 2014.
- [13] Q. Zhao and T. Hastie, “Causal interpretations of black-box models,” Journal of Business & Economic Statistics, pp. 1–19, 06 2019.
- [14] S. M. Lundberg and S.-I. Lee, “A unified approach to interpreting model predictions,” in Advances in Neural Information Processing Systems, 2017.
- [15] R. Moraffah, M. Karami, R. Guo, A. Raglin, and H. Liu, “Causal interpretability for machine learning - problems, methods and evaluation,” SIGKDD Explor. Newsl., vol. 22, no. 1, p. 18–33, May 2020.
- [16] M. Daggitt, A. Noulas, B. Shaw, and C. Mascolo, “Tracking urban activity growth globally with big location data,” 2015.
- [17] N. V. Chawla, K. W. Bowyer, L. O. Hall, and W. P. Kegelmeyer, “SMOTE: synthetic minority over-sampling technique,” J. Artif. Intell. Res., vol. 16, pp. 321–357, 2002.
- [18] C. Buckley and E. M. Voorhees, “Retrieval evaluation with incomplete information,” ser. SIGIR ’04, New York, NY, USA, 2004, p. 25–32.
- [19] X. Zhang, J. Zhao, and Y. LeCun, “Character-level convolutional networks for text classification,” in Advances in Neural Information Processing Systems, 2015.
- [20] S. Hochreiter and J. Schmidhuber, “Long short-term memory,” Neural computation, vol. 9, no. 8, pp. 1735–1780, 1997.
- [21] Y. D. Kwon, D. Chatzopoulos, E. ul Haq, R. C.-W. Wong, and P. Hui, “Geolifecycle: User engagement of geographical exploration and churn prediction in lbsns,” Proc. ACM Interact. Mob. Wearable Ubiquitous Technol., vol. 3, no. 3, pp. 92:1–92:29, Sep. 2019.