20XX Vol. X No. XX, 000–000
22institutetext: Key Laboratory of Modern Astronomy and Astrophysics (Nanjing University), Ministry of Education, Nanjing 210093, China
33institutetext: Collaborative Innovation Center of Modern Astronomy and Space Exploration, Nanjing 210093, China; chenym@nju.edu.cn
\vs\noReceived 20XX Month Day; accepted 20XX Month Day
Spatially Resolved Properties of Supernova Host Galaxies in SDSS-IV MaNGA
Abstract
We crossmatch galaxies from Mapping Nearby Galaxies at Apache Point Observatory with the Open Supernova Catalog, obtaining a total of 132 SNe within MaNGA bundle. These 132 SNe can be classified into 67 Type Ia and 65 Type CC. We study the global and local properties of supernova host galaxies statistically. Type Ia SNe are distributed in both star-forming galaxies and quiescent galaxies, while Type CC SNe are all distributed along the star-forming main sequence. As the stellar mass increases, the Type Ia/CC number ratio increases. We find: (1) there is no obvious difference in the interaction possibilities and environments between Type Ia SN hosts and a control sample of galaxies with similar stellar mass and SFR distributions, except that Type Ia SNe tend to appear in galaxies which are more bulge-dominated than their controls. For Type CC SNe, there is no difference between their hosts and the control galaxies in galaxy morphology, interaction possibilities as well as environments; (2) the SN locations have smaller velocity dispersion, lower metallicity, and younger stellar population than galaxy centers. This is a natural result of radius gradients of all these parameters. The SN location and the its symmetrical position relative to the galaxy center, as well as regions with similar effective radii have very similar [Mg/Fe], gas-phase metallicity, gas velocity dispersion and stellar population age.
keywords:
galaxies: general — galaxies: abundances — supernovae: general — techniques: spectroscopic1 Introduction
Supernova (SN) explosion, as an important astrophysics process, can be classified into Type I and II according to the presence of hydrogen line or not in their spectra (Filippenko 1997). Type I Supernovae (SNe) are divided into Type Ia with Si 6510Å absorption line, Type Ib without Si but with He line, and Type Ic neither with Si or He line in the spectra (Hamuy et al. 2002). Type II SNe can be divided into Type IIP and Type IIL (Barbon et al. 1979) by light curves that Type IIP has a long plateau (90days) after the curve reaches its peak (Rubin et al. 2016) while Type IIL shows a linear decline after the peak.
In another way, we can also classify SNe by their progenitors. The explosion of a progenitor star with stellar mass 8 is induced by the gravitational collapse and leaves a neutron star or black hole in the center (Arnett et al. 1989; Bethe et al. 1979). This is named as core collapse supernovae (CC SNe), which is corresponding to Type Ib/c and Type II SNe. Meanwhile, a star with stellar mass in between 0.58 will evolve into a degenerate carbon-oxygen (C/O) white dwarf (WD, Becker & Iben 1980) as its end. If the mass of the WD is larger than 1.44 , thermonuclear reactions can ignite the center of the WD and lead to a great thermonuclear explosion which is named Type Ia SNe (Hoyle & Fowler 1960).
As a result, Type Ia SNe have been recognized as an important cosmological probe. Because of their stable peak luminosity, it is treated as the best standard candle up to date. It provides the evidence of accelerating expansion of the universe and the existence of dark energy (Perlmutter et al. 1999; Riess et al. 1998). However, there have been several studies showing that the peak luminosity of Type Ia SNe varies with host galaxies properties, which would lead to the uncertainties in constraining cosmological models. At the early stage, these studies focused mainly on the global properties of host galaxies, and how the peak luminosity of Type Ia SNe depends on stellar masses (Sullivan et al. 2010), ages (Hamuy et al. 1995, 2000) and gas metallicities (Gallagher et al. 2005).
As these kinds of investigation went deeper and deeper, astronomers realized that the local environments of SNe should be important in influencing the properties of SNe. However, there is no large spatial resolved surveys by that time, the studies are focused on the locations where the supernova explodes (Anderson & James 2009; Galbany et al. 2012) since most galaxy properties have obvious radial gradients.
With the development of observation technology, the emergence of integral field unit (IFU) survey provides spatial resolved information of galaxies and makes it possible to construct a direct observation of local properties at SN exploding location. Stanishev et al. (2012) compared local and global properties and environments of host galaxies of 6 Ia SNe and found no obvious difference in metallicity based on the Calar Alto Legacy Integral Field Area (CALIFA) survey. Galbany et al. (2014, 2016) expanded the sample size of SN host galaxies to 115. By the PMAS/PPAK Integral-field Supernova hosts Compilation (PISCO), Galbany et al. (2018) has enlarged the sample to 232 host galaxies with 272 SNe.
Zhou et al. (2019) compared properties of SN exploding locations with global properties of their host galaxies based on MaNGA data, including 4 Type Ia, 5 Type II and 2 unclassified SNe, and found that all of the SNe are exploded in metal-rich galaxies with but showed small difference between local and global metallicity. In 2020, Zhou et al. revisited the same question and found similar results with a larger sample of 67 SNe.
We notice that most of the previous researches based on IFS observations do not take the radial gradients into account. However, the comparison between local and global properties could be influenced by radial gradients. In this work, we build a sample of 132 SNe with MaNGA observations of host galaxies, comparing the properties of SN location with different regions in the host galaxies.
The paper is organized as follows: in Section 2, we describe our sample selection criteria. Then we show the comparison results in aspects of both global and local properties in Section 3. The results and conclusions are shown in Section 4 & 5. The cosmological parameters we use throughout this paper are = 70 km s-1 Mpc-1, = 0.3, and = 0.7.
2 Observations and Data Reduction
2.1 Mapping Nearby Galaxies at Apache Point Observatory
MaNGA (Bundy et al. 2015), as one of three major programs in Sloan Digital Sky Survey IV (Blanton et al. 2017), use Apache Point Observatory’s 2.5-meter telescope (Gunn et al. 2006) for observation. MaNGA launched in 2014 July, and was completed in early 2021, obtaining the largest spatial resolved galaxy sample so far (10,000 galaxies). In order to observe the distribution of the gas, stellar kinematics and stellar populations in galaxies of different sizes, the MaNGA IFUs include different sizes of fiber-bundles. Each cartridge includes 2N19, 4N37, 4N61, 2N91, 5N127, altogether 17 different sizes of bundles as well as 12N7 mini-bundle per cartridge for flux calibration (Drory et al. 2015; Yan et al. 2016). The two dual-channel BOSS spectrographs (Smee et al. 2013) provide a simultaneous wavelength range of 360010300 with a spectral resolution of R2000. As a result of 3 hours in typical integration time, the band signal-to-noise ratio (S/N) reaches 48 at 23 mag arcsec-2.
The target sample covers a range in redshift 0.01 0.15 with a median redshift of 0.03. The stellar mass has a flat distribution in between to for ensuring adequate sampling of stellar mass. The MaNGA galaxies are separated into two different subsamples: the primary sample includes more than 80 of all targets and covers to 1.5 effective radii (Re) and the secondary sample to 2.5Re.
2.2 The Open Supernova Catalog
The Open Supernova Catalog (TOSC, Guillochon et al. 2017) is a website dedicated to collecting supernova data111https://sne.space. It has collected nearly 78,000 supernova and candidates till March 2021, most of which come from public supernova catalogs and projects, such as Asiago Supernova Catalog (ASC, Barbon et al. 1999), Caltech Core-Collapse program (CCCP, Gal-Yam et al. 2004), Cambridge Photometry Calibration Server (CPCS, Zieliński et al. 2019), etc. It also collects individual supernovae in published papers (e.g., Yaron & Gal-Yam 2012; Matheson et al. 2008; Silverman et al. 2012). This website provides basic parameters including SN name, type, position, redshift, and whether it contains X-ray and radio observations. Currently, about 20,000 supernovae in the catalog contain light curves, and about 10,000 contain spectra. This website has laid a solid foundation for the systematic researches of supernovae.
2.3 Sample Selection and Data Analysis
At first, we crossmatch 8000 galaxies from MPL9 with 77951 SNe from TOSC with a tolerance radius of 3Re of the MaNGA galaxy and obtain 411 SN host galaxies. Meanwhile, there is a MaNGA ancillary program planned to observe host galaxies of 60 type Ia supernova (Accetta et al. 2021, submitted). In MPL9, 7 of these 60 targets have been observed and we find that three of them are included in our sample. We then exclude 188 SNe as well as their host galaxies from our sample since the type of these SNe is not clear. we also remove 47 SNe which are located outside the MaNGA bundles. The stellar mass and SFR are taken from MPA-JHU222https://wwwmpa.mpa-garching.mpg.de/SDSS/DR7/ catalog. The total stellar mass is estimated through the fitting of SDSS 5-band SED (Kauffmann et al. 2003). The SFR is estimated from the luminosity of the H emission line (Brinchmann et al. 2004). Finally we get a sample of 132 SNe, which includes 67 Type Ia and 65 Type CC SNe (8 Type Ib, 6 Type Ic and 51 Type II). The basic information of these SNe is listed in Table LABEL:table:sne.
MaNGA DAP (Westfall et al. 2019) fits the galaxy’s spectrum based on MaStar Library (Yan et al. 2019) using pPXF spectrum processing software (Cappellari & Emsellem 2004). The DAP fits the stellar continuum and 21 nebular emission lines of main optical bands for each spaxel. The parameters extracted in this work are from the DAP named “SPX-MILESHC-MASTARHC” including nebular emission line fluxes ([N ii]6584 & [S ii]6717,6731), the spectral indices ([Mg/Fe] & D4000) and velocity dispersion of ionized gas (), etc.
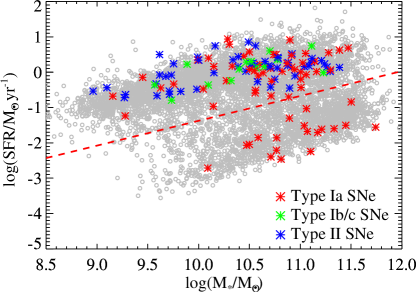
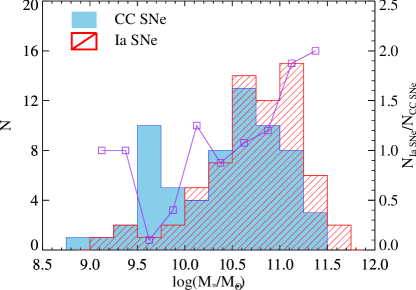
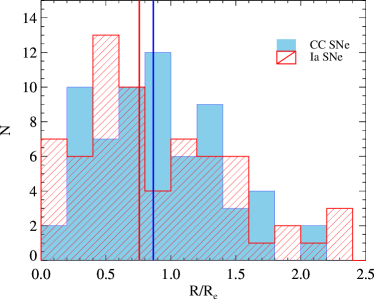
Figure 1 shows the distributions of Type Ia (red asterisk), Type Ib/c (green) and Type II (blue) SN host galaxies in SFR vs. diagram. The grey circles represent MaNGA MPL9 galaxy sample, and the red dash line separates the star-forming main sequence with higher SFRs from quiescent galaxies. We can find that Type CC SNe (including Type Ib/c and Type II) are all located in the star-forming main sequence above the dash line, which corresponds to the fact that the progenitor of these SNe are all massive young stars and formed in star-forming region. Meanwhile, Type Ia SNe distribute in both blue and red galaxies because the progenitors of Ia SNe are all low-mass stars, which exists in both star-forming and quiescent galaxies. This result is consistent with Shao et al. (2014) that among their 902 SNe, Type CC SNe are most distributed in star forming galaxies and a small part in AGN and quiescent galaxies while Type Ia distributed in both types of galaxies.
Figure 2 shows the stellar mass distribution of Type Ia (red histogram) and Type CC (blue) SN host galaxies. The purple squares and line shows the ratio between the number of Type Ia and CC SNe. At log/ 9.5, the statistical uncertainty of number ratio is large due to that there are only 3 Type Ia and 4 CC SNe in this mass range. At log/ 9.5, the ratio increases quickly with stellar mass, consistent with the fact that the median stellar mass of Ia host galaxies is higher than Type CC host galaxies in Zhou et al. (2020).
In Figure 3, we show the distribution of the SN position relative to the galaxy center in unit of Re. The red histogram represents Type Ia SNe, blue represents CC and the red and blue vertical lines represent the median values of Ia and CC SNe, respectively. The distribution of the two SN types shows no significant difference. The sharp decrease of SN number outside 1.5Re is due to the fact that only 20 of MaNGA bundles cover beyond 1.5Re.
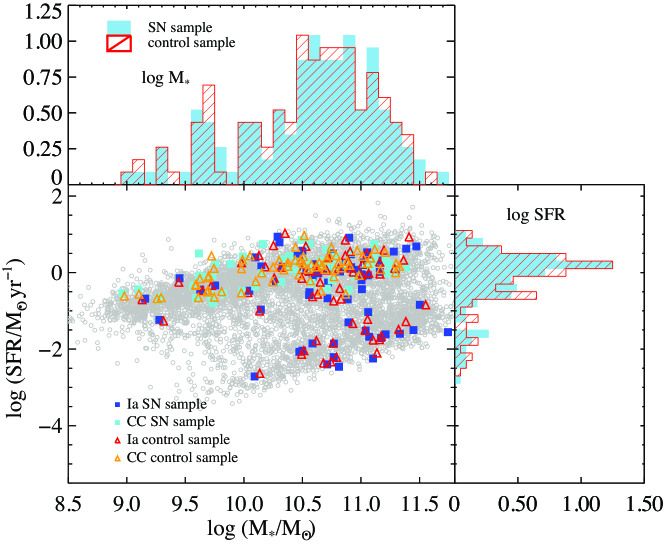
In order to compare the properties of SN host galaxies and non-SN host galaxies, we build a non-SN host galaxy control sample, which is closely matched in , SFR and . The specific selection method is shown in Equation 1.
| (1) |
We choose galaxy with smallest as SN control where represents the stellar mass difference between the SN host galaxy and its control, and represent the SFR and redshift difference, respectively. The motivation of choosing these three parameters to build control sample is the following: (i) as one of the fundamental parameters, stellar mass correlates strongly with many other parameters of galaxies such as metallicity and SFR; (ii) the SFR is a major factor of SN explosions especially for Type CC SNe, a high SFR represents a high SN explosion rate; (iii) a similar redshift distribution is required to avoid the influence of any evolutionary effects. Figure 4 shows the distributions of SN host galaxies and the control sample in SFR vs. diagram. The blue and cyan solid squares correspond to Type Ia and Type CC SN host galaxies. The red and orange open triangles correspond to the control galaxies of Type Ia and Type CC, respectively. The top and right panel show the histograms of and SFR for the SN sample (blue) and control sample (red). It is clear that the SN sample and the control sample have similar and SFR distributions.
3 Results
In this section, we compare the morphology, interaction possibility parameter and environment of the SN host galaxies and control sample, trying to understand the correlation between these properties and SN explosions. Thanks to the large IFU sample provided by MaNGA survey, we can compare the properties of the local region of SN explosions and other locations within the galaxy, investigating the connection between the SN explosions and the properties of their host galaxies.
3.1 The Global Properties of SN Host Galaxies
We use Sèrsic index to characterize the morphology of galaxies (Sérsic 1963; Sersic 1968). The surface brightness of a galaxy can be fitted by Sèrsic profile:
| (2) |
where is the central surface brightness of the galaxy and the parameter in Equation 2 represents the Sèrsic index. = 2 is generally used as the threshold between disk galaxies ( 2) and elliptical galaxies ( 2). We take of our sample from PyMorph333https://www.sdss.org/dr15/data_access/value-added-catalogs/?vac_id=manga-pymorph-dr15-photometric-catalog (Fischer et al. 2019) in MaNGA data release 15 (DR15). MaNGA Morphology Deep Learning444https://www.sdss.org/dr15/data_access/value-added-catalogs/?vac_id=manga-morphology-deep-learning-dr15-catalog (Domínguez Sánchez et al. 2018) provides a parameter named for DR15, which represents the likelihood that the galaxy has recently experienced interactions by optical images (Willett et al. 2013). The environment parameters and are taken from GEMA-VAC555https://www.sdss.org/dr15/data_access/value-added-catalogs/?vac_id=gema-vac-galaxy-environment-for-manga-value-added-catalog (Goddard et al. 2017), where is the projection distance between the target galaxy and the nearest neighbour with -band magnitude 17.7. is the total number of neighbor galaxies with 17.7, a line-of-sight velocity to the target galaxy within 500km s-1, the projection distance within 1Mpc.
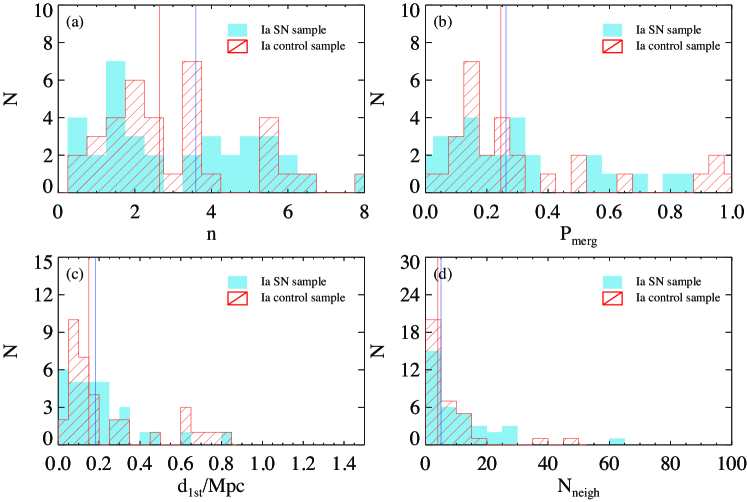
Figure 5 shows the distribution of morphology, merging possibility and environmental parameters of Type Ia SN host galaxies and the control sample. The blue histogram represents the SN sample and the red represents the control sample. The vertical lines of different colors correspond to the median value of different distributions. In Figure 5(a), the median value of Sèrsic index of Ia SN host galaxies is higher than the control sample with = 3.6 for SN sample and = 2.6 for controls, indicating that Type Ia SNe tends to explode in galaxies which are more bulge-dominated. Figure 5(b) shows that Type Ia hosts and their controls have very similar merging possibility () distributions, indicating there is no obvious connection between merger/interaction and SN explosion. For environments, we find both and shown in Figure 5(c) (d) reflect similar distributions and median values, indicating a weak/no correlation between triggering of Type Ia SNe and the environments of their host galaxies.
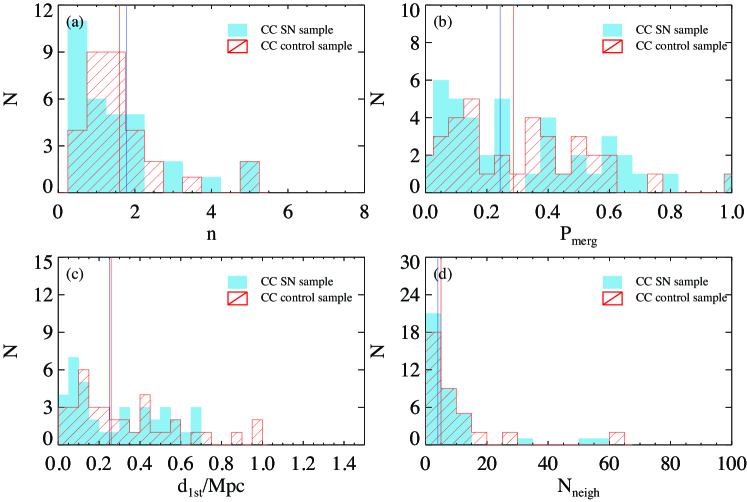
Similar to Figure 5, Figure 6 compared the Type CC SN host galaxies and their control sample, in which blue histograms represent Type CC hosts and the red represent the control galaxies, the two vertical lines of blue and red colors correspond to the median value of SN hosts and controls, respectively. Again, no difference is shown in Figure 6 indicating that there is no preference of SN explosion on the morphology, interaction and surrounding environment of their host galaxies.
3.2 The Local Properties of SN Host Galaxies
To further explore the local properties of the position where SNe explode, and to understand the speciality of the local environment, we select four regions in a galaxy for the comparison of galaxy properties: (i) the SN location: we select spaxels within radius from MaNGA data around the SN location, taking the median value of the physical parameters as the local properties of SN regions; (ii) the galaxy center: we select the spaxels within of galaxy center, taking the median parameters as the local properties of galaxy center region; (iii) the symmetric region of SN location relative to the center of the galaxy: we select the spaxels with of the symmetric region of SN location relative to the center of the galaxy, taking the median parameters as the local properties; (iv) the annulus area with same effective radius as the SN location: we select the spaxels at the annulus with the same effective radius as the SN position with a width 0.05Re, and take the median value as the properties of the annulus.
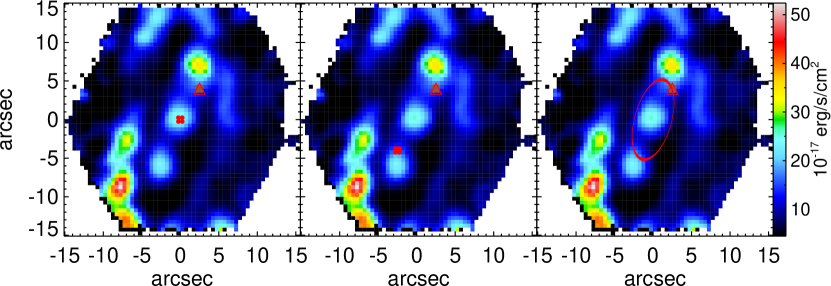
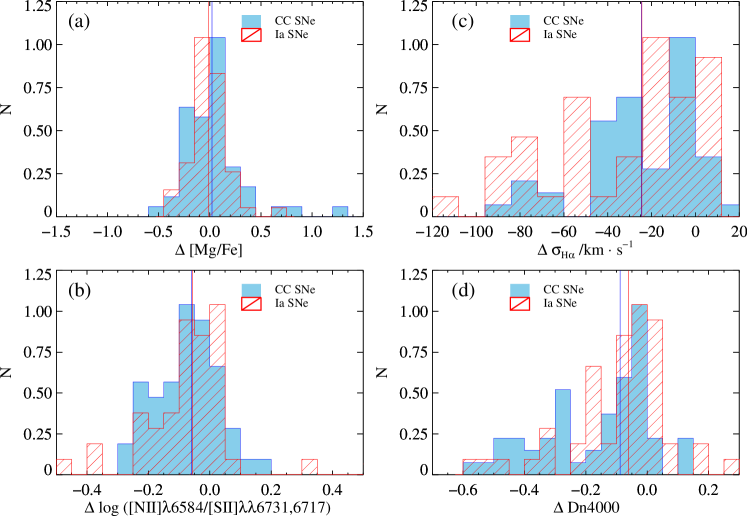
Figure 7 is an example of H flux map of SN host (MaNGAID: 1-115365). The SN location is marked as red triangles in each panel, the four brown dots are selected spaxels of the SN position. In the left panel, the four red dots in the middle represent the spaxels selected as galaxy center. At the bottom-left of the middle panel, the four red dots represent the data selected as symmetric position of SN explosion region relative to the center of the host galaxy. The red ellipse shown in right panel represents the data selected as the annulus area with same effective radius as the SN explosion location. The SN exploded in this galaxy is SN2007cn, which is classified as Type Ia.
We chose four parameters for comparison in this section: (i) we use [Mg/Fe] to roughly represent the star formation history. The magnesium element is an -process element, and the synthesis of the element mainly comes from the explosion of Type CC SNe whose progenitors have a relatively short lifetime (about 110 Myr); Meanwhile most of the iron is formed from the explosion of Type Ia SNe whose progenitors are low mass star with a long lifetime. Due to the different time scale of their formation, the ratio [Mg/Fe] is a good tracer of the star formation history (Thomas et al. 2010). The definition of [Mg/Fe] is:
| (3) |
where the parameter Mgb, Fe5270 and Fe5335 are Lick indexes (Worthey 1994) included in MaNGA DAP; (ii) we use [N ii]6584/[S ii]6717,6731 (Kewley & Dopita 2002; Dopita et al. 2013) to characterize the gas-phase metallicity. We do not use metallicity indicators such as R23 in this work since most of the spaxels in SN (especially type Ia) host galaxies are not star forming, the traditional gas-phase metallicity indicator becomes invalid. But [N ii]6584/[S ii]6717,6731 could overcome this problem in that nitrogen is a secondary -process element, and sulfur is a primary nuclear synthesis element. Although [N ii]6584/[S ii]6717,6731 is an approximation of N/O, at metallicity 12+log (O/H) 8.0, it has a good correlation with the O/H abundance (Dopita et al. 2016; Kashino et al. 2016). Since [N ii]6584 and [S ii]6717,6731 have similar wavelengths, the reddening effects could also be neglected; (iii) we use ionized gas velocity dispersion to explore the influence of SN explosions on gas kinematics; (iv) D4000 is a good indicator of stellar population age. It is defined by Balogh et al. (1999) as the ratio of average flux density between 3850Å3950Å and 4000Å4100Å.
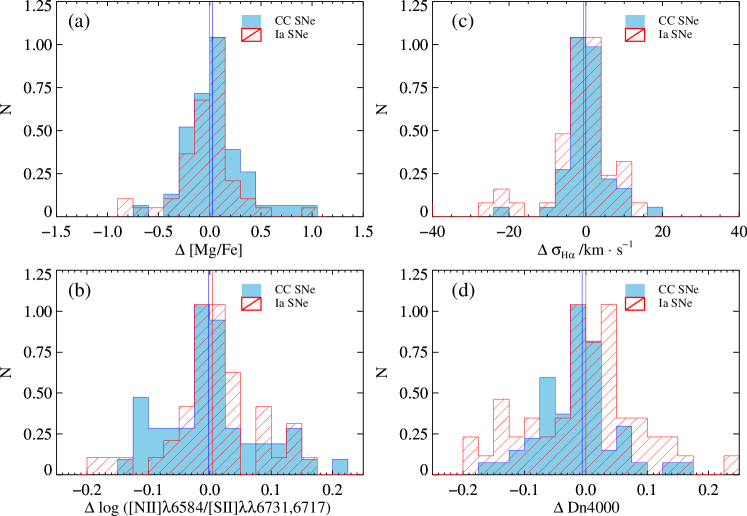
Figure 8 shows distributions of the difference in [Mg/Fe], [N ii]6584/[S ii]6717,6731, , D4000 between the SN exploding location and the galaxy center. The red shaded histograms are for Type Ia SNe and blue for Type CC SNe. A positive difference means the parameter at SN exploding location has higher value than that of galaxy center. The vertical lines of different colors correspond to the median value of each distribution. Figure 8(a) shows the difference in [Mg/Fe]. The median value of both distributions are approaching 0 ( for Type Ia SNe and 0.02 for Type CC SNe), implying that there is no significant difference in star formation history between the SN position and the galaxy center. While in Figure 8(b), we find that both Type Ia and Type CC SNe show obvious metallicity differences between the SN position and the galaxy center. The metallicity at SN position is lower than the galaxy center by 0.1 dex. Considering that the metallicity gradient of local star forming galaxies is typically 0.1 dex/Re (Schaefer et al. 2020), and the median value of SN position relative to the galaxy center is 0.80.9Re as shown in Figure 3, this metallicity difference observed in Figure 8(b) can be explained as a natural result of galaxy metallicity gradient. Figure 8(c) shows the difference in gas velocity dispersion. The median values of the differences in the Type Ia and Type CC SNe are km s-1 and km s-1, indicating that the gas velocity dispersion at the SN position is smaller than that of the galaxy center. This difference is mainly due to the larger contribution of the bulge at the galaxy center. The SN position locates mainly at the outer regions of galaxies where the contribution of the galaxy disk increases, and therefore has a lower velocity dispersion than the central area. Figure 8(d) is the difference in D4000. A negative value in D4000 indicates that the stellar populations at SN position is younger than the galaxy center. SN position (with lower D4000) is younger than the galaxy center. This is also a direct result of the stellar population gradient in a normal galaxy with the inside-out growth model (Fall & Efstathiou 1980; Mo et al. 1998; Somerville et al. 2008). In brief, the comparison of the parameters in the SN explosion position and the galaxy center shows that the observed differences can be naturally explained by the radial gradient of the parameters. It does not show either the special features of the SN position or the influence of a single SN explosion on the local physical properties of the host galaxy.
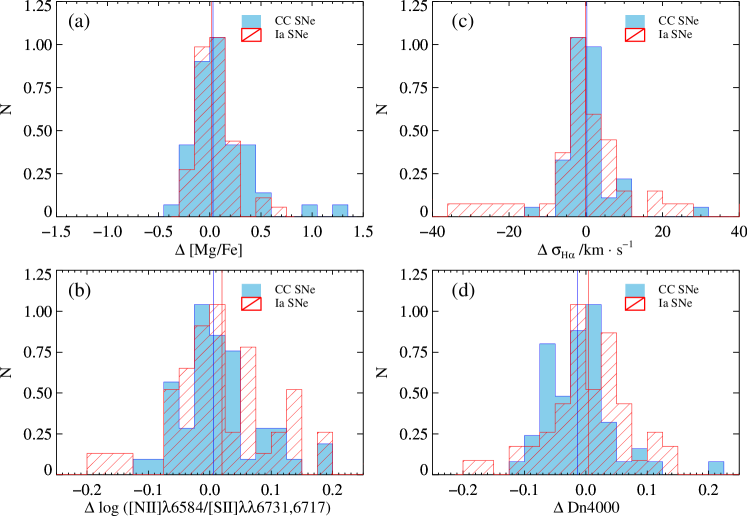
In order to eliminate the influence of radial gradient, we compare the difference in the four parameters between SN location and its symmetrical region relative to the galaxy center. Statistically, the symmetrical region can be treated as a progenitor of SN location. The results are shown in Figure 9. Similar to Figure 8, The red shaded histograms are for Type Ia SNe and blue for Type CC SNe. The two vertical lines in each panel show the median value of the distributions with the same color. It is clear that the median values are all close to 0, indicates that there is no significant difference between SN location and the symmetrical region. Considering that the symmetrical region could represent the state of the SN location before explosion, this result suggests: (i) the properties of the SN location do not show any particularities; (ii) the impact of a single SN explosion is not strong enough to be observed at the explosion region, or (iii) the spatial resolution is not higher enough to resolve the region that a single SN can affect. The typical spatial resolution of MaNGA is 1.2 kpc considering a fiber size at a median redshift of 0.03. We are looking forward to higher spatial resolution IFU observations for further research.
Currently, the definition of symmetrical region covers only 34 spaxels, for which the physical properties could be influenced by substructures. Thus we further compare the average properties of SN location and elliptical annulus with the same effective radius as SN position. Similar to Figure 8, Figure 10 shows the distributions of difference between the median value of annulus region and the SN position in [Mg/Fe], , [N ii]6584/[S ii]6717,6731 and D4000. We find the difference of these parameters also have a value nearly zero, which again points to the result that the properties of SN location is similar to regions at the same effective radii. This result is consistent with Galbany et al. (2014, 2016) which found that the SFR and metallicity of the SN location are almost the same as that of the global properties of the galaxy based on the CALIFA survey.
4 Discussion
4.1 Sample Size
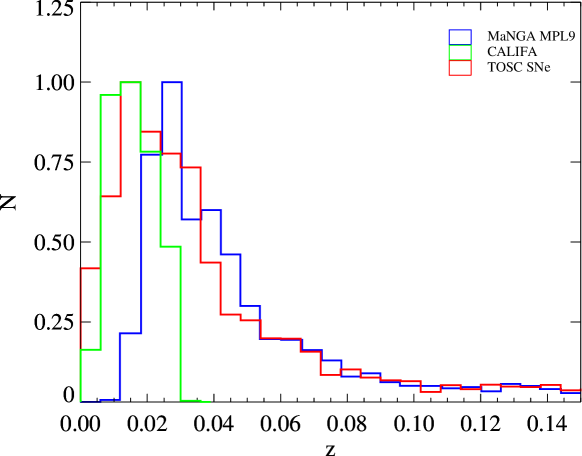
In this work, we find 132 SNe with classification within the MaNGA bundle size from 8000 unique MaNGA galaxies, corresponds to 2 SN fraction. However, Galbany et al. (2016) found a SN fraction of 14 (= 132/939) from CALIFA survey. To understand the large difference in SN fraction, we explore the redshift distribution of MaNGA MPL9 (blue), CALIFA (green), and TOSC (red) samples in Figure 11. We find that the redshift of the CALIFA sample is mainly distributed at a redshift smaller than 0.03, and peaks 0.015. The redshift coverage of MaNGA is 0.010.15 and peaks at 0.03 with very few galaxies at 0.015. There are 10,633 SNe in TOSC which has a clear SN type classification and a specific host galaxy. The peak of their host galaxy redshift distribution is around 0.015, similar to CALIFA. The large difference in SN fraction can be easily understood by the different redshift distributions: galaxy sample from CALIFA survey has similar redshift distribution as the SN host galaxies, while MaNGA galaxies are located at higher redshifts. The lower SN fraction is due to this redshift difference between MaNGA galaxy sample and SN hosts. This result is totally consistent with Zhou et al. (2019) who found a SN fraction of 1 (= 11/1390) in early MaNGA data release.
4.2 The Stellar Mass and Morphology of SN Host Galaxies
In this work, we study the distribution of supernova host galaxies on SFR vs. stellar mass relation, and find that the Type CC SN host galaxies are distributed in the star-forming main sequence, while Type Ia SNe are distributed in both star-forming galaxies and quiescent galaxies. This is consistent with the result of Shao et al. (2014) who found CC SNe mostly lie in star-forming galaxies and Ia SNe lie in star-forming, AGN, weak emission-line galaxies as well as absorption-line galaxies. Meanwhile, the increasing of the Type Ia/CC number ratio with stellar mass in this work suggests that Type Ia SNe tend to explode in galaxies with higher masses, which is in line with the result of Zhou et al. (2020).
We compare the global properties of SN host galaxies and control sample, finding that there is no obvious difference in galaxy interactions and surrounding environments. The Sèrsic index of Type Ia SN host galaxies is slightly higher than that of their control sample, indicating that Type Ia supernovae are more likely to explode in galaxies that are more bulge-dominated. However, Mannucci et al. (2005) found that the SN explosion rate is 20 times higher in spiral galaxies than that of elliptical galaxies. This result, at first sight, is in conflict with our result. Actually, this difference is due to that we are comparing the Type Ia hosts and their control galaxies with similar stellar mass and SFR, while Mannucci et al. (2005) compared SN explosion rate in spiral and elliptical galaxies. In Figure 1, we can find that there are 48 Type Ia SNe in star forming main sequence, and 19 Ia SNe located in quiescent sequence below the red dashed line, indicating the Type Ia SN explosion rate is higher for star forming main sequence galaxies, which is in consistent with Mannucci et al. (2005) qualitatively.
5 Conclusion
In this paper, we crossmatch galaxies from MaNGA MPL9 to SNe from TOSC, obtaining a total of 132 SNe with classifications within MaNGA bundle. These 132 SNe can be classified into 67 Type Ia and 65 Type CC, where Type CC includes Type Ib, Ic, and Type II SNe. Type Ia SNe are distributed in both star-forming galaxies and quiescent galaxies, while Type CC SNe are all distributed along the star-forming main sequence. As the stellar mass increases, the Type Ia/CC number ratio also increases. Our conclusions are summarized as follows:
-
1.
About the global properties of SN host galaxies, we find that there is no obvious difference in the interaction possibilities and environments between Type Ia SN hosts and a control sample of galaxies with similar stellar mass and SFR distributions, except that Type Ia SNe tend to appear in galaxies which are more bulge-dominated than their controls. For Type CC SNe, there is no difference between their host and the control galaxies in galaxy morphology, interaction possibility as well as environments. These results indicate the SN explosion rate is not depending on galaxy interactions and environments.
-
2.
About the local properties, we find the SN locations with smaller velocity dispersion, lower metallicity, and younger stellar population than galaxy centers. This is a result of radial gradients of all these parameters. The comparison of physical properties ([Mg/Fe], [N ii]6584/[S ii]6717,6731, and D4000) between SN locations with the symmetric regions relative to galaxy centers and elliptical annulus with similar effective radii as SN location finds no obvious difference, indicating either there is no particularity in the properties at SN location or the scale that a single SN explosion can influence is much smaller than kpc, the typical resolution of MaNGA.
Acknowledgements.
We thank Yongyun Chen, Jianhang Chen and Songlin Li for very constructive comments in our work. Y. C acknowledges support from the National Key R&D Program of China (No. 2017YFA0402700), the National Natural Science Foundation of China (NSFC grants 11573013, 11733002, 11922302). Funding for the Sloan Digital Sky Survey IV has been provided by the Alfred P. Sloan Foundation, the U.S. Department of Energy Office of Science, and the Participating Institutions. SDSS-IV acknowledges support and resources from the Center for High-Performance Computing at the University of Utah. The SDSS web site is www.sdss.org. SDSS-IV is managed by the Astrophysical Research Consortium for the Participating Institutions of the SDSS Collaboration including the Brazilian Participation Group, the Carnegie Institution for Science, Carnegie Mellon University, the Chilean Participation Group, the French Participation Group, Harvard-Smithsonian Center for Astrophysics, Instituto de Astrofísica de Canarias, The Johns Hopkins University, Kavli Institute for the Physics and Mathematics of the Universe (IPMU) / University of Tokyo, Lawrence Berkeley National Laboratory, Leibniz Institut für Astrophysik Potsdam (AIP), Max-Planck-Institut für Astronomie (MPIA Heidelberg), Max-Planck-Institut für Astrophysik (MPA Garching), Max-Planck-Institut für Extraterrestrische Physik (MPE), National Astronomical Observatories of China, New Mexico State University, New York University, University of Notre Dame, Observatário Nacional / MCTI, The Ohio State University, Pennsylvania State University, Shanghai Astronomical Observatory, United Kingdom Participation Group, Universidad Nacional Autónoma de México, University of Arizona, University of Colorado Boulder, University of Oxford, University of Portsmouth, University of Utah, University of Virginia, University of Washington, University of Wisconsin, Vanderbilt University, and Yale University.References
- Anderson & James (2009) Anderson, J. P., & James, P. A. 2009, MNRAS, 399, 559
- Arnett et al. (1989) Arnett, W. D., Bahcall, J. N., Kirshner, R. P., & Woosley, S. E. 1989, ARA&A, 27, 629
- Balogh et al. (1999) Balogh, M. L., Morris, S. L., Yee, H. K. C., Carlberg, R. G., & Ellingson, E. 1999, ApJ, 527, 54
- Barbon et al. (1999) Barbon, R., Buondí, V., Cappellaro, E., & Turatto, M. 1999, A&AS, 139, 531
- Barbon et al. (1979) Barbon, R., Ciatti, F., & Rosino, L. 1979, A&A, 72, 287
- Becker & Iben (1980) Becker, S. A., & Iben, I., J. 1980, ApJ, 237, 111
- Belfiore et al. (2019) Belfiore, F., Westfall, K. B., Schaefer, A., et al. 2019, AJ, 158, 160
- Bethe et al. (1979) Bethe, H. A., Brown, G. E., Applegate, J., & Lattimer, J. M. 1979, Nucl. Phys. A, 324, 487
- Blanton et al. (2017) Blanton, M. R., Bershady, M. A., Abolfathi, B., et al. 2017, AJ, 154, 28
- Brinchmann et al. (2004) Brinchmann, J., Charlot, S., White, S. D. M., et al. 2004, MNRAS, 351, 1151
- Bundy et al. (2015) Bundy, K., Bershady, M. A., Law, D. R., et al. 2015, ApJ, 798, 7
- Cappellari & Emsellem (2004) Cappellari, M., & Emsellem, E. 2004, PASP, 116, 138
- Domínguez Sánchez et al. (2018) Domínguez Sánchez, H., Huertas-Company, M., Bernardi, M., Tuccillo, D., & Fischer, J. L. 2018, MNRAS, 476, 3661
- Dopita et al. (2016) Dopita, M. A., Kewley, L. J., Sutherland, R. S., & Nicholls, D. C. 2016, Ap&SS, 361, 61
- Dopita et al. (2013) Dopita, M. A., Sutherland, R. S., Nicholls, D. C., Kewley, L. J., & Vogt, F. P. A. 2013, ApJS, 208, 10
- Drory et al. (2015) Drory, N., MacDonald, N., Bershady, M. A., et al. 2015, AJ, 149, 77
- Fall & Efstathiou (1980) Fall, S. M., & Efstathiou, G. 1980, MNRAS, 193, 189
- Filippenko (1997) Filippenko, A. V. 1997, ARA&A, 35, 309
- Fischer et al. (2019) Fischer, J. L., Domínguez Sánchez, H., & Bernardi, M. 2019, MNRAS, 483, 2057
- Gal-Yam et al. (2004) Gal-Yam, A., Cenko, S. B., Fox, D. W., et al. 2004, in American Astronomical Society Meeting Abstracts, Vol. 205, American Astronomical Society Meeting Abstracts, 40.06
- Galbany et al. (2012) Galbany, L., Miquel, R., Östman, L., et al. 2012, ApJ, 755, 125
- Galbany et al. (2014) Galbany, L., Stanishev, V., Mourão, A. M., et al. 2014, A&A, 572, A38
- Galbany et al. (2016) Galbany, L., Stanishev, V., Mourão, A. M., et al. 2016, A&A, 591, A48
- Galbany et al. (2018) Galbany, L., Anderson, J. P., Sánchez, S. F., et al. 2018, ApJ, 855, 107
- Gallagher et al. (2005) Gallagher, J. S., Garnavich, P. M., Berlind, P., et al. 2005, ApJ, 634, 210
- Goddard et al. (2017) Goddard, D., Thomas, D., Maraston, C., et al. 2017, MNRAS, 465, 688
- Guillochon et al. (2017) Guillochon, J., Parrent, J., Kelley, L. Z., & Margutti, R. 2017, ApJ, 835, 64
- Gunn et al. (2006) Gunn, J. E., Siegmund, W. A., Mannery, E. J., et al. 2006, AJ, 131, 2332
- Hamuy et al. (1995) Hamuy, M., Phillips, M. M., Maza, J., et al. 1995, AJ, 109, 1
- Hamuy et al. (2000) Hamuy, M., Trager, S. C., Pinto, P. A., et al. 2000, AJ, 120, 1479
- Hamuy et al. (2002) Hamuy, M., Maza, J., Pinto, P. A., et al. 2002, AJ, 124, 417
- Hoyle & Fowler (1960) Hoyle, F., & Fowler, W. A. 1960, ApJ, 132, 565
- Kashino et al. (2016) Kashino, D., Renzini, A., Silverman, J. D., & Daddi, E. 2016, ApJ, 823, L24
- Kauffmann et al. (2003) Kauffmann, G., Heckman, T. M., White, S. D. M., et al. 2003, MNRAS, 341, 33
- Kewley & Dopita (2002) Kewley, L. J., & Dopita, M. A. 2002, ApJS, 142, 35
- Law et al. (2016) Law, D. R., Cherinka, B., Yan, R., et al. 2016, AJ, 152, 83
- Mannucci et al. (2005) Mannucci, F., Della Valle, M., Panagia, N., et al. 2005, A&A, 433, 807
- Matheson et al. (2008) Matheson, T., Kirshner, R. P., Challis, P., et al. 2008, AJ, 135, 1598
- Mo et al. (1998) Mo, H. J., Mao, S., & White, S. D. M. 1998, MNRAS, 295, 319
- Perlmutter et al. (1999) Perlmutter, S., Aldering, G., Goldhaber, G., et al. 1999, ApJ, 517, 565
- Riess et al. (1998) Riess, A. G., Filippenko, A. V., Challis, P., et al. 1998, AJ, 116, 1009
- Rubin et al. (2016) Rubin, A., Gal-Yam, A., De Cia, A., et al. 2016, ApJ, 820, 33
- Schaefer et al. (2020) Schaefer, A. L., Tremonti, C., Belfiore, F., et al. 2020, ApJ, 890, L3
- Sérsic (1963) Sérsic, J. L. 1963, Boletin de la Asociacion Argentina de Astronomia La Plata Argentina, 6, 41
- Sersic (1968) Sersic, J. L. 1968, Atlas de Galaxias Australes
- Shao et al. (2014) Shao, X., Liang, Y. C., Dennefeld, M., et al. 2014, ApJ, 791, 57
- Silverman et al. (2012) Silverman, J. M., Foley, R. J., Filippenko, A. V., et al. 2012, MNRAS, 425, 1789
- Smee et al. (2013) Smee, S. A., Gunn, J. E., Uomoto, A., et al. 2013, AJ, 146, 32
- Somerville et al. (2008) Somerville, R. S., Barden, M., Rix, H.-W., et al. 2008, ApJ, 672, 776
- Stanishev et al. (2012) Stanishev, V., Rodrigues, M., Mourão, A., & Flores, H. 2012, A&A, 545, A58
- Sullivan et al. (2010) Sullivan, M., Conley, A., Howell, D. A., et al. 2010, MNRAS, 406, 782
- Thomas et al. (2010) Thomas, D., Maraston, C., Schawinski, K., Sarzi, M., & Silk, J. 2010, MNRAS, 404, 1775
- Westfall et al. (2019) Westfall, K. B., Cappellari, M., Bershady, M. A., et al. 2019, AJ, 158, 231
- Willett et al. (2013) Willett, K. W., Lintott, C. J., Bamford, S. P., et al. 2013, MNRAS, 435, 2835
- Worthey (1994) Worthey, G. 1994, ApJS, 95, 107
- Yan et al. (2016) Yan, R., Bundy, K., Law, D. R., et al. 2016, AJ, 152, 197
- Yan et al. (2019) Yan, R., Chen, Y., Lazarz, D., et al. 2019, ApJ, 883, 175
- Yaron & Gal-Yam (2012) Yaron, O., & Gal-Yam, A. 2012, PASP, 124, 668
- Zhou et al. (2019) Zhou, L., Liang, Y.-C., Ge, J.-Q., et al. 2019, Research in Astronomy and Astrophysics, 19, 121
- Zhou et al. (2020) Zhou, L., Liang, Y.-C., Ge, J.-Q., et al. 2020, Research in Astronomy and Astrophysics, 20, 169
- Zieliński et al. (2019) Zieliński, P., Wyrzykowski, Ł., Rybicki, K., et al. 2019, Contributions of the Astronomical Observatory Skalnate Pleso, 49, 125
Appendix A
| SN Name | plate-ifudsgn | SN R.A. | SN Dec. | SN Type | redshift |
|---|---|---|---|---|---|
| SN2010ee | 7495-12702 | 205.074951 | 26.353306 | II | 0.028401 |
| SN2017frb | 7815-3702 | 317.903473 | 11.497245 | Ia | 0.029382 |
| SN2007cn | 7979-12701 | 333.482452 | 13.756639 | Ia | 0.025379 |
| SN2017jcu | 8083-12704 | 50.695415 | 0.148083 | II | 0.022831 |
| SN2007R | 8138-12704 | 116.656372 | 44.789471 | Ia | 0.030805 |
| SN2019smv | 8258-3701 | 165.569458 | 44.334660 | II | 0.024607 |
| SN2012hj | 8257-12704 | 166.829956 | 46.379501 | Ia | 0.024578 |
| SN2018hfc | 8257-12701 | 165.494095 | 45.227539 | II | 0.019996 |
| SN2018ats | 8453-3701 | 153.234543 | 46.418091 | Ia | 0.038213 |
| SN2012al | 8453-12702 | 151.548370 | 47.294613 | II | 0.038107 |
| SN2010D | 8452-12705 | 157.934494 | 46.668056 | II | 0.024944 |
| SN2018aex | 8448-6102 | 165.189087 | 22.287500 | II | 0.022903 |
| PTF11bui | 8465-12705 | 198.235001 | 47.453472 | Ia | 0.028138 |
| SN2019cvz | 8484-12705 | 247.725021 | 46.588387 | II | 0.018346 |
| SN2019gqd | 8312-12703 | 247.208862 | 39.834347 | Ic | 0.035850 |
| SN2020abla | 8312-3704 | 247.164597 | 39.521030 | Ia | 0.025177 |
| SN2015cq | 8550-9101 | 247.410828 | 40.236111 | II | 0.028330 |
| SN2005bp | 7957-12704 | 257.430084 | 36.418915 | II | 0.027672 |
| PTF09sh | 8314-6101 | 243.492004 | 39.532806 | II | 0.037690 |
| SN2008ev | 8314-12701 | 240.758713 | 39.645611 | II | 0.030927 |
| SN2000cs | 8604-12701 | 245.884338 | 39.124748 | II | 0.035039 |
| SN1999cb | 8604-9102 | 246.451706 | 40.342335 | Ia | 0.029039 |
| SN2018aej | 8315-12704 | 236.095871 | 39.558094 | Ia | 0.047934 |
| PS15aot | 8603-6101 | 247.159836 | 39.548668 | Ia | 0.031176 |
| SN2020mnv | 8601-9101 | 250.182632 | 40.414482 | Ia | 0.025886 |
| SN2011cc | 8588-6101 | 248.455994 | 39.263527 | II | 0.031761 |
| ASASSN-15ns | 8588-6102 | 250.116745 | 39.320221 | Ia | 0.030079 |
| SN2019eho | 8615-9102 | 321.472076 | 0.414669 | Ia | 0.031740 |
| SN2017fel | 8616-12702 | 322.305756 | -0.294703 | Ia | 0.030537 |
| PTF12izc | 8655-3702 | 355.893219 | 0.568667 | Ia | 0.082650 |
| SN2015co | 7960-12705 | 258.650543 | 30.735666 | II | 0.029594 |
| SN2020jck | 7968-12701 | 322.948822 | -1.039164 | Ia | 0.051547 |
| SN2010dl | 7968-9102 | 323.754028 | -0.513278 | Ia | 0.030156 |
| SN2004I | 8078-12701 | 40.880123 | 0.308528 | II | 0.026670 |
| PTF12iiq | 8078-6102 | 42.532333 | -0.265111 | Ia | 0.029084 |
| SN2019omi | 8086-9102 | 57.249107 | 0.926919 | Ia | 0.035788 |
| LSQ12fnt | 8155-12701 | 53.172501 | -1.186389 | Ic | 0.030451 |
| SN2017ixz | 8147-12701 | 116.762627 | 26.773825 | II | 0.023592 |
| SN2017ckx | 8145-1902 | 117.045876 | 28.230289 | Ia | 0.027158 |
| SN2017cfq | 8149-9102 | 120.980026 | 26.520203 | II | 0.021748 |
| SN2020cvy | 8149-3704 | 120.205307 | 27.498581 | II | 0.017345 |
| SN2019abu | 8084-12702 | 50.536613 | -0.840061 | II | 0.036459 |
| SN2018ddh | 8262-6104 | 184.683502 | 44.781975 | Ia | 0.038341 |
| SN2021drc | 8450-6103 | 171.954544 | 21.386717 | Ia | 0.040623 |
| SN2021efd | 8450-9101 | 171.103043 | 23.649530 | Ib | 0.027756 |
| ASASSN-15pn | 8158-1901 | 60.859665 | -5.492028 | Ia | 0.038357 |
| LSQ12hxg | 8158-9102 | 62.947582 | -5.919028 | II | 0.038794 |
| AT2017boa | 8547-12701 | 217.631790 | 52.704327 | Ia | 0.044881 |
| SN2002aw | 8978-6102 | 249.371078 | 40.880638 | Ia | 0.026385 |
| SN2020dow | 8987-9102 | 137.983322 | 27.900387 | Ia | 0.047433 |
| SN2018btb | 8945-9102 | 173.616257 | 46.362530 | Ia | 0.033842 |
| SN2020acfp | 8945-12701 | 171.894165 | 47.379429 | Ia | 0.032730 |
| SN1998cs | 9029-12701 | 247.663422 | 41.215111 | Ia | 0.032463 |
| SN2002cg | 9029-12702 | 247.251999 | 41.283443 | Ic | 0.031887 |
| SN2004ct | 9041-9102 | 235.940628 | 28.416529 | Ia | 0.032751 |
| SN2017dgs | 9041-12702 | 236.389847 | 30.145430 | II | 0.031628 |
| SDSS1684-53239-484 | 9027-1901 | 245.686615 | 32.659184 | II | 0.040998 |
| SN2012fj | 9027-12701 | 243.936920 | 31.963249 | II | 0.031547 |
| SN2002ci | 9027-9101 | 243.908127 | 31.321501 | Ia | 0.022198 |
| SN2005bk | 9036-9102 | 240.570999 | 42.915359 | Ic | 0.024435 |
| PSN-J12565170+2629167 | 8951-12705 | 194.215424 | 26.487972 | Ib | 0.025364 |
| SN2017cxz | 8625-9101 | 259.832428 | 57.898834 | Ib | 0.028949 |
| SDSS-II-SN-20130 | 7964-12704 | 316.558014 | 0.098017 | II | 0.050593 |
| SN2019abp | 9050-6102 | 245.860565 | 22.486141 | II | 0.037521 |
| SN2007gl | 8080-12705 | 47.888500 | -0.746412 | Ib | 0.028230 |
| SN2018jfp | 8080-12703 | 49.484486 | -0.169706 | II | 0.022797 |
| SN2021T | 8657-9101 | 9.829108 | -0.455769 | Ia | 0.045407 |
| SDSS-II-SN-12882 | 8154-9102 | 45.958199 | -0.203996 | II | 0.027592 |
| SN2020ksa | 8993-12701 | 164.866455 | 46.124577 | Ib | 0.022165 |
| SN2016acq | 9509-12703 | 124.102455 | 25.993111 | II | 0.045242 |
| SN2016gkm | 9501-12705 | 130.721100 | 25.070923 | Ib | 0.017257 |
| SN2003an | 8984-9101 | 201.973129 | 28.508112 | Ia | 0.036994 |
| SN2020fcx | 8311-12703 | 205.041748 | 23.341530 | II | 0.031926 |
| SN2007O | 9033-12705 | 224.021576 | 45.404694 | Ia | 0.036187 |
| PTF11go | 8996-6102 | 173.001007 | 53.710583 | II | 0.026810 |
| SN2021bqv | 9038-6101 | 238.758133 | 41.578018 | Ia | 0.033563 |
| PTF11cao | 9048-12704 | 244.699829 | 25.187916 | Ia | 0.039508 |
| SN2020uoo | 9095-6102 | 243.442657 | 22.919676 | Ia | 0.031916 |
| SN2002G | 8323-6101 | 196.980255 | 34.085140 | Ia | 0.033650 |
| SN2020ofw | 9863-12701 | 195.139450 | 27.504499 | II | 0.018608 |
| SN2009L | 9876-12703 | 194.700424 | 27.673779 | Ia | 0.027962 |
| SN2021apg | 9881-12704 | 205.330185 | 24.495543 | II | 0.026856 |
| SN2018lev | 9871-12702 | 228.284042 | 41.263699 | II | 0.029064 |
| PTF12ewk | 9869-12702 | 247.241119 | 39.319721 | Ia | 0.033924 |
| SN2006cq | 8322-12705 | 201.104584 | 30.956306 | Ia | 0.048502 |
| SN2020kte | 9186-6102 | 259.121674 | 29.445555 | Ia | 0.030187 |
| SN2018emi | 9893-9102 | 256.651367 | 24.545319 | Ia | 0.038230 |
| PTF13dfa | 8097-6104 | 27.377167 | 13.992556 | Ia | 0.068000 |
| SN2019vin | 9189-12705 | 52.705372 | -7.046347 | Ia | 0.038909 |
| SN2019smi | 8986-6101 | 119.868462 | 26.889795 | Ic | 0.026470 |
| SN2020umy | 8986-6104 | 119.902893 | 28.863256 | II | 0.045626 |
| SN2006te | 10213-12705 | 122.929123 | 41.554668 | Ia | 0.031548 |
| SN2007kd | 8152-12701 | 141.491714 | 34.633141 | Ia | 0.024224 |
| SN2012cq | 8245-12701 | 137.022751 | 20.503471 | II | 0.025612 |
| SN2019dfa | 8438-12702 | 149.749191 | 17.818794 | Ia | 0.025439 |
| SN2016aak | 8248-12705 | 138.554214 | 16.741722 | Ia | 0.027855 |
| SN2020hgg | 8988-9102 | 187.235001 | 40.847279 | Ia | 0.064948 |
| SN2020fc | 10519-12704 | 154.897339 | 6.328467 | II | 0.028476 |
| SN2019vsi | 9882-12701 | 206.479034 | 23.061930 | Ib | 0.027886 |
| SN2019hjl | 10503-6104 | 160.622864 | 5.083230 | II | 0.028108 |
| SN2012O | 9880-12701 | 195.166626 | 27.923445 | Ia | 0.025087 |
| SN2011ki | 9040-12701 | 242.626923 | 27.499777 | II | 0.031851 |
| SN2021dxo | 8260-6101 | 182.411789 | 42.008957 | II | 0.022881 |
| SN2018ds | 8441-12701 | 222.223206 | 38.767693 | Ia | 0.031662 |
| SN2019lpd | 9030-9102 | 243.570999 | 30.999445 | Ia | 0.061721 |
| SN1999df | 8593-6104 | 227.235504 | 52.448082 | II | 0.037914 |
| SN2001it | 8593-12704 | 226.539169 | 53.411556 | II | 0.034190 |
| SN2007ac | 11945-12701 | 251.759827 | 40.146557 | II | 0.030193 |
| SN2020ytg | 9191-6101 | 312.041656 | -1.211139 | II | 0.056335 |
| SN2013ag | 11871-6102 | 192.895920 | 26.629278 | Ia | 0.021295 |
| SN2012ee | 9187-9101 | 311.313660 | -5.622806 | Ia | 0.027326 |
| LSQ12btw | 10518-3703 | 152.620087 | 5.536800 | Ib | 0.057650 |
| SN2006bz | 11006-12704 | 195.180756 | 27.961611 | Ia | 0.028093 |
| SN2019gmh | 11941-12705 | 247.763168 | 41.153965 | II | 0.030194 |
| SN1992ap | 11941-12704 | 247.613876 | 41.487804 | Ia | 0.029864 |
| iPTF13bld | 11942-12701 | 246.227448 | 41.049789 | II | 0.033074 |
| SN2009fv | 11942-12705 | 247.434250 | 40.811611 | Ia | 0.029338 |
| SN2008cw | 11942-6102 | 248.159454 | 41.459221 | II | 0.032433 |
| SN2014bo | 11942-12703 | 246.942291 | 41.739918 | Ia | 0.133471 |
| SN2008Z | 11751-12703 | 145.813538 | 36.284416 | Ia | 0.020621 |
| SN2020gac | 11755-3703 | 187.442627 | 42.732700 | II | 0.038634 |
| PTF11bnf | 8563-12701 | 241.186752 | 49.457832 | Ia | 0.024164 |
| SN1940C | 8589-12705 | 226.729172 | 56.508888 | II | 0.029552 |
| SN2019qsc | 8589-6104 | 226.512772 | 55.573055 | Ia | 0.029223 |
| PTF10bhu | 11761-9101 | 193.868500 | 53.574638 | Ic | 0.035834 |
| SNF20080322-000 | 11979-12704 | 252.089371 | 23.614750 | Ia | 0.030252 |
| SN2001dy | 11984-6103 | 256.247589 | 23.168388 | II | 0.030081 |
| SN2010ed | 11984-12704 | 257.350555 | 22.213362 | Ia | 0.048984 |
| SN2019gvw | 11827-12702 | 211.810120 | 49.093830 | Ia | 0.071327 |
| SN2016acx | 11014-1902 | 194.854996 | 27.740101 | Ia | 0.020117 |
| SN2018iun | 11018-3703 | 197.128494 | 50.641460 | II | 0.029314 |
| SN2007F | 11018-12704 | 195.812836 | 50.618805 | Ia | 0.023619 |