The ALFALFA Almost-Dark Galaxy AGC 229101: A Two Billion Solar Mass HI Cloud
with a Very Low Surface Brightness Optical Counterpart
Abstract
We present results from deep H i and optical imaging of AGC 229101, an unusual H i source detected at vhelio 7116 km s-1 in the ALFALFA survey. Initially classified as a candidate “dark” source because it lacks a clear optical counterpart in SDSS or DSS2 imaging, AGC 229101 has of H i, but an H i line width of only 439 km s-1. Low resolution WSRT imaging and higher resolution VLA B-array imaging show that the source is significantly elongated, stretching over a projected length of 80 kpc. The HI imaging resolves the source into two parts of roughly equal mass. WIYN pODI optical imaging reveals a faint, blue optical counterpart coincident with the northern portion of the H i. The peak surface brightness of the optical source is only 26.6 mag arcsec-2, well below the typical cutoff that defines the isophotal edge of a galaxy, and its estimated stellar mass is only , yielding an overall neutral gas-to-stellar mass ratio of MHI/M 98. We demonstrate the extreme nature of this object by comparing its properties to those of other H i-rich sources in ALFALFA and the literature. We also explore potential scenarios that might explain the existence of AGC 229101, including a tidal encounter with neighboring objects and a merger of two dark H i clouds.
1 Introduction
The Arecibo Legacy Fast ALFA blind H i survey (ALFALFA; Giovanelli et al., 2005, Haynes et al., 2018) has detected and cataloged 31,500 extragalactic H i sources out to a redshift of , providing a robust characterization of the H i properties of galaxies in the nearby universe. One of the many scientific motivations for ALFALFA was to investigate the possible existence of gas-rich but nearly starless “dark” galaxies (e.g., Giovanelli et al., 2005, 2010). Scaling relations between the H i and stellar contents of galaxies suggest that there are strong ties between atomic gas content and star formation laws (e.g., Huang et al., 2012), and theoretical predictions are mixed as to the potential existence of sources that are H i-rich while also being optically dark (Verde et al., 2002; Taylor & Webster, 2005; Crain et al., 2017).
Only 1% of ALFALFA sources are not readily associated with optical counterparts in existing catalogs or surveys like the Sloan Digital Sky Survey (SDSS; Eisenstein et al., 2011). The majority of these sources can clearly be identified as either debris from tidal interactions between galaxies, or as OH megamasers masquerading as H i (Leisman, 2017; Suess et al., 2016). The remaining objects fall into two main categories. The first is Ultra-Compact High-Velocity Clouds (e.g., Giovanelli et al., 2010; Adams et al., 2013; Janesh et al., 2019), which have velocities and other properties (e.g., HI sizes, masses) that make them good candidates for as-yet unidentified gas-rich dwarf galaxies located in and around the Local Group. The second category is “Almost Dark galaxies” (e.g., Cannon et al., 2015; Janowiecki et al., 2015), which also lack an unambiguous optical counterpart (although some do show faint optical emission nearby that may or may not be associated with the H i source) but have a much wider range of masses and distances than the UCHVCs. Nearly all of the Almost Dark sources have ultimately been associated with very low surface brightness optical counterparts, some of which have similar properties and stellar populations to so-called “ultra-diffuse galaxies” (UDGs; see van Dokkum et al., 2015, Leisman et al., 2017 and Section 4.1.1 of this paper), and others which may be tidal in nature (Lee-Waddell et al., 2016; Leisman et al., 2016).
A few of the Almost Dark objects have been particularly difficult to classify and interpret, and have required dedicated follow-up observations in order to determine their nature and properties. For example, the object Coma P (AGC 229385) was detected by ALFALFA with a heliocentric recession velocity of 1348 km s-1 and a signal-to-noise ratio (S/N) of 99, and appeared as an ultra-low surface brightness object (peak surface brightness 26.4 mag arcsec-2) in deep follow-up imaging with the WIYN 3.5-m Observatory (Janowiecki et al., 2015). The object was later resolved into stars in Hubble Space Telescope (HST) imaging presented in Brunker et al. (2019), revealing an unexpectedly small distance (5.5 Mpc) and large peculiar velocity (Ball et al., 2018; Anand et al., 2018; Brunker et al., 2019). Additionally, Ball et al. (2018) presented resolved H i imaging, which revealed a H i diameter of 4 kpc, large for both its H i and stellar mass, and complicated gas dynamics. Thus, Coma P has proved difficult to understand both in terms of its distance, stellar properties, H i properties, and its large gas mass to optical light ratio (30).
In this paper, we present results from observations of an ALFALFA Almost Dark source that also possesses unusual properties and has likewise proved difficult to classify and explain. Like Coma P, AGC 229101 is detected strongly in the ALFALFA survey, and has no readily identifiable optical counterpart in corresponding optical imaging from surveys like SDSS. Unlike Coma P, however, AGC 229101 has a recession velocity of 7116 km s-1, which is large enough to provide a reasonably accurate Hubble flow distance even if its peculiar velocity is several hundred km s-1. This allows us to derive fundamental quantities that are distance-dependent, such as HI mass, stellar mass, absolute magnitude, and physical size for the object. The distance to AGC 229101 in the ALFALFA Extragalactic H i Source Catalog is 105.9 2.2 Mpc; this is calculated by combining the recessional velocity in the CMB reference frame with an H0 value of 70 km s-1 Mpc-1 (Haynes et al., 2018). Follow-up optical observations with the WIYN 3.5-m telescope111The WIYN Observatory is a joint facility of the NSF’s National Optical-Infrared Astronomy Research Laboratory, Indiana University, the University of Wisconsin-Madison, Pennsylvania State University, the University of Missouri, the University of California-Irvine and Purdue University. and H i synthesis imaging reveal an even lower surface brightness optical counterpart and more extended gas distribution, and a larger H i gas mass to optical light ratio, than those of Coma P. In this paper, we present results from these follow-up observations, which paint a picture of an object that is extreme in its properties when compared to the over 31,000 extragalactic ALFALFA detections. We also explore potential scenarios that may help us understand AGC 229101 and its origins.
The paper is organized as follows. In Section 2 we discuss the H i and optical observations of AGC 229101. In Section 3, we present the results of the observations, including the H i gas content and stellar properties of AGC 229101, and then examine the galaxy environment surrounding the object. In the final section of the paper, we compare AGC 229101 to other sources, present potential interpretations of our observations, and speculate about the nature and origin of this extreme source. Throughout the paper, we assume a CDM cosmological model, with 70 km s-1, , and , and the (Haynes et al., 2018) distance to AGC 229101 of 105.92.2 Mpc.
2 Observations and Analysis
2.1 HI Data
The ALFALFA detection of AGC 229101 revealed a source at RA, Dec 12h20m48.7s, +25d3819 with a signal-to-noise ratio (S/N) of 13.2 and a heliocentric recessional velocity of 71164 km s-1. The source was immediately noted for its high H i mass and the lack of an optical counterpart in existing survey data. The ALFALFA data yield a log() value of 9.31, comparable with that of the Milky Way, but with a narrow H i line width for its mass ( km s-1), and no easily identifiable optical counterpart in SDSS or Digitized Sky Survey 2 (DSS2) imaging.
Due to its apparently extreme properties, AGC 229101 was included in a set of exploratory observations of selected ALFALFA Almost Dark sources carried out with the Westerbork Synthesis Radio Telescope (WSRT) (program R13B/001; PI Adams). AGC 229101 was observed in 12-hour pointings in two polarizations, with a 1024-channel 10 MHz bandpass centered on the central H i velocity measured in ALFALFA.
The data reduction process for AGC 229101 and other sources in the exploratory WSRT sample is described in detail elsewhere (Janowiecki et al., 2015; Leisman et al., 2016, Leisman et al., 2017). The reduction was accomplished with an automated pipeline based on the MIRIAD (Sault et al., 1995) data software (see Serra et al., 2012, Wang et al., 2013). The pipeline includes automatic RFI flagging, primary bandpass calibration, and iterative deconvolution of the data with the CLEAN algorithm to apply a self-calibration. This process produces cubes with three different robustness weightings, r=0.0, r=0.4, and r=6.0, and bins the data to a velocity resolution of 6.0 km s-1 after Hanning smoothing.
After initial reduction of the WSRT data indicated that AGC 229101 has a large extent, the source was included in a high resolution follow-up program (15A-307; P.I. Leisman) carried out with the Karl G. Jansky Very Large Array (VLA) in 2015. We observed the source for three five-hour observing blocks in the B configuration, using the WIDAR correlator in dual polarization mode with a single 8-MHz-wide sub-band with 1024 channels. This yielded a native channel width of 1.7 km s-1.
The VLA data reduction follows the same procedure detailed in Ball et al. (2018). We use standard procedures in the CASA (Common Astronomy Software Applications; McMullin et al., 2007) package, including flagging of the visibilities, calibration, and continuum subtraction. We imaged the calibrated uv data using the CLEAN task in CASA, with a Briggs robust weighting of 2.0 to maximize sensitivity. We also imaged the uv data applying an 8 k taper to create an lower resolution image using the shorter uv spacings. Importantly, in both cases we follow the procedure in Ball et al. (2018) to image together the uv data set from WSRT with the VLA data set, creating maps that includes baselines with a wide range of spacings, increasing the sensitivity of the VLA observations to extended emission. We also improved the localization of the extended flux by using the multiscale clean option (Cornwell, 2008). The resulting cleaned combined VLA and WSRT images have synthesized beams of 5.1″ and 13.1″ with and without the 8 k taper respectively.
We create H i total intensity maps from all cleaned images by masking the image cubes at 2 and then summing along the velocity axis. We then blank the noise in the moment 0 maps using a 2 mask created with smoothed versions of the moment 0 maps. We convert these maps to H i column densities assuming optically thin H i gas that fills the beam, and also produce H i moment one maps (representing velocity fields) from the masked cubes. The resulting H i images and velocity maps are discussed in Section 3.1.
2.2 Optical Data
Observations of AGC 229101 were obtained on 1 April 2014 with the partially-populated One Degree Imager (pODI; Harbeck et al., 2014) on the 3.5-meter WIYN telescope at Kitt Peak National Observatory. The pODI camera (which has since been upgraded with a larger detector array) included nine orthogonal transfer arrays (OTAs) laid out in a 3 x 3 grid in the center of the focal plane. Four additional OTAs were positioned outside the central grid and used for imaging guide stars. Each individual OTA consists of an 8 x 8 arrangement of CCD detectors. The pixel scale of the CCDs was 0.11″ pixel and the field-of-view of the central 3 x 3 grid of OTAs was approximately 24′ x 24′. We observed AGC 229101 in the SDSS g and r filters. In order to fill in the gaps between the CCD detectors, we divided the observations into nine 300-second exposures and dithered the telescope between exposures. The total integration time was 45 minutes per filter.
Our images were reduced using the QuickReduce data reduction pipeline (Kotulla, 2014) within the One Degree Imager Pipeline, Portal, and Archive (ODI-PPA) system222The ODI Portal, Pipeline, and Archive (ODI-PPA) system is a joint development project of the WIYN Consortium, Inc., in partnership with Indiana University’s Pervasive Technology Institute (PTI) and NSF’s NOIRLab. (Gopu et al., 2014). The QuickReduce pipeline performs the following reduction tasks: masks saturated pixels; corrects for crosstalk and persistence; subtracts the overscan signal; corrects for nonlinearity; applies the bias, dark, and flat-field corrections; applies a pupil ghost correction; and removes cosmic rays. After the QuickReduce step, an illumination correction was applied to the images, and the images were then background-subtracted, scaled to a common flux level, and then combined, and the appropriate sky background was restored. The final result was a single science-ready image in each filter. The average full-width at half-maximum (FWHM) of the point spread function (PSF) is 0.8″ in the final combined g image and 0.9″ in the final combined r image. Photometric measurements of SDSS stars that appeared within the pODI images were used to derive calibration coefficients (zero points and color terms) that were later applied to our photometric measurements of the other sources in the frames.
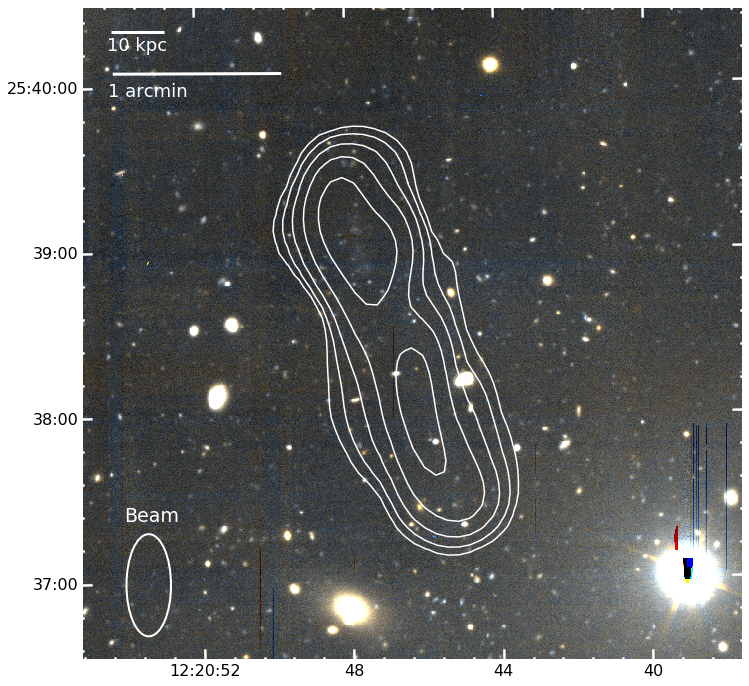
The main results of our follow-up imaging campaign are illustrated in Figure 1, which shows a color image constructed from the g and r WIYN pODI images of AGC 229101, with low resolution H i column density contours from WSRT observations shown as white solid lines overlaid on the image. The column density levels shown in the figure correspond to 1, 2, 4, 8, and 16 x 1019 cm-2. Our deep H i WSRT and VLA observations reveal that the H i distribution of AGC 229101 is double-peaked and extends 80 kpc in roughly the north-south direction. Extremely faint, blue, low surface brightness optical emission that coincides with the northern peak of the H i column density distribution is barely visible in the color image. Details of the analysis and measurements we have derived from the H i and optical data are given in the next section.
3 Results
3.1 The HI content of AGC 229101
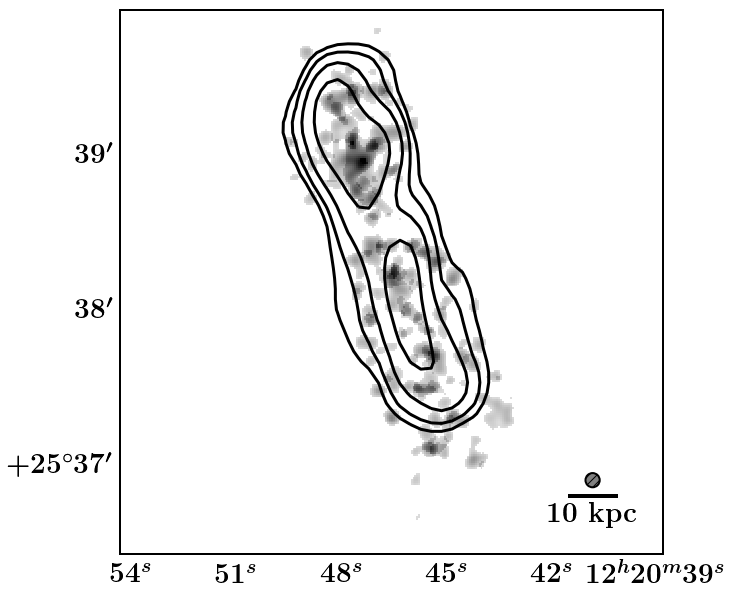
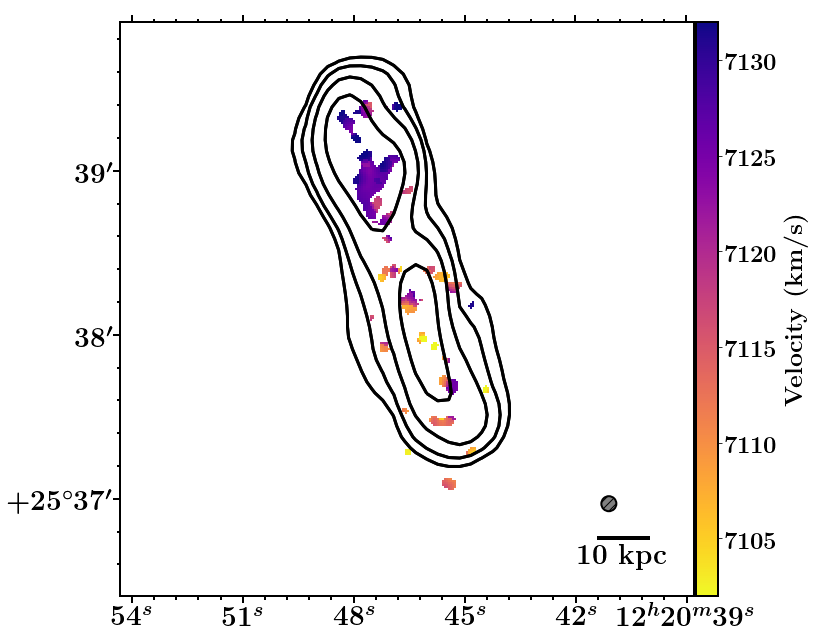
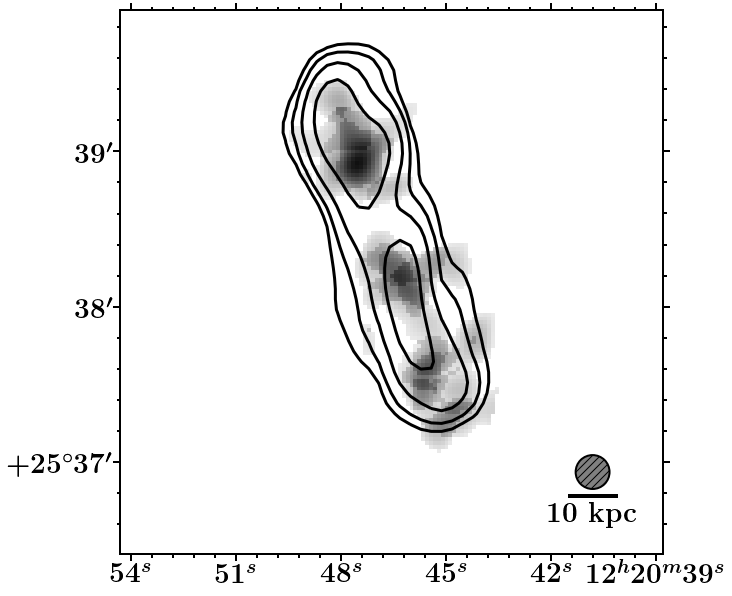
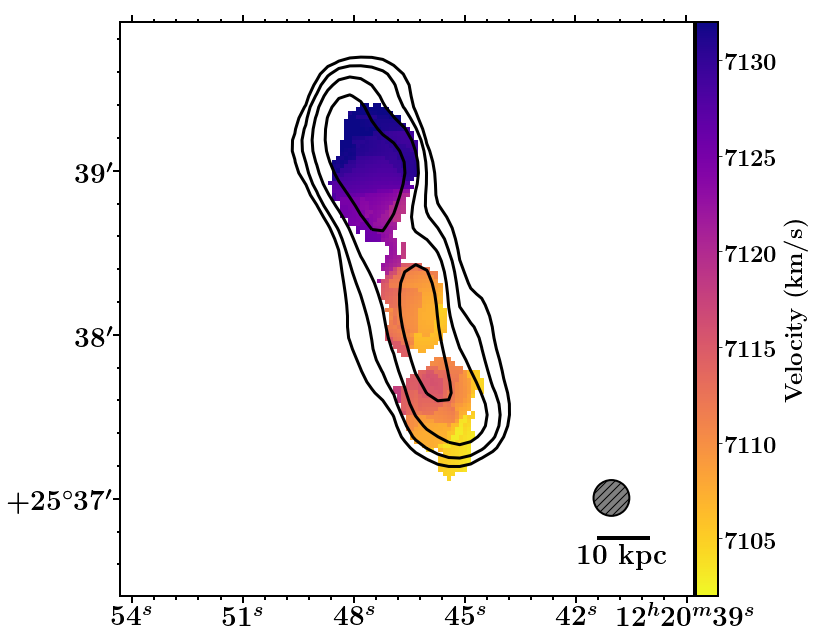
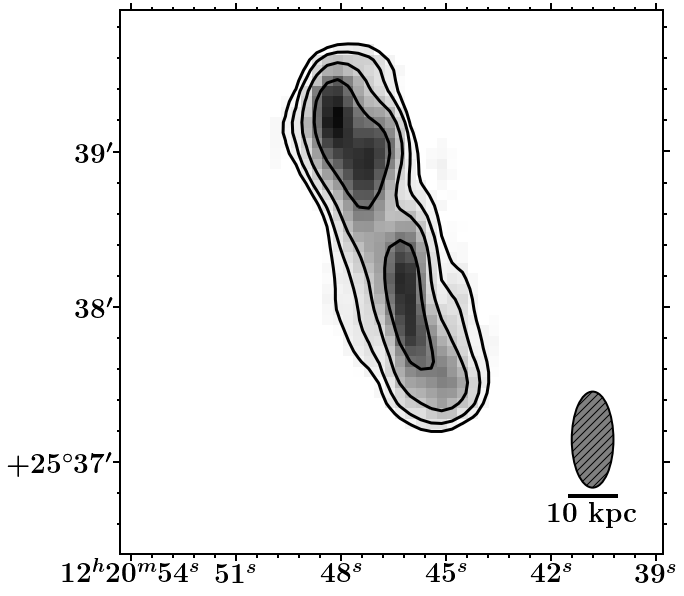
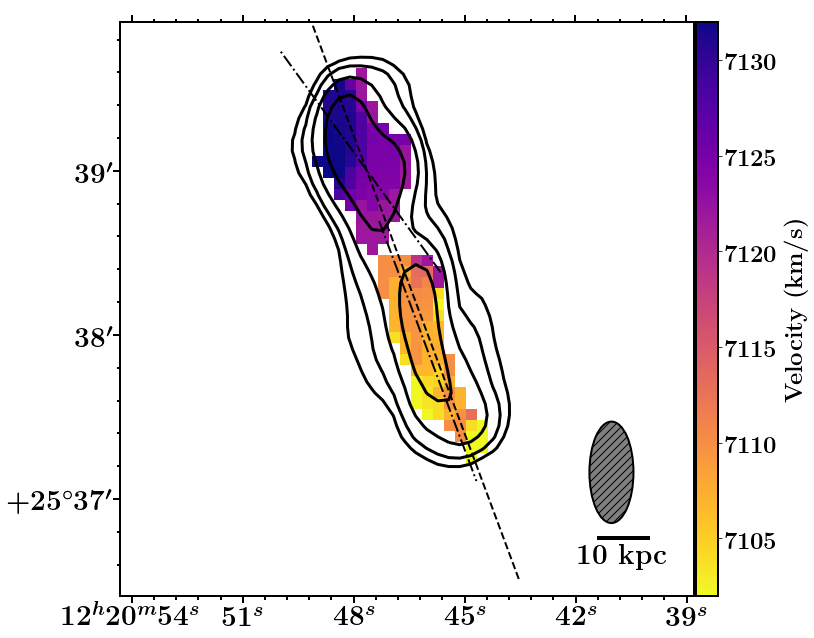
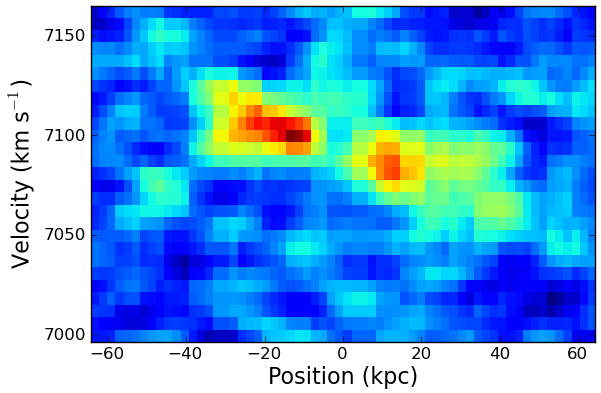
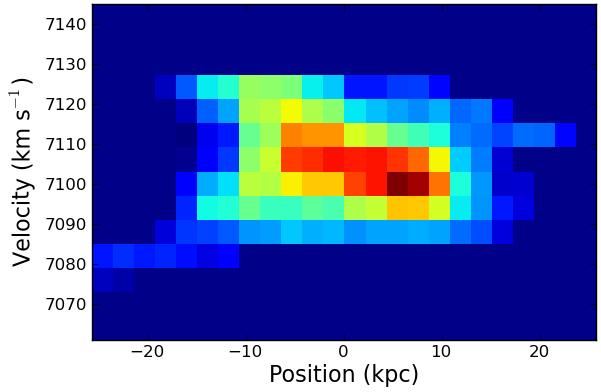
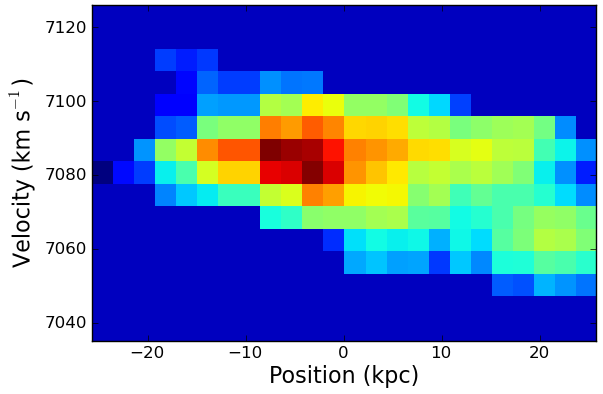
Figure 2 shows the resolved H i total flux maps from WSRT and combined VLA and WSRT imaging at three different resolutions. All of the maps show a very elongated H i structure, stretching 80 kpc in roughly the north-south direction. The emission is resolved into two primary overdensities that appear connected in the low resolution imaging (which is sensitive to low column densities) but that appear as two separate clumps at higher resolution. At the highest resolution (5.5″= 2.6 kpc beam), the gas is resolved into a large number of individual clumps and clouds, though this may primarily be the effect of the low sensitivity of the image, since much of the emission is only detected at the 2-3 level in the cleaned cube at this resolution.
We note that the high and medium resolution images recover 57% and 65% of the ALFALFA flux respectively, while the low resolution WSRT image recovers 83% of the ALFALFA flux. This implies that there is low column density emission detected in the single dish image that is below the sensitivity of the interferometric image. Thus, the apparent separation of the northern and southern clouds in the higher resolution data may simply be the result of the more limited sensitivity of these observations.
The northern portion of the H i has a peak column density of 5.2 atoms cm-2 in the highest resolution B-array-only imaging, while the southern portion has a peak column density of 4.2 atoms cm-2. The northern portion is somewhat less elongated, with a length of 35 kpc, and with a more symmetric H i distribution. The southern portion extends 45 kpc along its major axis. The two portions have approximately equal H i mass; selectively masking just the northern component results in a flux that is 49.8% of the total WSRT flux, and, the southern component is 47.1% of the total WSRT flux, with a small amount of low signal to noise flux between the two components. Applying these percentages to the total H i mass calculated from the ALFALFA flux results in estimated component masses of and 8.99 for the northern and southern clumps respectively.
The two main components of the source appear to be at similar, but slightly offset, velocities ( km s-1). The panels on the right side of Figure 2 show moment one velocity maps of the resolved H i at three different resolutions. There is a marked but shallow velocity gradient across the entire source, as well as across both the northern and southern clumps (the line widths at 50% of the peak flux are W km s-1 and 41 km s-1 for the two clumps respectively). We note that the apparent change in the direction of the velocity gradient of the northern component in the low resolution WSRT image versus the higher resolution images is likely a resolution effect, since the elongation of the WSRT beam is in the direction of the gradient seen in the higher resolution maps. Figure 3 shows position velocity slices through the major axis of the entire source, as well as the northern and southern clumps individually. Both clumps show a velocity gradient, though the gradient is somewhat narrow and on the order of the velocity dispersion in the beams.
| Quantity (units) | Value | Stellar Quantity (units) | Value |
|---|---|---|---|
| RA (h m s, J2000) | 12:20:46.8 | (mag arcsec-2) | 26.58 0.03 |
| Dec (∘ , J2000) | +25:38:24.4 | (mag arcsec-2) | 26.78 0.06 |
| Vh,50 (km s-1) | 71164 | mg,0 (mag) | 22.01 0.18 |
| W50 (km ) | 43 9 | mr,0 (mag) | 21.58 0.19 |
| Flux (Jy-km s-1) | 0.78 0.05 | Mg,0 (mag) | 13.11 0.18 |
| Distance (Mpc) | 105.9 2.2 | Mr,0 (mag) | 13.55 0.19 |
| 9.31 0.05 | (mag; large aperture) | 0.44 0.26 | |
| NHI,peak ( cm-2) | 5.1 1.1 | (mag; small aperture) | 0.06 0.13 |
| RHI (kpc) | 33.5 2.8 | V (mag) | 21.74 0.24 |
| Rmax (kpc) | 39.6 2.8 | B-V (mag; large aperture) | 0.65 0.26 |
| MHI/M∗ | 98 | B-V (mag; small aperture) | 0.28 0.12 |
| MHI/Lg () | 105 | 7.32 0.33 | |
| MHI/Lr () | 107 | (arcsec) | 5.9 1.3 |
| MHI/LB () | 110 | (kpc) | 3.0 0.7 |
Note. — The table lists, in this order: the central position of the H i source, along with measured heliocentric radial velocity, width, and total flux of the H i detection; the estimated distance to the source from the ALFALFA catalog (Haynes et al., 2018); the log of the total mass, column density, and radius of the radio source; the ratio of H i mass to stellar mass; the ratio of H i mass to optical luminosity in the , , and -band filters; the peak surface brightness of the optical counterpart in the - and -band; the total apparent and absolute magnitudes of the optical counterpart in the and filters; the color of the optical counterpart; the apparent magnitude and color of the optical counterpart; and the estimated stellar mass and half-light radius (in both arc seconds and kpc) of the optical counterpart. The optical surface brightness values, magnitudes, and colors have been corrected for Galactic extinction by applying the Schlafly & Finkbeiner (2011) coefficients to the reddening values from Schlegel et al. (1998). The peak H i column density is measured in the highest resolution (5.1″ beam) moment 0 map.
3.2 The Stellar Contents of AGC 229101
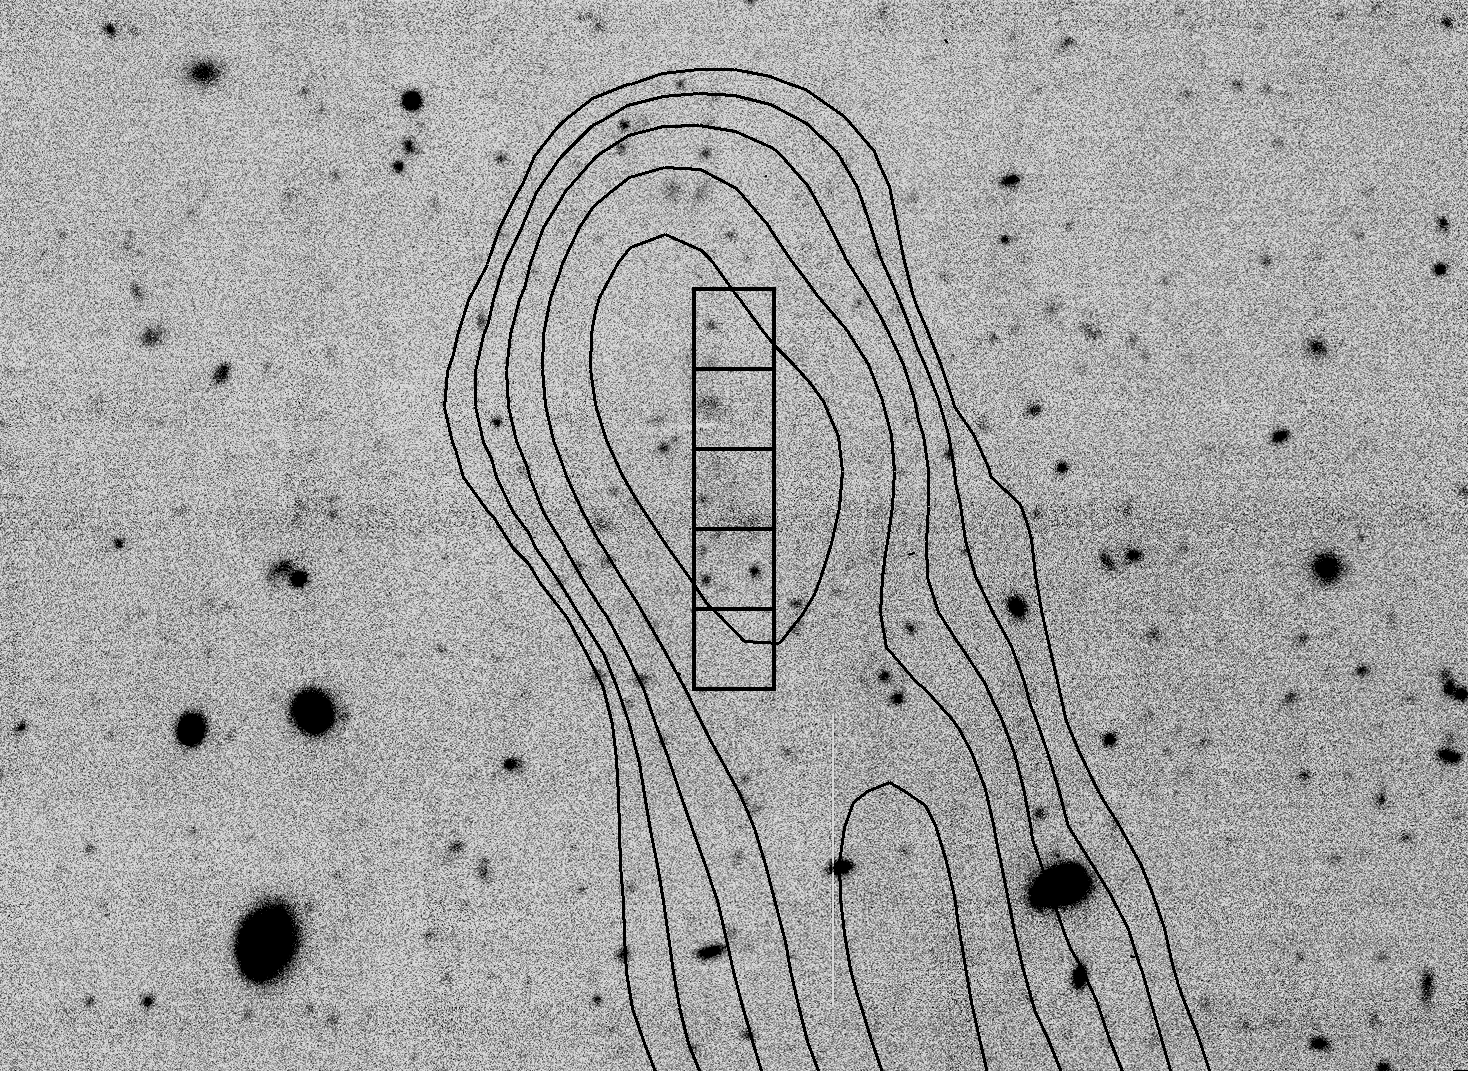
Our deep WIYN pODI imaging reveals an extremely low surface brightness optical counterpart centered at the northern peak of the H i emission (Figure 1). This optical source is barely detectable in the WIYN pODI data, as detailed below and illustrated in Figure 4. Table 1 lists the various quantities that we derived from the combined analysis of the WIYN imaging and the H i data; below we describe how the optical quantities were measured and/or calculated.
3.2.1 Optical Surface Brightness
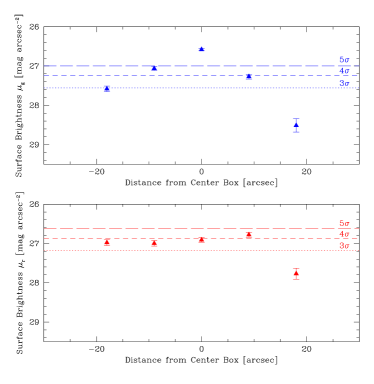
The low S/N nature of the optical source precludes standard surface brightness profile fitting; therefore to measure the surface brightness of AGC 229101, we followed a process similar to that described in Janowiecki et al. (2015), which presented WIYN pODI imaging of the low surface brightness optical counterpart to AGC 228385 (Coma P). We first determined the local mean sky background level in the images using 20 small boxes, each 45 pixels (5″) on a side, positioned on blank patches of sky around the northern HI clump. We then placed five square boxes, each 80 pixels (9″) on a side, across the optical emission that appears in the northern HI region (see the left-hand panel of Figure 4). The choice of 80 pixels for the box width was a compromise – the boxes were large enough that a few (five) boxes could cover the entire area of the optical emission, but small enough to limit the amount of sky background included in each box. We masked out two sources that were located within one of the object boxes and appeared to be foreground objects separate from the diffuse emission from the optical counterpart. The two sources are quite faint (with 24.2 and 25.0 mag) and significantly bluer than the emission from the optical counterpart. Note that Figures 1 and 4 show the unmasked images, and the two discrete sources are visible in the fourth box from the top in Figure 4. We measured the counts per pixel within each of the five boxes and subtracted the local mean sky background level (in counts per pixel).We then converted the net counts per pixel in each box to a surface brightness level in units of mag arcsec-2. The measured standard deviation of the sky level of the 20 background boxes was used to calculate the surface brightness level detection thresholds of the images. The 3-, 4-, and 5- detection thresholds are, respectively, 27.56, 27.24, and 27.00 mag arcsec-2 in the -band image and 27.18, 26.87, and 26.63 mag arcsec-2 in the -band image.
The results of the surface brightness measurements are plotted in the right-hand panel of Figure 4. The errors on the surface brightness values take into account the Poisson errors in the counts from the object and the sky, as well as the uncertainty in the measurement of the sky background; the errors range from 0.030.06 mag in the central box (where the flux from the optical counterpart is most apparent) to 0.15-0.17 mag in the outlying boxes.
The surface brightness of the optical counterpart has a higher S/N level in the -band image – greater than or equal to 4 in the central three consecutive boxes, with the central box reaching more than 0.4 mag arcsec-2 brighter than the 5- threshold. The S/N level is lower in the -band, but the surface brightness values in the central boxes still hover around the 3- and 4- thresholds. The brightest surface brightness values in and are 26.580.03 mag arcsec-2 (in the central box) and 26.780.06 mag arcsec-2 (in the box 9 north of the central box), respectively.
Since each box is 9 square, we estimate the length of the optical counterpart in our images to be approximately 27″, which translates to 13 kpc at the 105.9 Mpc distance of AGC 229101. This is roughly a factor of three smaller than the length (along the major axis) of the northern portion of the H i distribution (see Section 3.1) and about six times smaller than the total (north-to-south) extent of the H i.
3.2.2 Total Magnitude, Color, and Radius
We calculated the global properties of the optical counterpart by carrying out aperture photometry of the object on the and images. To ensure that we were measuring an accurate total magnitude, we measured the flux within a large aperture that was positioned and sized so that it included the three consecutive central boxes, all of which showed a significant detection in the surface brightness measurements. The center of the aperture also coincides with the H i centroid position of the northern H i column density peak. The aperture has a diameter of 27″ (246 pixels). The optical counterpart is so faint that the flux from the sky background dominates the measurement; thus we also measured the flux at the same position but using a much smaller aperture, with a diameter of 12″ (106 pixels), in order to try to limit the contribution from the sky background and perhaps measure a more representative color for the object.
The total magnitudes and colors are listed in Table 1. The and magnitudes in the table are those derived from the larger aperture, since that aperture encompasses the emission from the optical counterpart that is apparent in the image. We list the color for both the larger and smaller aperture, in order to document the effect of the aperture size on the measured color. While the optical counterpart has a blue color in both apertures, it ranges from 0.440.26 mag within the larger aperture to as blue as 0.060.13 mag in the smaller aperture. We use the relations given in Jester et al. (2005) to convert our , photometry results to and values and list them in Table 1. Combining the total magnitude with the distance modulus for AGC 229101 yields an absolute -band magnitude of 13.38 mag.
Next we derived an empirical half-light radius for the optical counterpart. First, we determined the total number of sky-subtracted counts contained within the large aperture that was used to calculate the total apparent magnitudes. We then carried out photometry of the object with a series of apertures, starting with a small radius and increasing the aperture radius by one pixel (0.11″) each time. We used the results of these measurements to calculate the aperture radius that encloses half of the total counts, and adopt that as the half-light radius. The estimated half-light radius, in both arc seconds and kpc, is listed as rh in Table 1. The uncertainty in this quantity takes into account the uncertainty in the location of the half-light radius and the uncertainty on the total flux from the object.
3.2.3 Stellar Mass
Stellar mass estimates are challenging in that they rely on a detailed understanding of the underlying stellar population in a given galaxy. In the absence of spectroscopic data, most photometric estimates rely on calibrated color – stellar mass-to-light ratio relations (CMLRs) to estimate stellar mass-to-light ratios. While CMLRs have been calibrated on model data, and a range of observational samples (see, e.g., Du & McGaugh, 2020 and references therein), the applicability of these fits to galaxies like AGC 229101 with extreme or unusual properties is not clear. Still, we apply a selection of CMLRs in order to place a constraint on the range of stellar masses and to facilitate comparison to other work.
To do this we combine the total color from the large-aperture photometry with three different CMLRs to estimate stellar mass-to-light ratios in the - and -bands, and then combine these with the large-aperture stellar luminosity in the corresponding filter to compute total stellar mass. Though there are many available measurements and calibrations of the CMLR, we choose those from Bell et al. (2003), Herrmann et al. (2016), and Du et al. (2020) – which are calibrated with spiral, dwarf, and low surface brightness galaxies respectively – to attempt to encompass the range of potential underlying stellar populations relevant to AGC 229101. The Du et al. (2020) relations give the lowest estimated stellar masses (1.31 & 1.35), and the Bell et al. (2003) relations give the highest values (2.87 & 2.86). The Herrmann et al. (2016) relation, which was applied to a sample of ALFALFA UDGs in Mancera Piña et al. (2019), gives 1.80. All three relations also give slightly different values depending on the chosen optical band.
The large uncertainty in our color measurement creates additional uncertainty in our stellar mass estimate, further complicating the picture. Simply varying the color by adding or subtracting the associated error produces a substantial change in the calculated mass-to-light ratio, which in turn yields a total stellar mass that varies significantly, by a factor of two or more, for all three relations.
Since it is not clear which relation ultimately best applies to the stellar population of AGC 229101, we take the mean of the results, 2.1 107 solar masses (), as the final stellar mass for the optical counterpart.
Taking into account the color uncertainty, as well as the uncertainty in the total magnitudes and the spread in values associated with utilizing different CMLRs, we estimate the uncertainty on the stellar mass to be 0.33 dex (see Table 1).
As an alternative approach, we note that perhaps the most in-depth study of the stellar populations of gas rich ALFALFA galaxies to date is Huang et al. (2012). They estimate stellar masses for all ALFALFA galaxies that fall in the GALEX footprint using UV-optical SED fitting following Salim et al. (2007) and Brinchmann et al. (2004). These stellar mass estimates are systematically lower than, e.g., Bell et al. (2003) by 0.53 dex, but represent a better calibration of gas-rich, nearby star-forming galaxies, with improved estimates of their internal extinction. While we do not have a full SED for AGC 229101, we fit the offset between the CMLR masses and SED masses for the ALFALFA sample, and then apply the standard offset between the two samples to AGC 229101, giving a log stellar mass of 6.93 solar masses, slightly lower than our estimate from the CMLRs above. We use this value when directly comparing to the Huang et al. (2012) sample in Section 4.1.
3.2.4 Ratio of HI Mass to Stellar Luminosity and Mass
We calculated H i mass to stellar luminosity and mass ratios using the total H i mass, which includes both the northern and southern components, and report the values in Table 1. The H i mass to luminosity, MHI/Lg, and luminosity, MHI/Lr are calculated converting the measured absolute magnitudes to luminosity using AB solar magnitudes from Willmer (2018). To calculate a value for the ratio of the H i mass to the -band luminosity for AGC 229101, we combine the total magnitude of the object (calculated as described above, using the measured and values and the conversion equation from Jester et al. (2005)) with the color measured from the larger aperture to calculate the total apparent magnitude. At the 105.9 Mpc distance of AGC 229101, this yields an absolute -band magnitude of 12.73 and combining this with the MHI value gives a ratio of the H i mass to -band luminosity of 110. The errors on the H i mass to optical luminosity ratios that are listed in Table 1 reflect the range of values we get for these quantities if we vary the optical luminosity values according to their corresponding photometric measurement errors, since these photometric errors dominate the overall uncertainties. Combining the measured H i and optical masses yields an H i to stellar mass ratio of 98 for AGC 229101. Note that to calculate this ratio, we are using the total H i mass, which includes both the northern and southern components. Because the stellar mass is so uncertain (107.32±0.33 M⊙), this ratio could vary from as small as 46 to as large as 209. We noted in Section 3.1 that the northern and southern portions of the H i distribution are approximately equal in mass, and that the location of the optical counterpart coincides with the northern H i lobe. Therefore it may be appropriate to calculate quantities like the H i-to-stellar mass using only the northern portion of the H i gas, and assume that the southern portion of the H i source is an optically dark ”tail” of neutral hydrogen. If one considers only the H i gas in the northern lobe, then all of the quantities that combine the H i and optical measurements (namely the H i to stellar mass ratio and the H i mass to stellar luminosities listed in Table 1) would be reduced by a factor of two (to MHI/L MHI/L 53 and MHI/M⋆ = 49).
3.2.5 UV Data
We searched the GALEX333Based on observations made with the NASA Galaxy Evolution Explorer. GALEX is operated for NASA by the California Institute of Technology under NASA contract NAS5-98034. archive for observations of AGC 229101 and found that the area was included in the All-sky Imaging Survey (AIS). We examined shallow (107-second exposure time) NUV and FUV imaging that included AGC 229101’s position, with the location of the object roughly 3 arc minutes from the edge of the GALEX pointing. No detectable UV emission appeared in the image at that location.
3.3 AGC 229101: Environmental Context
AGC 229101 is located in a filamentary region of the Coma Supercluster, midway between the Coma Cluster (Abell 1656) and the Leo Cluster (Abell 1367). It lies just over 2 degrees (3.5 Mpc) in projection to the northeast of two large groups, the NGC 4213 group and the CGCG 128-034 group. Evaluation of the locations of galaxies with available redshifts on larger scales indicates that AGC 229101 is situated in a region of modest overdensity.
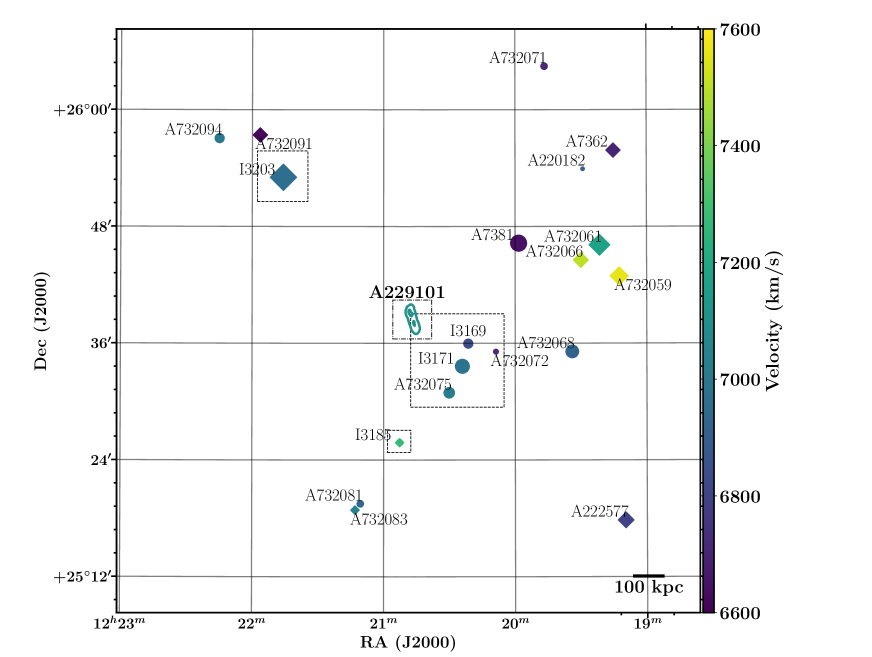
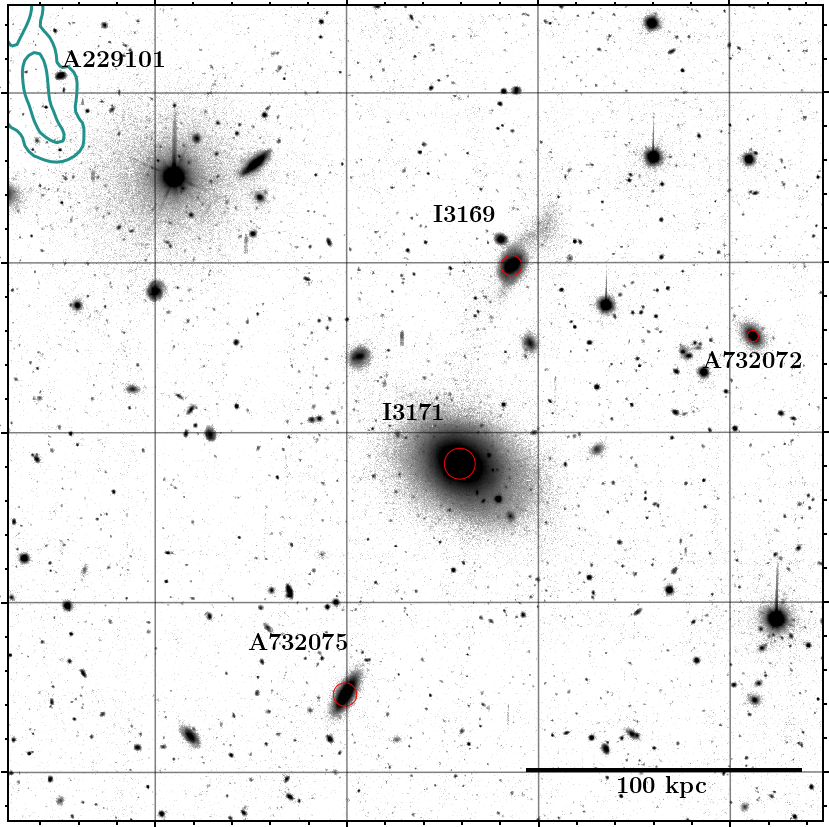
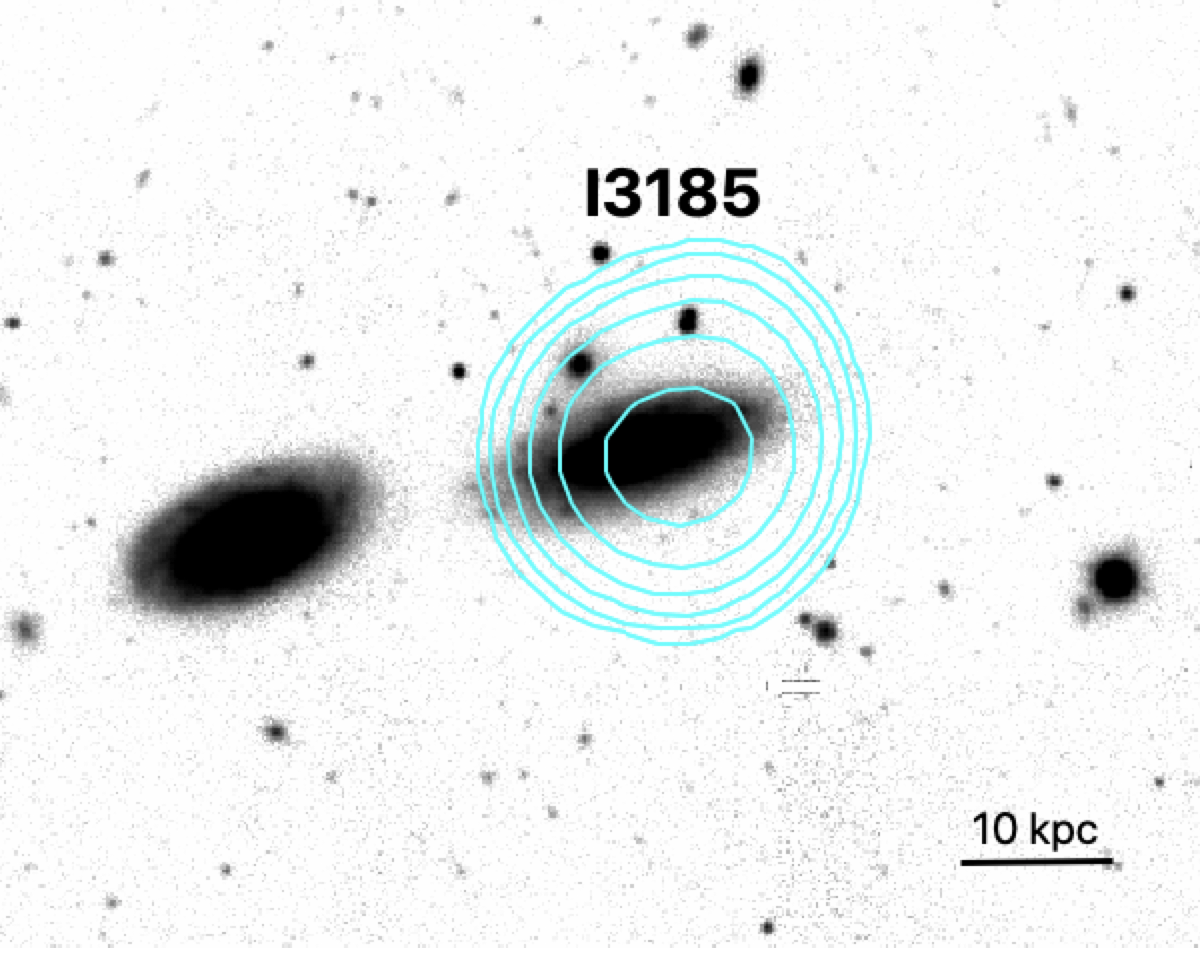
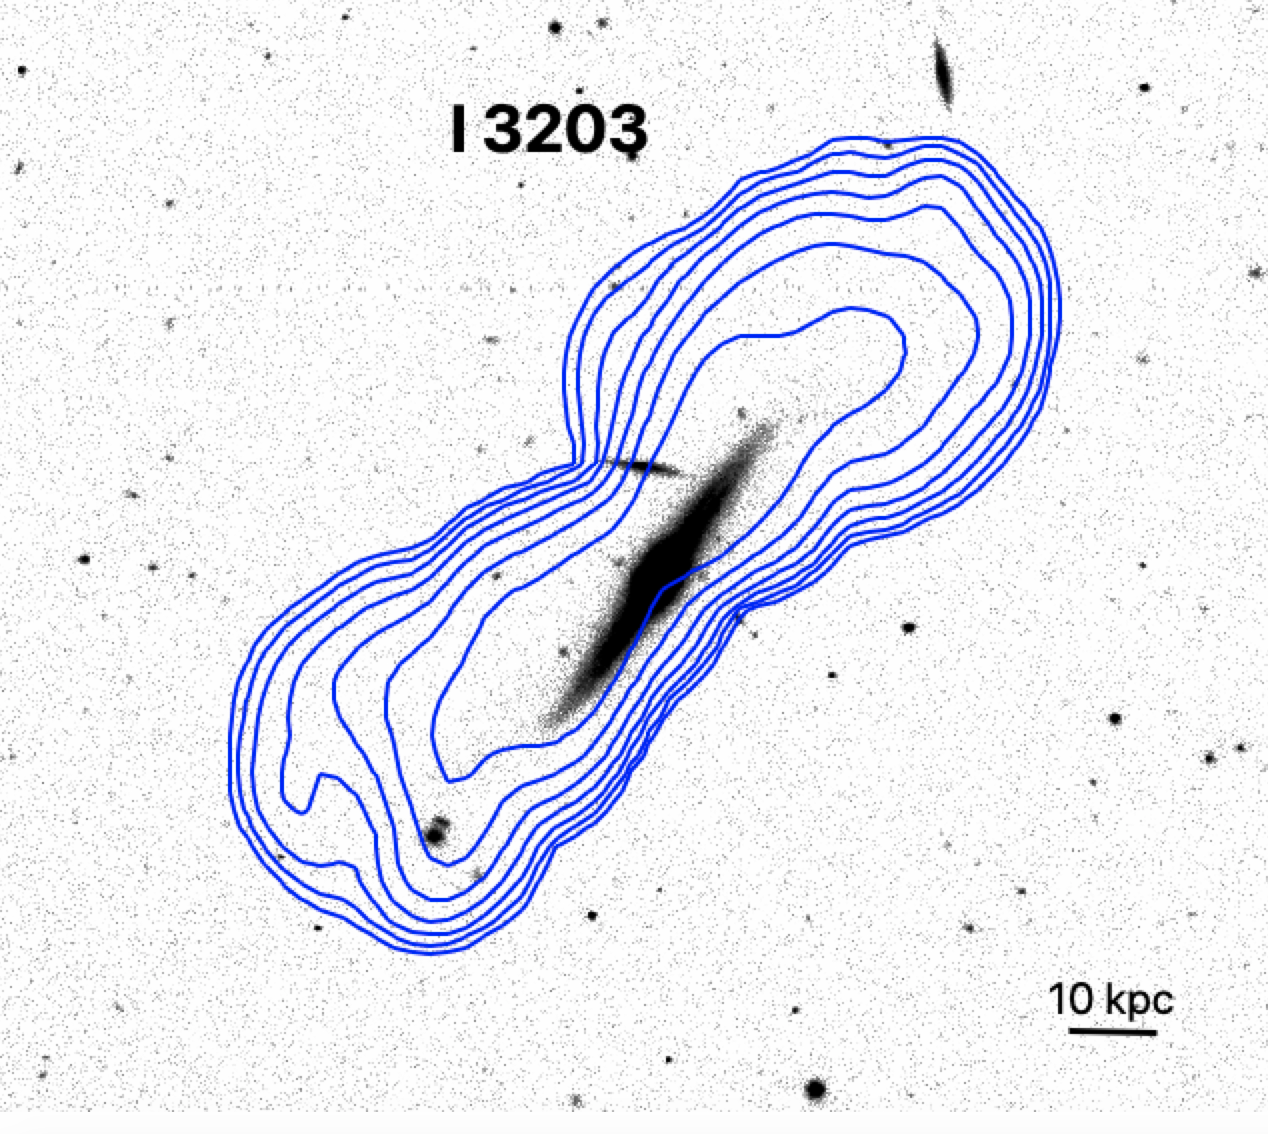
Figure 5 shows all galaxies that have measured redshifts within 500 km s-1 of AGC 229101’s redshift and are located within a projected angular separation of 0.5 degree (which corresponds to 1 Mpc at 105.9 Mpc) from the source. AGC 229101 appears to be on the northeastern edge of a loose collection of galaxies that are located at similar distances (100 Mpc). It is projected on the sky 200 kpc to the northeast of its nearest neighboring galaxies, IC 3169 and IC 3171 (CGCG 128078), with a recessional velocity that is 286 km s-1 and 155 km s-1 larger than the velocity of those objects, respectively. Both IC 3169 and IC 3171 appear to have early-type morphologies, and Consolandi et al. (2016) estimate their stellar masses to be log and log , respectively. Neither galaxy is detected in H i at the sensitivity of ALFALFA, but both are visible in the WIYN pODI image. IC 3169 exhibits extended low surface brightness emission to the northwest that has the appearance of a tidal feature, while IC 3171 has an unperturbed elliptical light distribution with no obvious evidence of disruption.
The closest galaxy to AGC 229101 with detected H i is IC 3185 (AGC 225885), which is located to the south at a projected separation of 390 kpc and which has a recession velocity within 100 km s-1 of that of AGC 229101. IC 3185 is a gas-rich star-forming galaxy with a stellar mass of and an H i mass of (Consolandi et al., 2016; Haynes et al., 2018). It has a nearby (in projection) companion (IC 3189) that is actually a background source with a recession velocity of 15283 km s-1(Sánchez Almeida et al., 2011).
Farther away and significantly more massive than IC 3185 is the galaxy IC 3203. This edge-on spiral galaxy is located 610 kpc in projection to the northeast of AGC 229101. With a stellar mass of and an H i mass of (Consolandi et al., 2016; Haynes et al., 2018), IC 3203 is the most massive H i-bearing galaxy in the vicinity of AGC 229101.
4 Discussion
To summarize the results in the previous sections, AGC 229101 has a massive and extended H i distribution and a much less extended optical counterpart that coincides with the northern portion of the H i gas component. Its 2 x 10⁹ solar masses of H i (compared to roughly 5 x 10⁹ for the Milky Way; Henderson et al., 1982), extends 80 kpc north-to-south across the sky in two main portions, with a peak column density around 5 x 10²⁰ atoms cm-2 at our highest resolution (2.8 kpc beam). The H i line width at the 50% flux level across the full source is 50 km s-1, with widths of 31 km s-1 and 41 km s-1 for the northern and southern clumps respectively. A possible optical counterpart is barely detectable in our deep optical imaging, with a peak surface brightness fainter than 26.5 mag/arcsec-2 in both the and bands. The optical counterpart coincides with the northern H i peak and has a blue color and an absolute magnitude consistent with the color and luminosity of a dwarf galaxy. We estimate that the stellar mass of the optical counterpart is 107.32±0.33 M⊙; the large uncertainties on the stellar mass are due to the faintness of the optical emission.
The observed properties of AGC 229101 – specifically, the object’s high gas fraction, low optical surface brightness, and low velocity width given its H i mass – make it stand out compared to other sources in the ALFALFA survey. The reason for these extreme properties is not immediately clear. Here we consider AGC 229101 in the context of other sources in the ALFALFA survey and the literature, and then explore a number of hypotheses for the exceptional nature of this object.
4.1 The Extreme Nature of AGC 229101
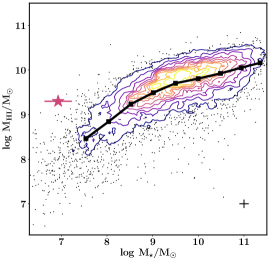
The ALFALFA survey has detected a number of sources that have some of the same characteristics that AGC 229101 exhibits – e.g., sources that have very low surface brightnesses and extended half-light radii for their stellar masses (dubbed HUDs, or HI-bearing Ultra-Diffuse sources; see Leisman et al., 2017), and sources with highly elevated gas fractions (see, e.g., Cannon et al., 2015; Janowiecki et al., 2015). AGC 229101 is in some ways more extreme than even these objects. Figure 6 shows the global properties of AGC 229101 compared with the corresponding properties of the ALFALFA H i-selected population, as measured by Huang et al. (2012) (we choose to use this comparison sample since it represents the most carefully measured estimates of ALFALFA stellar masses to date - see Section 3.2.3). The left panel shows a plot of H i mass versus estimated stellar mass. AGC 229101 is marked with a star that lies far from the median relation, demonstrating the extreme gas-rich nature of AGC 229101 compared with other ALFALFA detections. The average H i mass of an ALFALFA-detected source with a stellar mass near (i.e., the stellar mass of AGC 229101 when scaled to match the Huang et al. (2012) estimates) is expected to be , approximately an order of magnitude lower than the observed H i mass of AGC 229101. This result holds even if we consider only the northern component, which has an H i mass of , and is especially significant given that the comparison sample is measured using SDSS catalog photometry, which can over-represent the scatter in the most extreme points due to photometric issues like poor background subtraction near bright stars. We note also that the comparison sample, which is from the H i-selected ALFALFA survey, will tend to be gas-rich relative to typical galaxies (see, e.g., Catinella et al., 2010; Bradford et al., 2015). AGC 229101 has an H i mass to -band stellar luminosity ratio of 110, compared with typical values which range between 0.1 and 4 for dwarf and irregular galaxies. (Roberts & Haynes, 1994; Stil & Israel, 2002; Lee et al., 2003).
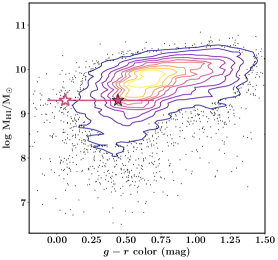
The center panel of Figure 6 shows the g–r color of AGC 229101 estimated from our WIYN pODI imaging compared with the g–r colors of ALFALFA galaxies measured by SDSS. AGC 229101 is relatively blue, even when compared to this already blue-biased H i-selected comparison sample.
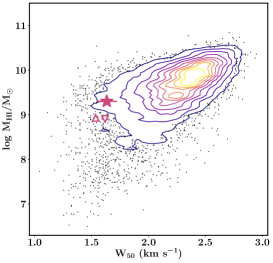
The right hand panel of Figure 6 shows the velocity width of the overall source, and the northern and southern components compared with the ALFALFA galaxies, demonstrating its narrow line width compared to the ALFALFA sample for similar HI masses. We note that while this source may not be a disk, its elongated nature, and the elongated nature of both components, suggest that the low line width is not simply an inclination effect. In fact, if its H i axial ratio is representative of its inclination, then AGC 229101 falls off the Baryonic Tully Fisher relation, consistent with having no “missing baryons” (with a baryon fraction approximately or greater than the cosmological baryon fraction; see Mancera Piña et al., 2019).
In addition to its high gas fraction, blue color, and narrow line width, the low surface brightness nature of AGC 229101 is striking. AGC 229101 is among the lowest surface brightness extragalactic sources in the sample of 30,000 galaxies detected by ALFALFA. Indeed, the peak surface brightness of AGC 229101 is well below the typical cutoff that defines the isophotal edge of a galaxy, 25 mag arcsec-2, and is 1.6 mag arcsec-2 fainter than the median central surface brightness of the already extreme UDGs (van Dokkum et al., 2015) (see Section 4.1.1 for more discussion).
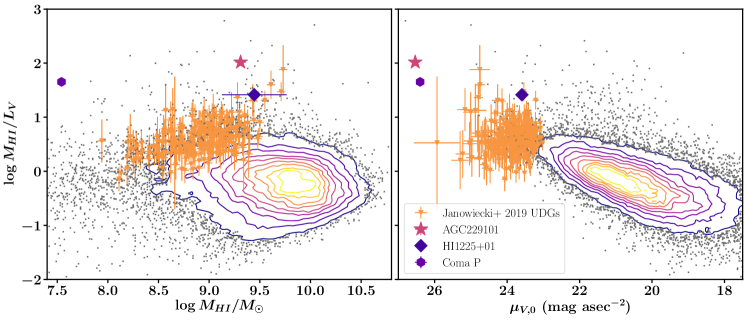
As shown in the right hand panel of Figure 7, the faint peak surface brightness, high gas fraction, and fairly blue color of AGC 229101 are reminiscent of those of the aforementioned Almost-Dark galaxy Coma P (AGC 229385). Coma P has a peak surface brightness of 26.4 mag arcsec-2, very close to that of AGC 229101, and a color of 0.050.09 (Janowiecki et al., 2015; Brunker et al., 2019), which is bluer than the color we measure in the large aperture for AGC 229101 ( 0.440.26 mag), but comparable to the color we measure in the smaller aperture ( 0.060.13 mag). Coma P is likewise one of the most gas-rich systems in the ALFALFA catalog, with an H i-to-stellar-mass ratio of 81 (Brunker et al., 2019), compared to 98 for AGC 229101. However, this comparison is strongly dependent on the color used to estimate the stellar mass; the more directly observed =110 is nearly 4 larger than Coma P. Moreover, Coma P is much smaller than AGC 229101. Coma P has an H i mass of , and a stellar mass of (Brunker et al., 2019), which means its baryonic mass is over 60 times less than AGC 229101. Thus, though AGC 229101 shares many similar properties with Coma P, it is ultimately a much larger, very different source.
Figure 7 also shows AGC 229101 compared to the famous multi-component extreme “dark” gas cloud in the direction of the Virgo Cluster, HI 1225+01 (Giovanelli & Haynes, 1989; Chengalur et al., 1995) – another ALFALFA source that shares multiple similarities with AGC 229101. HI 1225+01 was discovered serendipitously during Arecibo Observatory H i line observations by Giovanelli & Haynes (1989) and its H i distribution was mapped with follow-up observations by Giovanelli et al. (1991) and Chengalur et al. (1995). Its estimated distance is 16 Mpc, based on its recession velocity and a flow model (Giovanelli et al., 1991), though this is highly uncertain given that it is in the direction of the Virgo Cluster, where flow model distances can be unreliable. HI 1225+01 has a similar H i mass to AGC 229101, a similarly large gas fraction, and, perhaps most strikingly, a morphologically similar multi-component H i distribution. The source has two H i components, with a total H i mass of approximately solar masses, similar to the H i mass of AGC 229101. Moreover, the northeast clump of HI 1225+01 has a low surface brightness, blue optical counterpart while the other clump has no identified stellar emission (Salzer et al., 1991; Matsuoka et al., 2012).
However, though broadly similar, the specific properties of the two sources show important differences. The optical counterpart to HI 1225+01 is bluer in color than AGC 229101 (with 0; (Matsuoka et al., 2012)), and it has active star formation (Salzer et al., 1991) and is much more compact and likely less massive than AGC 229101, with a stellar mass of approximately solar masses (Matsuoka et al., 2012). Furthermore, the H i distribution of HI1225+01 has an even larger physical extent than does the H i gas in AGC 229101; in HI1225+01, the centers of the two clumps are separated by about 100 kpc and stretch over nearly 200 kpc. On the other hand, given its highly uncertain distance, if HI1225+01 is actually at a closer distance (as Coma P turned out to be), its physical extent could be more comparable to that of AGC 229101.
4.1.1 Comparing AGC 229101 to Ultra-Diffuse Galaxies
In a search for low surface brightness features in the Coma Cluster, van Dokkum et al. (2015) identified a population of objects they dubbed “ultra-diffuse galaxies” (UDGs) that have very low peak surface brightnesses (central surface brightnesses of 25 mag arcsec-2) and large effective radii (1.5 kpc) for their stellar masses, which are comparable to the stellar masses of dwarf galaxies ( to ). Objects that seem to fit the general definition of UDGs have been identified both in dense environments (e.g., van Dokkum et al., 2015; Koda et al., 2015; Mancera Piña et al., 2019) as well as in lower-density regions (e.g., Román & Trujillo, 2017; Leisman et al., 2017; Greco et al., 2018. This would seem to suggest that they represent a heterogeneous population of galaxies that are united by their properties but not necessarily by a common formation mechanism. Moreover, classes of galaxies with the properties of UDGs – namely, low peak surface brightnesses, along with large sizes for their stellar masses – have long been known, and different types of galaxies can of course overlap in terms of their properties (Conselice, 2018); van Dokkum et al. (2015) explicitly argued in their paper that the UDGs they had identified did not represent a distinct population of galaxies, but instead were likely “the largest and most diffuse objects in a continuous distribution”. In any case, it seems relevant to compare the observed properties of AGC 229101 with those of other low surface brightness, diffuse, low-mass galaxies.
With a peak surface brightness of 26.6 mag arcsec-2 and an estimated half-light radius of 3 kpc, the optical counterpart of AGC 229101 satisfies the selection criteria for a UDG laid out in the van Dokkum et al. (2015) paper; in fact its central surface brightness is significantly fainter than those of any of the galaxies in their sample of 47 Coma Cluster UDGs (which range from of 2426 mag arcsec-2, with a median value of 25.0 mag arcsec-2), and other ALFALFA detected H i-bearing UDGs (as shown in the right hand panel of Figure 7). The van Dokkum et al. (2015) UDGs have absolute magnitudes in the range 12.5 to 16.0 mag (median 14.3 mag), and stellar masses between 1 x 10⁷ and 3 x 10⁸ (median 6 x 10⁷ ). The optical counterpart of AGC 229101 lies within both of these ranges.
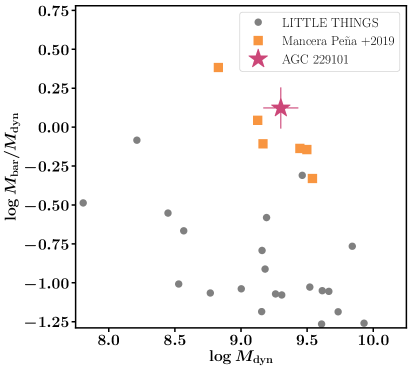
It seems plausible that hypothesized mechanisms for the formation of galaxies like UDGs, especially “H i-bearing UDGs” (low-mass, gas-rich galaxies with low central surface brightnesses and large radii like those described in, e.g., Di Cintio et al., 2017, Leisman et al., 2017, and Janowiecki et al., 2019; see Figure 7) may provide some insight into the origin and evolution of AGC 229101. Importantly, H i-bearing UDGs have been found to lie off the Baryonic Tully-Fisher relation – they are rotating too slowly for their baryonic mass (Mancera Piña et al., 2019) – and to have a wide range of dark matter halo masses, with multiple sources in group environments apparently having little to no detected dark matter. The fact that AGC 229101 has a very narrow velocity profile (439 km s-1) despite having 2 x 10⁹ of H i gas likewise is suggestive of the idea that it has very little dark matter. Indeed, Figure 8 shows a simplistic estimate of the dynamical mass enclosed within the H i radius (see section 4.2.1) places AGC 229101 in a similar parameter space to the H i-bearing UDGs presented in Mancera Piña et al. (2019) and Mancera Piña et al. (2020), and indicates that AGC 229101 may offer important clues regarding the formation of dark-matter-poor, gas-rich UDGs.
4.2 Potential Explanations for the Extreme Nature of AGC 229101
Here we explore a few hypotheses that could help explain the existence and extreme properties of AGC 229101.
4.2.1 AGC 229101: Tidal Dwarf Galaxy?
Studies have shown that many optically “dark” H i sources are tidal debris from recent interactions between two galaxies (e.g., Leisman, 2017). Thus one likely explanation for AGC 229101 is that it is a Tidal Dwarf Galaxy (TDG), formed because of tidal forces that arose from an interaction between a pair of more massive galaxies in its vicinity. Indeed, considering the masses of the neighboring galaxies around AGC 229101, multiple interaction scenarios are possible. One scenario is that AGC 229101 could have formed from gas removed from IC 3203 during an interaction with IC 3171. IC 3203 has of H i (Haynes et al., 2018), and thus AGC 229101 represents about 15% of its total gas content, and appears projected on the sky between the two galaxies (see Figure 5 and the accompanying discussion in Section 3.3). Another plausible scenario is that AGC 229101 formed as the result of an interaction between IC 3203 and the H i bearing star-forming galaxy IC 3185.
There are multiple pieces of evidence that give weight to the hypothesis that AGC 229101 originated in a tidal encounter between two massive galaxies. As mentioned earlier, the low velocity width of AGC 229101 may suggest that the object is dark matter poor. Indeed, if we treat the whole source as if it resides in a single halo and make a naive estimate of the dynamical mass enclosed within its H i radius, we find that (where ) returns a dynamical mass of 2 x 10, which is equal to the enclosed baryonic mass and thus requires no additional dark matter component. A commonly used slightly more sophisticated estimate that attempts to account for the velocity distribution and the unknown shape of the total matter distribution is
(Hoffman et al., 1996). Assuming km s-1, and , this gives an estimated dynamical mass of within the H i radius. Thus even accounting for the velocity dispersion of the gas, it seems that AGC 229101 is somewhat dark matter poor. Moreover, the large and elongated angular extent of the H i cloud also seems reminiscent of tidal tails, and the mass is significantly higher than the typical threshold for forming a long lived TDG (Bournaud & Duc, 2006).
On the other hand, AGC 229101 is at a large separation from IC 3203, without an obvious connecting tail. This large separation to neighboring galaxies suggests that if a tidal hypothesis is correct, AGC 229101 must be a very long-lived tidal system. Since IC 3203 is projected at 600 kpc on the sky, if we assume typical group velocities of 300 km s-1, this would require the neutral gas and stars associated with AGC 229101 to have survived 2 Gyr after the galaxy interaction.
Other TDGs have been detected in clumps at the ends of long tidal tails (e.g., Duc et al. (1997)), but not with the large angular extent of the H i clumps in AGC 229101. For example, Lee-Waddell et al. (2014) present the ALFALFA discovery of AGC 749170, an extremely faint TDG. AGC 749290 has a comparable amount of gas to AGC 229101, with a double peaked H i column density distribution and a very low surface brightness, blue optical counterpart. However, in addition to being much closer to its likely progenitor galaxy, AGC 749170 is smaller than AGC 229101 (its half-light radius 1.5 kpc and its stellar mass is ), with the full H i distribution extending 30 kpc.
The large separation and size of AGC 229101 then may suggest that the southern clump is the remnant of a tidal tail that has somehow managed to survive for an extended period of time. The interaction time scales and distances are made significantly less extreme if one considers the possibility that the northern clump of AGC 229101 is not a TDG, but rather a very low surface brightness source that interacted with IC 3171 several hundred Myr ago. This possibility is interesting, but seems less likely in that the masses in the northern and southern clumps are comparable: an interaction removing the gas in the southern clump from the galaxy would require removing of the galaxy’s gas mass.
4.2.2 AGC 229101: Other Explanations
While the idea that AGC 229101 is a TDG is intriguing, there are a number of other potential explanations for the existence of this source. As explained in Section 4.1.1, the low surface brightness and large radius of AGC 229101 are consistent with, if extreme examples of, the observed properties of H i bearing UDGs (e.g. Leisman et al., 2017; Gault et al., 2021). Specifically, the high gas fraction and low rotation velocity are consistent with other reported H i-bearing UDGs, which appear to lie off the Baryonic Tully Fisher relation (Figure 8; Mancera Piña et al., 2019, 2020). Thus proposed mechanisms for the formation of UDGs may apply here. For example, Amorisco & Loeb (2016) suggest that UDGs are genuine dwarf galaxies that represent the low-mass, high-spin tail of the galaxy distribution. Alternatively, Di Cintio et al. (2017) carried out a series of hydrodynamical simulations of galaxy formation and found that UDGs form within moderate mass dark matter halos as a natural consequence of gas outflows that occur along with star formation.
Another hypothesis that is consistent with our current data is that AGC 229101 could be two merging dark clouds. Starkenburg et al. (2016a, b) simulate mergers with gas-rich disky dwarf galaxies with dark satellites and follows their evolution to look at star formation, morphology, and kinematics. They find that these simulated systems match the observational properties of many irregular dwarfs and blue compact dwarfs. Though the objects that result from their simulations are more compact than AGC 229101, the data are consistent with the northern clump being a dwarf galaxy interacting with a potential dark cloud (the southern clump). While many of the predicted properties of these systems will require deeper or spectroscopic observations to test, the current observations of AGC 229101 do not rule out this possibility, and even give hints of predicted properties, like misalignment between the optical and H i systems (see Starkenburg et al., 2016b).
Finally, we note that we cannot rule out the remote possibility that AGC 229101 is simply an isolated, extended, low surface brightness galaxy that resides in a shallow dark matter halo.
Deeper high resolution H i imaging of AGC 229101 to study its velocity profile in detail, coupled with deeper optical imaging with next generation telescopes to yield an estimate of the age and metallicity of its stellar component, will help to distinguish between the various explanations for the observed properties of this exceptional galaxy.
References
- Adams et al. (2013) Adams, E. A. K., Giovanelli, R., & Haynes, M. P. 2013, ApJ, 768, 77
- Amorisco & Loeb (2016) Amorisco, N. C., & Loeb, A. 2016, MNRAS, 459, L51
- Anand et al. (2018) Anand, G. S., Tully, R. B., Karachentsev, I. D., et al. 2018, ApJ, 861, L6
- Ball et al. (2018) Ball, C., Cannon, J. M., Leisman, L., et al. 2018, AJ, 155, 65
- Bell et al. (2003) Bell, E. F., McIntosh, D. H., Katz, N., & Weinberg, M. D. 2003, ApJS, 149, 289
- Bournaud & Duc (2006) Bournaud, F., & Duc, P.-A. 2006, A&A, 456, 481
- Bradford et al. (2015) Bradford, J. D., Geha, M. C., & Blanton, M. R. 2015, ApJ, 809, 146
- Brinchmann et al. (2004) Brinchmann, J., Charlot, S., White, S. D. M., et al. 2004, MNRAS, 351, 1151
- Brunker et al. (2019) Brunker, S. W., McQuinn, K. B. W., Salzer, J. J., et al. 2019, AJ, 157, 76
- Cannon et al. (2015) Cannon, J. M., Martinkus, C. P., Leisman, L., et al. 2015, AJ, 149, 72
- Catinella et al. (2010) Catinella, B., Schiminovich, D., Kauffmann, G., et al. 2010, MNRAS, 403, 683
- Chengalur et al. (1995) Chengalur, J. N., Giovanelli, R., & Haynes, M. P. 1995, AJ, 109, 2415
- Conselice (2018) Conselice, C. J. 2018, Research Notes of the American Astronomical Society, 2, 43
- Consolandi et al. (2016) Consolandi, G., Gavazzi, G., Fumagalli, M., Dotti, M., & Fossati, M. 2016, A&A, 591, A38
- Cornwell (2008) Cornwell, T. J. 2008, IEEE Journal of Selected Topics in Signal Processing, 2, 793
- Crain et al. (2017) Crain, R. A., Bahé, Y. M., Lagos, C. d. P., et al. 2017, MNRAS, 464, 4204
- Di Cintio et al. (2017) Di Cintio, A., Brook, C. B., Dutton, A. A., et al. 2017, MNRAS, 466, L1
- Du et al. (2020) Du, W., Cheng, C., Zheng, Z., & Wu, H. 2020, AJ, 159, 138
- Du & McGaugh (2020) Du, W., & McGaugh, S. S. 2020, AJ, 160, 122
- Duc et al. (1997) Duc, P. A., Brinks, E., Wink, J. E., & Mirabel, I. F. 1997, A&A, 326, 537
- Eisenstein et al. (2011) Eisenstein, D. J., Weinberg, D. H., Agol, E., et al. 2011, AJ, 142, 72
- Gault et al. (2021) Gault, L., Leisman, L., Adams, E. A. K., et al. 2021, arXiv e-prints, arXiv:2101.01753
- Giovanelli & Haynes (1989) Giovanelli, R., & Haynes, M. P. 1989, ApJ, 346, L5
- Giovanelli et al. (2010) Giovanelli, R., Haynes, M. P., Kent, B. R., & Adams, E. A. K. 2010, ApJ, 708, L22
- Giovanelli et al. (1991) Giovanelli, R., Williams, J. P., & Haynes, M. P. 1991, AJ, 101, 1242
- Giovanelli et al. (2005) Giovanelli, R., Haynes, M. P., Kent, B. R., et al. 2005, AJ, 130, 2598
- Gopu et al. (2014) Gopu, A., Hayashi, S., Young, M. D., et al. 2014, in Proc. SPIE, Vol. 9152, Software and Cyberinfrastructure for Astronomy III, 91520E
- Greco et al. (2018) Greco, J. P., Goulding, A. D., Greene, J. E., et al. 2018, ApJ, 866, 112
- Harbeck et al. (2014) Harbeck, D. R., Boroson, T., Lesser, M., et al. 2014, in Proc. SPIE, Vol. 9147, Ground-based and Airborne Instrumentation for Astronomy V, 91470P
- Haynes et al. (2011) Haynes, M. P., Giovanelli, R., Martin, A. M., et al. 2011, AJ, 142, 170
- Haynes et al. (2018) Haynes, M. P., Giovanelli, R., Kent, B. R., et al. 2018, ApJ, 861, 49
- Henderson et al. (1982) Henderson, A. P., Jackson, P. D., & Kerr, F. J. 1982, ApJ, 263, 116
- Herrmann et al. (2016) Herrmann, K. A., Hunter, D. A., Zhang, H.-X., & Elmegreen, B. G. 2016, AJ, 152, 177
- Hoffman et al. (1996) Hoffman, G. L., Salpeter, E. E., Farhat, B., et al. 1996, ApJS, 105, 269
- Huang et al. (2012) Huang, S., Haynes, M. P., Giovanelli, R., & Brinchmann, J. 2012, ApJ, 756, 113
- Janesh et al. (2019) Janesh, W., Rhode, K. L., Salzer, J. J., et al. 2019, AJ, 157, 183
- Janowiecki et al. (2019) Janowiecki, S., Jones, M. G., Leisman, L., & Webb, A. 2019, MNRAS, 490, 566
- Janowiecki et al. (2015) Janowiecki, S., Leisman, L., Józsa, G., et al. 2015, ApJ, 801, 96
- Jester et al. (2005) Jester, S., Schneider, D. P., Richards, G. T., et al. 2005, AJ, 130, 873
- Koda et al. (2015) Koda, J., Yagi, M., Yamanoi, H., & Komiyama, Y. 2015, ApJ, 807, L2
- Kotulla (2014) Kotulla, R. 2014, in Astronomical Society of the Pacific Conference Series, Vol. 485, Astronomical Data Analysis Software and Systems XXIII, ed. N. Manset & P. Forshay, 375
- Lee et al. (2003) Lee, H., McCall, M. L., Kingsburgh, R. L., Ross, R., & Stevenson, C. C. 2003, AJ, 125, 146
- Lee-Waddell et al. (2014) Lee-Waddell, K., Spekkens, K., Cuillandre, J.-C., et al. 2014, MNRAS, 443, 3601
- Lee-Waddell et al. (2016) Lee-Waddell, K., Spekkens, K., Chandra, P., et al. 2016, MNRAS, 460, 2945
- Leisman (2017) Leisman, L. 2017, PhD thesis, Cornell University. https://doi.org/10.7298/X4K935PT
- Leisman et al. (2016) Leisman, L., Haynes, M. P., Giovanelli, R., et al. 2016, MNRAS, 463, 1692
- Leisman et al. (2017) Leisman, L., Haynes, M. P., Janowiecki, S., et al. 2017, ApJ, 842, 133. http://stacks.iop.org/0004-637X/842/i=2/a=133
- Mancera Piña et al. (2019) Mancera Piña, P. E., Aguerri, J. A. L., Peletier, R. F., et al. 2019, MNRAS, 485, 1036
- Mancera Piña et al. (2020) Mancera Piña, P. E., Fraternali, F., Oman, K. A., et al. 2020, MNRAS, 495, 3636
- Matsuoka et al. (2012) Matsuoka, Y., Ienaka, N., Oyabu, S., Wada, K., & Takino, S. 2012, AJ, 144, 159
- McMullin et al. (2007) McMullin, J. P., Waters, B., Schiebel, D., Young, W., & Golap, K. 2007, in Astronomical Society of the Pacific Conference Series, Vol. 376, Astronomical Data Analysis Software and Systems XVI, ed. R. A. Shaw, F. Hill, & D. J. Bell, 127
- Roberts & Haynes (1994) Roberts, M. S., & Haynes, M. P. 1994, ARA&A, 32, 115
- Román & Trujillo (2017) Román, J., & Trujillo, I. 2017, MNRAS, 468, 4039
- Salim et al. (2007) Salim, S., Rich, R. M., Charlot, S., et al. 2007, ApJS, 173, 267
- Salzer et al. (1991) Salzer, J. J., di Serego Alighieri, S., Matteucci, F., Giovanelli, R., & Haynes, M. P. 1991, AJ, 101, 1258
- Sánchez Almeida et al. (2011) Sánchez Almeida, J., Aguerri, J. A. L., Muñoz-Tuñón, C., & Huertas-Company, M. 2011, ApJ, 735, 125
- Sault et al. (1995) Sault, R. J., Teuben, P. J., & Wright, M. C. H. 1995, in Astronomical Society of the Pacific Conference Series, Vol. 77, Astronomical Data Analysis Software and Systems IV, ed. R. A. Shaw, H. E. Payne, & J. J. E. Hayes, 433
- Schlafly & Finkbeiner (2011) Schlafly, E. F., & Finkbeiner, D. P. 2011, ApJ, 737, 103
- Schlegel et al. (1998) Schlegel, D., Finkbeiner, D., & Davis, M. 1998, in Wide Field Surveys in Cosmology, ed. S. Colombi, Y. Mellier, & B. Raban, 297
- Serra et al. (2012) Serra, P., Oosterloo, T., Morganti, R., et al. 2012, MNRAS, 422, 1835
- Starkenburg et al. (2016a) Starkenburg, T. K., Helmi, A., & Sales, L. V. 2016a, A&A, 587, A24
- Starkenburg et al. (2016b) —. 2016b, A&A, 595, A56
- Stil & Israel (2002) Stil, J. M., & Israel, F. P. 2002, A&A, 389, 29
- Suess et al. (2016) Suess, K. A., Darling, J., Haynes, M. P., & Giovanelli, R. 2016, MNRAS, 459, 220
- Taylor & Webster (2005) Taylor, E. N., & Webster, R. L. 2005, ApJ, 634, 1067
- van Dokkum et al. (2015) van Dokkum, P. G., Abraham, R., Merritt, A., et al. 2015, ApJ, 798, L45
- Verde et al. (2002) Verde, L., Oh, S. P., & Jimenez, R. 2002, MNRAS, 336, 541
- Wang et al. (2013) Wang, J., Kauffmann, G., Józsa, G. I. G., et al. 2013, MNRAS, 433, 270
- Willmer (2018) Willmer, C. N. A. 2018, ApJS, 236, 47