Finding a Balanced Degree of Automation for Summary Evaluation
Abstract
Human evaluation for summarization tasks is reliable but brings in issues of reproducibility and high costs. Automatic metrics are cheap and reproducible but sometimes poorly correlated with human judgment. In this work, we propose flexible semi-automatic to automatic summary evaluation metrics, following the Pyramid human evaluation method. Semi-automatic Lite2Pyramid retains the reusable human-labeled Summary Content Units (SCUs) for reference(s) but replaces the manual work of judging SCUs’ presence in system summaries with a natural language inference (NLI) model. Fully automatic Lite3Pyramid further substitutes SCUs with automatically extracted Semantic Triplet Units (STUs) via a semantic role labeling (SRL) model. Finally, we propose in-between metrics, Lite2.xPyramid, where we use a simple regressor to predict how well the STUs can simulate SCUs and retain SCUs that are more difficult to simulate, which provides a smooth transition and balance between automation and manual evaluation. Comparing to 15 existing metrics, we evaluate human-metric correlations on 3 existing meta-evaluation datasets and our newly-collected PyrXSum (with 100/10 XSum examples/systems). It shows that Lite2Pyramid consistently has the best summary-level correlations; Lite3Pyramid works better than or comparable to other automatic metrics; Lite2.xPyramid trades off small correlation drops for larger manual effort reduction, which can reduce costs for future data collection.111Our code and data are publicly available at: https://github.com/ZhangShiyue/Lite2-3Pyramid
1 Introduction
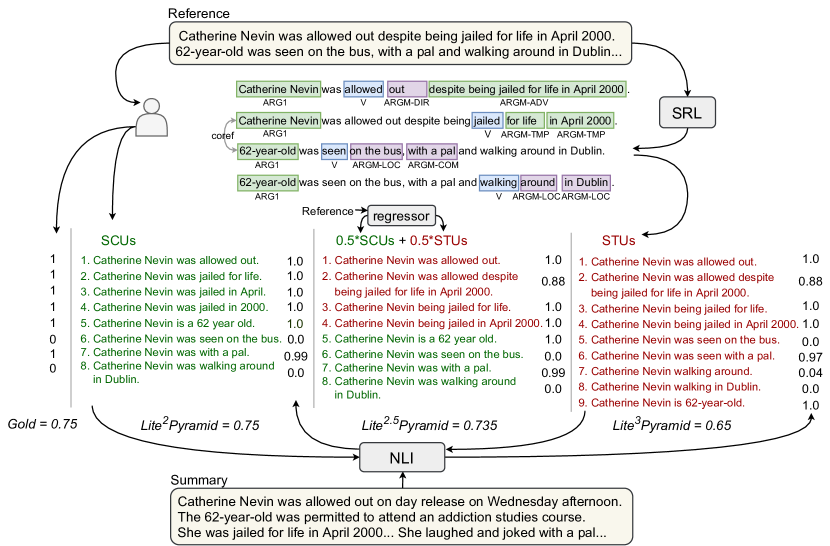
Evaluating the quality of summaries is a challenging task. Human evaluation is usually regarded as the gold standard. Out of different human evaluation methods, Pyramid Nenkova and Passonneau (2004) has been perceived as an objective and reliable protocol and used by early summarization benchmarks, e.g., TAC DBL (2008, 2009). Given one or several reference summaries of an example, human assessors first exhaustively extract Summary Content Units (SCUs), each SCU contains a single fact, from the reference(s), and then check whether they are present in a system summary. Figure 1 shows an example of human-labeled SCUs. Despite the reliability, manual evaluation is usually: (1) not reproducible, results may change when different evaluators are involved, making it hard to compare the results across papers; (2) expensive, in terms of time and cost. Thus, it is unlikely to apply human evaluation extensively in model selection (e.g., to choose the best checkpoint); instead, people usually treat it as an additional quality verification step. Aiming to work as a proxy of humans, many automatic metrics have been proposed Lin (2004); Tratz and Hovy (2008); Giannakopoulos and Karkaletsis (2011); Yang et al. (2016); Zhang et al. (2019); Deutsch et al. (2021). However, most of them cannot reliably substitute human evaluation due to the unstable performance across datasets Bhandari et al. (2020), weak to moderate correlations with human judgment Fabbri et al. (2021), or more indication of topic similarity than information overlap Deutsch and Roth (2021).
In this work, we want to combine human and automatic evaluations and find a balance between reliability and reproducibility (plus expense). Recall the Pyramid method Nenkova and Passonneau (2004), where these SCUs for reference summaries only need to be annotated once, then they can be fixed. It means SCUs can come with the datasets and are reusable for evaluating different systems. Hence, what hinders this method from being reproducible is its second step of asking humans to judge the presence of SCUs in system summaries. Whenever we have a new summarizer, we need to collect human labels for this step. Therefore, we propose to retain the reusable SCUs but replace human effort in the second step with a neural model. Basically, people are answering whether a SCU is entailed by the summary, which is closely related to the Natural Language Inference (NLI) task, i.e., judging whether a hypothesis is entailed by the premise. A lot of NLI datasets are available Bowman et al. (2015); Williams et al. (2018a); Thorne et al. (2018); Nie et al. (2020) and recent NLI models have achieved close-to-human-level performance. Hence, we use a pretrained NLI model and finetune it on some in-domain gold labels of SCUs’ presence. Then, we replace humans with the finetuned model, so that the evaluation results are reproducible as long as the same model is used. Meanwhile, it can run automatically during development to guide model selection and the evaluation cost will be dramatically reduced. Shapira et al. (2019) propose LitePyramid to simplify the standard Pyramid method via crowdsourcing. Following but different from their work, we additionally automate the presence annotation, and hence we call our method Lite2Pyramid.
Lite2Pyramid still requires human efforts to extract SCUs from reference summaries, and this step is usually considered to be more difficult. Early benchmarks, e.g., TAC DBL (2008, 2009), are small-sized with fewer than 100 examples in the evaluation set, for which it is already expensive to manually collect SCUs. However, current popular summarization datasets, e.g., CNN/DM Hermann et al. (2015), contain more than 10K evaluation examples, and hence we want to simulate SCUs via an automatic method for such large-scale datasets. For this, we make use of Semantic Role Labeling (SRL) that can automatically decompose a sentence to semantic triplets, e.g., subject-verb-object, and we take each triplet as a pseudo-SCU, which we call Semantic Triplet Unit (STU). Figure 1 illustrates the difference between SCUs and STUs. Although STUs do not always contain a single fact and some information might also be misrepresented, we find that it can reasonably simulate SCUs and lead to a fully automatic metric, Lite3Pyramid.
Lastly, instead of using either all human-labeled SCUs or all automated STUs, we investigate balanced trade-offs in between, e.g., using half SCUs and half STUs. A naive way is to randomly sample some reference sentences and substitute their SCUs with STUs. However, we find it is unstable and sometimes even works worse than using all STUs. More reasonably, we design an active learning Settles (2012) inspired selection method to help decide which sub-parts of the dataset are more worthy of obtaining expensive SCUs for. For this, we develop a regressor to predict the “simulation easiness” of each reference sentence: if a sentence is too complex to be well represented by STUs, we will ask humans to annotate SCUs for it; otherwise, we can apply automatic SRL. We call this method as Lite2.xPyramid, since it provides a smooth, flexible transition from Lite2Pyramid to Lite3Pyramid and balances reliability with cost.
To comprehensively evaluate the quality of metrics, we not only use 3 existing meta-evaluation datasets (TAC2008 DBL (2008), TAC2009 DBL (2009), REALSumm Bhandari et al. (2020)) but also newly collect PyrXSum with 100 XSum Narayan et al. (2018) test examples plus summaries produced by 10 systems. Next, we compare our new metrics to 15 existing automatic metrics on these 4 meta-evaluation setups for both system-level and summary-level correlations with human Pyramid scores. We find that Lite2Pyramid consistently has the best summary-level correlations and is reliable as an out-of-the-box metric. Lite3Pyramid also mostly performs better or competitively. Lastly, the regressor-based Lite2.xPyramid can help substantially reduce annotation efforts for only small correlation drops, e.g., on TAC2008, TAC2009, it trades off only 0.01 absolute summary-level Pearson correlation and 0 system-level correlation for 50% SCU reduction.
2 Related Works & Background
Each example in a summarization dataset contains single or multiple source document(s) and one or several human-written reference(s). System-generated summaries are evaluated by comparing them to the references (i.e., reference-based) or directly scored (i.e., reference-free). This evaluation process is critical and directly affects our development choices.
Human (or manual) evaluation has been considered as the gold standard. Early benchmarks DBL (2008, 2009) conducted three human evaluations: Responsiveness, Linguistic Quality, and Pyramid. The first two ask humans to directly rate the overall responsiveness or linguistic quality on a Likert scale. Following this, some works collect ratings for different aspects, e.g., relevance, readability Paulus et al. (2018); Kryscinski et al. (2019); Fabbri et al. (2021). However, these ratings may suffer from raters’ subjectivity. Pyramid Nenkova and Passonneau (2004) has been perceived as a more objective method, and it is reference-based. It has two steps: pyramid creation and system evaluation. In the first step, humans exhaustively find the Summary Content Unit (SCU) contributors from references, each contributor describes a single fact; contributors with the same meaning will be merged into one single SCU; then each SCU is weighted by how many contributors it has, equal to the number of references in which it is found. In the second step, each SCU has been manually checked its presence in the system summary; and the Pyramid score is the normalized sum of present SCUs’ weights (essentially, a recall score). Passonneau (2010) normalize it by the total weight of the best possible summary. Recently, Shapira et al. (2019) propose LitePyramid. It removes SCU merging and weighting, allowing SCUs of the same meaning to co-exist, and they show that the evaluation can be reliably conducted by crowdsourcing workers.
Automatic metrics trade off the reliability of human evaluation for reproducibility, low cost, and fast speed. Many automatic metrics have been introduced, the majority of which are reference-based. Some metrics measure the n-gram overlap Papineni et al. (2002); Lin (2004), out of which ROUGE Lin (2004) is the most widely adopted metric till today. Some other works compute the similarity over n-gram graphs Giannakopoulos and Karkaletsis (2011); Giannakopoulos et al. (2008) or distributions Lin et al. (2006). Since exact n-gram matching is too rigid, METEOR Banerjee and Lavie (2005); Denkowski and Lavie (2014) provides flexibility by stemming, synonyms, etc., and recently, a few metrics enable “soft” matching through contextualized word embeddings Zhao et al. (2019); Clark et al. (2019); Zhang et al. (2019). However, Deutsch and Roth (2021) point out that the n-gram based metrics indicate more topic similarity than information overlap. Structural evaluation metrics have also been proposed beyond n-grams. BEwT-E Tratz and Hovy (2008) decomposes the system summary and the reference(s) into syntactic units and compute their similarities, and decomposed-ROUGE Deutsch and Roth (2021) computes ROUGE for each syntactic category. APES Eyal et al. (2019) and QAEval Deutsch et al. (2021) are QA-based metrics that assume similar answers will be obtained from similar system summaries and reference(s).
Automatic Pyramid methods have also been proposed Yang et al. (2016); Hirao et al. (2018); Gao et al. (2019). They usually decompose both the system summary and the references into smaller units (e.g., Elementary Discourse Units) and compare the two list of units. Differently, our Lite3Pyramid only decomposes the reference summaries to semantic triplet units (STUs), and we use NLI to judge the presence of each STU in the system summary, which is closer to the original Pyramid’s procedure and leads to better correlations with human scores (refer to Section 5). Peyrard et al. (2017) propose a learned metric, S3, that is trained to directly predict human Pyramid or Responsiveness scores based on ROUGE, FrameNet features, etc. Sellam et al. (2020) propose a learned metric for machine translation, BLEURT, that finetunes a BERT Devlin et al. (2019) model with human ratings to directly predict the similarity score of a (reference, model translation) pair, and they show that it can also be successfully applied for WebNLG Gardent et al. (2017) tasks. We are similar to both S3 and BLEURT in the way of learning to evaluate through finetuning NLP models with human labels. Xu et al. (2020) is distantly related to us in the way of representing texts by SRL, but it is used to weigh the content in the source document(s). Besides, some reference-free metrics are introduced for summary quality estimation Xenouleas et al. (2019); Gao et al. (2020); Vasilyev et al. (2020) or faithfulness evaluation Durmus et al. (2020); Wang et al. (2020).
Semi-automatic evaluation is introduced by Zhou et al. (2007). They automatically decompose both system summary and reference(s) into semantic units and then ask humans to match/align the two lists of units. In contrast, our semi-automatic Lite2Pyramid retains the reusable SCUs while automatically judges the SCUs’ presence in the system summary (via NLI).
3 Our Method
3.1 Lite2Pyramid
Lite2Pyramid is a semi-automatic metric that retains human-labeled Summary Content Units (SCUs) to represent reference summaries of a data example , i.e., , where is the total number of SCUs from all reference summaries. The original Pyramid Nenkova and Passonneau (2004); Passonneau (2010) assumes there are multiple references available (e.g., TAC datasets DBL (2008, 2009) have 4 references per example). Therefore, each SCU comes with weight, , representing the number of reference summaries in which the SCU is found. To evaluate a particular system summary , the standard Pyramid method manually checks each SCU’s presence, sums up the weights of present SCUs, and normalizes it:
| (1) |
The best possible score is the highest sum of weights the summary can obtain with the same number of present SCUs (details can be found in Passonneau (2010)). Differently, LitePyramid Shapira et al. (2019) takes a union of SCUs from all reference summaries with duplication (we use to distinguish it from the de-duplicated used above) and then samples the same number () of SCUs for every data example, hence:
Without weighting, this method also works in single-reference situations. Different from this method, we keep the exhaustive set (instead of a fixed-size sample) of SCUs for each example (also used by Bhandari et al. (2020)). Importantly, we replace human efforts of checking SCUs’ presence with a Natural Language Inference (NLI) model ’s entailment prediction. Using to denote entailment, our metric can be written as:
| (2) |
Note that multiplying the weights and dividing by the sum of the weights is equal to repeating for times, which shows how we treat SCUs as an exhaustive set with duplication. For single-reference datasets (CNN/DM or XSum), the weights are all 1. Plus, the above equations all compute summary-level scores. To get one single score for the system, we simply take the average across examples, e,g., .
The function can be implemented in four different ways, denoted as , , , , and explained below. Following the standard 3-class setting of NLI tasks, the NLI model will predict whether the is entailed by or neutral to or contradicted with the summary . Hence, we can use either the output probability of entailment class or the predicted 1 or 0 entailment label as the function . However, existing NLI datasets Bowman et al. (2015); Williams et al. (2018b); Thorne et al. (2018); Nie et al. (2020) have different data distributions and domains from the summarization data; hence models trained on these datasets may not perform well in judging the presence of SCUs. Therefore, we finetune the pretrained NLI model by human-labeled SCUs plus presence labels. Since humans only give 2-class labels (present or not present), we adapt the model to perform two-way classification. Specifically, we add up the logits of neutral () and contradiction () classes as the logit of the “not present” label: . Again, we can use or as after finetuning. In our experiments, we call the pretrained NLI model on NLI datasets as “zero-shot” because it has not seen summarization data. Empirically, we find that when using the zero-shot NLI model, works best; while after finetuning, usually works best.
3.2 Lite3Pyramid
Lite3Pyramid fully automates Lite2Pyramid by simulating the human-annotated SCUs with automatic extracted semantic triplets. We use a Semantic Role Labeling (SRL) model Carreras and Màrquez (2005); Palmer et al. (2010); He et al. (2017); Shi and Lin (2019) to achieve this goal. SRL determines the latent predicate-argument structure of a sentence, e.g., who did what to whom. As shown in Figure 1, the SRL model will identify several frames for each sentence, and each frame has one verb and a few arguments. For each frame, we keep the verb and any arguments before the verb unchanged, then we enumerate the arguments after the verb to form a list of triplets as {(ARGbefore, V, ARG)}, where is the number of arguments after the verb. We concatenate the three elements in each triplet to form a short sentence because a SCU is a short sentence and we want to resemble it as much as possible. We call these short sentences Semantic Triplet Units (STUs).222Note that simple concatenation might not lead to grammatical sentences, but we expect the NLI model to be robust to small grammar errors. Additionally, we make a small fix in two cases: if the token before V in the original sentence is classified as a negation modifier, ARGM-NEG, or is a Be verb, we add it to the STU sentence (e.g., for the 3rd STU in Figure 1, we bring back “being” before “jailed”). For example, as illustrated by Figure 1, based on the 4 frames identified by SRL, we extract 9 STUs from the reference.
Since one entity can be referred to by pronouns or different names in the summary, we also apply Coreference Resolution Lee et al. (2018) to improve the simulation quality. As shown in Figure 1, Catherine Nevin and 62-year-old are identified as coreference, so we use Catherine Nevin as the subjects of STUs and add an additional STU Catherine Nevin is 62-year-old.333In practice, we use the name appeared first in the reference to unify the mentions in STUs and use the template “name1 is namen” to generate additional STUs. In our experiments, we only apply coreference resolution for REALSumm because empirically, on TAC datasets, we find applying it works worse than not applying; and PyrXSum has one-sentence summaries where coreference hardly appears.444Even for REALSumm, removing the coreference resolution step will only cause around 0.01 absolute correlation drops. Although STUs seem to reasonably simulate SCUs for the example in Figure 1, it has limitations, especially, when the sentence is syntactically complicated, e.g., with a lot of modifiers, clauses, complements (refer to Section 5 for more discussions).
After we obtain the STUs from all reference summaries, we score a system summary by:
where is the total number of STUs. Note that there is no weight because we extract STUs from every reference summary and take a union, which allows STUs of the same meaning to co-exist.
3.3 Lite2.xPyramid
As discussed so far, human-annotated SCUs are accurate yet expensive, whereas automatically extracted STUs are cheap yet sometimes erroneous. The next natural question is how to find a balance between them. One way is to randomly replace 50% sentences’ SCUs with STUs, but a more intuitive way is to make the decision based on the “easiness” of simulating the sentence’s SCUs by STUs. If the sentence is unlikely to be well represented by STUs, we can ask humans to label SCUs for it; otherwise, we can use STUs to reduce cost. This is similar to how active learning Settles (2012) chooses which training examples to collect human labels for. We define simulation easiness as the average simulation accuracy of each SCU. ROUGE-1-F1 (R1) Lin (2004) is used to measure the simulation accuracy: . Then, the easiness of a sentence with SCUs is written by . The higher the easiness score is, the more accurately the STUs resemble SCUs.
After we obtain these gold easiness scores, we want to train a regressor to predict the score based on sentence complexity features. As we mentioned above, the sentence’s syntax can indicate its simulation difficulty. Therefore, we get the Constituency Parsing tree Joshi et al. (2018) of each sentence and define the following features: (1) sentence length; (2) linearized parsing tree length; (3) parsing tree depth; (4) sentence length / parsing tree depth; (5) the counts for each of the 65 non-terminal tokens (e.g., NNP). In total, we represent each sentence with a 69-dim feature vector. Then, we train an XGBoost Chen and Guestrin (2016) regressor to predict the simulation easiness by minimizing the mean squared errors. Given this regressor, we propose to replace top scored sentences’ SCUs with STUs, leading to Lite2.xPyramid. For example, Lite2.5Pyramid (illustrated in Figure 1) means that we use STUs for the top 50% scored sentences and use SCUs for the other half.
4 Evaluation
Correlation with human scores.
Following the standard meta-evaluation strategies used in previous works Peyrard et al. (2017); Bhandari et al. (2020); Deutsch et al. (2021), we evaluate metrics by two types of correlation with gold human scores.
System-level correlation aims to evaluate how well the metric can compare different summarization systems? We denote the correlation measure as , human scores as , the metric as , and generated summaries as . We assume there are examples and systems in the mete-evaluation dataset. Then, the system-level correlation is defined as:
Summary-level correlation answers if the metric can reliably compare summaries generated by different systems for the same document(s). Using the same notations, this correlation is written by:
We use Pearson or Spearman as the correlation measure . Pearson measures linear correlation while Spearman measures ranking correlation.
Metrics for comparison.
Taking advantage of SacreROUGE Deutsch and Roth (2020), we compare our metrics to 15 existing metrics: ROUGE-1, ROUGE-2, and ROUGE-L Lin (2004), AutoSummENG Giannakopoulos et al. (2008), METEOR Banerjee and Lavie (2005); Denkowski and Lavie (2014), BEwT-E Tratz and Hovy (2008), S3 (pyr) and S3 (resp) Peyrard et al. (2017), PyrEval’s quality and comprehensive scores Gao et al. (2019),555PyrEval is the latest automatic Pyramid metric and is shown to be better than Yang et al. (2016). BERTScore and BERTScore (idf) Zhang et al. (2019), MoverScore Zhao et al. (2019), QAEval (EM) and QAEval (F1) Deutsch et al. (2021). For metrics that have precision/recall/F1, we report recall because Pyramid is essentially recall-based. Note that PyrEval only supports multi-reference situations.666https://github.com/serenayj/PyrEval/issues/11 See the complete descriptions of these metrics in Appendix A.1.
Data.
We evaluate human-metric correlations on three existing English meta-evaluation datasets: TAC2008 DBL (2008), TAC2009 DBL (2009), REALSumm Bhandari et al. (2020). TAC08 contains 96/58 examples/systems and TAC09 has 88/55 examples/systems. We compute the correlations with their official Pyramid scores (Equation 1).777We find that the exhaustive set based computation (replacing in Equation 2 by gold labels) has close to perfect correlation with TAC’s official scores. REALSumm also use this computation as reflected by the gold score in Figure 1. REALSumm has 100 CNN/DM Hermann et al. (2015) test examples and 25 systems. They label SCUs by themselves and collect SCU-presence labels on Amazon Mechanical Turk (AMT). Both TAC and CNN/DM have long and extractive summaries. To complete our evaluation, we newly collect an English meta-evaluation dataset PyrXSum for 100 XSum Narayan et al. (2018) (has short and abstractive summaries) testing examples. Following REALSumm, we (authors) manually label SCUs and collect SCU-presence labels for summaries generated by 10 systems888Fast Abs RL Chen and Bansal (2018), PtGen See et al. (2017), ConvS2S and T-ConvS2S Narayan et al. (2018), TransAbs and BertAbs and BertExtAbs Liu and Lapata (2019), T5 Raffel et al. (2020), BART Lewis et al. (2020), PEGASUS Zhang et al. (2020) on AMT. We collect 4 responses per summary (100 * 10 * 4 HITs) and filter responses from a noisy worker. We use the majority vote to label each SCU’s presence and break ties by “not present”. See more data collection details of PyrXum in Appendix A.2.
Models.
We use the pretrained RoBERTa-large Liu et al. (2019) based NLI model released by Nie et al. (2020), which has been trained on multiple NLI datasets. We continually finetune this model with the gold SCUs plus SCU-presence labels always for 2 epochs. For SRL, Coreference Resolution, and Constituency Tree Parser, we use the out-of-the-box tools provided by AllenNLP Gardner et al. (2018); Shi and Lin (2019); Lee et al. (2018); Joshi et al. (2018). See the complete implementation details in Appendix A.3.
5 Results
| System-level | Summary-level | ||||||||||||||||
| TAC08 | TAC09 | RealSumm | PyrXSum | TAC08 | TAC09 | RealSumm | PyrXSum | ||||||||||
| Metrics | |||||||||||||||||
| ROUGE-1 | .87 | .87 | .91 | .86 | .82 | .83 | .92 | .90 | .62 | .61 | .69 | .63 | .53 | .50 | .52 | .50 | |
| ROUGE-2 | .90 | .90 | .92 | .90 | .84 | .82 | .93 | .91 | .63 | .62 | .71 | .64 | .46 | .43 | .53 | .51 | |
| ROUGE-L | .87 | .86 | .93 | .87 | .83 | .81 | .94 | .92 | .57 | .55 | .66 | .59 | .46 | .42 | .52 | .51 | |
| AutoSummENG | .90 | .89 | .91 | .89 | .53 | .51 | .92 | .91 | .65 | .64 | .71 | .64 | .34 | .34 | .56 | .53 | |
| METEOR | .90 | .89 | .93 | .88 | .84 | .84 | .94 | .89 | .65 | .64 | .73 | .68 | .54 | .49 | .58 | .56 | |
| BEwT-E | .92 | .91 | .95 | .92 | .83 | .84 | .93 | .86 | .66 | .65 | .75 | .68 | .47 | .45 | .54 | .52 | |
| S3 pyr | .90 | .89 | .95 | .89 | .86 | .85 | .94 | .89 | .66 | .65 | .75 | .68 | .54 | .50 | .57 | .54 | |
| S3 resp | .91 | .91 | .94 | .90 | .86 | .86 | .94 | .90 | .67 | .65 | .74 | .68 | .52 | .48 | .57 | .54 | |
| PyrEval qual | .83 | .81 | .88 | .80 | - | - | - | - | .40 | .39 | .49 | .44 | - | - | - | - | |
| PyrEval comp | .83 | .80 | .90 | .79 | - | - | - | - | .41 | .40 | .53 | .45 | - | - | - | - | |
| BertScore | .88 | .87 | .90 | .90 | .73 | .77 | .92 | .89 | .61 | .60 | .70 | .65 | .48 | .46 | .57 | .54 | |
| BertScore (idf) | .89 | .88 | .91 | .90 | .73 | .78 | .93 | .90 | .62 | .61 | .71 | .66 | .48 | .46 | .58 | .55 | |
| MoverScore | .91 | .89 | .95 | .90 | .40 | .31 | .92 | .91 | .64 | .63 | .73 | .68 | .39 | .36 | .57 | .54 | |
| QAEval EM | .83 | .81 | .85 | .83 | .61 | .51 | .86 | .85 | .48 | .48 | .64 | .55 | .28 | .27 | .29 | .27 | |
| QAEval F1 | .89 | .87 | .90 | .87 | .72 | .65 | .90 | .83 | .61 | .60 | .70 | .63 | .38 | .35 | .46 | .42 | |
| Lite3Pyramid | .93 | .91 | .97 | .93 | .89 | .87 | .89 | .86 | .71 | .69 | .78 | .73 | .57 | .53 | .51 | .48 | |
| Lite2.5Pyramid | .95 | .93 | .97 | .94 | .90 | .88 | .92 | .87 | .76 | .75 | .82 | .77 | .62 | .57 | .64 | .59 | |
| Lite2Pyramid | .95 | .93 | .97 | .94 | .89 | .86 | .95 | .92 | .77 | .76 | .83 | .78 | .64 | .60 | .74 | .66 | |
| Lite2Pyramid-0 | .86 | .83 | .95 | .88 | .86 | .82 | .96 | .92 | .62 | .61 | .74 | .68 | .56 | .53 | .73 | .72 | |
5.1 Human-Metric Correlation Results
Since we find that finetuning the NLI model with in-domain presence labels is greatly beneficial, following Peyrard et al. (2017), we evaluate by 5-fold cross-validation. For each dataset, we split it into 5 folds, finetune the NLI model and train the regressor on 4 folds, test on the left one, and repeat for 5 times. We report the 5-fold average correlations of both our metrics and the 15 metrics we compare to for fair comparison. Instead of random splitting, we split the data by examples or by systems, aiming to check the generalizability across examples or systems. E.g., if we split REALSumm by examples, each fold has summaries of 20 examples; when split by systems, each fold has summaries generated by 5 systems.
Table 1 shows our 5-fold (split by examples) cross-validation results. Firstly, it can be observed that our Lite2Pyramid always has the best or close to the best correlations; especially, it has 0.08 to 0.16 higher summary-level correlations than the best metrics we compare to. It demonstrates the advantage of semi-automatic evaluation which dramatically improves reliability without losing reproducibility. Meanwhile, it indicates that the finetuned NLI model can generalize to new data examples and works reasonably well as a proxy of human judgment. In contrast, Lite2Pyramid-0, which uses a non-finetuned NLI model, usually works greatly worse than Lite2Pyramid, which indicates the importance of in-domain finetuning. It is surprising that Lite2Pyramid-0 works better than or similar to Lite2Pyramid on PyrXSum. We conjecture that because our PyrXSum is relatively small-size, the finetuning will not make big difference.
Secondly, our Lite3Pyramid has the best correlations comparing to the other automatic metrics, except for PyrXSum; again, its advantage is more prominent on summary-level correlation (around 0.03 to 0.05 better). Its failure in PyrXSum is caused by the limitation of SRL. XSum’s reference summary sentences usually have a lot of modifiers, adverbial phrases/clauses, or complements, which increases the difficulty of decomposing it into STUs. E.g., for the summary “Netherlands midfielder Wesley Sneijder has joined French Ligue 1 side Nice on a free transfer”, human annotates the following 5 SCUs: “Wesley Sneijder is a midfielder”, “Wesley Sneijder comes from Netherlands”, “Wesley Sneijder has joined French Ligue 1 side”, “Wesley Sneijder has joined Nice”, and “Wesley Sneijder has been on a free transfer”. However, since SRL frames are centered around verbs, it can only extract two STUs: “Netherlands midfielder Wesley Sneijder joined French Ligue 1 side Nice” and “Netherlands midfielder Wesley Sneijder joined on a free transfer”. On average, human labels 4.8 SCUs per PyrXSum summary, however, the number is only 2.8 for STUs. Hence, a better semantic unit decomposer needs to be designed to improve Lite3Pyramid’s accuracy.
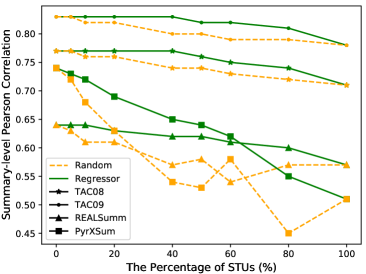
Lastly, Lite2.xPyramid alleviates the problem mentioned above by deferring complex sentences to humans to annotate SCUs for. As shown in Table 1, Lite2.5Pyramid, which saves half human effort by substituting 50% sentences’ SCUs with STUs, always has correlation reduction less than half of the difference between Lite2Pyramid and Lite3Pyramid and sometimes even has better system-level correlations than Lite2Pyramid. The full Lite2.xPyramid curves are shown in Figure 2, where the x-axis is the percentage of STUs (the higher means the fewer human efforts involved) and the y-axis is the summary-level Pearson correlation (Figure 4 in Appendix shows system-level correlations). We can see that our Lite2.xPyramid offers a smoothing transition from semi-automatic Lite2Pyramid to automatic Lite3Pyramid. More importantly, compared to randomly selecting sentences (yellow dash lines), our regressor-based selection achieves a slower correlation reduction, i.e., saving the same amount of human effort our method can retain higher metric quality. Plus, this curve gives people flexible choices per their budget.
Due to space limitations, the 5-fold (split by systems) cross-validation results are in Table 4 of Appendix. The same trends are mostly observed. Lite2Pyramid still has 0.06 to 0.21 higher summary-level correlations across all datasets. Lite3Pyramid achieves the best or competitive correlations comparing to other automatic metrics except for the system-level correlations on REALSumm and PyrXSum. And, Lite2.xPyramid also nicely bridges Lite2Pyramid and Lite3Pyramid and works better than random replacement. However, differently, Lite2Pyramid does not get the best system-level correlations on REALSumm and PyrXSum, which may indicate the bigger generalization challenge across different systems.
Takeaway: Lite2Pyramid consistently has the best summary-level correlations and the best system-level correlations in most cases. The automatic Lite3Pyramid also mostly works better than other automatic metrics. Lite2.xPyramid provides flexible and balanced degrees of automation per budget.
5.2 Out-of-the-Box Generalization
| System-level | Summary-level | ||||||||||||
| TAC09 | REALSumm | PyrXSum | TAC09 | REALSumm | PyrXSum | ||||||||
| Metrics | |||||||||||||
| ROUGE-1 | .93 | .89 | .91 | .92 | .98 | .96 | .69 | .63 | .53 | .50 | .52 | .50 | |
| ROUGE-2 | .94 | .95 | .96 | .95 | .99 | .95 | .71 | .64 | .46 | .43 | .53 | .51 | |
| ROUGE-L | .96 | .92 | .94 | .95 | .99 | .95 | .66 | .59 | .46 | .42 | .52 | .51 | |
| AutoSummENG | .93 | .93 | .59 | .60 | .97 | .94 | .71 | .64 | .34 | .34 | .56 | .53 | |
| METEOR | .95 | .91 | .94 | .92 | .99 | .98 | .73 | .68 | .54 | .49 | .58 | .56 | |
| BEwT-E | .97 | .96 | .91 | .89 | .99 | .98 | .75 | .68 | .47 | .45 | .54 | .52 | |
| S3 pyr | .97 | .92 | .96 | .94 | .99 | .99 | .75 | .67 | .54 | .50 | .57 | .54 | |
| S3 resp | .96 | .94 | .97 | .95 | .99 | .98 | .74 | .68 | .52 | .48 | .57 | .54 | |
| PyrEval qual | .94 | .90 | - | - | - | - | .49 | .44 | - | - | - | - | |
| PyrEval comp | .95 | .86 | - | - | - | - | .53 | .45 | - | - | - | - | |
| BertScore | .92 | .94 | .79 | .83 | .97 | .90 | .70 | .65 | .48 | .46 | .57 | .54 | |
| BertScore (idf) | .93 | .95 | .79 | .83 | .97 | .90 | .71 | .66 | .48 | .46 | .58 | .55 | |
| MoverScore | .97 | .92 | .44 | .32 | .98 | .84 | .74 | .68 | .39 | .36 | .57 | .54 | |
| QAEval EM | .88 | .94 | .88 | .86 | .95 | .95 | .64 | .55 | .28 | .27 | .29 | .27 | |
| QAEval F1 | .93 | .95 | .91 | .89 | .95 | .84 | .70 | .63 | .38 | .35 | .46 | .43 | |
| TAC08 | Lite3Pyramid | .99 | .97 | .92 | .93 | .97 | .90 | .78 | .72 | .53 | .48 | .56 | .53 |
| Lite2.5Pyramid | .99 | .97 | .92 | .92 | .98 | .95 | .82 | .77 | .58 | .54 | .66 | .61 | |
| Lite2Pyramid | .99 | .98 | .94 | .95 | .99 | .99 | .83 | .78 | .61 | .57 | .71 | .66 | |
| TAC08 | Lite3Pyramid | - | - | .94 | .95 | .97 | .88 | - | - | .52 | .49 | .56 | .53 |
| +TAC09 | Lite2.5Pyramid | - | - | .93 | .95 | .97 | .96 | - | - | .57 | .53 | .66 | .60 |
| Lite2Pyramid | - | - | .94 | .95 | .99 | .98 | - | - | .59 | .56 | .71 | .65 | |
| TAC08 | Lite3Pyramid | - | - | - | - | .97 | .88 | - | - | - | - | .50 | .44 |
| +TAC09 | Lite2.5Pyramid | - | - | - | - | .98 | .94 | - | - | - | - | .60 | .55 |
| +REALSumm | Lite2Pyramid | - | - | - | - | .99 | .94 | - | - | - | - | .70 | .64 |
We release the finetuned NLI models and the pretrained sentence regressors for future usage, so that they will work as out-of-the-box evaluation metrics for any summarization tasks. Then, a natural question to ask is how will the metrics perform on a new summarization task? To better estimate the out-of-the-box performance, we simulate out-of-the-box situations by training the NLI model and the regressor on some dataset(s) and then evaluate metrics on the other dataset(s). For example, in the last big row (starting with TAC08+TAC09+REALSumm) of Table 2, we finetune the NLI model and train the regressor on the entire TAC08+TAC09+REALSumm data then evaluate our metrics on PyrXSum only. Meanwhile, we also compare to other metrics. Different from the numbers in Table 1, numbers in Table 2 are calculated on the entire meta-evaluation set instead of the average of 5 folds.
It can be observed from Table 2 that our Lite2Pyramid retains its advantage in most out-of-the-box situations, especially for summary-level correlation. Though Lite3Pyramid does not always outperform the best metrics, it stays competitive. In addition, Lite2.5Pyramid retains its feature of trading off less than 50% correlation for saving 50% human effort. Surprisingly, learning from more data does not perform better: for PyrXSum, learning from all three other datasets (TAC08+TAC09+REALSumm) gets significantly worse performance than learning from TAC08 only or TAC08+TAC09. We conjecture that the difference between REALSumm (originated from CNN/DM Hermann et al. (2015)) and PyrXSum (originated from XSum Narayan et al. (2018)) leads to a “distribution shift”, which causes the performance drop. Besides, though new metrics have been proposed, ROUGE is still the dominant evaluation metric in the summarization literature. However, based on our comparison, ROUGE is not the best evaluation choice in most cases, while METEOR Banerjee and Lavie (2005) and the learning-based metric, S3 Peyrard et al. (2017), have fairly good correlations with human judgment. Overall, our automatic Lite3Pyramid is on a par with them, having the best performance in 4 cases (4 underline scores in Table 2).
Takeaway: When evaluating for a new summarization task with human-labeled SCUs, one could expect that Lite2Pyramid is reliably trustworthy and should be the top choice. Lite3Pyramid is also a fairly good choice for fully automatic evaluation. Finally, our pretrained regressor can guide people on which data examples are more worthy of spending manual effort on annotating SCUs.
Speed: Since SCUs’ collection or STUs’ extraction can be treated as data processing steps, the main speed bottleneck is running the NLI model. When a single TITAN V GPU is available, it takes around 2.5 minutes to evaluate 500 REALSumm (i.e., CNN/DM) examples.
Usage: We provide the support of our metrics through our github repository and we will also incorporate it within the SacreROUGE library Deutsch and Roth (2020).
6 Conclusion
We propose to combine manual effort and automation for summary evaluation. We introduce a semi-automatic Lite2Pyramid that gains reproducibility by replacing part of human effort with an NLI model. Following it, an automatic Lite3Pyramid is proposed through decomposing references by SRL. Plus, we propose a simple yet effective regressor to decide which sentences are more worthy of labeling SCUs for, leading to flexible transition metrics, Lite2.xPyramid. Evaluating on four meta-evaluation datasets and comparing to 15 other automatic metrics, Lite2Pyramid consistently has the best summary-level correlations; Lite3Pyramid also performs better or competitively; and Lite2.xPyramid offers flexible degrees of automation, and its regressor will provide useful or expense-saving guidance for future datasets.
Acknowledgments
We thank the reviewers for their helpful comments. We thank Xiang Zhou for useful discussions and thank Steven Chen for proofreading SCUs for PyrXSum. This work was supported by NSF-CAREER Award 1846185.
References
- DBL (2008) 2008. Proceedings of the First Text Analysis Conference, TAC 2008, Gaithersburg, Maryland, USA, November 17-19, 2008. NIST.
- DBL (2009) 2009. Proceedings of the Second Text Analysis Conference, TAC 2009, Gaithersburg, Maryland, USA, November 16-17, 2009. NIST.
- Banerjee and Lavie (2005) Satanjeev Banerjee and Alon Lavie. 2005. Meteor: An automatic metric for mt evaluation with improved correlation with human judgments. In Proceedings of the acl workshop on intrinsic and extrinsic evaluation measures for machine translation and/or summarization, pages 65–72.
- Bhandari et al. (2020) Manik Bhandari, Pranav Narayan Gour, Atabak Ashfaq, Pengfei Liu, and Graham Neubig. 2020. Re-evaluating evaluation in text summarization. In Proceedings of the 2020 Conference on Empirical Methods in Natural Language Processing (EMNLP), pages 9347–9359, Online. Association for Computational Linguistics.
- Bowman et al. (2015) Samuel R. Bowman, Gabor Angeli, Christopher Potts, and Christopher D. Manning. 2015. A large annotated corpus for learning natural language inference. In Proceedings of the 2015 Conference on Empirical Methods in Natural Language Processing, pages 632–642, Lisbon, Portugal. Association for Computational Linguistics.
- Carreras and Màrquez (2005) Xavier Carreras and Lluís Màrquez. 2005. Introduction to the conll-2005 shared task: Semantic role labeling. In Proceedings of the ninth conference on computational natural language learning (CoNLL-2005), pages 152–164.
- Chen and Guestrin (2016) Tianqi Chen and Carlos Guestrin. 2016. Xgboost: A scalable tree boosting system. In Proceedings of the 22nd acm sigkdd international conference on knowledge discovery and data mining, pages 785–794.
- Chen and Bansal (2018) Yen-Chun Chen and Mohit Bansal. 2018. Fast abstractive summarization with reinforce-selected sentence rewriting. In Proceedings of the 56th Annual Meeting of the Association for Computational Linguistics (Volume 1: Long Papers), pages 675–686.
- Clark et al. (2019) Elizabeth Clark, Asli Celikyilmaz, and Noah A Smith. 2019. Sentence mover’s similarity: Automatic evaluation for multi-sentence texts. In Proceedings of the 57th Annual Meeting of the Association for Computational Linguistics, pages 2748–2760.
- Denkowski and Lavie (2014) Michael Denkowski and Alon Lavie. 2014. Meteor universal: Language specific translation evaluation for any target language. In Proceedings of the ninth workshop on statistical machine translation, pages 376–380.
- Deutsch et al. (2021) Daniel Deutsch, Tania Bedrax-Weiss, and Dan Roth. 2021. Towards question-answering as an automatic metric for evaluating the content quality of a summary. TACL.
- Deutsch and Roth (2020) Daniel Deutsch and Dan Roth. 2020. Sacrerouge: An open-source library for using and developing summarization evaluation metrics. In Proceedings of Second Workshop for NLP Open Source Software (NLP-OSS), pages 120–125, Online. Association for Computational Linguistics.
- Deutsch and Roth (2021) Daniel Deutsch and Dan Roth. 2021. Understanding the extent to which summarization evaluation metrics measure the information quality of summaries. CoNLL.
- Devlin et al. (2019) Jacob Devlin, Ming-Wei Chang, Kenton Lee, and Kristina Toutanova. 2019. BERT: Pre-training of deep bidirectional transformers for language understanding. In Proceedings of the 2019 Conference of the North American Chapter of the Association for Computational Linguistics: Human Language Technologies, Volume 1 (Long and Short Papers), pages 4171–4186, Minneapolis, Minnesota. Association for Computational Linguistics.
- Durmus et al. (2020) Esin Durmus, He He, and Mona Diab. 2020. Feqa: A question answering evaluation framework for faithfulness assessment in abstractive summarization. In Proceedings of the 58th Annual Meeting of the Association for Computational Linguistics, pages 5055–5070.
- Eyal et al. (2019) Matan Eyal, Tal Baumel, and Michael Elhadad. 2019. Question answering as an automatic evaluation metric for news article summarization. In Proceedings of the 2019 Conference of the North American Chapter of the Association for Computational Linguistics: Human Language Technologies, Volume 1 (Long and Short Papers), pages 3938–3948.
- Fabbri et al. (2021) Alexander R Fabbri, Wojciech Kryściński, Bryan McCann, Caiming Xiong, Richard Socher, and Dragomir Radev. 2021. Summeval: Re-evaluating summarization evaluation. Transactions of the Association for Computational Linguistics, 9:391–409.
- Gao et al. (2020) Yang Gao, Wei Zhao, and Steffen Eger. 2020. Supert: Towards new frontiers in unsupervised evaluation metrics for multi-document summarization. In Proceedings of the 58th Annual Meeting of the Association for Computational Linguistics, pages 1347–1354.
- Gao et al. (2019) Yanjun Gao, Chen Sun, and Rebecca J Passonneau. 2019. Automated pyramid summarization evaluation. In Proceedings of the 23rd Conference on Computational Natural Language Learning (CoNLL), pages 404–418.
- Gardent et al. (2017) Claire Gardent, Anastasia Shimorina, Shashi Narayan, and Laura Perez-Beltrachini. 2017. The webnlg challenge: Generating text from rdf data. In Proceedings of the 10th International Conference on Natural Language Generation, pages 124–133.
- Gardner et al. (2018) Matt Gardner, Joel Grus, Mark Neumann, Oyvind Tafjord, Pradeep Dasigi, Nelson F Liu, Matthew Peters, Michael Schmitz, and Luke Zettlemoyer. 2018. Allennlp: A deep semantic natural language processing platform. In Proceedings of Workshop for NLP Open Source Software (NLP-OSS), pages 1–6.
- Giannakopoulos and Karkaletsis (2011) George Giannakopoulos and Vangelis Karkaletsis. 2011. Autosummeng and memog in evaluating guided summaries. In TAC.
- Giannakopoulos et al. (2008) George Giannakopoulos, Vangelis Karkaletsis, George Vouros, and Panagiotis Stamatopoulos. 2008. Summarization system evaluation revisited: N-gram graphs. ACM Transactions on Speech and Language Processing (TSLP), 5(3):1–39.
- He et al. (2017) Luheng He, Kenton Lee, Mike Lewis, and Luke Zettlemoyer. 2017. Deep semantic role labeling: What works and what’s next. In Proceedings of the 55th Annual Meeting of the Association for Computational Linguistics (Volume 1: Long Papers), pages 473–483.
- Hermann et al. (2015) Karl Moritz Hermann, Tomas Kocisky, Edward Grefenstette, Lasse Espeholt, Will Kay, Mustafa Suleyman, and Phil Blunsom. 2015. Teaching machines to read and comprehend. In Advances in neural information processing systems, pages 1693–1701.
- Hirao et al. (2018) Tsutomu Hirao, Hidetaka Kamigaito, and Masaaki Nagata. 2018. Automatic pyramid evaluation exploiting EDU-based extractive reference summaries. In Proceedings of the 2018 Conference on Empirical Methods in Natural Language Processing, pages 4177–4186, Brussels, Belgium. Association for Computational Linguistics.
- Joshi et al. (2018) Vidur Joshi, Matthew Peters, and Mark Hopkins. 2018. Extending a parser to distant domains using a few dozen partially annotated examples. In Proceedings of the 56th Annual Meeting of the Association for Computational Linguistics (Volume 1: Long Papers), pages 1190–1199, Melbourne, Australia. Association for Computational Linguistics.
- Krippendorff (2011) Klaus Krippendorff. 2011. Computing krippendorff’s alpha-reliability. Computing, 1.
- Kryscinski et al. (2019) Wojciech Kryscinski, Nitish Shirish Keskar, Bryan McCann, Caiming Xiong, and Richard Socher. 2019. Neural text summarization: A critical evaluation. In Proceedings of the 2019 Conference on Empirical Methods in Natural Language Processing and the 9th International Joint Conference on Natural Language Processing (EMNLP-IJCNLP), pages 540–551.
- Lan et al. (2019) Zhenzhong Lan, Mingda Chen, Sebastian Goodman, Kevin Gimpel, Piyush Sharma, and Radu Soricut. 2019. Albert: A lite bert for self-supervised learning of language representations. In International Conference on Learning Representations.
- Lee et al. (2018) Kenton Lee, Luheng He, and Luke Zettlemoyer. 2018. Higher-order coreference resolution with coarse-to-fine inference. In Proceedings of the 2018 Conference of the North American Chapter of the Association for Computational Linguistics: Human Language Technologies, Volume 2 (Short Papers), pages 687–692, New Orleans, Louisiana. Association for Computational Linguistics.
- Lewis et al. (2020) Mike Lewis, Yinhan Liu, Naman Goyal, Marjan Ghazvininejad, Abdelrahman Mohamed, Omer Levy, Veselin Stoyanov, and Luke Zettlemoyer. 2020. Bart: Denoising sequence-to-sequence pre-training for natural language generation, translation, and comprehension. In Proceedings of the 58th Annual Meeting of the Association for Computational Linguistics, pages 7871–7880.
- Lin (2004) Chin-Yew Lin. 2004. Rouge: A package for automatic evaluation of summaries. In Text summarization branches out, pages 74–81.
- Lin et al. (2006) Chin-Yew Lin, Guihong Cao, Jianfeng Gao, and Jian-Yun Nie. 2006. An information-theoretic approach to automatic evaluation of summaries. In Proceedings of the Human Language Technology Conference of the NAACL, Main Conference, pages 463–470, New York City, USA. Association for Computational Linguistics.
- Liu and Lapata (2019) Yang Liu and Mirella Lapata. 2019. Text summarization with pretrained encoders. In Proceedings of the 2019 Conference on Empirical Methods in Natural Language Processing and the 9th International Joint Conference on Natural Language Processing (EMNLP-IJCNLP), pages 3721–3731.
- Liu et al. (2019) Yinhan Liu, Myle Ott, Naman Goyal, Jingfei Du, Mandar Joshi, Danqi Chen, Omer Levy, Mike Lewis, Luke Zettlemoyer, and Veselin Stoyanov. 2019. Roberta: A robustly optimized bert pretraining approach. arXiv preprint arXiv:1907.11692.
- Loshchilov and Hutter (2018) Ilya Loshchilov and Frank Hutter. 2018. Decoupled weight decay regularization. In International Conference on Learning Representations.
- Narayan et al. (2018) Shashi Narayan, Shay B. Cohen, and Mirella Lapata. 2018. Don’t give me the details, just the summary! topic-aware convolutional neural networks for extreme summarization. In Proceedings of the 2018 Conference on Empirical Methods in Natural Language Processing, pages 1797–1807, Brussels, Belgium. Association for Computational Linguistics.
- Nenkova and Passonneau (2004) Ani Nenkova and Rebecca Passonneau. 2004. Evaluating content selection in summarization: The pyramid method. In Proceedings of the Human Language Technology Conference of the North American Chapter of the Association for Computational Linguistics: HLT-NAACL 2004, pages 145–152, Boston, Massachusetts, USA. Association for Computational Linguistics.
- Nie et al. (2020) Yixin Nie, Adina Williams, Emily Dinan, Mohit Bansal, Jason Weston, and Douwe Kiela. 2020. Adversarial NLI: A new benchmark for natural language understanding. In Proceedings of the 58th Annual Meeting of the Association for Computational Linguistics. Association for Computational Linguistics.
- Palmer et al. (2010) Martha Palmer, Daniel Gildea, and Nianwen Xue. 2010. Semantic role labeling. Synthesis Lectures on Human Language Technologies, 3(1):1–103.
- Papineni et al. (2002) Kishore Papineni, Salim Roukos, Todd Ward, and Wei-Jing Zhu. 2002. Bleu: a method for automatic evaluation of machine translation. In Proceedings of the 40th annual meeting of the Association for Computational Linguistics, pages 311–318.
- Passonneau (2010) Rebecca J Passonneau. 2010. Formal and functional assessment of the pyramid method for summary content evaluation. Natural Language Engineering, 16(2):107.
- Paulus et al. (2018) Romain Paulus, Caiming Xiong, and Richard Socher. 2018. A deep reinforced model for abstractive summarization. In International Conference on Learning Representations.
- Peyrard et al. (2017) Maxime Peyrard, Teresa Botschen, and Iryna Gurevych. 2017. Learning to score system summaries for better content selection evaluation. In Proceedings of the Workshop on New Frontiers in Summarization, pages 74–84.
- Raffel et al. (2020) Colin Raffel, Noam Shazeer, Adam Roberts, Katherine Lee, Sharan Narang, Michael Matena, Yanqi Zhou, Wei Li, and Peter J Liu. 2020. Exploring the limits of transfer learning with a unified text-to-text transformer. Journal of Machine Learning Research, 21:1–67.
- See et al. (2017) Abigail See, Peter J Liu, and Christopher D Manning. 2017. Get to the point: Summarization with pointer-generator networks. In Proceedings of the 55th Annual Meeting of the Association for Computational Linguistics (Volume 1: Long Papers), pages 1073–1083.
- Sellam et al. (2020) Thibault Sellam, Dipanjan Das, and Ankur Parikh. 2020. Bleurt: Learning robust metrics for text generation. In Proceedings of the 58th Annual Meeting of the Association for Computational Linguistics, pages 7881–7892.
- Settles (2012) Burr Settles. 2012. Active Learning, volume 18. Morgan & Claypool Publishers.
- Shapira et al. (2019) Ori Shapira, David Gabay, Yang Gao, Hadar Ronen, Ramakanth Pasunuru, Mohit Bansal, Yael Amsterdamer, and Ido Dagan. 2019. Crowdsourcing lightweight pyramids for manual summary evaluation. In Proceedings of the 2019 Conference of the North American Chapter of the Association for Computational Linguistics: Human Language Technologies, Volume 1 (Long and Short Papers), pages 682–687.
- Shi and Lin (2019) Peng Shi and Jimmy Lin. 2019. Simple bert models for relation extraction and semantic role labeling. arXiv preprint arXiv:1904.05255.
- Thorne et al. (2018) James Thorne, Andreas Vlachos, Christos Christodoulopoulos, and Arpit Mittal. 2018. FEVER: a large-scale dataset for fact extraction and VERification. In Proceedings of the 2018 Conference of the North American Chapter of the Association for Computational Linguistics: Human Language Technologies, Volume 1 (Long Papers), pages 809–819, New Orleans, Louisiana. Association for Computational Linguistics.
- Tratz and Hovy (2008) Stephen Tratz and Eduard Hovy. 2008. Bewte: basic elements with transformations for evaluation. In TAC 2008 Workshop.
- Vasilyev et al. (2020) Oleg Vasilyev, Vedant Dharnidharka, and John Bohannon. 2020. Fill in the blanc: Human-free quality estimation of document summaries. In Proceedings of the First Workshop on Evaluation and Comparison of NLP Systems, pages 11–20.
- Wang et al. (2020) Alex Wang, Kyunghyun Cho, and Mike Lewis. 2020. Asking and answering questions to evaluate the factual consistency of summaries. In Proceedings of the 58th Annual Meeting of the Association for Computational Linguistics, pages 5008–5020.
- Williams et al. (2018a) Adina Williams, Nikita Nangia, and Samuel Bowman. 2018a. A broad-coverage challenge corpus for sentence understanding through inference. In Proceedings of the 2018 Conference of the North American Chapter of the Association for Computational Linguistics: Human Language Technologies, Volume 1 (Long Papers), pages 1112–1122. Association for Computational Linguistics.
- Williams et al. (2018b) Adina Williams, Nikita Nangia, and Samuel Bowman. 2018b. A broad-coverage challenge corpus for sentence understanding through inference. In Proceedings of the 2018 Conference of the North American Chapter of the Association for Computational Linguistics: Human Language Technologies, Volume 1 (Long Papers), pages 1112–1122.
- Wolf et al. (2020) Thomas Wolf, Lysandre Debut, Victor Sanh, Julien Chaumond, Clement Delangue, Anthony Moi, Pierric Cistac, Tim Rault, Rémi Louf, Morgan Funtowicz, Joe Davison, Sam Shleifer, Patrick von Platen, Clara Ma, Yacine Jernite, Julien Plu, Canwen Xu, Teven Le Scao, Sylvain Gugger, Mariama Drame, Quentin Lhoest, and Alexander M. Rush. 2020. Transformers: State-of-the-art natural language processing. In Proceedings of the 2020 Conference on Empirical Methods in Natural Language Processing: System Demonstrations, pages 38–45, Online. Association for Computational Linguistics.
- Xenouleas et al. (2019) Stratos Xenouleas, Prodromos Malakasiotis, Marianna Apidianaki, and Ion Androutsopoulos. 2019. Sum-qe: a bert-based summary quality estimation model. In Proceedings of the 2019 Conference on Empirical Methods in Natural Language Processing and the 9th International Joint Conference on Natural Language Processing (EMNLP-IJCNLP), pages 6007–6013.
- Xu et al. (2020) Xinnuo Xu, Ondřej Dušek, Jingyi Li, Verena Rieser, and Ioannis Konstas. 2020. Fact-based content weighting for evaluating abstractive summarisation. In Proceedings of the 58th Annual Meeting of the Association for Computational Linguistics, pages 5071–5081.
- Yang et al. (2016) Qian Yang, Rebecca Passonneau, and Gerard De Melo. 2016. Peak: Pyramid evaluation via automated knowledge extraction. In Proceedings of the AAAI Conference on Artificial Intelligence, volume 30.
- Zhang et al. (2020) Jingqing Zhang, Yao Zhao, Mohammad Saleh, and Peter Liu. 2020. Pegasus: Pre-training with extracted gap-sentences for abstractive summarization. In International Conference on Machine Learning, pages 11328–11339. PMLR.
- Zhang et al. (2019) Tianyi Zhang, Varsha Kishore, Felix Wu, Kilian Q Weinberger, and Yoav Artzi. 2019. Bertscore: Evaluating text generation with bert. In International Conference on Learning Representations.
- Zhao et al. (2019) Wei Zhao, Maxime Peyrard, Fei Liu, Yang Gao, Christian M Meyer, and Steffen Eger. 2019. Moverscore: Text generation evaluating with contextualized embeddings and earth mover distance. In Proceedings of the 2019 Conference on Empirical Methods in Natural Language Processing and the 9th International Joint Conference on Natural Language Processing (EMNLP-IJCNLP), pages 563–578.
- Zhou et al. (2007) Liang Zhou, Namhee Kwon, and Eduard Hovy. 2007. A semi-automatic evaluation scheme: Automated nuggetization for manual annotation. In Human Language Technologies 2007: The Conference of the North American Chapter of the Association for Computational Linguistics; Companion Volume, Short Papers, pages 217–220.
Appendix A Appendix
A.1 Metrics for Comparison
ROUGE-1, ROUGE-2, and ROUGE-L Lin (2004) are based on n-gram overlap and are widely used in summarization literature till today.
AutoSummENG Giannakopoulos et al. (2008) uses n-gram graphs to compare the system summary to the reference(s).
METEOR Banerjee and Lavie (2005); Denkowski and Lavie (2014) computes similarity through text alignment and uses stem, synonyms, paraphrases to allow more flexible matching.
BEwT-E Tratz and Hovy (2008) decomposes summary into syntactic units and computes the similarity based on those units.
S3 Peyrard et al. (2017) is a learned metric trained on TAC2008/2009 datasets to predict human Pyramid (pyr) or Responsiveness (resp) scores.
PyrEval Gao et al. (2019) automate Pyramid by simulating SCUs through Emergent Discovery of Units of Attraction. It returns four scores. Empirically, we find that quality and comprehensive work better, so we only keep these two in our result tables. Note that it only supports multi-reference situations because it retains SCUs’ weighting step.
BERTScore Zhang et al. (2019) aligns unigrams between two texts through the contextualized word embeddings from BERT Devlin et al. (2019). We also compare to BERTScore (idf) that down-weights unigrams with high document frequency.
MoverScore Zhao et al. (2019) also uses contextualized word embeddings. Differently, they minimize the “transportation cost” between two texts.
QAEval Deutsch et al. (2021) leverages Question Answering to evaluate the similarity of two texts, i.e., if they have the same meaning, the same answer should be inferred from them for the same question. They use either Exact Match (EM) or F1 (F1) to evaluate answer similarity.
A.2 PyrXSum
Both TAC08/09 DBL (2008, 2009) and REALSumm Bhandari et al. (2020) (examples from CNN/DM Hermann et al. (2015)) have long and extractive summaries. As a complementary, we collect a new meta-evaluation dataset, PyrXSum, for XSum Narayan et al. (2018) which contains short and abstractive summaries. We random sample 100 examples from XSum’s testing set. Then, following Bhandari et al. (2020), we (authors) annotate Semantic Content Units (SCUs) for reference summaries of the 100 examples. After annotation, another non-author native English speaker is invited to double-check the annotated SCUs and give improvement suggestions. Finally, we annotate 2 to 11 SCUs per reference; on average, there are 4.8 SCUs per reference.
| Model | Fast Abs RL | PtGen | ConvS2S | T-ConvS2S | TransAbs | BertAbs | BertExtAbs | T5 | BART | PEGASUS |
|---|---|---|---|---|---|---|---|---|---|---|
| R2 | 7.02 | 9.68 | 11.58 | 11.46 | 10.85 | 15.63 | 17.68 | 21.01 | 23.96 | 26.23 |
| Pyramid | 0.09 | 0.09 | 0.12 | 0.12 | 0.07 | 0.19 | 0.22 | 0.29 | 0.31 | 0.31 |
Next, we obtain model generated summaries for these 100 examples from 10 abstractive summarization systems: Fast Abs RL Chen and Bansal (2018), PtGen See et al. (2017), ConvS2S and T-ConvS2S Narayan et al. (2018), TransAbs and BertAbs and BertExtAbs Liu and Lapata (2019), T5 Raffel et al. (2020), BART Lewis et al. (2020), and PEGASUS Zhang et al. (2020). We do not include extractive summarization systems because XSum is known to be extremely abstractive and even oracle extractive method has low performance Narayan et al. (2018). For Fast Abs RL, we use their open-source code999https://github.com/ChenRocks/fast_abs_rl to train a model on XSum training set and get its generations for these 100 examples. We directly use the model outputs of PtGen, ConvS2S, and T-ConvS2S, released by Narayan et al. (2018).101010https://github.com/EdinburghNLP/XSum For TransAbs, BertAbs, and BertExtAbs, we also directly use the model outputs released by Liu and Lapata (2019).111111https://github.com/nlpyang/PreSumm For BART Lewis et al. (2020) and PEGASUS Zhang et al. (2020), we take advantage of the XSum pretrained models released on HuggingFace121212https://huggingface.co/facebook/bart-large-xsum, https://huggingface.co/google/pegasus-xsum and generate summaries from them. Lastly, we finetune T5 large on XSum training set via Transformers of HuggingFace Wolf et al. (2020) and generate summaries from the finetuned model. Table 3 lists the ROUGE-2 (R2) Lin (2004) results of the 10 systems evaluated only on the 100 examples.
| System-level | Summary-level | |||||||||||||||
| TAC08 | TAC09 | REALSumm | PyrXSum | TAC08 | TAC09 | REALSumm | PyrXSum | |||||||||
| Metrics | ||||||||||||||||
| ROUGE-1 | .92 | .92 | .93 | .88 | .76 | .66 | 1.0 | 1.0 | .61 | .59 | .66 | .60 | .47 | .43 | .30 | .30 |
| ROUGE-2 | .96 | .96 | .97 | .93 | .82 | .82 | 1.0 | 1.0 | .63 | .60 | .67 | .61 | .43 | .41 | .30 | .30 |
| ROUGE-L | .93 | .91 | .95 | .90 | .82 | .84 | 1.0 | 1.0 | .56 | .53 | .62 | .57 | .40 | .36 | .29 | .29 |
| AutoSummENG | .94 | .89 | .96 | .91 | .51 | .40 | .60 | .60 | .64 | .62 | .68 | .62 | .33 | .32 | .07 | .07 |
| METEOR | .94 | .93 | .95 | .88 | .81 | .76 | .60 | .60 | .65 | .62 | .70 | .65 | .49 | .46 | .26 | .26 |
| BEwT-E | .96 | .94 | .98 | .93 | .82 | .72 | .60 | .60 | .65 | .62 | .72 | .66 | .43 | .40 | .28 | .28 |
| S3 pyr | .95 | .93 | .95 | .89 | .81 | .78 | 1.0 | 1.0 | .66 | .63 | .71 | .65 | .49 | .45 | .24 | .24 |
| S3 resp | .96 | .94 | .96 | .90 | .82 | .82 | 1.0 | 1.0 | .66 | .64 | .71 | .65 | .48 | .44 | .22 | .22 |
| PyrEval qual | .91 | .88 | .91 | .84 | - | - | - | - | .40 | .38 | .46 | .42 | - | - | - | - |
| PyrEval comp | .90 | .87 | .93 | .80 | - | - | - | - | .41 | .39 | .49 | .44 | - | - | - | - |
| BertScore | .91 | .89 | .98 | .89 | .69 | .68 | .60 | .60 | .61 | .58 | .67 | .62 | .43 | .40 | .12 | .12 |
| BertScore (idf) | .93 | .90 | .97 | .89 | .70 | .68 | .60 | .60 | .61 | .58 | .68 | .63 | .44 | .41 | .10 | .10 |
| MoverScore | .95 | .92 | .96 | .90 | .47 | .46 | .20 | .20 | .64 | .61 | .71 | .65 | .37 | .34 | .14 | .14 |
| QAEval EM | .94 | .90 | .97 | .92 | .83 | .70 | .60 | .60 | .48 | .47 | .58 | .53 | .22 | .20 | .46 | .46 |
| QAEval F1 | .97 | .93 | .98 | .95 | .86 | .78 | .20 | .20 | .61 | .58 | .66 | .60 | .31 | .29 | .42 | .42 |
| Lite3Pyramid | .98 | .95 | .99 | .97 | .78 | .76 | .20 | .20 | .74 | .71 | .78 | .73 | .49 | .47 | .48∗ | .48∗ |
| Lite2.5Pyramid | .99 | .96 | .99 | .97 | .71 | .70 | .60 | .60 | .84 | .81 | .86 | .82 | .53 | .51 | .53∗ | .53∗ |
| Lite2Pyramid | .99 | .98 | .99 | .98 | .74 | .72 | 1.0 | 1.0 | .87 | .84 | .88 | .84 | .56 | .52 | .66∗ | .66∗ |
| Lite2Pyramid-0 | .88 | .85 | .97 | .90 | .73 | .72 | 1.0 | 1.0 | .62 | .60 | .71 | .66 | .48 | .47 | .63 | .63 |
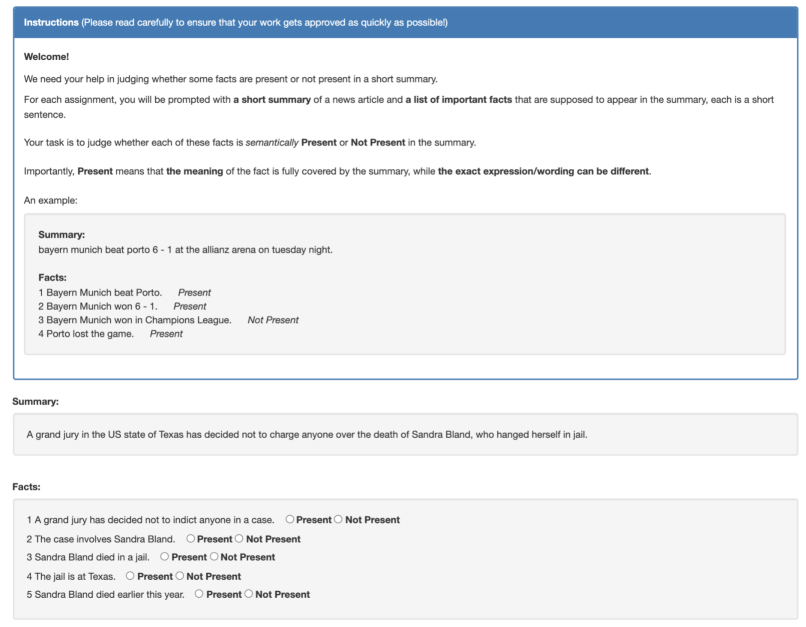
Then, we collect the SCUs’ presence labels for each system summary on Amazon Mechanical Turk. Figure 3 illustrates the data annotation instructions and interfaces shown to crowdsourcing workers. The summaries usually only contain one sentence. We estimate it will take around 30-45 seconds for a native English speaker to finish one HIT. Following Bhandari et al. (2020), we pay $0.15 per HIT, which is respectably higher than the U.S. federal minimum wage requirement. Meanwhile, we select annotators that are located in the U.S., have an approval rate greater than 98%, and have at least 10,000 approved HITs.
We collect 4 responses per summary (100 * 10 * 4 HITs) and finally, 104 workers were involved. After annotation, we filter the annotations from a noisy worker who did 210 HITs but disagreed with the majority in 72% of the time. After this filtering, we obtain an average inter-annotator agreement (Krippendorff’s alpha Krippendorff (2011)) of 0.73. Following Bhandari et al. (2020), we use the majority vote to mark the presence of an SCU and break ties by “not present”. Table 3 shows the gold Pyramid scores of different systems.
Usually judging the presence of SCUs is considered as a task with little ambiguity, reflected by the high inter-annotator agreements achieved by REAMSumm (0.66) Bhandari et al. (2020) and our PyrXSum (0.73). To further verify this, on REALSumm, instead of taking the majority vote, we randomly sample 1 out of 4 as the gold label. We conduct this for 3 rounds and test Lite2Pyramid’s correlations with these 3 sets of human labels. We get 0.89/0.63, 0.90/0.63, 0.90/0.63 system/summary-level Pearson correlations, respectively. They are close to each other and also close to the results obtained from the majority vote (0.89/0.64). This means workers give rather consistent SCU-presence labels.
A.3 Experimental Details
NLI.
For the natural language inference (NLI) used in our work, we take advantage of the pre-trained NLI released by Nie et al. (2020).131313https://github.com/facebookresearch/anli We use the RoBERTa Liu et al. (2019) large based version.141414ynie/roberta-large-snli_mnli_fever_anli_R1_R2_R3-nli This model is implemented on HuggingFace’s Transformers Wolf et al. (2020) and was trained on SNLI Bowman et al. (2015), MNLI Williams et al. (2018b), FEVER Thorne et al. (2018), and ANLI Nie et al. (2020). We directly use this pretrained model for our Lite2Pyramid-0 metric. When we finetune this model, for simplicity, we always use learning rate=1e-5, linear schedule with warmup, and AdamW Loshchilov and Hutter (2018) optimizer, and we always finetune for 2 epochs.
SRL.
For Semantic Role Labeling (SRL) model, we use the out-of-the-box SRL model pretrained by AllenNLP Gardner et al. (2018).151515https://demo.allennlp.org/semantic-role-labeling And it is based the model proposed by Shi and Lin (2019).
Coreference Resolution.
For the Coreference Resolution model, we also use the out-of-the-box Coreference model pretrained by AllenNLP Gardner et al. (2018).161616https://demo.allennlp.org/coreference-resolution And it is based the model proposed by Lee et al. (2018).
Constituency Parsing.
For the Constituency Parsing model, we also use the out-of-the-box parser pretrained by AllenNLP Gardner et al. (2018).171717https://demo.allennlp.org/constituency-parsing And it is based the model proposed by Joshi et al. (2018).
Regressor.
The full features we used to train the regressor are: (1) sentence length (in words); (2) linearized parsing tree length (in characters); (3) parsing tree depth; (4) parsing tree depth divided by sentence length; (5) the counts of parsing tree non-terminal tokens.181818WRB, RBR, ADVP, VBG, $, ”, WHADVP, -RRB-, JJR, NAC, PRP, NNS, WP, VBZ, MD, WDT, NP, ADJP, PDT, EX, UH, NN, NFP, SYM, PRP$, RBS, FRAG, NX, CONJP, RP, WHPP, CC, VBD, LS, ., SBAR, TO, JJ, IN, VP, -LRB-, S, QP, SQ, CD, “, X, POS, XX, PP, PRT, JJS, HYPH, ,, RB, VBN, :, VBP, DT, VB, SINV, UCP, WHNP, NNPS, NNP. Then, we train the regressor through the XGBoost Python Package191919https://xgboost.readthedocs.io/en/latest/python/index.html and we set the max depth=3, learning rate eta=0.1, number of round=40.
A.4 Additional Results & Ablations
Cross-Validation Results.
As a complement of Figure 2 in the main paper, Figure 4 shows the Lite2.xPyramid curves for system-level correlations. It can be observed that comparing to using random replacement, our Lite2.xPyramid always achieves higher or the same correlations when the same amount of human effort is reduced. Besides, Table 4 shows our 5-fold cross-validation (split by systems) results.

NLI.
On REALSumm, the finetuned and non-finetuned NLI models get 82.34% and 80.51% accuracy for SCU-presence prediction, respectively. Similarly, 92.53%/87.63% are for TAC08, 93.25%/88.66% are for TAC09, and 92.45%/91.13% are for PyrXSum. Each number is an average of 5 folds (split by examples). As shown in Table 1, Lite2Pyramid (with finetuned NLIs) always gets higher correlations than Lite2Pyramid-0 (with non-finetuned NLIs) except for PyrXSum. Therefore, we think NLI accuracy positively affects the results. In our work, we use a RoBERTa Liu et al. (2019) based NLI models. Here, to evaluate our metrics’ robustness to different types of NLI models, we test an ALBERT Lan et al. (2019) based NLI model.202020ynie/albert-xxlarge-v2-snli_mnli_fever_anli_R1_R2_R3-nli On REALSumm, Lite2Pyramid gets 0.90/0.64 system/summary-level Pearson correlations with human, similar to our RoBERTa-NLI based results (0.89/0.64).
Regressor.
On REALSumm, TAC08, TAC09, and XSum, our regressors’ Mean Absolute Errors (MAE) are 0.135, 0.211, 0.206, and 0.090, respectively. On REALSumm, we test a weaker regressor (MAE=0.167), while we get similar results (0.89/0.62 system/summary-level Pearson correlations for Lite2.5Pyramid) to our original regressor (0.90/0.62). However, the sentence selector guided by our regressor always works better than the random selector (shown in Figure 2 and Figure 4). We think the regressor influences the results by determining the ranking. If we reverse the ranking from the regressor, i.e., replacing SCUs with STUs for more complex sentences, we get lower correlations (0.88/0.60). In our work, we use XGBoost regressor instead of regressors based on pretrained LM because we think to determine the simulation easiness of sentences, syntactic features are more important than semantic features, and we want to keep the regressor as light-weight as possible. Here, we evaluate a RoBERTa-based regressor on REALSumm and it gets 0.89/0.62 system/summary-level Pearson correlations for Lite2.5Pyramid, which is similar to our XGBoost regressor’s results (0.90/0.62).