Energetic Particle Acceleration in Compressible Magnetohydrodynamic Turbulence
Abstract
Magnetohydrodynamic (MHD) turbulence is an important agent of energetic particle acceleration. Focusing on the compressible properties of magnetic turbulence, we adopt test particle method to study the particle acceleration from Alfvén, slow and fast modes in four turbulence regimes that may appear in a realistic astrophysical environment. Our studies show that (1) the second-order Fermi mechanism drives the acceleration of particles in the cascade processes of three modes by particle-turbulence interactions, regardless of whether the shock wave appears; (2) not only can the power spectra of maximum acceleration rates reveal the inertial range of compressible turbulence, but also recover the scaling and energy ratio relationship between the modes; (3) fast mode dominates the acceleration of particles, especially in the case of super-Alfvénic and supersonic turbulence, slow mode dominates the acceleration for sub-Alfvénic turbulence in the very high energy range, and the acceleration of Alfvén mode is significant at the early stage of the acceleration; (4) particle acceleration from three modes results in a power-law distribution in the certain range of evolution time. From the perspective of particle-wave mode interaction, this paper promotes the understanding for both the properties of turbulence and the behavior of particle acceleration, which will help insight into astrophysical processes involved in MHD turbulence.
1 Introduction
The visibility of cosmic astrophysics is due to the presence of a non-thermal particle population that dominates emission spanning more than 20 orders of magnitude of the electromagnetic spectrum (e.g., Longair et al. 2011). Correctly explaining the essence of astrophysical activity phenomenon is to understand how non-thermal high-energy particles are accelerated. The widely accepted effective mechanisms for the acceleration of high-energy particles are the diffusion shock wave (termed as the first-order Fermi process; Bell 1978) and the turbulent magnetic reconnection (Lazarian & Vishniac 1999, hereafter LV99; Lazarian et al. 2015, 2020 for recent reviews), the latter of which has been also considered to be a first-order Fermi acceleration process (de Gouveia Dal Pino & Lazarian 2005; Kowal et al. 2012; Zhang et al. 2021). At present, the second-order Fermi acceleration has been suggested for acceleration of particles in a number of astrophysical settings, such as black-hole X-ray binary (Zhang et al. 2018b), supernova remnant (Fan et al. 2010), solar physics (Yan et al. 2008; Petrosian & Bykov 2008), the interstellar medium (Cho & Lazarian 2003) and diffuse intracluster medium in galaxy clusters (Brunetti & Lazarian 2016). It is noticed that MHD turbulence is an important agent of particle acceleration as pointed out by Alfvén (1942) for stochastic particle acceleration.
The new paradigm of MHD turbulence, especially compressible properties associated with Alfvén, slow and fast modes, has significantly promoted the understanding of energetic particle-turbulence interactions, including particle acceleration, scattering, diffusion and propagation processes (Yan & Lazarian 2002, 2004; Chandran 2003; Cho & Lazarian 2006; Beresnyak & Li 2016; Xu & Yan 2013, 2018; Lazarian & Xu 2021). For instance, stochastic particle acceleration from slow mode (Chandran 2003) and fast one (Yan et al. 2008) assuming efficient pitch-angle scattering was applied to elucidating solar flares. Cho & Lazarian (2006) made use of the established scaling of slow and fast modes to provide a systematic analytical research of particle acceleration in strong and weak MHD turbulence. In the limits of both slow and fast particle diffusion, they found that fast mode accelerates particles more efficiently than slow mode, the efficiency of particle acceleration by slow and fast modes depends on the spatial diffusion rate, and highly supersonic turbulence is an efficient agent for the acceleration. Since Alfvén and slow modes undergo an anisotropy cascade mainly in the direction perpendicular to the underlying mean magnetic field, they are generally considered the comparatively inefficiency in the acceleration of particles. This needs further verification of numerical simulation.
Generally, test particle method is popular in studying the interaction between cosmic ray particles and MHD turbulence. In this way, to trace particle trajectories by integrating the Lorentz force, Xu & Yan (2013) pointed out that cosmic ray diffusion coefficients are spatially correlated to the local magnetic turbulence properties and confirmed that cosmic rays are superdiffusive in MHD turbulence. Similarly, the recent study using the open source PENCIL code demonstrated that the fast mode dominates the cosmic ray propagation, whereas Alfvén and slow modes are much less efficient with similar pitch angle scattering rates (Maiti et al. 2021). With the purpose of studying the perpendicular and parallel diffusion of magnetic field, they both ignored the effect of the induced electric field arising from MHD turbulence. When investigating particle acceleration in a turbulent reconnection layer or a purely turbulent setting, kinetic equation including the induced electric field has been numerically solved using the similar test particle method (Kowal et al. 2011, 2012; del Valle et al. 2016; Zhang et al. 2021).
Recently, a variety of observation-based new techniques has shed new light on the understanding of the nature of MHD turbulence (e.g., Lazarian & Pogosyan 2012; Zhang et al. 2016, 2018, 2020). Especially with application of the quadrupole ratio modulus for synchrotron polarization intensity, Wang et al. (2020) successfully recovered the anisotropic properties of compressible MHD turbulence. Statistics of the polarization intensity from Alfvén and slow modes demonstrate the significant anisotropy, while the statistics of the polarization intensity from fast mode show isotropic feature. This is in agreement with earlier directly numerical results provided in Cho & Lazarian (2002). These findings indeed show that synchrotron polarization radiation signature is closely related to MHD turbulence properties. In almost all the studies that we know currently, the specific acceleration properties of non-thermal high-energy particles have still not been explored when applying techniques to the measurement of the turbulence. The purpose of our current work is to explore how high-energy particles are accelerated in compressible MHD turbulence, and whether the acceleration of high-energy particles are relevant to the properties of compressible MHD turbulence.
2 Theoretical Description
2.1 MHD turbulence theory
It is widely accepted that Goldreich & Sridhar (1995, hereafter GS95) initiated the development of modern MHD turbulence theory (see Beresnyak & Lazarian 2019 for a recent review). In the case of strong turbulence, that is, , where is the injection velocity at the scale and is the Alfvénic velocity with the mean magnetic field strength and the density , this work predicted the scale-dependent anisotropy () of incompressible MHD turbulence through the assumption of critical equilibrium, i.e., . Here, indicates the fluctuation velocity of turbulence at the scale , while and denote parallel and perpendicular scales of the eddies, respectively.
In the framework of a collection of anisotropic eddies for MHD turbulence, GS95 was generalized to both and (LV99 and Lazarian 2006). In the case of , i.e., the MHD turbulence being driven with sub-Alfvénic velocities at injection scale , it was found that a weak turbulence spans from to the transition scale , while the strong sub-Alfvénic turbulence is in the range from the dissipation scale to the transition scale , where the turbulence velocity is equal to . In this strong turbulence range, we have the relation
| (1) |
between the parallel scale of the eddy extended along the magnetic field and its transversal scale . When setting , we obtain the original GS95 relation of .
The opposite case, , corresponds to super-Alfvénic turbulence, i.e., , where is the turbulence injection velocity. For a limiting case of , since the weakly turbulent magnetic field undergoes a marginal influence of MHD turbulence, the turbulence at the scale close to scale has an essentially hydrodynamic Kolmogorov performance, i.e., . Interestingly, changes happen at the scale of to the hydrodynamic property of turbulence cascade (see Section 2.2 in Lazarian 2006), where the turbulent velocity is equal to the Alfvén velocity. In the inertial range from to , the super-Alfvénic turbulence follows again the characteristics of the GS95 anisotropy (GS95 and Lazarian 2006).
Another important component of MHD turbulence theory is its compressibility (Beresnyak 2019 for recent review; Beresnyak & Lazarian 2019 for textbook), which was confirmed in numerical simulations (Lithwick & Goldreich 2001; Cho & Lazarian 2002, 2003 ) using the Fourier (Cho & Lazarian 2002) or wavelet (Kowal & Lazarian 2010) decomposition MHD turbulence into three modes, i.e., Alfvén, slow and fast modes. It was demonstrated that while density is seriously modified by compressibility, the magnetic and velocity fluctuations of Alfvén and slow modes are only slightly different from that of the incompressible case (Cho & Lazarian 2002; Kowal & Lazarian 2010). Generally, Alfvén modes are compatible with the GS95 anisotropic property (), following Kolmogorov spectrum of , and slow modes sheared by Alfvén modes are evolved passively, showing the GS95 anisotropic property, while fast modes have isotropic properties (), abiding by the scaling of (Cho & Lazarian 2002). What is worth noting is that the properties of these modes have been well confirmed by observational research, such as synchrotron radiation statistics (Lazarian & Pogosyan 2012; Wang et al. 2020) and velocity channel analysis of spectroscopic measurement (Kandel et al. 2016, 2017).
2.2 Particle acceleration mechanism
Particle acceleration mechanism can generally be classified as dynamic, hydrodynamic and electromagnetic processes (Longair et al. 2011). In general, magnetic fields themselves do no work and cannot be directly responsible for particle acceleration, but time-varying magnetic fields lead to an inductive electric field, , to accelerate particles. The classic model of particle acceleration dates back to Fermi (1949) in which particles can statistically gain energy through collisions with interstellar clouds, resulting in a second-order acceleration, , where and are the velocity of the cloud and the speed of light, respectively. By assuming a characteristic escape time, , he obtained a distribution of particle energies, with , where and are model-dependent parameters. Thus, this model does not predict a single power-law exponent, i.e., a change in the power-law index. In the modern understanding of the second-order Fermi acceleration (Longair et al. 2011), the particles gain energy by interacting with various types of plasma wave or irregularities in the interstellar magnetic field. As for this mechanism, it is generally thought that there are few chances of a particle gaining significant energy due to the second-order behavior of .
To enhance acceleration efficiency, many researches on particle acceleration have been motivated independently and applied to many diverse astrophysical environments (Bell 1978; Blandford & Ostriker 1978; Drury et al. 1999). The acceleration process was associated with acceleration in strong shock waves, referred to as diffusive shock acceleration, in which the acceleration is first-order, in the shock velocity and predicts a power-law spectrum with an index of 2. This model, as first-order Fermi acceleration, is efficient for accelerating particles. However, this model ignored detailed physics of the magnetic field and energy losses of the particles. Considering the effect of magnetic fields, it is involved in a complex non-linear process and causes a more of less universal power-law energy spectrum (Berezhko & Völk 2007; Kang et al. 2006, 2009).
In analogy to classical diffusive shock acceleration, it was suggested that a first-order Fermi process operates within the 3D current sheet of turbulent reconnection (LV99, de Gouveia Dal Pino & Lazarian 2005; Drury 2012; Kowal et al. 2011, 2012; Zhang et al. 2021), where particles trapped in the converging magnetic fluxes of opposite polarity bounce back and forth in the large-scale reconnection zone. Similarly, Drake et al. (2006) proposed that the particles trapped in contracting 2D magnetic islands or plasmoids caused by tearing reconnection also undergo a similar first-order Fermi process. In driving the first-order Fermi process, it was demonstrated to be equivalent between plasma kinetic scale reconnection and MHD turbulent reconnection (Kowal et al. 2011).
3 Simulation Methods
3.1 Simulation of MHD Turbulence
The equations describing MHD turbulence are given as follows
| (2) |
| (3) |
| (4) |
| (5) |
where is the gas pressure, the sonic speed, the evolution time of the fluid, the current density, and f a random driving force. In our simulation, we use a third-order-accurate hybrid, essentially non-oscillatory code to solve the above control equations in a periodic box at the length of . In wavenumber space, we drive the turbulence by a random solenoidal driving force on large scale (small wavenumber ), and set a non-zero mean magnetic field along the -axis direction. The data cubes with numerical resolution of we obtained, corresponding to four different turbulence regimes, are listed in Table 1, where each group of data is mainly depicted by the plasma parameter, the Alfvénic and sonic Mach numbers.
Cho & Lazarian (2002) provided a method to decompose MHD modes into Alfvén, slow and fast modes. The main procedure of this decomposition method is characterized by the following displacement vectors
| (6) |
| (7) |
| (8) |
where and . By projecting magnetic field and velocity into , and , we can obtain their components for fast, slow and Alfvén modes. It is noticed that when each MHD mode is separated by the Fourier transformation, this technique is closely related to the mean magnetic field in the global frame. In the view of depending on the wandering of large scale magnetic field and density inhomogeneities, this technique is only applicable for the case of the sub-Alfvénic turbulence with a strong mean magnetic field and small perturbation. Afterward, Kowal & Lazarian (2010) proposed an improved procedure to extend the earlier decomposition (Cho & Lazarian 2002) by introducing a discrete wavelet transformation before the Fourier separation. This improved method relies on the local magnetic field instead of the mean magnetic field. Therefore, it has more significant advantages in decomposing turbulent fluctuations of high amplitude in the case of the sup-Alfvénic turbulence.
| Models | Description | ||||
|---|---|---|---|---|---|
| run1 | 1.0 | 0.65 | 0.48 | 3.67 | Sub-Alfvénic & subsonic |
| run2 | 1.0 | 0.50 | 9.92 | 0.01 | Sub-Alfvénic & supersonic |
| run3 | 0.1 | 1.72 | 0.45 | 29.12 | super-Alfvénic & subsonic |
| run3 | 0.1 | 1.76 | 7.02 | 0.13 | super-Alfvénic & supersonic |
3.2 Method of Test Particle
In the MHD turbulence, the motion of a charged particle satisfies the following kinetic equation
| (9) |
where is the Lorentz factor of relativistic particle, u the particle velocity, the particle mass and the particle electric charge. In this work, we consider the acceleration process resulting from magnetic filed B and its induced electric field , igoring resistivity effects of electric field. Consequently, Equation (9) can be rewritten as
| (10) |
We integrate this equation to trace particle’s trajectories using the 8th order embedded Dormand-Prince method (Hairer et al. 2008) with adaptive time step. Using cubic interpolation with the discontinuity detector, we can obtain the local values of the plasma velocity v and magnetic field B at each step of the integration. In practice, test particles, in the form of a thermal distribution with a temperature of K, are injected into a frozen-in-time 3D MHD domain at a given snapshot. We assume that the speed of light is approximately equal to 20 times greater than the injection velocity and the magnetic field strength is .
4 Simulation Results
On the basis of data cubes from simulations of MHD turbulence (see Table 1) and plasma mode decomposition procedure described above, we in this section provide numerical results for Alfvén, slow and fast modes using test particle methods. These results include the evolution of particle kinetic energy over time, the mean acceleration time of test particles, the power spectrum of maximum acceleration rate and spectral energy distributions, ranging from four turbulence regimes: sub-Alfvénic and subsonic, sub-Alfvénic and supersonic, super-Alfvénic and subsonic, and super-Alfvénic and supersonic.
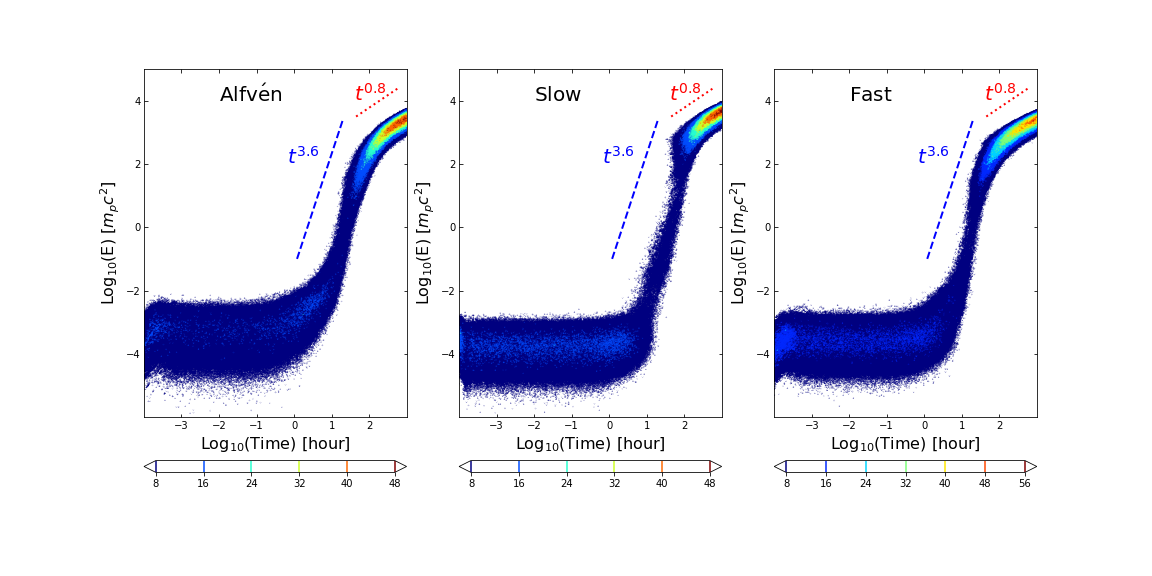
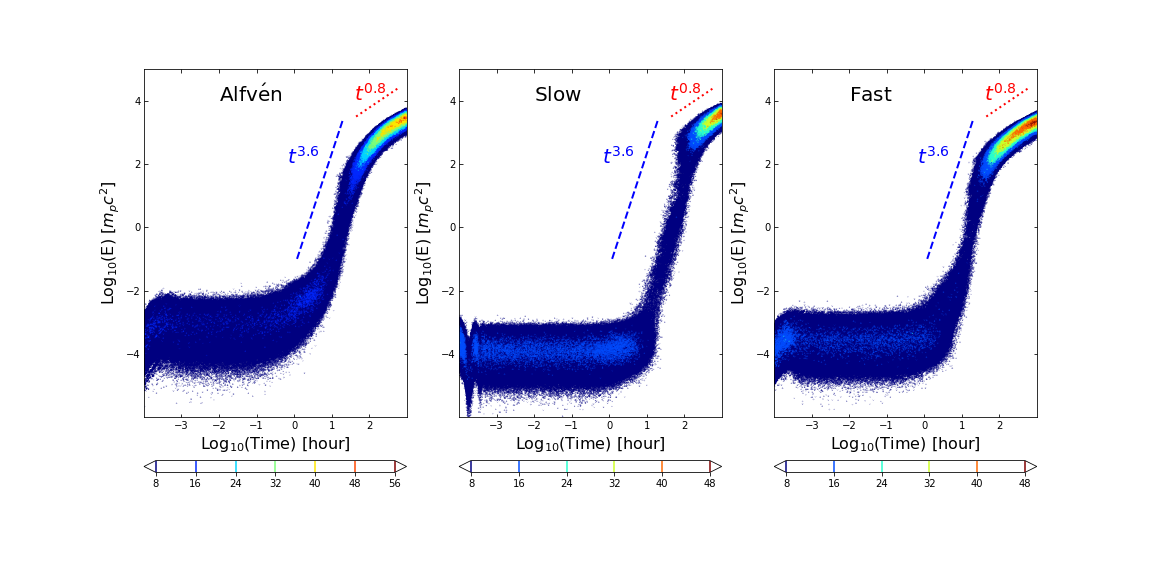
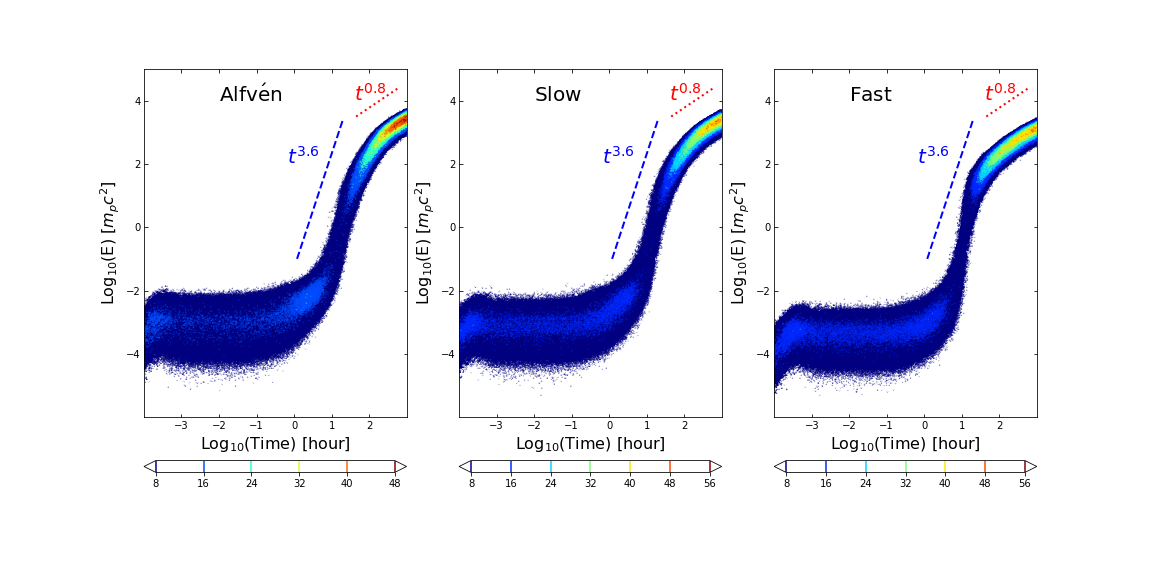
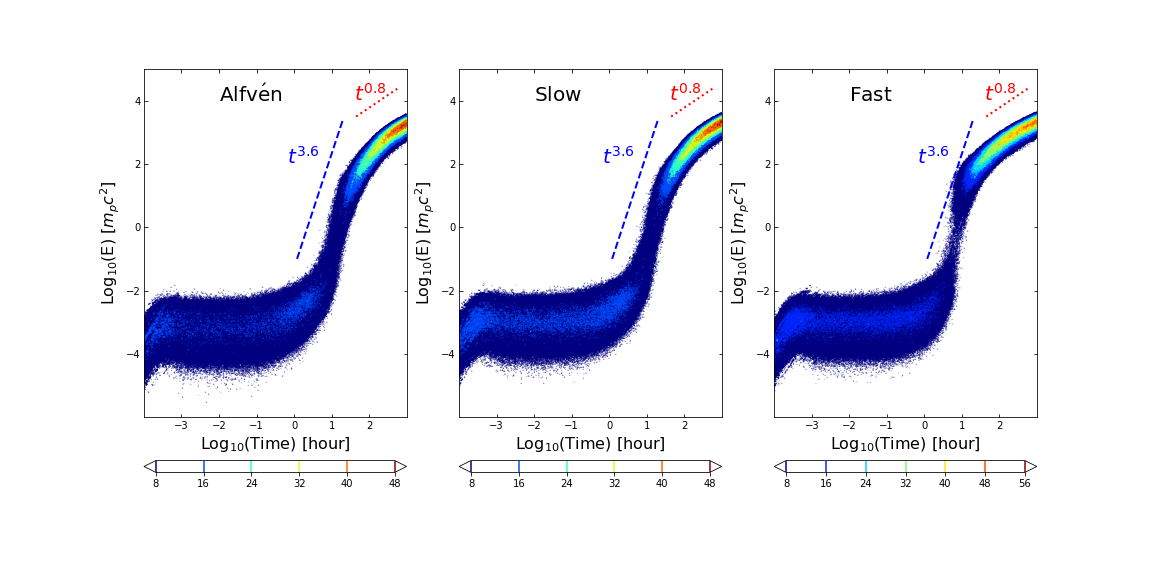
Figures 1 and 2 show kinetic energy distributions of 10, 000 protons injected initially in a thermal distribution over the evolution time for Alfvén, slow and fast modes, in which various turbulence regimes appearing in astrophysics are explored. Compared to contour maps for three modes, we can see the differences of particle distribution between them, as shown in the color bar in four turbulence regimes. The injected particles first undergo a less efficient acceleration process in the range of less than hours, and then accelerate significantly with a relation of . When evolving to the late stage approximately more than hours, the distribution of particle energy begins to change with the relation of . Despite the noticeable change of the number of accelerated particle’s distribution, it statistically follows a similar distribution relationship under various turbulence conditions from to .
The less efficient particle acceleration at the early stage should result from the fact that the gyration radius of the test particles is smaller than the eddy size, resulting in insufficient energy exchange from turbulence to particles. Efficient particle acceleration stage, i.e., , corresponds to full interactions between particles and plasma waves in the inertial range of turbulence. The transition to can be understood as a weak turbulence interaction in the spatial region near the injection scale code units. Specifically, this corresponds to the scale range of as is in sub-Alfvénic turbulence, and in super-Alfvénic turbulence. In general, this result shows that particle acceleration has universal properties under various turbulent conditions. This implies that the mechanism which causes particles to accelerate is a second-order Fermi acceleration process, comparing with a more effective first-order Fermi acceleration in the turbulent reconnection layer with the relation from to (Zhang et al. 2021). Due to the setting of periodic boundary conditions, particles with a gyration radius larger than the box scale will reenter and cause a continuous increase in their kinetic energies, which is similar to a 1.5-order Fermi acceleration in a large-scale turbulence environment around the turbulent reconnection layer (Brunetti & Lazarian 2016; Zhang et al. 2021).
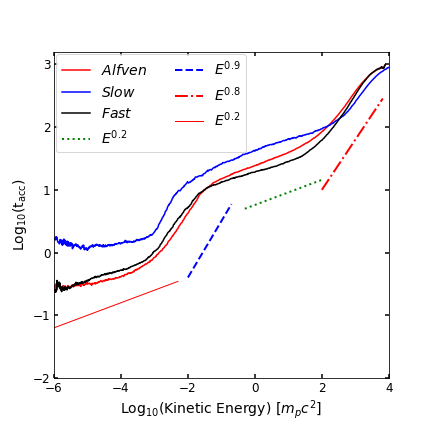
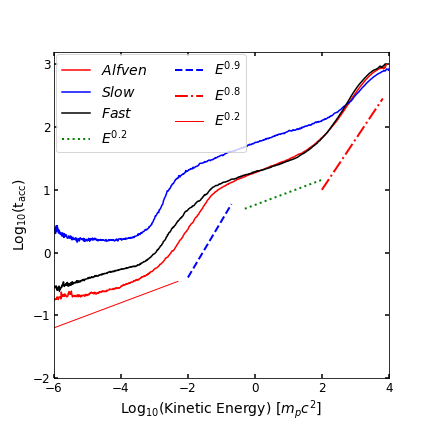
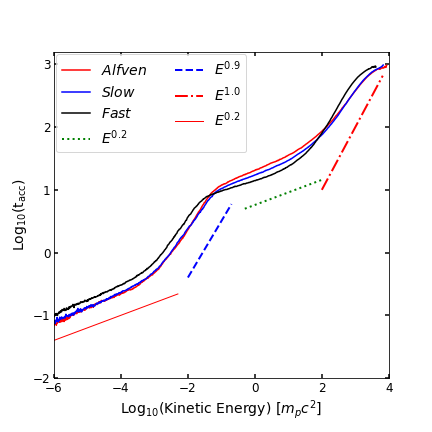
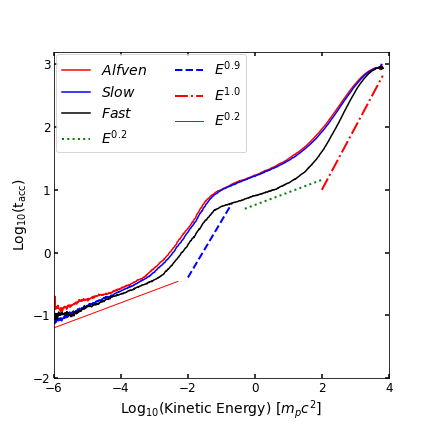
In order to further study the acceleration of particles, we adopt the definition of provided in del Valle et al. (2016), where is the acceleration time of -th particle and is the number of particles in the energy interval from to . The mean acceleration time as a function of kinetic energy is plotted in Figure 3, from which we can see more detailed differences between three modes in various turbulence regimes. As for sub-Alfvénic, subsonic (left upper) and supersonic (right upper) regimes, the acceleration of slow mode takes more time than that of Alfvén and fast modes in low energy range, both of which accelerate similarly. The mean acceleration time for slow mode decreases with increasing kinetic energy in the very low energy range, but then reverses and increases with energy in the high energy range, representing the transition of power-law relations from to then to . Except for the low energy range, it maintains as similar scaling for Alfvén and fast modes as that for slow mode. The lower panels corresponding to super-Alfvénic, subsonic (left lower) and supersonic (right lower) regimes present that fast mode takes less time than Alfvén and slow modes. In particular, there is no remarkable negative correlation between kinetic energy and mean acceleration time in the low energy range. In fact, the power law relationship we find in Figure 3 has a one-to-one correspondence to those in Figures 1 and 2, that is, matches with a flat particle distribution in the range of less than about 5 hours, (plotted in dotted line) with a significantly increasing process of kinetic energy () and with the moderately increasing process at the late stage of evolution ().
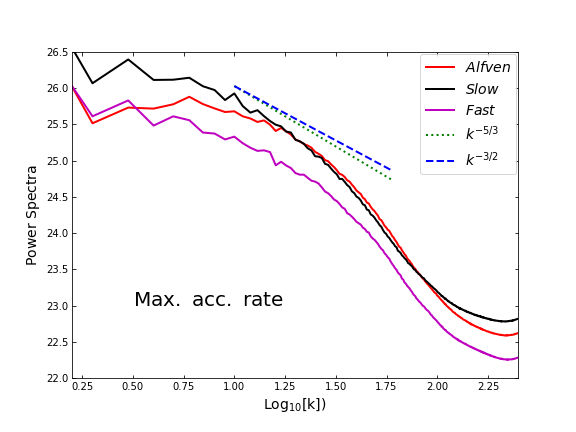
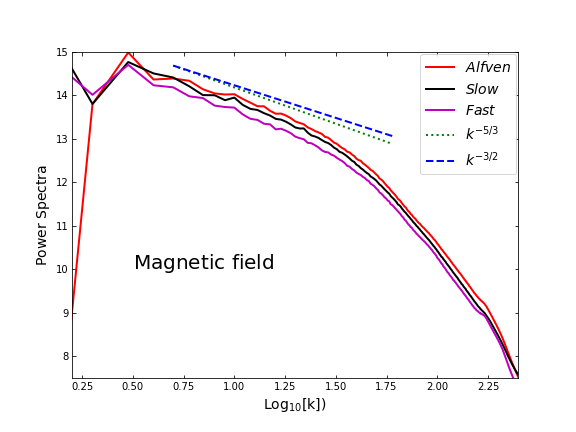
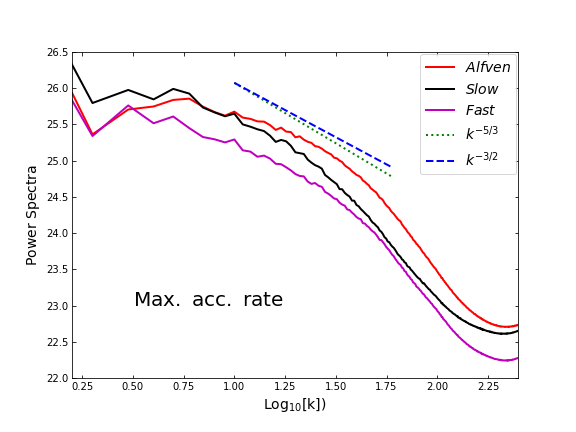
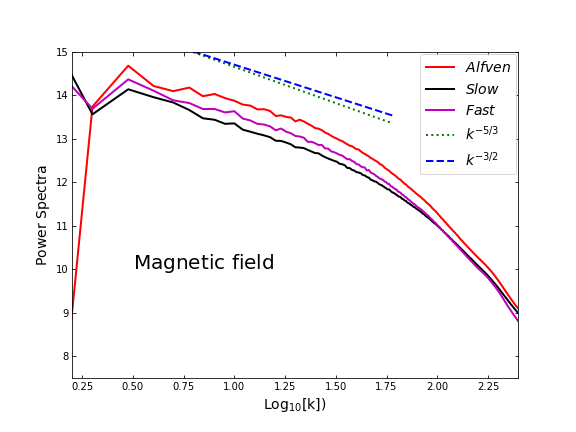
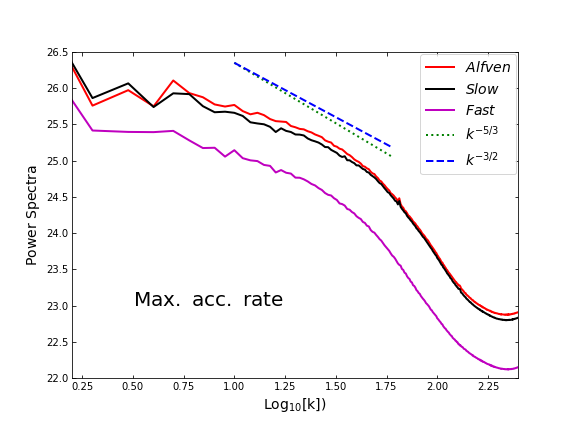
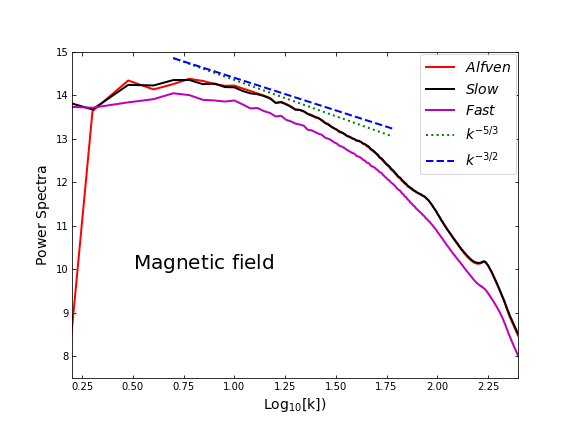
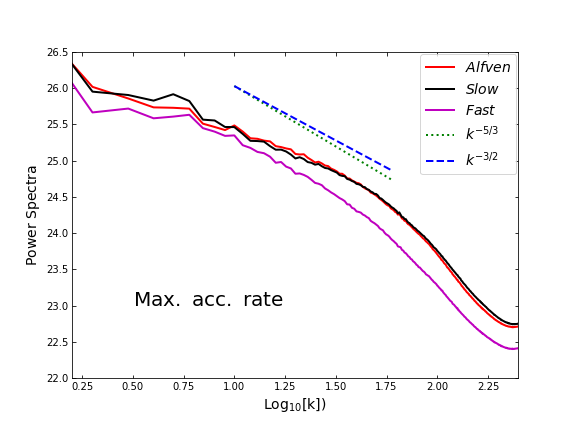
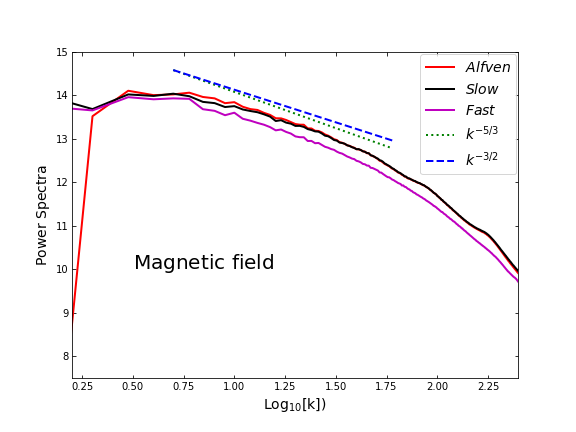
The influence of three modes on the maximum acceleration rate is explored in Figure 4 by analyzing power spectrum, compared to underlying turbulent magnetic fields. The left column of this figure shows power spectra of the maximum acceleration rate of particles, and the right column corresponds to power spectra of the underlying magnetic fields in four turbulence regimes. As shown, the maximum acceleration rates for fast mode present well the scaling of in four turbulence regimes explored, while Alfvén and slow modes indicate approximately the scaling of . Compared to power spectra of magnetic field in the same turbulence regime, we see that there is a more limited inertial range by the maximum acceleration rate, the spectrum of which first becomes steeper at small scales (large wavenumber), then flattens at close dissipation scales. In short, the maximum acceleration rates for three modes reveal the inertial range, the scaling of spectrum and energy exchange dependence from underlying compressible MHD turbulence cascade. Thus, the acceleration efficiency of particles relies on the properties of each mode.
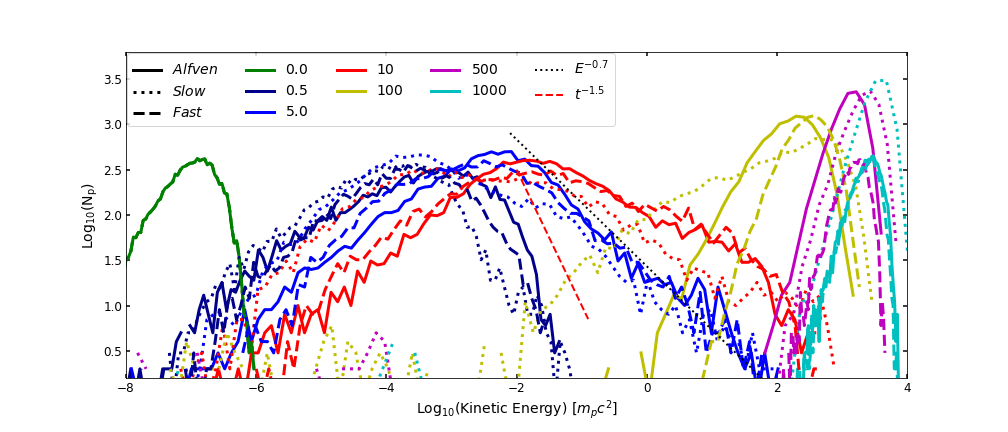
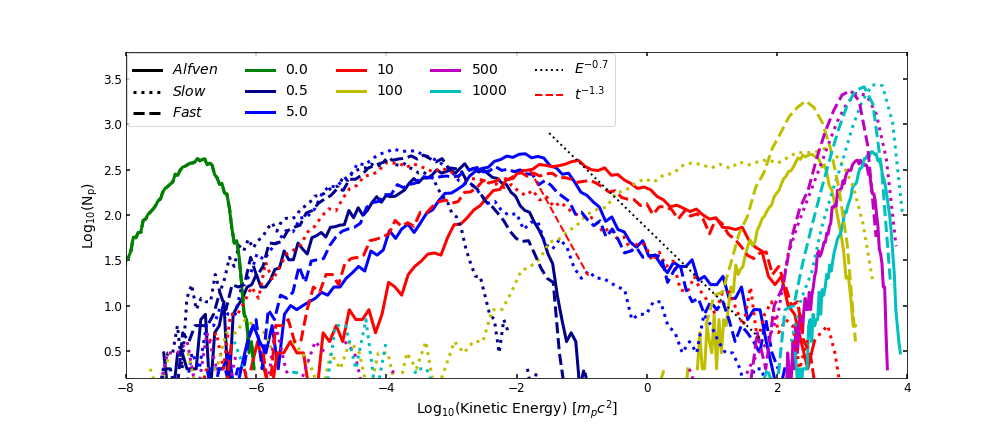
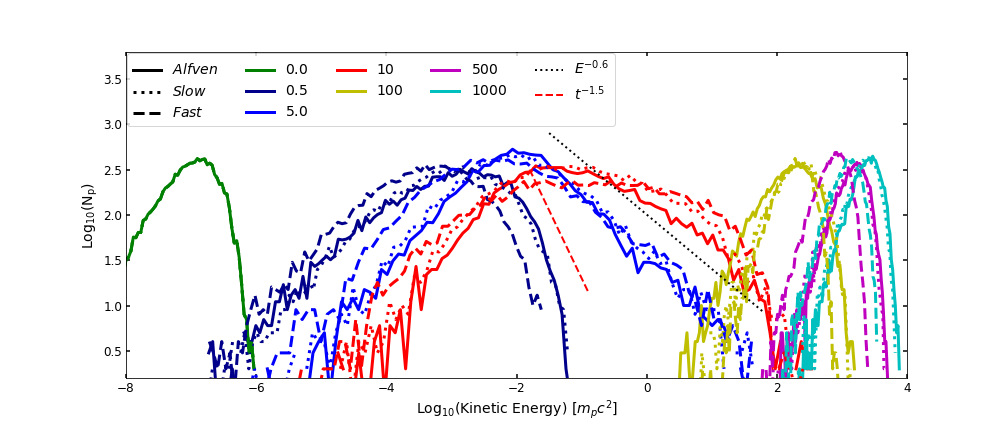
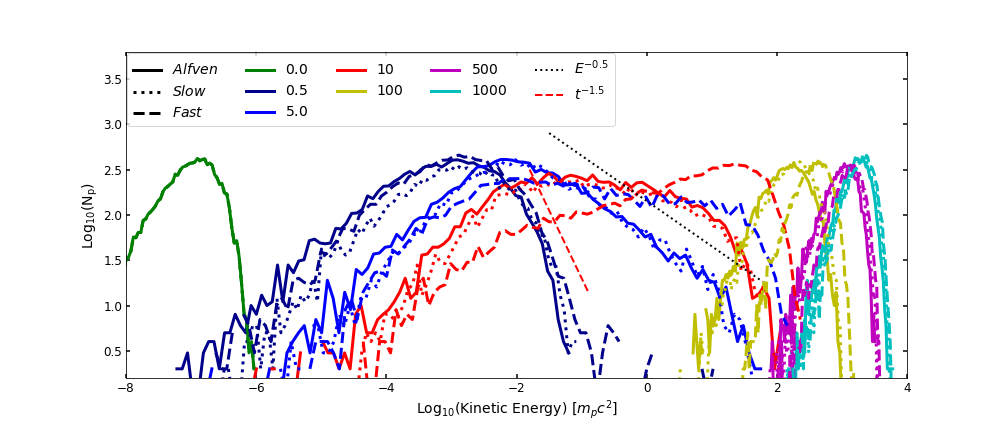
Furthermore, spectral energy distributions of accelerated particles for three modes are plotted in Figure 5 at several snapshots , 0.5, 5.0, 10, 100, 500 and 1000 hours, in which the thick solid lines indicate spectral distributions for Alfvén mode, the thick dotted lines for slow mode, and the thick dashed lines for fast mode. As time evolves, the particle spectra of the thermal distribution broaden and move to high energy wavebands, and form a changing power-law distribution, e.g., with of at the time hours. In the extremely high energy range, the non-thermal spectra present a thermal-like spectral distribution characteristics. In the case of sub-Alfvénic turbulence (upper panel for subsonic, and upper middle panel for supersonic), Alfvén and fast modes dominate the acceleration of particles in the range of less than hours, and then it turns to slow mode dominance. In the case of super-Alfvénic and subsonic turbulence (lower middle panel), we observe the transition of the plasma modes that dominates the acceleration process, that is, at the early stages of evolution ( hour), the dominant acceleration process is Alfvén and slow modes, then fast mode ( hours), and finally Alfvén and slow modes ( hours). In the case of super-Alfvénic and supersonic turbulence (lower panel), we find that fast mode dominates the acceleration of particles throughout the entire process.
In brief, the main features regarding the particle acceleration of three modes are that (1) fast mode plays a major role in accelerating particles in various turbulence regimes we explored; (2) slow mode obviously accelerates particles in the very high energy part in the case of sub-Alfvén turbulence; (3) Alfvén mode mainly contributes in the early stage of evolution.
5 Discussions
In the current work we have considered proton as probe particle and injected the number of 10, 000 protons into a frozen-in-time 3D MHD domain that has reached an evolutionary steady state. Due to the fact that the macroscopic MHD dynamical time is much longer than the evolution time of the test particles, it is a reasonable treatment for considering a single snapshot to accelerate the particles. Similar to most PIC acceleration simulations in the collisionless plasma settings, electron-positron pairs can also be regarded as probe particles in the collisional MHD turbulence environment. However, simulating electron-positron pairs evolution in the case of MHD turbulence will be extremely time-consuming because of their more small mean free path, and explored in future work
We studied the effect of mean magnetic fields on the acceleration process using the structure function analysis of the maximum acceleration rate. We found that the maximum acceleration rate shows an approximate for Alfvén, slow and fast modes along three coordinate axes (not shown in the paper), from the scaling of which we cannot almost distinguish between them. However, we observe that significant changes happen to the amplitude of structure function, which is associated with the possible maximum energy that particle can be reached. In addition, we also studied the relationship between the particle’s maximum acceleration rate and the local magnetic field, but no spatial anisotropy of the maximum acceleration rate was found for three modes. We feel that the lack of anisotropic features may be attributed to the limitation of numerical resolution. As pointed out in Lee et al. (2016), the calculation of the structure function, in particular, the recovering of power law scaling, requires a higher numerical resolution; it needs further high resolution numerical simulation in the future.
We would like to say that the mechanism that induces the particles to accelerate is the same, that is, it is a second-order Fermi process for three modes. It is very interesting that although a shock acceleration process is expected for supersonic turbulence, we did not find significant differences compared with subsonic case (see Figure 1). We think that the particle interacting with a single shock leads to the first-order Fermi acceleration, but the first-order effect is canceled out after particles encountering many shock compressions or expansions, and only the second-order Fermi process results in an increase of particle energy.
From the perspective of numerical practice, the execution of this work consists of three main steps: (1) MHD turbulence simulations to generate data cubes including the information of both magnetic fields and velocities; (2) implementation of wavelet transformation to decompose MHD modes into Alfvén, slow and fast modes, and (3) test particle simulations to study the properties of particle acceleration. The cost of simulation time restricts us to use a numerical resolution of 512 along each dimension of coordinates. Especially in the process of test particle simulation, the time-consuming is strongly dependent on the number of injected particles and the terminal time of simulation evolution. The 10,000 test particles we injected have ensured the reliability of the numerical results, which is an order of magnitude higher than the earlier simulation of 1,000 particles (Xu & Yan 2013). As shown in Figure 4, the inertial range of the MHD turbulence cascade revealed from the particle’s maximum acceleration rate is narrower than that displayed by the underlying magnetic field (or velocity). Nevertheless, the execution of higher numerical simulations is necessary to confirm our research results.
This work did not include the effect of radiative losses, such as synchrotron emission and inverse Compton scattering, on the particle acceleration. Although the radiative loss is almost negligible for the proton considered as a probe particle in this paper, the loss effect should be included anyway in the some astrophysical environments dominated by hadrons. The radiative loss taken into account, the spectral energy distributions predicted by the current work might vary in the very high-energy regime. Related testing and verification are welcome.
6 Summary
Considering four turbulence regimes that could appear in the realistic astrophysical settings, we have performed the study of particle acceleration in compressible MHD turbulence using the test particle method. The main results that we found are summarized as follows:
-
1.
The acceleration of particles caused by Alfvén, slow and fast modes is a second-order Fermi process in four turbulence regimes explored in this paper. The transition of particle distributions, from to in the acceleration process, is related to the injection scale of turbulence, or, to put it another way, it is related to the strong or weak turbulence regimes.
-
2.
The power spectrum of the particle’s maximum acceleration efficiency directly reflects the inertial range of MHD turbulence cascade, and recovers the scaling relations of Alfvén, slow and fast modes. In contrast to the inertial scale range revealed by the underlying magnetic fields, the power spectrum of maximum acceleration rate provides a narrower inertial range. Our studies indeed demonstrated that fast mode shows an ideal scaling of as expected, and Alfvén and slow modes can also recover approximately the scaling of .
-
3.
Spectral energy distributions of the accelerated particles for three modes first present a power law form in the low energy range, and then transfers into thermal-like spectrum in the high energy range.
-
4.
Fast mode dominates the acceleration of particles during the most evolution time, especially in the subsonic turbulence. In the case of sub-Alfvén turbulence, slow mode dominates the particle acceleration in the very high energy range. Different from the earlier theoretical predictions, the contribution of Alfvén mode cannot be ignored, which even plays a dominant role in the particle acceleration at the very early stage of evolution.
References
- Alfvén (1942) Alfvén, H. 1942, Natur, 150, 405
- Bell (1978) Bell, A. R. 1978, MNRAS, 182, 147
- Beresnyak & Li (2016) Beresnyak, A., & Li, H. 2016, ApJ, 819, 90
- Beresnyak (2019) Beresnyak, A. 2019, LRCA, 5, 2B
- Beresnyak & Lazarian (2019) Beresnyak, A., & Lazarian, A. 2019, Turbulence in Magnetohydrodynamics. Springer, Berlin
- Berezhko & Völk (2007) Berezhko, E. G. & Völk, H. J. 2007, ApJL, 661, L175
- Blandford & Ostriker (1978) Blandford, R. D., & Ostriker, J. P. 1978, ApJL, 221, L29
- Brunetti & Lazarian (2016) Brunetti, G., & Lazarian, A. 2016, MNRAS, 458, 2584
- Chandran (2003) Chandran, B. 2003, ApJ, 599, 1426
- Cho & Lazarian (2006) Cho, J., & Lazarian, A. 2006, ApJ, 638, 811
- Cho & Lazarian (2002) Cho, J., & Lazarian, A. 2002, Phys. Rev. Lett., 88, 245001
- Cho & Lazarian (2003) Cho, J., & Lazarian, A. 2003, MNRAS, 345, 325
- de Gouveia Dal Pino & Lazarian (2005) de Gouveia Dal Pino, E. M. & Lazarian, A. 2005, A&A, 441, 845
- del Valle et al. (2016) del Valle, M. V., de Gouveia Dal Pino, E. M., & Kowal, G. 2016, MNRAS, 463, 4331
- Drury et al. (1999) Drury, L. O., Duffy, P., Eichler, D., et al.1999, A&A, 347, 370
- Drury (2012) Drury, L. O. 2012, MNRAS, 422, 2474
- Drake et al. (2006) Drake, J. F., Swisdak, M., Schoeffler, K. M., Rogers, B. N., & Kobayashi, S. 2006, Geophys. Res. Lett., 33, 13105
- Fan et al. (2010) Fan, Z., Liu, S. & Fryer, C. L. 2010, MNRAS, 406, 1337
- Fermi (1949) Fermi, E. 1949, Physical Review, 75, 1169
- Goldreich & Sridhar (1995) Goldreich, P., & Sridhar, S. 1995, ApJ, 438, 763
- Hairer et al. (2008) Hairer, E., Nørsett, S., & Wanner, G. 2008, Springer Series in Computational Mathematics (Springer Berlin Heidelberg)
- Kandel et al. (2016) Kandel, D., Lazarian, A., & Pogosyan, D. 2016, MNRAS, 461, 1227
- Kandel et al. (2017) Kandel, D., Lazarian, A., & Pogosyan, D. 2017, MNRAS, 464, 3617
- Kang et al. (2006) Kang, H. & Jones, T. W. 2006, Astroparticle Physics, 25, 246
- Kang et al. (2009) Kang, H., Ryu, D., & Jones, T. W. 2009, ApJ, 695, 1273
- Kowal et al. (2011) Kowal, G., de Gouveia Dal Pino, E. M., & Lazarian, A. 2011, ApJ, 735, 102
- Kowal et al. (2012) Kowal, G., de Gouveia Dal Pino, E. M., & Lazarian, A. 2012, Phys. Rev. Lett., 108, 241102
- Kowal & Lazarian (2010) Kowal, G., & Lazarian, A. 2010, ApJ, 720, 742
- Lee et al. (2016) Lee, H., Lazarian, A., & Cho, J. 2016, ApJ, 831, 77
- Lazarian et al. (2015) Lazarian, A., & Eyink, G., Vishniac, E., & Kowal, G. 2015, RSPTA, 37340144L
- Lazarian & Vishniac (1999) Lazarian, A., & Vishniac, E. T. 1999, ApJ, 517, 700 (LV99)
- Lazarian & Xu (2021) Lazarian, A., & Xu, S. 2021, ApJ, arXiv:2106.08362v1
- Lazarian (2006) Lazarian A. 2006, ApJL, 645, L25
- Lazarian & Pogosyan (2012) Lazarian, A., & Pogosyan, D. 2012, 747, 5
- Lazarian et al. (2020) Lazarian, A., Eyink, G. L., Jafari, A., Kowal, G., Li, H., Xu, S., & Vishniac, E. T. 2020, PhPl, 27, 012305
- Lithwick & Goldreich (2001) Lithwick, Y., & Goldreich, P. 2001, ApJ, 562, 279
- Longair et al. (2011) Longair, M. S. 2011, High Energy Astrophysics
- Maiti et al. (2021) Maiti, S., Makwana, K., Zhang, H., & Yan, H. 2021, arXiv:2108.01936
- Petrosian & Bykov (2008) Petrosian, V. & Bykov, A. M. 2008, SSRv, 134, 207P
- Wang et al. (2020) Wang, R. Y., Zhang, J. F., & Xiang, F. Y. 2020, ApJ, 890, 70
- Xu & Yan (2013) Xu, S., & Yan, H. 2013, ApJ, 779, 140,
- Xu & Yan (2018) Xu, S., & Lazarian, A. 2018, ApJ, 868, 36,
- Yan & Lazarian (2002) Yan, H., & Lazarian, A. 2002, Phys. Rev. Lett., 89, 281102
- Yan & Lazarian (2004) Yan, H., & Lazarian, A. 2004, ApJ, 614, 757
- Yan et al. (2008) Yan, H., Lazarian, A., & Petrosian, A. 2008, ApJ, 684, 1461
- Zhang et al. (2021) Zhang, J. F., Kowal, G., & Lazarian, A. 2021, to be submitted
- Zhang et al. (2016) Zhang, J. F., Lazarian, A., Lee, H., & Cho, J. 2016, ApJ, 825, 154
- Zhang et al. (2018) Zhang, J. F., Lazarian, A., & Xiang, F. Y. 2018, ApJ, 863, 197
- Zhang et al. (2018b) Zhang, J. F., Li, Z. R., Xiang, F. Y., & Lu, J. F. 2018b, MNRAS, 473, 3211
- Zhang et al. (2020) Zhang, J. F., He, K., Cho, J., & Lazarian, A. 2020, ApJ, 895, 20