Active Learning for Argument Strength Estimation
Abstract
High-quality arguments are an essential part of decision-making. Automatically predicting the quality of an argument is a complex task that recently got much attention in argument mining. However, the annotation effort for this task is exceptionally high. Therefore, we test uncertainty-based active learning (AL) methods on two popular argument-strength data sets to estimate whether sample-efficient learning can be enabled. Our extensive empirical evaluation shows that uncertainty-based acquisition functions can not surpass the accuracy reached with the random acquisition on these data sets.
1 Introduction
Argumentative quality plays a significant role in different domains of social activity where information and idea exchange are essential, such as the public domain and the scientific world. Theoretical discussions about what constitutes a good argument can be traced back to the ancient Greeks Smith (2020). Researchers nowadays continue exploring this topic, trying out approaches that employ empirical machine learning estimation techniques Simpson and Gurevych (2018).
One of the most expensive and time-consuming tasks for machine learning-driven argument strength prediction is data labeling. Here, the result is highly dependent on the quality of labels, while the annotation task demands cognitive and reasoning abilities. One way to guarantee good annotations is to perform labeling with schooled experts, raising project costs extensively. For this reason, a common approach involves employing crowd workers. As argument strength detection is a highly subjective task, crowd workers’ labeling results are often identified by low reliability and prompt researchers to counter-check the results with more crowd workers and as specifically developed agreement-based techniques. Sometimes a threshold for agreement cannot be reached at all, which might lead to data loss (see e.g. Habernal and Gurevych (2016a); Toledo et al. (2019).
This motivates us to investigate the applicability of some existing methods for reducing the amount of training data for automatic argument strength prediction. To this end, we look closely at the technique of active learning (AL). In this paper, we evaluate standard uncertainty-based acquisition functions for the argument strength prediction. We perform several experiments for the task of binary argument-pair classification (see Table 1) with several uncertainty-based data selection rounds. Our findings show that uncertainty-based AL techniques do not provide any advantages compared to random selection strategies. The cold-start problem and unreliable nature of annotations concerning argument strength might constitute the reasons for the failure of these techniques.
| Argument 1 | Argument 2 |
| School uniforms are a BAD idea. I’m to lazy to explain it but trust me, I wore them 4 years. | School uniform cant save person out of cold or heat like special clothes. It is not comfortable when you sit for an hours in a classroom. |
2 Related Work
2.1 Argument Quality Estimation
In general, there is no agreement on how to operationalize argumentation quality Toledo et al. (2019); Wachsmuth et al. (2017); Simpson and Gurevych (2018); Persing and Ng (2015); Lauscher et al. (2020). In some studies, argument strength is regarded in its persuasiveness and quantified as the proportion of people persuaded by the given argument Habernal and Gurevych (2016b); Persing and Ng (2015); Toledo et al. (2019). Persuasiveness makes argument strength easy to operationalize and serves as a way of dealing with the unclear nature of the concept by approximating its meaning through relying on the majority’s wisdom. This approach lies at the center of the crowd-sourcing data labeling efforts and is the most common approach undertaken in existing data sets. This limits the reliability of the labels attained in such a manner, though, due to the highly subjective nature of such labels.
2.2 Active Learning
Active learning is defined as a machine learning technique designed to assist in annotating unlabelled data sets by automatically selecting the most informative examples, which are subsequently labeled by human experts (the so-called oracles) Hu (2011); Cohn et al. (1996). A popular approach to estimating the informativeness of single data points involves quantifying model uncertainty from a sample of stochastic forward passes for a given data point. Common techniques such as entropy, mutual information, or variation ratios (see Appendix A.1 for more details) reportedly help reach good results on a range of tasks on high-dimensional data, e.g., in Computer Vision or Natural Language Processing Gal et al. (2017); Siddhant and Lipton (2018); Hu (2011). The assumption behind this is that in this way, data points which are closest to the decision boundary can be selected, helping to fine-tune the line dividing the classes most efficiently.
So far, AL in argument mining has received little attention. In the work of Ein-Dor et al. (2020), the authors propose an Iterative Retrospective Learning (IRL) variant for the argument mining task. Their approach, however, is focused on solving the class imbalance problem between arguments and non-arguments and is precision- rather than accuracy-oriented as AL is. Another approach is suggested by Simpson and Gurevych (2018). They apply the Gaussian process preference learning (GPPL) method for performing AL for estimating argument convincingness, which the authors expect to be helpful against the cold-start problem.
3 Data Set
For our analysis, we use two publicly available data sets suitable for the task of pairwise argument strength prediction:
Because supporting and opposing arguments often share the same vocabulary and semantics, we do not treat each stance within a given topic as a separate topic, contrary to the authors of the two data sets. Instead, we combine the "for" and "against" arguments within the same topic under the same topic index and, thus, avoid leakage of semantic information between train and test data split. This preprocessing makes the performance of our models not directly comparable with the performance from the original papers. However, reproducibility of the original papers’ results is beyond the scope of this work, as our focus lies on testing AL acquisition functions instead of reaching higher performance with our models.
Due to the high computational costs of the AL process, we decide to select the three most representative topics from each data set. One way to reach high representativeness would be to select topics that are average in difficulty. Since we try to approximate a real-world setting where the labels are unknown, it is not clear at the beginning which topics are more challenging to learn than the others. For this reason, we decide to select our test topics according to their size. Thus, we cross-validate our models on each data set’s smallest topic, the largest one, and the median-sized one. Thus, the topics we select according to this procedure are topics 10 ("Is the school uniform a good or bad idea?"), 13 ("TV is better than books") and 14 ("Personal pursuit or advancing the common good?") in UKPConvArg1Strict and topics 3 ("Does social media bring more harm than good?"), 4 ("Should we adopt cryptocurrency?") and 7 ("Should we ban fossil fuels?") in IBM-9.1kPairs data.
4 Experimental Setting
4.1 Research Design
This study aims to test the hypothesis that uncertainty-based data acquisition strategies can help to achieve a better model performance than a mere random selection of the data for argument strength estimation. We test this by comparing different data selection strategies against random data selection, serving as a baseline.
We test our acquisition strategies on a task of pairwise (relative) argument strength comparison, constructed as a binary classification task, for which we use the UKPConvArg1Strict Habernal and Gurevych (2016b) and IBM-9.1kPairs Toledo et al. (2019) data sets. The code to our experiments is publicly available.111https://github.com/nkees/active-learning-argument-strength
In order to employ uncertainty-based acquisition functions, we need to measure model uncertainty at prediction time. This is possible either by using Bayesian methods or by approximating their effect via obtaining distributions for output predictions by some other means. Based on the ground work layed out by Gal and Ghahramani (2016), who show that dropout training in deep neural networks help approximate Bayesian inference in deep Gaussian processes, we design our experiments as MC dropout. With this, we simulate several stochastic forward passes through the model at prediction time and sample repeatedly from softmax outputs to obtain prediction distributions.
4.2 Method and Procedure
Similar to the procedure stipulated by Toledo et al. (2019), we fine-tune the pre-trained BERT-Base Uncased English Devlin et al. (2018) for the task of binary argument-pair classification by adding a single classification layer on top. The BERT architecture includes dropout layers with a probability of 0.1 Devlin et al. (2018). We keep it this way, which allows us to approximate model uncertainty as described above and test the uncertainty-based acquisition functions on the fine-tuned BERT-based. To do that, we enable dropout at inference time.
In order to estimate topic difficulty and validate our topic selection procedure described above, we train and test the models on all available labels of both data sets separately with the method of -fold cross-validation, where stands for the respective number of topics in a given data set. We separate every topic and use it as test data, with model training performed on the rest of the data, which helps to isolate the topics and measure their respective difficulty.
Our active learning experiments are conducted in a setting of a -fold cross-validation, with 3 indicating the number of most representative topics selected by us from the given data sets, as mentioned in Section 3. Thus, in each fold in our experiments, we test on one of the three selected topics for each data set (holdout data) and train on the rest of the compete data set (train-dev).
The train-dev data in each fold consists of random splits into train (85%) and validation (15%) data, whereas the validation, or development, data are used for measuring the goodness of fit of the model trained on the training data. Having separated and fixed the validation data, a batch of 130 argument pairs is selected randomly from the train split. These data are used as initial training data on which bert-base-uncased is fine-tuned according to our classification task.
Model evaluation is performed via accuracy measurement. Training on each of the three folds per data set is conducted ten times for improved reliability of the results. Thus, for each fold, we produce ten validation splits and ten initial training data batches to add some randomness into the experiments but in a controlled manner. They are kept fixed for every training fold to control for the effect of random initial data selection and enable a reliable comparison between the acquisition functions.
We add another 130 argument pairs in each learning round and re-train the fine-tuned model. Within this setting, the whole data set would be selected within approx. 55 iterations for IBM-9.1kPairs data and approx. 72 iterations for UKPConvArg1Strict data (when calculated with the median-sized test split size). In an attempt to minimize the burden associated with heavy training, we decide to limit each active learning process to (less than) a half iterations, stopping at the \nth27 iteration.
4.3 Acquisition Functions
We perform AL on three uncertainty-based acquisition functions one by one. In particular, we compare the performance of variation ratios, entropy, and BALD Houlsby et al. (2011); Gal et al. (2017) against a random acquisition baseline. For each of the learning rounds, we acquire data based on the heuristics calculated over a sample of 20 stochastic forward pass outputs. Our expectation is that other measures will outperform the random acquisition.
5 Results
For the estimation of the performance of the models trained on the whole data with k-fold cross-validation, we reach a comparable performance of our BERT-based binary classification technique on both of the data sets (average accuracy on UKPConvArg1Strict: 0.76, on IBM-9.1kPairs: 0.77). This is a slightly worse performance than Toledo et al. (2019) achieves with the same architecture; the reason could be attributed to a different topic attribution strategy, as well as to some differences in the used hardware or hyperparameters, such as batch size or the number of epochs.
We find that the topics selected by us from the UKPConvArg1Strict stand rather on the low end of difficulty, with model accuracy tending towards the upper end of the scale when validated on these topics: all of them are higher than the mean performance of 0.76 (see Appendix A.3 for more details). However, from the distribution point of view, two of the topics, namely 10 and 13, yield median model performance, making them, in our opinion, suitable representatives of the whole data.
As for the IBM-9.1kPairs data set, our selected topics produce on average comparable performance with the model performance on the whole topic set (accuracy of 0.776 vs. 0.77 respectively). They also represent the most difficult topic, the easiest topic, and one closely neighboring the median topic (accuracy of 0.78 being slightly higher than the median performance of 0.77). In this case, the selected topics provide a better representation of the whole data set and grant strong validity when it comes to generalizing the results of our experiments.
The series of experiments we conducted in order to test whether our proposed heuristics for AL data acquisition provide us with any significant improvement surprisingly do not reveal any heuristic which would perform better than in the case of a random acquisition. This is true both for UKPConvArg1Strict and IBM-9.1kPairs data; a detailed overview is presented in Tables 2 and 3. Statistical significance of the results has been tested with a Wilcoxon signed-rank test, which provides a non-parametric alternative to the paired T-test and is more suitable due to the non-Gaussian distribution of the differences in the results.
| Heuristic | Mean | Variat. | Avg.Diff. |
|---|---|---|---|
| random (b.) | 0.747 | 0.0881 | - |
| entropy | 0.7388 | 0.0925 | -0.0082 |
| variation ratios | 0.7368 | 0.0922 | -0.0103 |
| bald | 0.7377 | 0.0928 | -0.0093 |
All heuristics result in performance that is lower than that of the random baseline. All of our results are statistically significant with p-values .
| Heuristic | Mean | Variat. | Avg.Diff. |
|---|---|---|---|
| random (b.) | 0.7491 | 0.0855 | - |
| entropy | 0.7414 | 0.0878 | -0.0077 |
| variation ratios | 0.7377 | 0.0923 | -0.0114 |
| bald | 0.7412 | 0.0882 | -0.0079 |
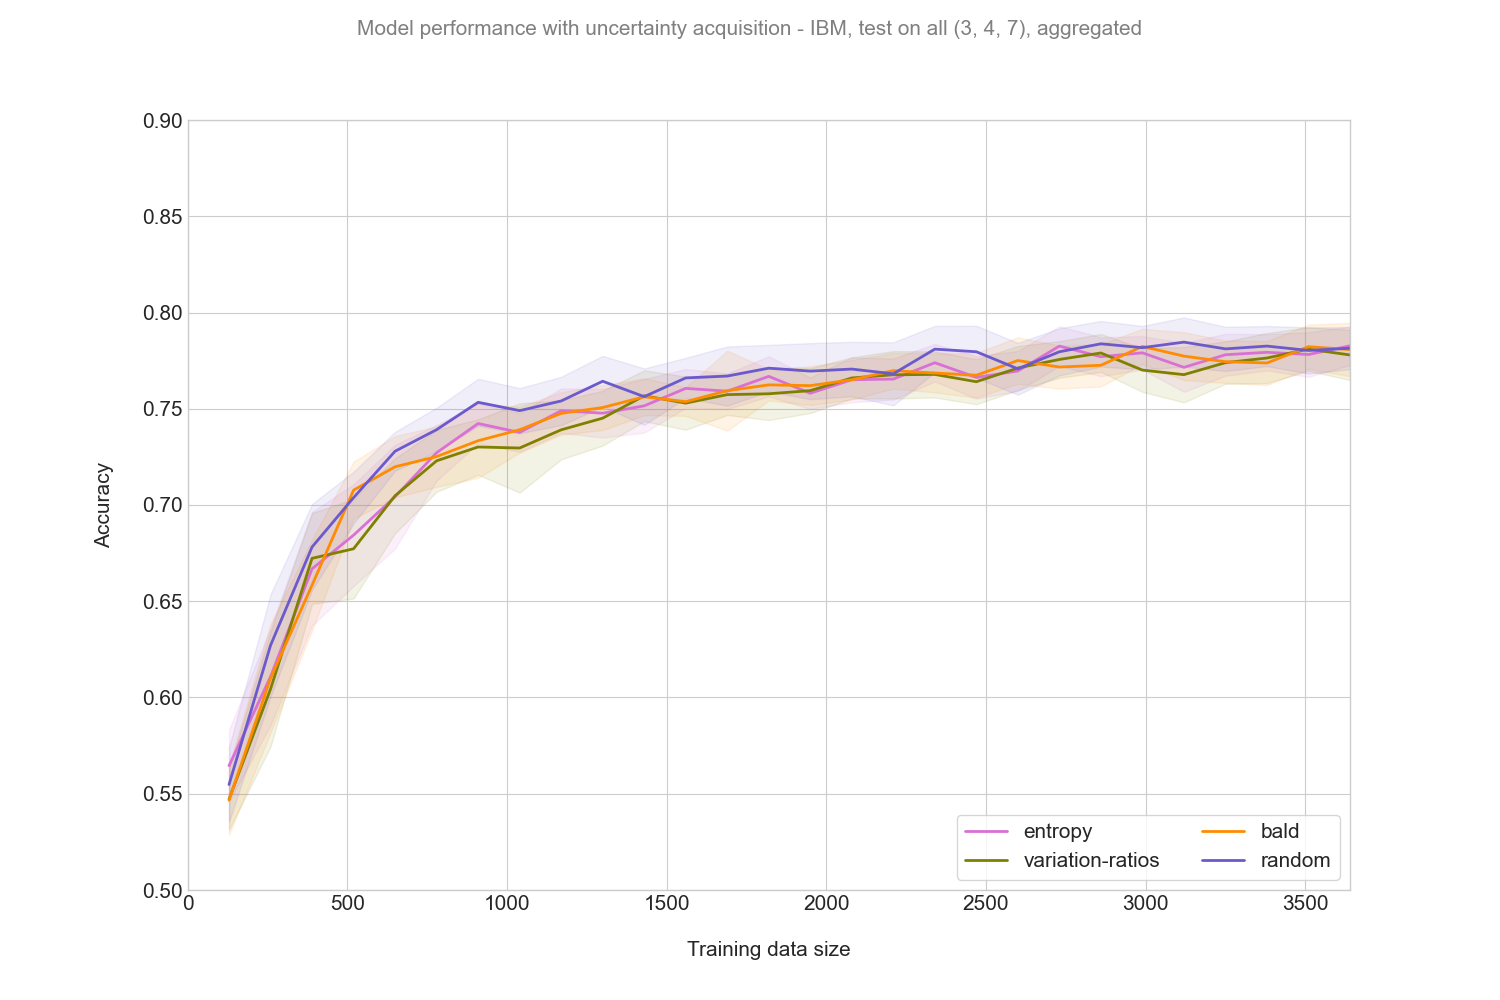
Despite the fact that random acquisition turns out to be the best one in terms of performance, with our results being consistent through both data sets and the difference being statistically significant, it is still noticeable that the differences in each case are rather small (see Figures 1 and 2 for graphic visualization of the model performance during active learning rounds comparing the acquisition functions).
6 Discussion
The results of our experiments do not point to any acquisition functions which outperform random acquisition. This finding does not exclude the possible existence of some other suitable acquisition functions, even from the same class (such as uncertainty-based). This remains an open question and should be considered in further research on the topic. For the time being, the random acquisition should be considered the approach of choice when selecting data for labeling for the task of pairwise argument strength prediction. This is sensible both from an accuracy standpoint as well as due to the computational cheapness of a random process.
As the literature suggests, a possible reason why uncertainty-based methods perform so unimpressively is their proneness to picking outliers – a disadvantage that some other methods, such as diversity-based acquisition (e.g., Sener and Savarese (2018), do not have. This might be especially critical in the realm of argument strength prediction, as outliers might represent the arguments where relative argument strength difference is marginal, the data are noisy, or where the provided labeling is too subjective. Another critical factor is the cold-start problem, i.e., overfitting on the small initial data set of data, for which no initial informativeness estimation could be performed. This poses a drawback for the uncertainty-based methods, relying on the initial data sample for subsequent data acquisition.
7 Conclusion
This paper evaluates the effect of uncertainty-based acquisition functions, such as variation ratios, entropy, and BALD, on the model performance in the realm of argument strength prediction. As no acquisition function tested helps improve model performance in comparison to the random acquisition, we have not found any justification for using uncertainty-based active learning for pairwise argument strength estimation.
8 Acknowledgments
This work has been funded by the German Federal Ministry of Education and Research (BMBF) under Grant No. 01IS18036A and by the Deutsche Forschungsgemeinschaft (DFG) within the project Relational Machine Learning for Argument Validation (ReMLAV), Grant Number SE 1039/10-1, as part of the Priority Program "Robust Argumentation Machines (RATIO)" (SPP-1999). The authors of this work take full responsibility for its content.
References
- Cohn et al. (1996) David A. Cohn, Zoubin Ghahramani, and Michael I. Jordan. 1996. Active learning with statistical models. CoRR, cs.AI/9603104.
- Devlin et al. (2018) Jacob Devlin, Ming-Wei Chang, Kenton Lee, and Kristina Toutanova. 2018. BERT: pre-training of deep bidirectional transformers for language understanding. CoRR, abs/1810.04805.
- Ein-Dor et al. (2020) Liat Ein-Dor, Eyal Shnarch, Lena Dankin, Alon Halfon, Benjamin Sznajder, Ariel Gera, Carlos Alzate, Martin Gleize, Leshem Choshen, Yufang Hou, Yonatan Bilu, Ranit Aharonov, and Noam Slonim. 2020. Corpus wide argument mining—a working solution. Proceedings of the AAAI Conference on Artificial Intelligence, 34(05):7683–7691.
- Gal (2016) Yarin Gal. 2016. Uncertainty in Deep Learning. Ph.D. thesis, University of Cambridge.
- Gal and Ghahramani (2016) Yarin Gal and Zoubin Ghahramani. 2016. Dropout as a bayesian approximation: Representing model uncertainty in deep learning. In Proceedings of The 33rd International Conference on Machine Learning, volume 48 of Proceedings of Machine Learning Research, pages 1050–1059, New York, New York, USA. PMLR.
- Gal et al. (2017) Yarin Gal, Riashat Islam, and Zoubin Ghahramani. 2017. Deep bayesian active learning with image data. CoRR, abs/1703.02910.
- Habernal and Gurevych (2016a) Ivan Habernal and Iryna Gurevych. 2016a. What makes a convincing argument? empirical analysis and detecting attributes of convincingness in web argumentation. In Proceedings of the 2016 Conference on Empirical Methods in Natural Language Processing, pages 1214–1223, Austin, Texas. Association for Computational Linguistics.
- Habernal and Gurevych (2016b) Ivan Habernal and Iryna Gurevych. 2016b. Which argument is more convincing? analyzing and predicting convincingness of web arguments using bidirectional LSTM. In Proceedings of the 54th Annual Meeting of the Association for Computational Linguistics (Volume 1: Long Papers), pages 1589–1599, Berlin, Germany. Association for Computational Linguistics.
- Houlsby et al. (2011) Neil Houlsby, Ferenc Huszár, Zoubin Ghahramani, and Máté Lengyel. 2011. Bayesian active learning for classification and preference learning.
- Hu (2011) Rong Hu. 2011. Active Learning for Text Classification. Doctoral Thesis, Technological University Dublin.
- Lauscher et al. (2020) Anne Lauscher, Lily Ng, Courtney Napoles, and Joel Tetreault. 2020. Rhetoric, logic, and dialectic: Advancing theory-based argument quality assessment in natural language processing.
- Persing and Ng (2015) Isaac Persing and Vincent Ng. 2015. Modeling argument strength in student essays. In Proceedings of the 53rd Annual Meeting of the Association for Computational Linguistics and the 7th International Joint Conference on Natural Language Processing (Volume 1: Long Papers), pages 543–552.
- Sener and Savarese (2018) Ozan Sener and Silvio Savarese. 2018. Active learning for convolutional neural networks: A core-set approach. In International Conference on Learning Representations.
- Siddhant and Lipton (2018) Aditya Siddhant and Zachary C. Lipton. 2018. Deep bayesian active learning for natural language processing: Results of a large-scale empirical study. CoRR, abs/1808.05697.
- Simpson and Gurevych (2018) Edwin Simpson and Iryna Gurevych. 2018. Finding convincing arguments using scalable Bayesian preference learning. Transactions of the Association for Computational Linguistics, 6:357–371.
- Smith (2020) Robin Smith. 2020. Aristotle’s Logic. In Edward N. Zalta, editor, The Stanford Encyclopedia of Philosophy, Fall 2020 edition. Metaphysics Research Lab, Stanford University.
- Toledo et al. (2019) Assaf Toledo, Shai Gretz, Edo Cohen-Karlik, Roni Friedman, Elad Venezian, Dan Lahav, Michal Jacovi, Ranit Aharonov, and Noam Slonim. 2019. Automatic argument quality assessment – new datasets and methods.
- Wachsmuth et al. (2017) Henning Wachsmuth, Nona Naderi, Yufang Hou, Yonatan Bilu, Vinodkumar Prabhakaran, Tim Alberdingk Thijm, Graeme Hirst, and Benno Stein. 2017. Computational argumentation quality assessment in natural language. In Proceedings of the 15th Conference of the European Chapter of the Association for Computational Linguistics: Volume 1, Long Papers, pages 176–187, Valencia, Spain. Association for Computational Linguistics.
Appendix A Appendix
A.1 Uncertainty-based Acquisition Functions
In our work, we refer in particular to the following uncertainty-based acquisition functions Gal et al. (2017):
-
•
variation ratios: given a set of labels from stochastic forward passes, variation ratio for a given input point is calculated as:
(1) with denoting the number of times the most commonly occurring category (mode of the distribution) has been sampled. This serves as an indication of how concentrated the predictions are, with 0.5 being the highest dispersion, i.e. uncertainty, and 0 being the highest concentration (certainty) in the case of binary classification.
-
•
predictive entropy: stems from information theory and is calculated by averaging the softmax values for each class :
(2) where stands for average probability of a data point adhering to a specific class given the outputs of the stochastic forward passes and the training data. denotes the label class, i.e. we sum the values over all the classes to receive a measure of entropy for a given data point.
-
•
Bayesian Active Learning by Disagreement (BALD) Houlsby et al. (2011), also called mutual information Gal (2016), is a function of predictive entropy as described above and averaged predictive entropies that have been calculated separately for each output:
(3)
A.2 Computing & Software Infrastructure
The experiments were conducted on a Ubuntu 18.04 system with an AMD Ryzen Processor with 16 CPU-Cores, 126 GB memory, and a single NVIDIA RTX 2080 GPU with 11 GB memory. We further used Python 3.7, PyTorch 1.4 and the Huggingface-Transformer library (2.11.0).
A.3 Topic Size and Difficulty
| No. | Topic | Size | Acc. |
|---|---|---|---|
| 0 | Ban Plastic Water Bottles? | 688 | 0.86 |
| 1 | Christianity or Atheism | 588 | 0.81 |
| 2 | Evolution vs. Creation | 782 | 0.78 |
| 3 | Firefox vs. Internet Explorer | 748 | 0.81 |
| 4 | Gay marriage - right or wrong? | 851 | 0.8 |
| 5 | Should parents use spanking? | 706 | 0.76 |
| 6 | If your spouse committed murder, would you turn them in? | 687 | 0.67 |
| 7 | India has the potential to lead the world | 822 | 0.81 |
| 8 | Is it better to have a lousy father or to be fatherless? | 616 | 0.64 |
| 9 | Is porn wrong? | 571 | 0.79 |
| 10 | Is the school uniform a good or bad idea? | 878 | 0.78 |
| 11 | Pro choice vs. Pro life | 845 | 0.61 |
| 12 | Should physical edu. be mandatory? | 568 | 0.74 |
| 13 | TV is better than books | 747 | 0.79 |
| 14 | Personal pursuit or common good? | 733 | 0.84 |
| 15 | Farquhar as the founder of Singapore | 820 | 0.7 |
| Total Size/Average Acc. | 11 650 | 0.76 |
| No. | Topic | Size | Acc. |
|---|---|---|---|
| 0 | Should flu vaccinations be mandatory? | 731 | 0.75 |
| 1 | Should gambling be banned? | 503 | 0.8 |
| 2 | Does online shopping bring more harm than good? | 278 | 0.79 |
| 3 | Does social media bring more harm than good? | 2587 | 0.78 |
| 4 | Should we adopt cryptocurrency? | 719 | 0.82 |
| 5 | Should we adopt vegetarianism? | 1073 | 0.77 |
| 6 | Should we sale violent video games to minors? | 484 | 0.74 |
| 7 | Should we ban fossil fuels? | 263 | 0.73 |
| 8 | Should we legalize doping in sport? | 737 | 0.77 |
| 9 | Should we limit autonomous cars? | 1217 | 0.79 |
| 10 | Should we support information privacy laws? | 533 | 0.77 |
| Total Size/Average Acc. | 9 125 | 0.77 |
A.4 Hyperparameters
For the evaluation we initialized all methods for ten runs with different seeds and reported the mean accuracy score. We used early stopping with a patience of three on a pre-selected validation set for regularization. As loss function we used weighted binary-cross-entropy for the (relative) Argument Strength task.
We train our models on top of the pre-trained BERT-Base uncased with a dropout probability of 0.1. Learning rate is (same as in Toledo et al. (2019)). The batch size per GPU is 64 and the model is validated after every half epoch.