Smartphone-based geolocation of Internet hosts
Abstract
The location of Internet hosts is frequently used in distributed applications and networking services. Examples include customized advertising, distribution of content, and position-based security. Unfortunately the relationship between an IP address and its position is in general very weak. This motivates the study of measurement-based IP geolocation techniques, where the position of the target host is actively estimated using the delays between a number of landmarks and the target itself. This paper discusses an IP geolocation method based on crowdsourcing where the smartphones of users operate as landmarks. Since smartphones rely on wireless connections, a specific delay-distance model was derived to capture the characteristics of this novel operating scenario.
keywords:
IP geolocation , smartphone , crowdsourcing , network measurement1 Introduction
Many distributed applications and networking services may benefit from knowing the geographical position of Internet hosts. For instance, with such information, content can be customized depending on the user’s position, or a geographically close replica can be selected when downloading large amounts of data. Alternatively, the position of a host can be used to restrict on-line transactions to trusted areas, or to determine the source of cybercrimes. The IP address of a host, unfortunately, provides little information about its position [1]. A number of databases map IP addresses with their believed coordinates. Examples include GeoIP by MaxMind [2], IP2Location [3], and IPInfoDB [4]. Some IP geolocation databases are filled using administrative information (e.g. extracted from Whois entries). The approach based on administrative information suffers from two main problems: information is added by hand by network administrators, thus it may be out of date; location information is sometimes provided at the organization level; thus, in case of large administrative domains, it may not be accurate. Several studies show that the use of administrative information may lead to errors in the order of several thousand kilometers [5, 6, 7, 8].
Active IP geolocation methods estimate the position of an Internet host by performing network measurements. Usually, the observed network parameter is the delay between the host to be localized (the target) and a number of hosts with known location (called landmarks). Some methods convert delays into distances and then use geometrical techniques, such as multilateration, to compute the position of the target on a global reference system. Other methods rely on the concept of similarity in the network distance space, and the target is co-located with the host with known position that exhibits the most similar delay pattern.
Landmarks collect delay measurements towards the target by sending probes and acquiring timestamps. They are generally coordinated by a server, which is also in charge of running a centralized localization algorithm. Almost all the approaches devised so far use the hosts of academic/research platforms as landmarks. PlanetLab is the most used platform, as it allows researchers to run distributed experiments on a wide scale [9]. In addition, the position of hosts participating in the PlanetLab network is known.
This paper discusses a smartphone-based IP geolocation method that operates according to crowdsourcing principles [10, 11]: smartphones provided by common users are enrolled as measuring devices and used as landmarks. The contribution of this work with respect to existing IP geolocation techniques is threefold. First, the use of mobile devices as landmarks, which is made possible by their GPS units, represents an unexplored possibility in the field of IP geolocation. Second, a delay-distance model that takes into account the presence of wireless access links is presented; this widens previous knowledge where wired-only links were considered. Third, the experimental platform is composed of crowdsourced devices not belonging to research facilities; this makes experimental results (and related discussion) closer to real world operating conditions.
The paper is organized as follows: Section 2 provides some background about active IP geolocation; Section 3 presents the main elements of the localization method; in Section 4, the adopted delay-distance model is discussed; in Section 5 experimental results are shown; Section 6 concludes the paper.
2 Related work
Due to their practical relevance, IP geolocation methods received significant attention during the last years. A number of methods are based on administrative information and static registries. Notable examples of information sources include the Domain Name System (DNS) and Whois. RFC 1876 standardizes the format of DNS LOC records for experimental purposes [12]. By using these records network administrators can specify latitude, longitude, and altitude of network resources. The well known Whois directory service maps IP addresses to the organizations they belong to [13]. The physical address (in terms of country, city, street) of organizations is also stored in Whois databases and it is used to derive location information. These databases suffer from two main problems. First, they are filled with human-generated information and, as a consequence, they may contain obsolete entries (as reported in [14]). For instance, there is no incentive for network administrators in updating a DNS LOC entry when an IP address is re-used on a machine with a different location. Second, an organization may be responsible for a large number of IP addresses spread over a wide geographic area; in such circumstances the use of Whois may introduce significant approximations, as a large block of IP addresses is associated to a single administrative office.
A variation of these techniques is adopted by GeoTrack, which uses DNS-based information to infer the position of the target host [7]. The addresses of router interfaces along a network path are converted in names via DNS. Such names frequently contain city, country or airport codes, which are used to infer the location of the target. Unfortunately, DNS names of routers do not follow standardized rules and this reduces the possibility of applying this technique in different scenarios.
Active IP geolocation methods rely on end-to-end delay measurements for determining the position of the target. In particular, landmark hosts send probes towards the target to collect delay measurements. In some cases, delays are converted into physical distances; distances are then combined according to a geometric technique for estimating the position of the target. In other cases, delays are directly used to locate the target according to network similarity metrics.
2.1 Methods based on geometric techniques
Constraint-based Geolocation (CBG) uses an approach derived from multilateration [15]. Each landmark estimates the distance from the target by measuring the round trip time (RTT). The minimum RTT is converted into distance using a linear model calibrated for each landmark (by measuring the delays towards all other landmarks). The estimated distance is assumed to be an upper bound with respect to the real distance, because errors in delay measurements are always additive. In practice, each landmark defines a circular region; the intersection of circular regions defines a convex region where the target is supposed to be. The position of the target is calculated as the center of mass of the intersection.
Spotter is an IP geolocation system based on a probabilistic approach that does not require landmark-specific calibration [6]. Spotter relies on a delay-distance model where the distribution of distances for a given delay is independent from the position of landmarks. This improves resiliency to measurement errors and anomalies. Spotter uses PlanetLab nodes as landmarks.
In [16], the relationship between distance and delay is modeled according to a segmented polynomial. Authors collected RTT data using traceroute, with PlanetLab nodes acting as both landmarks and targets. Calibration of each landmark is carried out dividing data in five regions using a clustering technique. Then the coefficients of polynomials are computed. Estimated distances are used to calculate the position of targets using semidefinite programming, an approach borrowed from localization in wireless sensor networks. Some weighting schemes are compared: no weight (all landmarks have the same importance when localizing a target), inversely proportional to distance (close landmarks are more important than distant ones), sum weighted (the ratio between the distance of a given landmark with respect to the sum of distances of all landmarks is considered). Results confirm that the polynomial model provides better distance estimation with respect to the linear one. Moreover, the inversely proportional weight scheme improves localization accuracy.
Topology-based Geolocation is an IP geolocation method that improves delay-based techniques leveraging network topology [17]. The topology of the network is explored using traceroute, which enables collection of information about intermediate routers. Other tools are used to cluster network interfaces (in case they belong to the same router). Delays are used to constrain the position of hosts: hard constraints are generated using the maximum speed of light in fiber, soft constraints are generated using the delay associated to Internet paths and segments.
IP geolocation techniques have also been adapted to perform geolocation of data: in this case the goal is to localize the host and, at the same time, obtain proofs of data possession. The system presented in [18] can be used to understand if a cloud provider relocates data to a remote data center, possibly violating legal or commercial agreements. Geolocation is based on CBG, using per-landmark calibration. Delay measurements are not carried out using ICMP probes (or, broadly speaking, small packets). On the contrary, relatively large data blocks (up to 32KB) are used to ensure data possession. An experimental evaluation was carried out both on a PlanetLab-based scenario and a cloud-based one. Results are similar to the ones obtained by the original CBG. Authors observed that the selection of landmarks has enormous importance on localization accuracy.
2.2 Methods based on network similarity
GeoPing localizes the target host by selecting the nearest neighbor in delay space. The delay vector registered by a number of landmarks is compared to existing data to find the best match (in terms of Euclidean distance), then the position of the nearest neighbor is returned as the target’s position [7]. An experimental evaluation was carried out in North America, using 14 probing machines and 256 passive landmarks.
In [19] a statistical geolocation approach is discussed. A profile of each landmark is obtained by measuring its delay towards the set of remaining landmarks. Then the joint probability density function of delay and distance is calculated using a kernel density estimator. A force-directed method is used as an approximate algorithm to maximize the likelihood of the target location given the delay measurement data. An experimental evaluation of the proposed approach was carried out using 85 nodes of the PlanetLab network in the continental U.S.A. Results show a better localization accuracy with respect to CBG.
In [20] the accuracy of a geolocation method based on delay similarity is analyzed when varying the placement of passive landmarks and probing machines. The authors evaluate different strategies: random, geographic (based on agglomerations), and demographic (based on user concentrations). Different methods for measuring similarity are studied and compared. In particular, the authors discuss three methods: one based on distance, one based on cosine similarity, and one based on correlation. Manhattan distance is the one that provides the best performance. The dataset used for the evaluation was collected by means of the RIPE infrastructure (55 hosts, one-way delay measurements). The geolocalization procedure places the target host where the nearest landmark is located.
2.3 Discussion and motivation
Almost all IP geolocation studies rely on measurements collected in homogeneous environments (research/academic networks and testbeds), where delay values are relatively stable and reliable. Moreover, in all cases, only wired links have been considered.
We propose a novel approach, not explored in existing literature, where common smartphones are used as landmarks. We believe this study can be a significant addition to the landscape of IP geolocation methods, especially considering the always growing role of smartphones as general computing and communication devices. The smartphones used for IP geolocation do not belong to a research facility or a single organization, instead they are provided by volunteers who join the system according to crowdsourcing principles. These devices belong to autonomous systems111An autonomous system is a group of networks with a single routing policy, run, in most cases, by a single network operator [21]. at the fringes of the Internet, thus our scenario is more representative, in terms of operating conditions, of a real-world geolocation system. Since measurements are collected via wireless links, a specific calibration of the delay-distance model has been carried out. In particular, not only we derived a new delay-distance model that is specific for paths with wireless access, but we also devised the possibility of using the type of access (Wi-Fi, 3G, 4G) to improve the delay-distance relationship. Both these aspects are not covered by existing literature, and are sufficiently general to be used also in other contexts, possibly not related to IP geolocation.
3 Smartphone-based IP geolocation
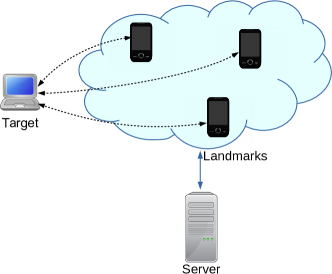
The use of smartphones as landmarks in IP geolocation is motivated by their ability to self-localize using the GPS unit. Moreover, their number and distribution is continuously increasing and this makes them an appealing platform for the development of geographically distributed applications. In the proposed method, participation to the IP geolocation activities takes place on a volunteer basis, according to a crowdsourcing-based paradigm. Devices remain under control of their respective owners, but they can be remotely triggered by a central server to carry out the requested delay measurements (Figure 1). The set of devices involved in localizing a given host is not constant, as it depends on their availability at the time of measurements.
3.1 Method
Let be the set of landmarks participating in measurements towards the target. Let be the set of RTTs between the -th landmark () and the target, where is the number of RTTs collected by landmarks. The end-to-end delay between two hosts can be roughly decomposed in the following factors: transmission delay, processing delay, queuing delay, and propagation delay. To reduce the “noise” introduced by queuing and processing, each landmark selects the minimum value of collected RTTs ().
The minimum RTT is then used to estimate the distance between and the target:
| (1) |
where is a function that models the delay-distance relationship. Function is calculated as discussed in Section 4.
Note that in an environment that includes wireless links, delays are characterized by increased variability with respect to wired-only networks (e.g. because of collisions and higher probability of transmission errors). The problem of collecting accurate delays is exacerbated by the use of smartphones as measuring elements. In fact, hardware resources and mobile operating systems are not very suitable for collecting high-resolution timestamps; reasons include the presence of energy saving mechanisms, the execution of code only in user space, and the presence of other networked applications on the device. These inaccuracies in collecting delays produce errors in estimated distances.
Distances are then combined according to an algorithm derived from CBG [15]. More precisely, in the proposed method, a circular region with radius is centered at the position of landmark . Let us call this region. Let us also define as the list of all circular regions ordered according to their radius.
The region where the target is supposed to be is computed by processing the elements of according to their order, i.e. from the smallest to the largest. In particular, is initialized with as it is the circular region with smallest radius. Subsequently, the intersection between and is computed (). If is null then is discarded: some measurements are affected by large errors and hence not all constraints can be simultaneously satisfied (the algorithm prefers to discard larger circular regions with respect to smaller ones). If is not null, then : the new value of includes the constraints imposed by and the previous ones. This process is repeated for all elements in . The pseudo-code of the algorithm used for computing is reported in Figure 2. After having calculated , its barycenter is used to estimate the position of the target.
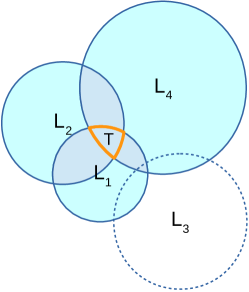
Figure 3 illustrates an example of localization using four landmarks (, …, ), ordered with increasing radius. The intersection between and is not null, thus this region is used to restrict from its initial value (which was equal to ). has no intersection with thus it is not used to further restrict . Finally, the intersection between and the previously determined region is used as the final value of . The barycenter of provides the estimated position of the target.
The proposed localization method is based on CBG because the latter is rather simple, provides good performance, and was adopted as a reference algorithm in a number of other works. As mentioned, CBG executes a calibration phase for every landmark: RTTs are collected towards all other landmarks and the coefficient used for delay-distance conversion is chosen as the smallest value that does not generate under-estimations.
Our method differs from the original CBG for the following aspects:
-
1.
There is no per-landmark calibration. Since landmarks are mobile devices, they are connected to the Internet from possibly different autonomous systems and locations. Thus, per-device calibration does not make much sense, as the operating conditions of the device during calibration can be largely different from the ones at runtime. Instead, we explored the possibility of performing delay-distance calibration depending on the wireless technologies used for accessing the network (i.e. Wi-Fi, UMTS, HSPA, etc.). This form of calibration is probably less accurate than the one à la CBG, as it coalesces information produced by all landmarks that use the same technology. However, at the same time, it is less complex, as there is no need to calibrate new landmarks when they join the system (in a crowdsourcing-based scenario, where devices join and leave the system dynamically, calibrating every new device is not feasible).
-
2.
Circular regions are ordered and used one by one. In particular, regions are ordered according to their radius; this because larger distances are generally affected by larger errors. The algorithm starts using the smallest region, as it is the one that is probably affected by the smallest error, then considers the subsequent ones and tries to compute the intersection incrementally.
It is worth to note that average distances are generally used in combination with multilateration based approaches. Nevertheless, we found that in the considered scenario, which is characterized by possibly significant distance estimation errors, multilateration accuracy can be drastically reduced by the presence of few largely erroneous measurements. Conversely, maximum distances are used in approaches based on computing an admissible region where the target must be located. The latter solution cannot be easily applied in an operational environment characterized by increased heterogeneity: being delay measurements affected by a relatively large dispersion, the geometrical constraints that can be generated are overly loose. The localization procedure here proposed tries to solve the IP geolocation problem by combining elements from both approaches. Constraints are softer with respect to other systems, as they may be violated because they are generated from mean distances. If a constraint cannot be satisfied, it is simply discarded. For the same reason constraints are ordered according to the radius of circular regions. Small delay values are characterized by reduced errors if compared to large values. Thus the use of ordered soft constraints tries to favor measurements characterized by good accuracy with respect to coarse ones.
3.2 Collection of delay data
Smartphones involved in collecting network measurements have been enrolled using the Portolan platform, a crowdsourcing-based system aimed at monitoring and studying very large-scale networks [22, 23]. Smartphones that participate in Portolan activities are remotely instructed about the measurement tasks they have to carry out. Results are then sent to a central server where they are saved for later processing and analysis. Portolan provides a number of tools that can be used for characterizing the network under observation in terms of topology, bandwidth, and delay. To be part of the Portolan platform, volunteers just have to install a standard app on their devices. Portolan is available for a number of operating systems (Android, Linux, Mac OS X, Windows), but for this study only Android-based devices have been used.
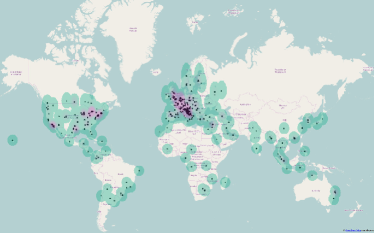
When remotely triggered, smartphones acquire their position using the GPS unit (as they have to operate as landmarks). Then they collect a number of RTTs towards a target (or a set of targets) as specified by the central server. Probes are based on UDP since raw sockets, needed for generating ICMP messages, are not available on Android devices without superuser privilege level [24]. The position of landmarks at the time of measurements is shown in Figure 4a.
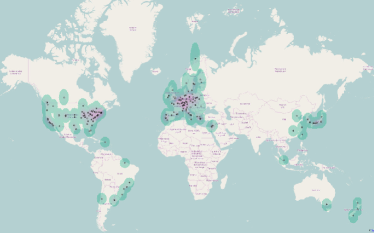
Approximately 400 localizations have been carried out using the nodes of the PlanetLab network as targets. The real position of PlanetLab nodes is known, this allowed us to compute the error between the estimated position and the real one222A preliminary check has been carried out to remove possible targets with clearly inaccurate position information. In particular, we eliminated from the list both those hosts were position was reported with insufficient precision and those with invalid coordinates (some inconsistencies have been pointed out in [25]).. The placement of the target hosts is shown in Figure 4b.
Note that both landmarks and targets are not uniformly distributed over the globe. In particular they are more densely deployed in North America and Europe, whereas the other continents are not so well covered. This reflects the distribution of both PlanetLab nodes and Portolan participants.
Measurements collected by smartphones are transmitted to a central server where they are stored. Analysis has been carried out off-line to ensure experimentation of different strategies and repeatability of results.
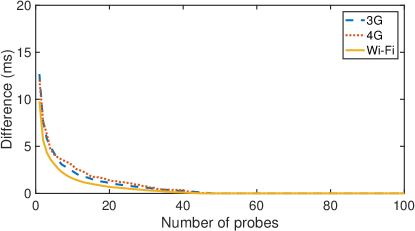
To define the size of bursts – the number of probes to be sent towards a target – we performed a preliminary analysis of delay variability. First, we collected a set of delay measurements using a number of bursts where each burst was 100 probes long. For each burst we found the minimum delay when using all the probes and when using the first probes (with ). We then computed the difference between these minimum values, as an indicator of the stability of the minimum delay when using bursts of different size. More formally, given the -th burst , we first computed for all . Then, we calculated where . Figure 5 shows the median value derived from collected data (approximately 5800 bursts). Results show that Wi-Fi connections are slightly more stable, from this point of view, than 3G and 4G connections. As expected, using bursts composed by a large number of probes improves the stability of the minimum observed delay. However, at the same time, the larger the burst the higher the impact on the users’ terminals (both in terms of generated traffic and energy consumption). We set as a tradeoff between accuracy of measurements and use of participants’ resources. In fact, during the data collection campaigns, we noted an increase in the number of users who left the platform. It is worth to highlight that, as already mentioned, participation to the experiments was not incentivized and it was based only on the will of users. Obviously, in case of more favorable scenarios (e.g. in case of stricter control on terminals) the use of longer bursts would lead to possible improvements in terms of localization accuracy.
Smartphones are, by nature, mobile devices. Nevertheless, in the considered scenario, they have to operate as landmarks, thus we introduced some mechanisms aimed at limiting possible problems due to high mobility rates. The app running on smartphones collects the position of the terminal both at the beginning of a burst of probes and at the end. In case of significant changes (more than 5 km) the set of measurements is discarded. Beside position, the app also checks that the type of connection remains the same throughout the transmission of the burst. It is worth to note that a change in the type of connection (e.g. from cellular to Wi-Fi) can be a source of large inconsistencies, probably bigger than the ones introduced by mobility. In fact, a change in the type of connection may involve a completely different path towards the target (for example because access takes place via a different autonomous system).
A smartphone can use both the GPS unit and network positioning to determine its own location. Network positioning uses the visible cellular towers in the radio range to locate the device, and it is characterized by an accuracy level worse than GPS. We believe that the accuracy provided by network positioning is still compatible with IP geolocation purposes. However, the dataset used in our analysis includes only measurements where the position of smartphones was computed using the GPS. This was done to reduce the effects of unknown factors on the proposed IP geolocation procedure.
3.3 Difficulties due to crowdsourcing and wireless access
The measurement collection phase presented some additional challenges, with respect to previous studies, due to crowdsourcing and wireless access.
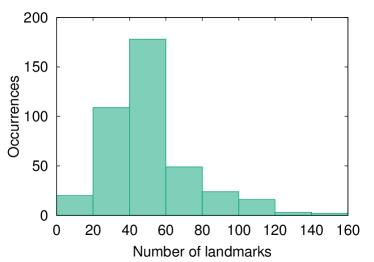
A consequence of using a crowdsourcing-based approach is the high variability in the number of smartphones enrolled in measurements. The number of devices participating in localizing a single target varied from few units to . Figure 6 shows this variability in more detail. The reason is due to the lack of control on devices, which are voluntarily contributed by people participating in the Portolan platform. The user base is intrinsically dynamical, as new users join the system while others terminate their participation. Moreover, even if the number of enrolled users is relatively constant in a given period, the availability of devices may still be subject to rapid changes. For instance they may be turned off by their owners, run out of battery, or enter a not covered area.
Operating conditions are also influenced by the wireless access of smartphones, which makes communication more disconnection- and error-prone than when using wired devices. Thus, some RTT measurements failed because of lost probes or replies; similar problems occurred because of device mobility, as the device may enter an area that is not covered by cellular networks or Wi-Fi access points. These difficulties arise not only when collecting RTT measurements, but also when the central server communicates with enrolled devices for coordinating their activities. In particular, the command used to trigger measurements may be delayed because of a temporary disconnection of landmarks. Because of problems occurred at runtime, the number of RTTs actually collected by smartphones towards a single target was, on average, less than 50 (the chosen value of ). Problems at runtime included disconnections, packet losses, filtering, and energy exhaustion. In the end, the average number of samples collected by each smartphone towards a given target was about 30.
We roughly compared the variability of measurements collected using smartphones with wireless access with respect to measurements collected using common PCs in a wired-only scenario. In particular, we analyzed approximately 800 thousand bursts collected using Portolan, and a similar number of bursts collected by the PingER project [26]. PingER is a measurement infrastructure aimed at studying the end-to-end delay on the Internet. PingER comprises approximately 39 probing machines and 430 probed hosts. In PingER, each probing machine periodically sends a sequence of probes towards a set of targets. Probes are based on ICMP. Collected RTTs are stored in a database and are available to other researchers through a Web interface. PingER uses bursts composed of ten probes. To ensure a fair comparison, we limited the analysis to the first ten elements of each burst also for the measurements collected using Portolan. First, for each burst, we selected the minimum delay value. Then we computed the difference between the ten observed delays and the minimum. In this way we obtained ten “deviations” from the minimum for each burst. Finally we computed the mean value of deviations. The dataset collected using PingER has a mean deviation value of about 5 ms, whereas the one collected using Portolan has a value of about 45 ms. It is worth to point out that the difference between the two values originates from a number of factors including not only the wireless/wired access and computational power, but also the degree of heterogeneity, and the adoption of considerably different operating systems and software layers. The reader is forwarded to [27] for further details about variability of network delays in Android smartphones.
4 Delay-distance model
The end-to-end delay between two Internet hosts can be decomposed into these terms: transmission delay, i.e. the time needed to emit all the bits of the packet; processing delay, i.e. the time required to process the packet; queuing delay, i.e. the amount of time spent by a packet in queues before being served; propagation delay, i.e. the time needed for signals to travel from the transmitter to the receiver. These delays are introduced at every link/router along the path. Some of these components are deterministic (transmission and propagation delay), whereas others are stochastic (queuing and processing delay). The only component that is related to geographical distance is the propagation delay. Since perturbations caused by queuing and processing are always additive, their impact can be limited by measuring the RTT a number of times and selecting the minimum value. Circuitous routing is another source of inaccuracy, as the physical path traversed by packets can be largely deviant with respect to the shortest distance measured along the surface of the earth (the so called great circle distance).
Using smartphones as landmarks also brings additional difficulties, as previously explained. In particular, measurements are less reliable and characterized by increased jitter with respect to when using more traditional platforms.
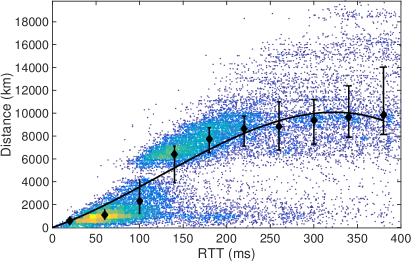
To determine the function that represents the delay-distance model (used in Equation 1), we collected measurements where the real distance between source and destination hosts is known (we used PlanetLab nodes as targets, whereas the position of landmarks has been acquired using GPS). The scatter plot of real distances against the measured by landmarks is shown in Figure 7.
Data has been divided in bins. Median and standard deviation for each bin are also shown in Figure 7. We performed a regression to find the polynomial model of the delay-distance relationship. Such relationship is, in theory, linear if we consider that end-to-end delay is the sum of the four components mentioned above (the only component related with distance is the propagation delay, which linearly increases with distance). However, as the delay gets larger, other factors have an influence on the relationship, that thus becomes better represented by a polynomial function ( is depicted by the curve in Figure 7). For instance, very large round trip times may be produced by non-empty queues found in routers along the path (as the distance increases, the number of traversed routers increases as well). The use of a polynomial function for converting delays into distances has been suggested also in other works (e.g. [6, 16]).
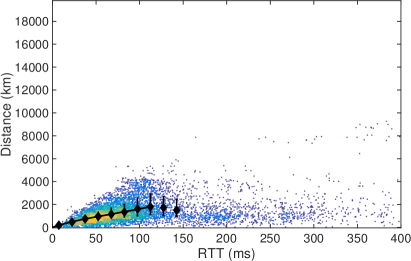
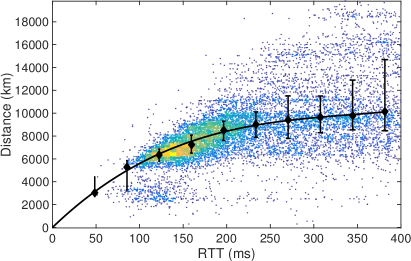
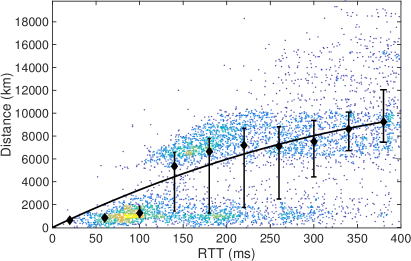
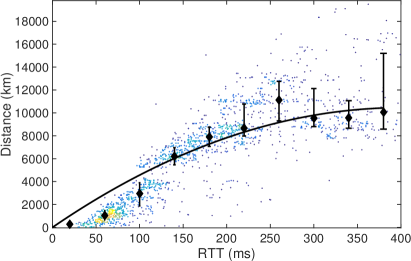
By analyzing Figure 7, some considerations can be made. First, the standard deviation of distances for a given delay value increases with the delay itself. This means the further away from the target a landmark is, the less reliable the measurement is. Second, two major agglomerations of points are clearly visible. Inspection of data suggested that the presence/absence of long-haul links connecting different continents is significant from this point of view. Figure 8a includes only measurements where both target and landmark belong to the same continent. Figure 8b, conversely, includes only measurements where target and landmark belong to different continents.
The clear separation between the two sets of measurements suggests the use of two different functions for converting delays into distances. Let us call and the polynomial functions obtained through regression of measurements where target and destination are within the same continent or in different continents respectively. The two functions are represented by the curves in Figures 8a and 8b. The use of two different functions should be able to provide better estimations with respect to the use of a single global model. This solution is evaluated in Section 5. Note that the use of two different conversion functions requires additional knowledge: the system has to know if source and destination are in the same continent or in different ones, as it has to use either or . Such information can be inferred from the autonomous systems the two hosts belong to (with some exceptions, e.g. when an autonomous system is spread over different continents). In any case, the localization procedure becomes more complicated and requires additional information (a mapping from autonomous systems to continents).
Several previous works relied on landmark-specific calibration, i.e. a different delay-distance model is used at every landmark ([15, 28]). This approach is supposed to increase localization accuracy, as it is able to capture the topological peculiarities of every landmark. Other authors, on the contrary, supported the use of a unique model for all landmarks (e.g [6]). As previously stated, in our scenario characterized by the use of smartphones, the adoption of landmark-specific calibration does not makes much sense.
| Type | Measurements (%) |
|---|---|
| 3G | |
| 4G | |
| Wi-Fi | |
| Other/Not available |
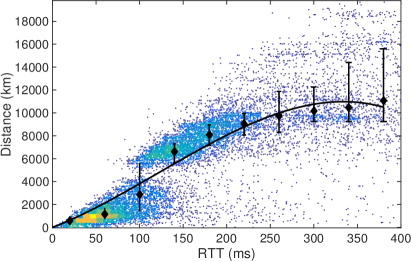
Even though per-landmark calibration is not feasible, we considered that possible improvements may be achieved through the development of delay-distance models that are technology-specific. In fact, every smartphone is able to understand which is the type of access technology currently in use, and this information can be reported to the central server together with delay measurements. Figure 9 shows a set of scatter plots, one for each family of access technologies (3G, 4G, Wi-Fi). For each group of measurements a different is obtained through regression, similarly to the same/different continent criterion. Let us call , , and the resulting functions. At runtime, the system uses , , or depending on the technology currently in use. The percentages of samples for the different access technologies, in our dataset, are reported in Table 1. The majority of measurements have been collected using Wi-Fi, followed by 3G, and 4G. Few measurements have been collected using 2G and 2.5G cellular networks. These measurements were not used because such communication technologies are rapidly becoming obsolete. In some cases, smartphones have not been able to report the exact type of access technology. Also these measurements were not used in our analysis. The fraction of measurements collected using obsolete cellular networks, or without indication of the technology used, is reported as “Other/Not Available” in Table 1.
In summary, we devised three different delay-distance models: a model obtained from the whole dataset (let us call this one the global model); a model that takes into account whether the two hosts are in the same continent or not (let us call this one the continent-based model); a model that leverages information concerning the wireless access technology (let us call this one the technology-based model). A fourth model is obtained by combining the continent- and technology-based model, as they exploit disjoint properties (let us call this one the hybrid model).
Note that for large delay values the relationship between delay and distance becomes practically meaningless. This is particularly evident in Figure 8a where the two-rightmost median values do not preserve the increasing relationship between delay and distance. Thus, we decided to limit the use of to the region where distance is positively proportional to delay.
5 Results
This section reports the results obtained using the localization procedure in combination with the different delay-distance models. To avoid using the same data for both calibration and evaluation, we followed an approach based on ten-fold cross-validation [29]. In particular, we separated the set of hosts used for deriving the delay-distance model from the ones used for evaluation. With -fold cross-validation data is partitioned in disjoint subsets of equal size. Then subsets are used to train the system (in our case to perform model calibration) whereas the remaining subset is used to evaluate the performance of the system (on previously unseen data). The procedure is repeated times so that all subsets are left out during training and used exactly once for evaluation. Results are finally aggregated to obtain the overall performance of the proposed IP geolocation method.
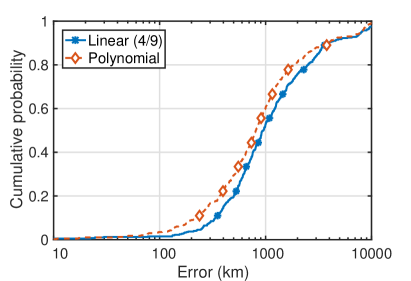
Figure 10 shows the cumulative distribution function of localization error when using the global delay-distance model (polynomial) and a linear model with coefficient (4/9) derived from literature [17]. Median localization errors are respectively equal to km and km. It is evident that a linear model, calibrated for wired access networks, is less adequate for a smartphone-based scenario.
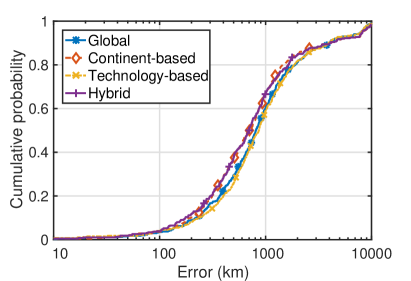
We then evaluated the performance of the continent-based model, the technology-based model, and the hybrid model with respect to the global model. Results are shown in Figure 11. The best results are obtained when using the continental and the hybrid models. At this level, the benefits introduced by using a model that depends on the access technology are almost negligible.
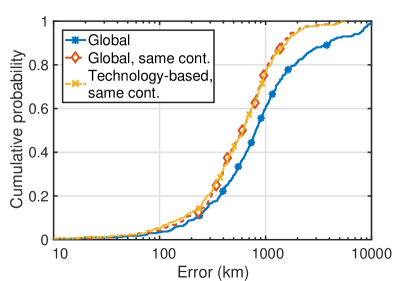
Figure 12 shows the results achieved when limiting the landmarks to the ones that are placed in the same continent of the target. More precisely, when localizing a target a number of landmarks are located in its same continent, whereas others are located in other continents. We discarded the measurements collected by the latter ones. This produced an improvement of localization accuracy. This behavior is somehow expected, as distant landmarks provide less accurate measurements than close ones. In particular, in this scenario, the global model achieves a median localization error equal to km, while the technology-based model achieves a median error equal to km.
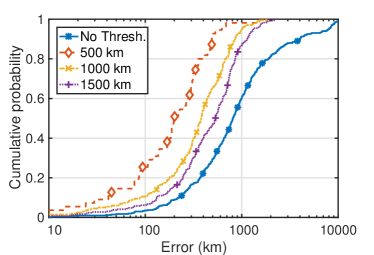
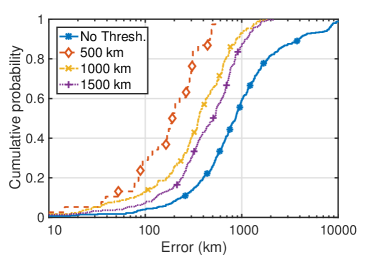
Consequently, we studied the performance of the localization process when filtering out distant landmarks. Figure 13 shows the cumulative distribution function of localization error when using only landmarks within 500, 1000, and 1500 km from the target333A measurement provided by a landmark is discarded if the RTT corresponds to an estimated distance greater than the threshold.. Results achieved without filtering are also reported as a reference. It is evident that localization accuracy increases when adopting more aggressive filtering. In more detail, Figure 13a shows the results obtained when filtering is applied to a localization procedure based on the global delay-distance model: the median localization error is equal to 201, 379, 535 km when using the three thresholds. Figure 13b shows the results obtained when the technology-based model is used. In this case the median errors are respectively equal to 189, 358, and 507 km.
It is worthwhile to note that when filtering is applied, the technology-based model is able to provide some benefits in terms of localization accuracy (about 6%): when RTTs are small, the technology-based model is able to better capture the relationship between delay and distance.
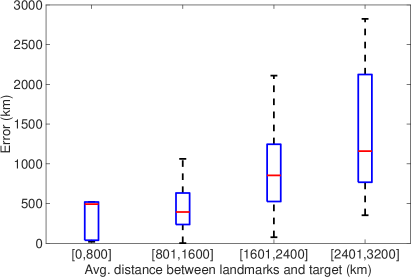
In any case, the larger the distance between target and landmarks the larger the localization error (for instance because of queues or congestions). Figure 14 depicts this finding in terms of localization error against average target-landmark distance.
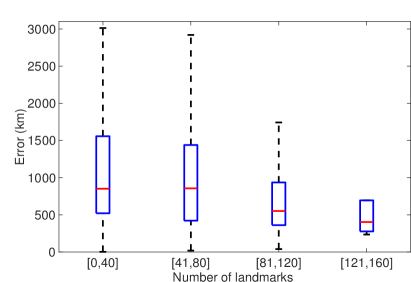
Another important factor affecting the performance of IP geolocation is the number of landmarks that participate in locating a target. Using a larger number of landmarks generally provides better results, as shown in Figure 15. Thus, the performance of the system could be improved simply by increasing the number of participants, as this would reduce the average distance to the target and, at the same time, it would increase the average number of landmarks involved in locating a target. Since the proposed method is based on crowdsourcing, increasing the number of devices is not straightforward as it is not under direct control of experimenters [30]. It is known that participation to crowdsourcing systems can be stimulated through proper incentives [31, 32, 33], but this possibility has not been put into practice in current work and it is left for further studies.
5.1 Comparison with closest landmark
We compared the performance of the proposed method with respect to a simple benchmark technique based on the closest landmark. In particular, such reference method just returns, for each target, the coordinates of the closest landmark in the delay space.
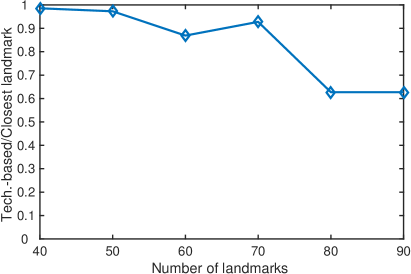
Figure 16 shows the ratio between the median error obtained by the proposed method (technology-based) and the median error obtained by closest landmark. The errors for the two methods have been computed when varying the number of landmarks involved in localization. When the number of landmarks is small, the performance of the two methods tend to be similar. On the contrary, as the number of landmarks involved in the localization process increases, the performance of the proposed method, with respect to closest landmark, increases as well. In fact, when the number of landmarks is large the intersection of the regions defined by the different landmarks becomes smaller, and this improves the localization process (this phenomenon is also highlighted by Figure 15).
6 Conclusion
All existing methods for IP geolocation rely on the use of fixed hosts as landmarks. In addition, in almost all cases, both landmarks and targets belong to research facilities. The rationale for these choices may be found in the difficulties concerning the setup of large-scale distributed experiments. In this paper a novel method for active IP geolocation based on mobile devices, enrolled according to crowdsourcing principles, has been presented. For the first time the use of smartphones is considered for the implementation of a distributed IP geolocation platform, leveraging on the self-localization ability of these devices. Since smartphones are crowdsourced from volunteers who participate from largely different contexts, they belong to a wide range of autonomous systems. Thus, the considered scenario is characterized by increased heterogeneity with respect to previous research. We believe that results obtained in this scenario are more representative of real-world conditions. As smartphones are connected to the Internet using wireless links, we devised delay-distance models more suitable for this context than the ones available from literature (calibrated for wired scenarios). The model that takes into account the access technology is able to provide better accuracy, but only when the distance between the two endpoints is not too large. On the contrary, when the distance between the two endpoints is significant, the benefits provided by technology-calibrated models get almost nullified by the increased variability of measurements.
References
References
-
[1]
M. J. Freedman, M. Vutukuru, N. Feamster, H. Balakrishnan,
Geographic Locality
of IP Prefixes, in: Proceedings of the 5th ACM SIGCOMM Conference on
Internet Measurement, IMC ’05, USENIX Association, Berkeley, CA, USA, 2005,
pp. 13–13.
URL http://dl.acm.org/citation.cfm?id=1251086.1251099 - [2] MaxMind, GeoIP (2016).
- [3] IP2Location.com, Ip2location (2016).
- [4] ipinfodb.com, IPInfoDB (2016).
-
[5]
S. Laki, P. Mátray, P. Hága, I. Csabai, G. Vattay,
A model based approach
for improving router geolocation, Comput. Netw. 54 (9) (2010) 1490–1501.
doi:10.1016/j.comnet.2009.12.004.
URL http://dx.doi.org/10.1016/j.comnet.2009.12.004 - [6] S. Laki, P. Matray, P. Haga, T. Sebok, I. Csabai, G. Vattay, Spotter: A model based active geolocation service, in: Proceedings of IEEE INFOCOM, 2011, pp. 3173–3181. doi:10.1109/INFCOM.2011.5935165.
-
[7]
V. N. Padmanabhan, L. Subramanian,
An investigation of
geographic mapping techniques for Internet hosts, SIGCOMM Comput. Commun.
Rev. 31 (4) (2001) 173–185.
doi:10.1145/964723.383073.
URL http://doi.acm.org/10.1145/964723.383073 -
[8]
I. Poese, S. Uhlig, M. A. Kaafar, B. Donnet, B. Gueye,
IP Geolocation Databases:
Unreliable?, SIGCOMM Comput. Commun. Rev. 41 (2) (2011) 53–56.
doi:10.1145/1971162.1971171.
URL http://doi.acm.org/10.1145/1971162.1971171 - [9] PlanetLab, https://www.planet-lab.org/.
- [10] J. Howe, Crowdsourcing: How the power of the crowd is driving the future of business, Random House, 2008.
-
[11]
D. R. Choffnes, F. E. Bustamante, Z. Ge,
Crowdsourcing service-level
network event monitoring, SIGCOMM Comput. Commun. Rev. 40 (4) (2010)
387–398.
doi:10.1145/1851275.1851228.
URL http://doi.acm.org/10.1145/1851275.1851228 - [12] C. Davis, P. Vixie, T. Goodwin, I. Dickinson, A means for expressing location information in the Domain Name System. Network Working Group RFC 1876 (1996).
- [13] L. Daigle, Whois protocol specification, rfc 3912 (September 2004). doi:10.17487/RFC3912.
- [14] M. Zhang, Y. Ruan, V. S. Pai, J. Rexford, How DNS misnaming distorts Internet topology mapping, in: Proceedings of the USENIX Annual Technical Conference, 2006, pp. 369–374.
-
[15]
B. Gueye, A. Ziviani, M. Crovella, S. Fdida,
Constraint-based
Geolocation of Internet Hosts, IEEE/ACM Trans. Netw. 14 (6) (2006)
1219–1232.
doi:10.1109/TNET.2006.886332.
URL http://dx.doi.org/10.1109/TNET.2006.886332 -
[16]
Z. Dong, R. D. Perera, R. Chandramouli, K. Subbalakshmi,
Network
measurement based modeling and optimization for IP geolocation, Computer
Networks 56 (1) (2012) 85 – 98.
doi:http://dx.doi.org/10.1016/j.comnet.2011.08.011.
URL http://www.sciencedirect.com/science/article/pii/S1389128611003173 -
[17]
E. Katz-Bassett, J. P. John, A. Krishnamurthy, D. Wetherall, T. Anderson,
Y. Chawathe, Towards IP
Geolocation Using Delay and Topology Measurements, in: Proceedings of the
6th ACM SIGCOMM Conference on Internet Measurement, IMC ’06, ACM, New York,
NY, USA, 2006, pp. 71–84.
doi:10.1145/1177080.1177090.
URL http://doi.acm.org/10.1145/1177080.1177090 -
[18]
M. Gondree, Z. N. Peterson,
Geolocation of data in the
cloud, in: Proceedings of the Third ACM Conference on Data and Application
Security and Privacy, CODASPY ’13, ACM, New York, NY, USA, 2013, pp. 25–36.
doi:10.1145/2435349.2435353.
URL http://doi.acm.org/10.1145/2435349.2435353 - [19] I. Youn, B. L. Mark, D. Richards, Statistical Geolocation of Internet Hosts, in: Proceedings of the 18th International Conference on Computer Communications and Networks, 2009, pp. 1–6. doi:10.1109/ICCCN.2009.5235373.
-
[20]
A. Ziviani, S. Fdida, J. F. de Rezende, O. C. M. Duarte,
Improving
the accuracy of measurement-based geographic location of Internet hosts,
Computer Networks 47 (4) (2005) 503 – 523.
doi:http://dx.doi.org/10.1016/j.comnet.2004.08.013.
URL http://www.sciencedirect.com/science/article/pii/S138912860400249X - [21] J. Hawkinson, T. Bates, Guidelines for creation, selection, and registration of an Autonomous System (AS), RFC 1930 (Best Current Practice) (1996).
- [22] A. Faggiani, E. Gregori, L. Lenzini, V. Luconi, A. Vecchio, Smartphone-based crowdsourcing for network monitoring: Opportunities, challenges, and a case study, Communications Magazine, IEEE 52 (1) (2014) 106–113. doi:10.1109/MCOM.2014.6710071.
- [23] E. Gregori, L. Lenzini, V. Luconi, A. Vecchio, Sensing the internet through crowdsourcing, in: Pervasive Computing and Communications Workshops (PERCOM Workshops), 2013 IEEE International Conference on, 2013, pp. 248–254. doi:10.1109/PerComW.2013.6529490.
- [24] A. Faggiani, E. Gregori, L. Lenzini, S. Mainardi, A. Vecchio, On the feasibility of measuring the Internet through smartphone-based crowdsourcing, in: Proceedings of the 10th International Symposium on Modeling and Optimization in Mobile, Ad Hoc and Wireless Networks (WiOpt), 2012, pp. 318–323.
- [25] D. Komosny, J. Pruzinsky, P. Ilko, J. Polasek, P. Masek, O. Kocatepe, On geographic coordinates of PlanetLab Europe, in: Telecommunications and Signal Processing (TSP), 2015 38th International Conference on, 2015, pp. 642–646. doi:10.1109/TSP.2015.7296342.
- [26] W. Matthews, L. Cottrell, The PingER project: active Internet performance monitoring for the HENP community, IEEE Communications Magazine 38 (5) (2000) 130–136. doi:10.1109/35.841837.
- [27] W. Li, R. K. P. Mok, D. Wu, R. K. C. Chang, On the accuracy of smartphone-based mobile network measurement, in: 2015 IEEE Conference on Computer Communications (INFOCOM), 2015, pp. 370–378. doi:10.1109/INFOCOM.2015.7218402.
-
[28]
B. Wong, I. Stoyanov, E. G. Sirer,
Octant: A
Comprehensive Framework for the Geolocalization of Internet Hosts, in:
Proceedings of the 4th USENIX Conference on Networked Systems Design and
Implementation, NSDI’07, USENIX Association, Berkeley, CA, USA, 2007, pp.
23–23.
URL http://dl.acm.org/citation.cfm?id=1973430.1973453 - [29] R. O. Duda, P. E. Hart, D. G. Stork, Pattern Classification (2nd Edition), Wiley-Interscience, 2000.
-
[30]
A. Faggiani, E. Gregori, L. Lenzini, V. Luconi, A. Vecchio,
Lessons learned from the
design, implementation, and management of a smartphone-based crowdsourcing
system, in: Proceedings of First International Workshop on Sensing and Big
Data Mining, ACM, New York, NY, USA, 2013.
doi:10.1145/2536714.2536717.
URL http://doi.acm.org/10.1145/2536714.2536717 - [31] J. J. Horton, L. B. Chilton, The labor economics of paid crowdsourcing, in: Proceedings of the 11th ACM conference on Electronic commerce, ACM, 2010, pp. 209–218.
-
[32]
D. Yang, G. Xue, X. Fang, J. Tang,
Crowdsourcing to
smartphones: Incentive mechanism design for mobile phone sensing, in:
Proceedings of the 18th Annual International Conference on Mobile Computing
and Networking, Mobicom ’12, ACM, New York, NY, USA, 2012, pp. 173–184.
doi:10.1145/2348543.2348567.
URL http://doi.acm.org/10.1145/2348543.2348567 - [33] A. Mao, E. Kamar, Y. Chen, E. Horvitz, M. E. Schwamb, C. J. Lintott, A. M. Smith, Volunteering Versus Work for Pay: Incentives and Tradeoffs in Crowdsourcing, in: First AAAI Conference on Human Computation and Crowdsourcing, 2013.