Semi-Supervised Imitation Learning with
Mixed Qualities of Demonstrations for Autonomous Driving
Abstract
In this paper, we consider the problem of autonomous driving using imitation learning in a semi-supervised manner. In particular, both labeled and unlabeled demonstrations are leveraged during training by estimating the quality of each unlabeled demonstration. If the provided demonstrations are corrupted and have a low signal-to-noise ratio, the performance of the imitation learning agent can be degraded significantly. To mitigate this problem, we propose a method called semi-supervised imitation learning (SSIL). SSIL first learns how to discriminate and evaluate each state-action pair’s reliability in unlabeled demonstrations by assigning higher reliability values to demonstrations similar to labeled expert demonstrations. This reliability value is called leverage. After this discrimination process, both labeled and unlabeled demonstrations with estimated leverage values are utilized while training the policy in a semi-supervised manner. The experimental results demonstrate the validity of the proposed algorithm using unlabeled trajectories with mixed qualities. Moreover, the hardware experiments using an RC car are conducted to show that the proposed method can be applied to real-world applications.
I Introduction
Designing a real-time controller for robots with high-speed motion is a challenging problem. Conventional approaches of designing a rule-based feedback controller [1, 2, 3] have shortcomings in covering all the exception cases. Recent approaches include a method that can autonomously cover all the exception cases, such as training the controller via deep reinforcement learning (RL) methods [4, 5, 6, 7, 8]. However, it is challenging to use RL methods for physical robots due to their high sample complexity, safety concerns, and difficulty in designing feasible reward functions [9].
To address the above issues, imitation learning (IL)[10, 11, 12, 13, 14, 15] has been a trending topic of designing a controller. IL methods do not need to design a reward function and tend to show better performance due to their simplicity of following an ideal trajectory. In general, the main objective of imitation learning is to find a controller that successfully mimics the given expert demonstrations.
Standard approaches to imitation learning (IL)[11, 12, 13, 14, 15] assume that only the expert data are given to the agent. However, this assumption may not always be valid. One of this assumption’s main limitations is that collecting pure expert data is challenging due to the limited budget and time. The data may be noisy, not collected from experts, or contain incomplete demonstrations. This causes the learning quality of imitation learning to degrade. On the other hand, collecting diverse quality data is cheaper (i.e., collecting demonstrations from non-experts or crowdsourcing [16]). However, it is not straightforward to evaluate and discriminate such data for training due to the variability in quality.
To resolve this problem, Choi et al.[17, 18] proposed a method that can utilize demonstrations with mixed qualities by estimating the quality of each data through the lens of correlation. The cornerstone of the method is to model multiple policies with correlated Gaussian processes by assuming that the expert’s policy is the dominant pattern in the dataset. This method was extended to neural networks in [19] to address the scalability issue of Gaussian process regression. Mixed demonstration generative adversarial imitation learning (MixGAIL), proposed in [20], is an imitation learning method that can be trained with both good and bad demonstrations. But it is assumed that all demonstrations are labeled.
This paper assumes the imitation learning scenario where a relatively small number of expert demonstrations are given while there are enough unlabeled and perhaps suboptimal demonstrations. This setting alleviates the clean data assumption that most imitation learning papers take and makes it possible to leverage both labeled and unlabeled demonstrations in one unified framework.
In this paper, we introduce a novel imitation learning method named semi-supervised imitation learning (SSIL) which can evaluate the quality of unlabeled data using the predictive uncertainty. First, we train a variational autoencoder (VAE) from a small number of demonstrations from experts. From the VAE we trained, we can measure the reconstruction losses on unlabeled demonstrations. Then, we normalize the reconstruction loss and convert them into the confidence value of each state-action pair in each unlabeled demonstration. This confidence value is called the leverage value of the given demonstration. We then provide a state-action-leverage value triplet set to the SSIL framework.
We show the strength of the proposed method by comparing it against MixGAIL [20] and GAIL [11]. The experiments are performed in TORCS [21] and a real-world RC car driving scenario. SSIL shows superior performance compared to GAIL and MixGAIL when only more than 0.61% of demonstrations are given as labeled expert demonstrations. Moreover, in a real-world experiment with an RC car, SSIL shows maximum score improvements of 19.0% and 12.1% over GAIL and MixGAIL, respectively. In addition, SSIL shows a similar standard deviation of the performance score on three different trials with different seeds as MixGAIL, which is 58.1% of the standard deviation of the performance score of GAIL. Note that to show the robustness of our algorithm, the domain for collecting data and the domain used for testing our algorithm are different.
II Background
II-A Mixed Demonstration Generative Adversarial Imitation Learning
Generative adversarial imitation learning (GAIL) is a powerful imitation learning method. In this algorithm, the agent imitates the given expert demonstration. While GAIL [11] uses only expert demonstrations, mixed demonstration generative adversarial imitation learning (MixGAIL) [20] uses demonstrations with poor qualities (negative demonstrations) along with expert demonstrations.
The objective function of MixGAIL is given as:
| (1) | ||||
where and are stochastic policies of expert trajectory and generator, respectively. and are the expected returns of policy and , respectively. The state is , and action is , where and are the state and action spaces. is a discriminator, and the causal entropy of is represented as . is a set of states of expert demonstrations, while is a set of states in negative demonstrations. is a term called the constraint reward. and control the proportion of and , respectively. The constraint reward, , is given as:
| (2) |
where is norm and is a hyperparameter used to control the sharpness of . estimate how much the current state is close to expert states or negative states. This value is used as an estimated reward function to the policy network before the discriminator is moderately trained.
II-B Using Reconstruction Loss as a Measurement of Uncertainty
A variational autoencoder (VAE) is an encoder-decoder model where the dimension of the given dataset is reduced by the encoder then reconstructed by the decoder. The objective of VAE is to reconstruct the original data from a deducted dimension form, using the decoder model to generate data similar to original data. The loss function of this algorithm is called the reconstruction loss.
An et al.[22] have shown that the variational autoencoder can be used for anomaly detection. When data comes across an information bottleneck between the encoder and decoder, the VAE will learn to lose the least amount of information. If unseen data given to the trained VAE is distinct from the data used for training, the reconstruction loss will be high due to the VAE failing to select essential features for reconstruction. If a decent threshold for reconstruction loss is selected, the reconstruction loss can be used as an indicator for anomaly detection.
III Semi-Supervised Imitation Learning
One of the shortcomings of GAIL [11] is that, without expert demonstrations, GAIL may not be adequately trained. Hence, the performance of using GAIL is limited by the quality of expert demonstrations. Also, if the quality of demonstrations given to the algorithm is not consistent with the policy, the learning process becomes slower, the trained agent may not perform as well, or worse, the agent may not learn from them. If we have a set of state-action pairs from expert demonstrations, we can evaluate and give corresponding reliability values to other unlabeled state-action pairs and use them as a sub-optimal dataset. Since each unlabeled demonstration has a different degree of closeness to expert demonstrations, the reliability value for unlabeled state-action pairs has to be continuous, not binary. Therefore, an algorithm using a continuous reliability value is necessary. We call this estimated reliability value a leverage value in this paper.
We introduce a novel method called semi-supervised imitation learning (SSIL). This method uses both labeled expert demonstrations and unlabeled demonstrations with unknown qualities. Our main contributions are twofold. First, we propose a novel method to evaluate each unlabeled state-action pair based on known expert state-action pairs. Second, we propose a method using continuous leverage values for training an autonomous agent.
III-A Evaluating Unlabeled Demonstrations
We propose an algorithm that evaluates unlabeled state-action pairs. The variational autoencoder (VAE) is used to evaluate the quality of a state by calculating the reconstruction loss of unlabeled data. If the reconstruction loss is higher than a predetermined threshold, the data pair corresponding to the reconstruction loss can be classified as harmful data and vice versa. However, binary classification cannot accurately evaluate the data because the data quality is not binary, expert or non-expert, but continuous. Therefore, evaluating the quality of each data is essential for higher performance, especially for autonomous driving. We obtain a leverage value by normalizing the reconstruction loss as follows:
| (3) | ||||
where is the reconstruction error set, is the reconstruction error of th state, and are the input state and result of VAE, respectively, is the leverage value of the th state, is the set of leverage values, and is the number of states in all demonstrations.
While the mixture density network (MDN) [23] and GPR [24] use both state and action data for training, VAE only uses state data as its input, which is a loss of information. To compensate for this issue, we also propose to use two consecutive state data as input to VAE, which is called windowed VAE (windowVAE). By encoding two consecutive state data, the VAE can be seen as encoding the state data and the environment-action interaction. This encoding method allows VAE to encode not only the state data but also the effect of action. The results in Table II shows that the leverage values are evaluated as we intended.
III-B Leverage Constraint Reward
The main problem of the constraint reward () in MixGAIL [20] is that this term can only be used on binary classified trajectories or state-action pairs. If each state-action pair’s leverage value is not binary, the given data’s potential is not fully utilized. Therefore, we propose a leverage constraint reward (), which can fully exploit the given leverage values with varying degrees for training an agent. The objective function for SSIL can be written as:
| (4) | ||||
where the notations are the same as that of Section II-A, except for being a set of states of both labeled and unlabeled demonstrations, and being the matching set of leverage value for calculated from Section III-A. LCoR is defined as follows:
| (5) |
where is the size of a leverage value set, and are the state value and its corresponding leverage value of the th demonstration, and the value of is larger than . The value adjusts the reward function inside the GAIL algorithm by giving a reward based on leverage values which are weighted by the distance to the state . If states with high leverage values are close, LCoR becomes larger. This allows LCoR to operate as a positive reward incentive, as states with high leverage value are closer to states in the labeled expert demonstrations. On the other hand, if neighboring states have low leverage values, LCoR becomes smaller, causing LCoR to operate as a penalty to the overall reward function. Note that this value only impacts the policy update part, not affecting the discriminator update part.
If is closer to 1, the corresponding state is closer to expert demonstrations while if is close to 0, the state is far from expert demonstrations. The modified reward function for the policy is as follows:
| (6) |
Note that only the labeled state-action pairs are used to calculate the in (6), and the labeled and unlabeled dataset are used to calculate the value of .
During training, the discount factor, , is decayed. However, each decay causes the target value of the value function to fluctuate. From (6), the target value consists of the discriminator value and the value. Both values are estimated using neural networks. To mitigate the fluctuation of the value function, is decayed if the difference of the discriminator value function before and after the RL algorithm update is larger than the difference of value function before and after the RL algorithm update when both functions are given initial state. The discriminator value function and the value function are shown below:
| (7) |
where is the value function of the discriminator, is the value function of , is an initial state, and is the decay factor. The is decayed by multiplying when .
During training, we estimate discriminator and policy using and , where and are weights of the neural networks for and , respectively. The training process is explained in Algorithm 1.
IV Experimental Results
IV-A Simulation Experiment
We evaluate the proposed algorithm on a race car simulator called TORCS [21]. In this experiment, a total of 49,200 state-action pairs are collected as demonstrations. The first 1,200 expert state-action pairs are used as the labeled expert demonstrations. The other 48,000 state-action pairs, which consist of 24,000 expert demonstrations and 24,000 negative demonstrations, are used as unlabeled demonstrations. GAIL and MixGAIL are used as baselines for the evaluation of the proposed method. In addition, SSIL using leverage values derived from different algorithms, GPR and MDN, are compared with the proposed algorithm.
IV-A1 Simulation Environment Setup
We designed an underlying reward function for the evaluation index of the trained agent’s performance. The reward function is shown as below:
| (8) |
where and indicates speed of the car along x-axis and y-axis, respectively, indicates the angle between the car direction and the direction of the track axis, which is the center line of the lane, and is the distance between the car and the track axis. Note that the underlying reward is only used for evaluation and not used during training.
IV-A2 Collecting Expert and Negative Demonstrations
The expert demonstrations are collected from a trained PPO[5] network. The negative demonstrations are collected from an under-trained PPO network. The unlabeled data of this part consists of part of expert demonstrations and all of the negative demonstrations. A half of the unlabeled data is expert demonstrations, and the other half consists of negative demonstrations. We changed the amount of labeled data to show the efficiency of SSIL. On average, one expert trajectory consists of 2,400 state-action pairs, and one state-action pair is composed of 29 states and two actions.
IV-A3 Baseline Algorithms for Comparison
For a fair comparison among VAE, windowed VAE, GPR, and MDN, each evaluation method is tested by using it for training SSIL. For all the compared algorithms, the labeled data are used for training. After training, the unlabeled data are given to each algorithm to obtain leverage values using (3). VAE and windowed VAE use the only state for evaluating the unlabeled data.
On the other hand, GPR and MDN use state-action pairs, where the input to the algorithm is the state and the output of the algorithm is the action. In the case of GPR, the uncertainty estimation of each state-action pair can be obtained by calculating the standard deviation of the predicted output. In the case of MDN, the uncertainty estimation of each state-action pair can be calculated by adding the epistemic uncertainty and aleatoric uncertainty [25]. In the case of MDN and GPR, the reconstruction error in the equation is replaced with estimated uncertainty.
IV-A4 Simulation Results
We tested GAIL, MixGAIL, and SSIL three times, each using different random seeds.
| labeled state-actions | GAIL | GAIL expert | MixGAIL | SSIL (GPR) | SSIL (MDN) | SSIL (VAE) | SSIL (windowVAE) |
|---|---|---|---|---|---|---|---|
| 100 | 0.564/0.077 | 0.263/0.057 | 0.049/0.002 | 0.051/0.044 | 0.102/0.008 | 0.055/0.017 | 0.325/0.161 |
| 300 | 0.564/0.077 | 0.370/0.169 | 0.598/0.125 | 0.514/0.021 | 0.609/0.085 | 0.605/0.125 | 0.525/0.071 |
| 600 | 0.564/0.077 | 0.637/0.129 | 0.586/0.008 | 0.643/0.118 | 0.614/0.102 | 0.795/0.054 | 0.763/0.002 |
| 1200 | 0.564/0.077 | 0.768/0.095 | 0.886/0.003 | 0.880/0.020 | 0.873/0.014 | 0.871/0.013 | 0.887/0.022 |
The comparative results with SSIL (VAE) and SSIL (windowVAE) are shown in Table I. We conduct the experiment based on the number of labeled data’s state-action pairs. 100, 300, 600, 1,200 state-action pairs indicates 8.3%, 25%, 50%, 100% of the labeled expert demonstrations, and 0.20%, 0.61%, 1.22%, 2.44% of all demonstrations, respectively.
SSIL vs GAIL
First, to show the robustness of the proposed algorithm to the quality of data, SSIL is compared with GAIL using labeled demonstrations and unlabeled demonstrations as input to the discriminator. For GAIL, the unlabeled trajectories are given with the expert trajectories to the discriminator. For SSIL, the labeled trajectories are given to the discriminator and , while the unlabeled data is given to only. In addition, the comparison shows how much the labeled data should be given to SSIL in order to outperform GAIL.
The results of SSIL trained with leverage values from VAE (SSIL (VAE)) and windowed VAE (SSIL (windowVAE)) show that when the number of input expert state-action pairs is 100, the results are worse than using mixed input of expert and negative trajectories directly to GAIL. The performance of the experiment on 100 labeled state-action pairs and 48,000 unlabeled state-action pairs is only 9.75% and 57.6% of GAIL’s performance for SSIL (VAE) and SSIL (windowVAE), respectively, as shown in Table I. The result can be interpreted as; VAE sees data that is not seen during training, calculates unseen data’s reconstruction high, causing a misallocation of the leverage value and worse training results than GAIL.
If 300 labeled state-action pairs and 48,000 unlabeled state-action pairs are used, the SSIL (windowVAE) shows 93.1% of the performance of GAIL, as shown in Table I. On the other hand, the SSIL (VAE) shows an improvement of 7.27% over GAIL. The experimental result can be interpreted that in this domain, if 0.61% of demonstrations are known as expert demonstrations, SSIL (VAE) shows better performance than GAIL. In the case of SSIL (windowVAE), it can be inferred that more data is needed to encode two consecutive states.
If the number of input data is more than 600, the SSIL (VAE) and SSIL (windowVAE) show higher performance and lower standard deviation than GAIL. In the case of 600 input data, SSIL (VAE) and SSIL (windowVAE) shows 41.0% and 35.3% improvements over GAIL, respectively, as shown in Table I. In the case of 1200 input data, SSIL (VAE) and SSIL (windowVAE) shows 54.4% and 57.3% better performance than GAIL. The comparison with GAIL with mixed quality demonstrations and SSIL shows that rather than using mixed qualities of data as input to GAIL, evaluating each data and exploiting them during training positively affects the performance.
SSIL vs GAIL with only labeled demonstrations
SSIL (VAE) and SSIL (windowVAE) are compared with GAIL using only labeled demonstrations in the second experiment. In the case of 300, 600, and 1200 expert demonstrations, SSIL (VAE) shows 63.5%, 24.8%, and 13.4% improvements over GAIL, respectively, and SSIL (windowVAE) shows 41.9%, 19.8%, and 15.5% improvement over GAIL, respectively. However, in the case of 100 input data, SSIL (VAE) shows 20.9% of GAIL’s performance, while SSIL (windowVAE) shows 23.5% of improvement over GAIL. Therefore, it can be inferred that using unlabeled data and exploiting their leverage values during training positively affects the performance.
SSIL vs MixGAIL
In the third experiment, SSIL (VAE) and SSIL (windowVAE) are compared with MixGAIL using labeled and unlabeled demonstrations. For MixGAIL, the labeled data are used for in and discriminator input, and the unlabeled data are used for in , where the unlabeled data are used as negative data. This comparison empirically proves that SSIL has the ability to estimate the quality of each demonstration.
| 0-25% | 25%-50% | 50%-75% | 100% (expert) | |
|---|---|---|---|---|
| VAE | 0.7236 | 0.8474 | 0.8586 | 0.9776 |
| WindowVAE | 0.6959 | 0.7333 | 0.7550 | 0.9554 |
SSIL (VAE) results using 100, 300, and 600 expert state-action pairs as input have 12.2%, 1.17%, and 36.8% improvements over MixGAIL, as shown in Table I. In the case of SSIL (windowVAE), results using 100, 600, and 1200 expert state-action pairs as input show improvements of 563%, 31.2%, and 0.112% compared to MixGAIL, as shown in Table I. SSIL (VAE) using 1200 expert state-action pairs and SSIL (windowVAE) using 300 expert state-action pairs show 87.8% and 98.3% of the performance of corresponding results of MixGAIL, as shown in Table I. From the results, it can be inferred that SSIL has an advantage over MixGAIL when the expert data is scarce, and the SSIL shows a similar ability to MixGAIL when the data is relatively abundant. In addition, the comparison results show that the discrimination process using VAE is reliable.
SSIL (VAE), SSIL (windowVAE) vs SSIL (MDN), SSIL (GPR)
In the fourth experiment, the different algorithms for evaluating the unlabeled data are compared. Leverage value evaluation methods, VAE and windowed VAE, are compared with GPR and MDN. The comparison is shown by the performance of SSIL trained with the leverage value calculated from each evaluation method. This experiment verifies the validity of the proposed leverage value quality assessments.
The performances of SSIL trained using leverage values from GPR (SSIL (GPR)) and MDN (SSIL (MDN)) were relatively poor compared to SSIL (VAE) and SSIL (windowVAE), except for the case of SSIL (MDN) using 300 expert state-action pairs for training. Especially, SSIL (GPR) showed worse performance than SSIL (windowVAE) in every case. The performance gain of SSIL (windowVAE) over SSIL (GPR) varies from 2.14% to 537%. SSIL (MDN) showed 0.661% to 85.4% better performance than SSIL (VAE) in most cases except for the case using 600 state-action pairs to input, as shown in Table I. However, except for the case using 300 state-action pairs to input, SSIL (windowVAE) shows the superior result to SSIL (MDN), with performance improvement varying from 1.6% to 219%, as shown in Table I. Considering the standard deviation results shown in Table I, the best algorithm among the three evaluation methods is SSIL (VAE), as we think that SSIL (VAE) is the sweet spot between standard deviation and performance. Therefore, one can claim that the proposed leverage value quality assessment is adequate for the proposed algorithm.
Leverage Value Comparison
Finally, the correlations of the leverage value and the quality of demonstrations are shown using different qualities of negative data. The qualities of negative data are calculated based on the reward function of the environment. We compare the leverage value of different qualities of negative demonstrations to show that the leverage value reflects the quality of data. The quality of the negative data is split into three parts: 0 to 25% of the maximum score, 25% of the maximum score to 50% of the maximum score, and 50% of the maximum score to 75% of the maximum score. The expert data is also used to compare this algorithm for the baseline. This comparison verifies the positive correlation between quality and leverage value.
The results show that the leverage value and the quality of demonstrations have a positive correlation in both VAE and windowed VAE, as shown in Table II. Both results of the evaluation algorithms show that the evaluation methods (VAE, windowVAE) validly evaluate the reliability of unlabeled demonstrations.
IV-B Real-World RC Car Experiment
We apply the proposed method to learn an RC Car controller in the real world to empirically prove that not only the reconstruction loss is an effective method of discriminating and labeling unlabeled data, but also the performance of the proposed method stands out among the compared methods.
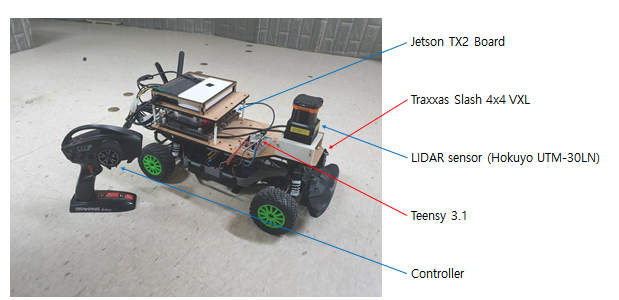
IV-B1 RC Car Environment Setup
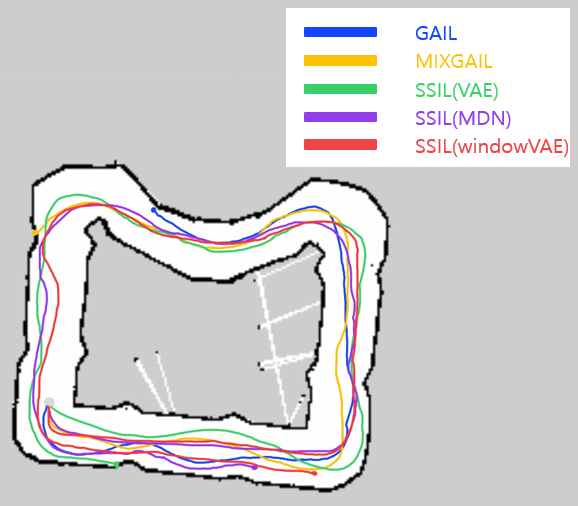
The environment’s input dimension is 20, which consists of the 19 LiDAR sensor values and the action from a timestep before. The action dimension is one, which represents the steering of the RC car. The initial state’s action is given as zero. The objective of this task is to drive around the circuit (see Figure 1). If a collision occurs before rotating around the circuit once, the trajectory is ended immediately.
In this experiment, we do not change the number of expert state-action pairs. One expert trajectory is composed of 401 state-action pairs. We pre-train all five algorithms with behavior cloning[10] to initialize the training. Similar to the simulation environment, the unlabeled data will be given to MixGAIL as negative demonstrations. Also, the leverage values of input labeled expert data are set to 1.
This experiment’s reward function is proportional to how much the RC car has traveled along the track. Since we give the RC car a constant speed, we used the timestep as the performance measure.
| evaluation metric | GAIL | MixGAIL | SSIL (MDN) | SSIL (VAE) | SSIL (windowVAE) |
|---|---|---|---|---|---|
| maximum score | 0.679 | 0.721 | 0.813 | 0.786 | 0.808 |
| standard deviation | 0.086 | 0.051 | 0.089 | 0.050 | 0.051 |
IV-B2 Collecting Expert and Negative Demonstrations
Expert demonstrations are collected by controlling the RC car manually. The expert demonstrations consist of 4,010 state-action pairs, which are ten trajectories. We use 2,005 state-action pairs, which is a half of the expert demonstrations, as labeled state-action pairs. The other 2,005 state-action pairs are given as unlabeled data with other 1,170 negative demonstrations by selecting 250-300 state-action pairs each from four different qualities of under-trained policies. The negative demonstrations were collected from under-trained GAIL. These demonstrations include episodes where RC car collides with walls. Note that to show the robustness of our algorithms in the real world, the track used to collect data is different from the track used to train the algorithm.
IV-B3 RC Car Experimental Results
GAIL, MixGAIL, and SSIL are trained three times, each using different random seeds. The plotted graph is the average rewards per training step and standard deviations. The snapshots of the experiments are shown in Figure 2.
The numerical results are shown in Table III. The results of SSIL with leverage values calculated from VAE are 9.02% higher than MixGAIL and 15.8% higher than the original GAIL, but its average performance was worse than that of SSIL trained with MDN leverage values. As shown in Table III, the SSIL using VAE has a lower average standard deviation than GAIL and SSIL trained with MDN leverage values and shows a similar average standard deviation to MixGAIL.
The windowed VAE version of SSIL also shows higher performance than GAIL and MixGAIL and similar performance to SSIL trained with MDN leverage value. The windowed VAE version of SSIL shows performance gains of 19% and 12.1% compared to GAIL and MixGAIL, respectively, and has a lower standard deviation than GAIL and SSIL trained with MDN leverage values, as shown in Table III.
We would like to emphasize that the standard deviation of GAIL is the second-highest since the algorithm is tested on a similar but different track from the track used to collect the training data. MixGAIL showed worse performance than all SSIL methods because the unlabeled data were not labeled correctly, causing it to be seen as negative, although it is actually expert data. This process causes the constraint reward to be contaminated with wrong information. On the other hand, SSIL trained with VAE and windowed VAE safely discriminates and labels expert data, causing the standard deviation during training to lower and show better performance. This labeling process allows the proposed algorithm to gain valid information about each unlabeled data from the leverage constraint reward, allowing our agent to explore the environment safely. Also, SSIL trained with MDN shows a similar maximum score to windowed VAE but has a much higher standard deviation, from which we can infer that MDN leverage value is less stable than windowed VAE value.
V Conclusion
This paper has considered handing unlabeled, perhaps sub-optimal, demonstrations in imitation learning. We have proposed a method to discriminate the demonstration at the state-action pair level. Moreover, we have proposed a new reward incentive called leverage constraint reward that is suited for continuous evaluation of demonstrations, which is called leverage. As shown in Table II, the estimated leverage values correspond to the quality of data. The SSIL has been able to show better performance than the baseline algorithms in TORCS simulations, when the labeled expert demonstrations are less than 1% of the total demonstrations. In the RC car experiment, SSIL has shown a significant performance improvement over GAIL and MixGAIL in terms of the traveral distance when given similar amounts of data.
References
- [1] N. Naus and J. Jeuring, “Building a generic feedback system for rule-based problems,” in Proc. of the Trends in Functional Programming - 17th International Conference, College Park, MD, USA, ser. Lecture Notes in Computer Science, June 8-10, 2016.
- [2] W. Zhao, M. A. Reinthal, D. D. Espy, and X. Luo, “Rule-based human motion tracking for rehabilitation exercises: Realtime assessment, feedback, and guidance,” IEEE Access, vol. 5, pp. 21 382–21 394, 2017.
- [3] W. Xiao, N. Mehdipour, A. Collin, A. Y. Bin-Nun, E. Frazzoli, R. D. Tebbens, and C. Belta, “Rule-based optimal control for autonomous driving,” in Proc. of the ACM/IEEE 12th International Conference on Cyber-Physical Systems, Nashville, Tennessee, USA, May 19-21, 2021.
- [4] J. Schulman, S. Levine, P. Abbeel, M. I. Jordan, and P. Moritz, “Trust region policy optimization,” in Proc. of the 32nd International Conference on Machine Learning, Lille, France, July 6-11, 2015.
- [5] J. Schulman, F. Wolski, P. Dhariwal, A. Radford, and O. Klimov, “Proximal policy optimization algorithms,” CoRR, vol. abs/1707.06347, 2017.
- [6] B. R. Kiran, I. Sobh, V. Talpaert, P. Mannion, A. A. Al Sallab, S. Yogamani, and P. Pérez, “Deep reinforcement learning for autonomous driving: A survey,” IEEE Transactions on Intelligent Transportation Systems, pp. 1–18, 2021.
- [7] J. Chen, B. Yuan, and M. Tomizuka, “Model-free deep reinforcement learning for urban autonomous driving,” in Proc. of the IEEE Intelligent Transportation Systems Conference, Auckland, New Zealand, October 27-30, 2019.
- [8] K. Lee, S. Kim, S. Lim, S. Choi, M. Hong, J. I. Kim, Y. Park, and S. Oh, “Generalized Tsallis entropy reinforcement learning and its application to soft mobile robots,” in Proc. of the Robotics: Science and Systems XVI, Virtual Event / Corvalis, Oregon, USA, July 12-16, 2020.
- [9] G. Dulac-Arnold, D. J. Mankowitz, and T. Hester, “Challenges of real-world reinforcement learning,” CoRR, vol. abs/1904.12901, 2019.
- [10] C. Sammut, “Behavioral cloning,” in Encyclopedia of Machine Learning and Data Mining, C. Sammut and G. I. Webb, Eds. Boston, MA: Springer US, 2017, pp. 120–124.
- [11] J. Ho and S. Ermon, “Generative adversarial imitation learning,” in Proc. of the Advances in Neural Information Processing Systems 29, Barcelona, Spain, December 5-10, 2016.
- [12] H. Xiao, M. Herman, J. Wagner, S. Ziesche, J. Etesami, and T. H. Linh, “Wasserstein adversarial imitation learning,” CoRR, vol. abs/1906.08113, 2019.
- [13] K. Lee, S. Choi, and S. Oh, “Maximum causal Tsallis entropy imitation learning,” in Proc. of the Advances in Neural Information Processing Systems, Montréal, Canada, December 3-8, 2018.
- [14] K. Hausman, Y. Chebotar, S. Schaal, G. S. Sukhatme, and J. J. Lim, “Multi-modal imitation learning from unstructured demonstrations using generative adversarial nets,” in Proc. of the Advances in Neural Information Processing Systems, Long Beach, CA, USA, December 4-9, 2017.
- [15] Y. Li, J. Song, and S. Ermon, “InfoGAIL: Interpretable imitation learning from visual demonstrations,” in Proc. of the Advances in Neural Information Processing Systems, Long Beach, CA, USA, December 4-9, 2017.
- [16] A. Mandlekar, Y. Zhu, A. Garg, J. Booher, M. Spero, A. Tung, J. Gao, J. Emmons, A. Gupta, E. Orbay, S. Savarese, and L. Fei-Fei, “ROBOTURK: A crowdsourcing platform for robotic skill learning through imitation,” in Proc. of the 2nd Annual Conference on Robot Learning, Zürich, Switzerland, 29-31 October, 2018.
- [17] S. Choi, K. Lee, and S. Oh, “Robust learning from demonstrations with mixed qualities using leveraged Gaussian processes,” IEEE Transactions on Robotics, vol. 35, no. 3, pp. 564–576, 2019.
- [18] ——, “Robust learning from demonstration using leveraged Gaussian processes and sparse-constrained optimization,” in Proc. of the IEEE International Conference on Robotics and Automation, Stockholm, Sweden, May 16-21, 2016.
- [19] ——, “Scalable robust learning from demonstration with leveraged deep neural networks,” in Proc. of the IEEE/RSJ International Conference on Intelligent Robots and Systems, Vancouver, BC, Canada, September 24-28, 2017.
- [20] G. Lee, D. Kim, W. Oh, K. Lee, and S. Oh, “MixGAIL: Autonomous driving using demonstrations with mixed qualities,” in Proc. of the IEEE/RSJ International Conference on Intelligent Robots and Systems, Las Vegas, NV, USA, October 24, 2020 - January 24, 2021.
- [21] D. Loiacono, L. Cardamone, and P. L. Lanzi, “Simulated car racing championship: Competition software manual,” CoRR, vol. abs/1304.1672, 2013.
- [22] J. An and S. Cho, “Variational autoencoder based anomaly detection using reconstruction probability,” Special Lecture on IE, vol. 2, no. 1, pp. 1–18, 2015.
- [23] C. Bishop, “Mixture Density Networks,” Aston University, Birmingham, U.K., Tech. Rep. NCRG/94/004, February, 1994.
- [24] C. E. Rasmussen and C. K. I. Williams, Gaussian Processes for Machine Learning (Adaptive Computation and Machine Learning). The MIT Press, 2005.
- [25] S. Choi, K. Lee, S. Lim, and S. Oh, “Uncertainty-aware learning from demonstration using mixture density networks with sampling-free variance modeling,” in Proc. of the IEEE International Conference on Robotics and Automation, Brisbane, Australia, May 21-25, 2018.