On the scarcity of redshifted OH and millimetre-band molecular absorption
Abstract
Despite much searching, redshifted decimetre and millimetre-band absorption by molecular gas remains very rare, limited to just six systems at . Detection of these transitions can yield precise diagnostics of the conditions of the star forming gas in the earlier Universe, the hydroxyl (OH) radical being of particular interest as in the cm ground state there are four different transitions located close to H i 21-cm and thus detectable with the Square Kilometre Array and its pathfinders. The four transitions of OH have very different dependences on the fundamental constants, thus having much potential in testing for any evolution in these over large look-back times. By collating the photometry in a uniform manner, we confirm our previous hypothesis that the normalised OH absorption strength is correlated with the optical–near-infrared red colour of the sight-line. Applying this to the published searches, we find that all, but one (J0414+054), have simply not been searched sufficiently deeply. We suggest that this is due to the standard selection of sources with reliable optical redshifts introducing a bias against those with enough dust with which to shield the molecular gas. For the single source searched to sufficient depth, we have reason to suspect that the high degree of reddening arises from another system along the sight-line, thus not being inconsistent with our hypothesis. We also show that the same optical redshift bias can account for the scarcity of millimetre-band absorption.
keywords:
galaxies: active – quasars: absorption lines – radio lines: galaxies – galaxies: high redshift – techniques: photometric – methods: data analysis1 Introduction
Although neutral hydrogen (H i) has been detected through cm absorption in 142 redshifted () sources (Curran 2021 and references therein), absorption by the hydroxyl (OH) radical at cm remains rare, with only five detections at these redshifts (Chengalur et al., 1999; Kanekar & Chengalur, 2002; Kanekar et al., 2003, 2005). As well as tracing the molecular, and hence cool star-forming, gas, OH in this band is of particular interest as there are four hyperfine transitions (at 1612, 1665, 1667 & 1720 MHz), each of which has a different dependence on various combinations of the fundamental constants (fine structure, electron–proton mass ratio, proton g-factor). The main advantage is that the absorption is known to arise along the same sight-line (Darling, 2003), thus bypassing the possible line-of-sight differences which plague optical-band data (Murphy et al., 2003b) and could therefore contribute to the observed evolution in the fine structure constant over the past 12 billion years (Webb et al. 2011 and references therein). Furthermore, the frequency shifts of the of radio-band lines are an order of magnitude more sensitive to a change in the fine structure constant than the optical-band lines (Curran et al., 2004).
Despite much searching, however, redshifted OH absorption remains scarce. As a possible explanation, Curran et al. (2006) noted that each of the detections arose along a very red sight-line, with an optical–near-infrared colour of , whereas the non-detections tended to be bluer. Although has been detected in the rest-frame ultraviolet-band in damped Lyman- absorption systems (DLAs, e.g. Levshakov & Varshalovich 1985; Balashev et al. 2014; Noterdaeme et al. 2015), with colours , these have much lower molecular fractions than detectable in OH (Curran et al., 2011a). This suggests that the selection of optically bright sources introduces a bias against dustier, and more molecular rich, sight-lines. Since then there have been many more searches for OH absorption (Curran et al., 2007, 2008, 2011b, 2016; Allison et al., 2017; Curran et al., 2017; Grasha et al., 2019, 2020; Dutta et al., 2020; Zheng et al., 2020; Gupta et al., 2021b), resulting in only one new detection (at , Gupta et al. 2018a).
Although we have previously noted a possible correlation between the OH absorption strength and the optical–near-infrared colour of the sight-line, this is rarely considered in the discussion of the low detection rates (e.g. Gupta et al. 2018a; Zheng et al. 2020). Given that surveys for decimetre-band absorption lines (H i & OH) are currently underway on the pathfinder telescopes of the Square Kilometre Array (SKA)111Specifically, the First Large Absorption Survey in H i on the Australian Square Kilometre Array Pathfinder (Allison et al. 2020) and the MeerKAT Absorption Line Survey (Gupta et al., 2021a), we revisit our hypothesis by adding the results of the OH searches made since. In order to be applicable to future large surveys, we formalise the collation of the magnitude measures, obtaining these in an automated and more uniform manner than previously. We then normalise the OH limits according to our suspicion that the line width is close to that of the H i 21-cm, before discussing the limits in the context of the detected OH and millimetre-band absorption systems.
2 Analysis
2.1 OH searches
In the sixteen years since the last published OH detection, there has only been one further detection, at a redshift of (Gupta et al., 2018a). Four of these six redshifted absorbers arise in galaxies intervening the sight-line to a more distant source providing the radio continuum, with the remaining two associated with the continuum source itself. Furthermore, for the OH absorbers we note that:
- –
-
–
At the time, at least five were located along very red sight-lines, with optical–near-infrared colours of , which suggested that the reddening was due to dust which protected the molecules from the ambient ultra-violet field (Curran et al., 2006).
- –
We therefore consider the OH searches to date in which H i 21-cm absorption has been detected222In the absence of an a priori redshift, spectral scans in the millimetre-band are very observationally expensive, due to the narrow relative bandwidths at GHz (Murphy et al., 2003a)., which we list in Table 1.
| Sight-line | Type | Hydrogen | Hydroxyl | |||||||
|---|---|---|---|---|---|---|---|---|---|---|
| FWHM | Ref. | FWHM | Ref. | |||||||
| CGRaBS J0111+3906 | 0.66847 | A | 43.7 | 94 | O06 | 19 | C10 | — | 15.07 | |
| PKS 0132–097 | 0.76335 | I | 7.06 | 151 | K03a | 4.00 | 130 | K05 | 22.55 | 13.58 |
| B2 0218+35 | 0.688466 | I | 2.65 | 53 | K03b | 0.401 | 61 | K03b | 21.92 | 14.85 |
| [HB89] 0248+430 | 0.0519 | I | 0.42 | 21 | G18a | 0.08 | 19 | G18a | — | 14.56 |
| 4C +05.19 (J0414+054) | 0.95974 | I | 0.88 | 49 | C07 | 4.3 | C07 | 24.14 | 13.77 | |
| PKS 0428+20 | 0.219 | A | 1.90 | 475 | V03 | 85.5 | O05 | 14.47 | ||
| PKS 0500+019 | 0.58467 | A | 3.4 | 100 | C98 | 18 | C06 | 15.56 | ||
| B3 0839+458 | 0.1919 | A | 25.9 | 79.2 | M17 | 1.64 | Z20 | 19.77 | 14.33 | |
| SDSS J084957.97+510829.0 | 0.3120 | I | 0.95 | 11 | G13 | 0.9 | G18a | — | 13.97 | |
| WISE J085042.24+515911.6 | 1.3265 | I | 15.3 | 30 | G09 | 1.1 | D20 | 19.17 | 15.26 | |
| WISEA J085244.73+343540.6 | 1.3095 | I | 6.91 | 48 | G09 | 0.4 | D20 | 19.40 | 15.08 | |
| WISEA J090325.55+162256.0 | 0.1823 | A | 8.98 | 163 | M17 | 1.62 | Z20 | 18.88 | 13.92 | |
| 3C 216 (0906+430) | 0.670 | A | 0.67 | 285 | V03 | 30 | G19 | 18.48 | 14.56 | |
| 2MASS J09422198+0623362 | 0.12368 | A | 49.9 | 50 | S15 | 3.3 | G18a | 19.51 | 15.13 | |
| B3 1036+464 | 0.1861 | A | 14.75 | 86 | M17 | 1.63 | Z20 | — | 14.77 | |
| SDSS J104257.58+074850.5 | 0.0331 | I | 0.19 | 3.6 | B10 | 1.5 | G18a | 18.97 | — | |
| PKS 1107–187 | 0.48909 | A | 0.99 | 50 | C10 | 10 | C10 | 15.23 | ||
| [HB89] 1127–145 | 0.31272 | I | 3.41 | 47 | G20 | 30 | G20 | 19.51 | 15.13 | |
| 2MASX J11233202+2350475 | 0.2070 | A | 5.01 | 220 | M17 | 1.66 | Z20 | 19.35 | 13.95 | |
| B3 1241+410 | 0.0169 | I | 2.24 | 15 | G18b | 1.4 | G18a | 20.01 | — | |
| [HB89] 1243–072 | 0.436734 | I | 1.50 | 4.4 | G20 | 30 | G20 | 20.13 | — | |
| 2MASS J12415751+6332417 | 0.143 | I | 2.90 | 40 | G10 | 1.2 | G18a | 18.20 | 15.14 | |
| WISEA J130132.60+463402.9 | 0.2055 | A | 4.24 | 172 | M17 | 1.65 | Z20 | 19.38 | 13.67 | |
| [HB89] 1413+135 | 0.24671 | A | 7.1 | 18 | C92 | 0.023 | 8 | K02 | 21.15 | 14.86 |
| WISEA J142210.83+210554.2 | 0.1915 | A | 8.36 | 180 | M17 | 1.64 | Z20 | — | 14.84 | |
| B2 1504+37 | 0.67343 | A | 24.5 | 57 | C98 | 0.42 | 45 | K02 | 22.68 | 15.52 |
| WISEA J153452.94+290919.9 | 0.2010 | A | 6.77 | 234 | M17 | 1.65 | Z20 | 19.80 | 14.56 | |
| 2MASX J17081524+2111175 | 0.2241 | A | 28.4 | 211 | M17 | 1.68 | Z20 | 20.47 | 13.79 | |
| PKS 1830–21 | 0.885316 | I | 5.5 | 199 | C99 | 1.33 | 239 | C99 | 15.38 | |
| PKS 2052+005 | 0.20153 | I | 29.9 | 150 | D16 | 1.64 | Z20 | 21.13 | 15.43 | |
| PKS 2252–089 | 0.6064 | A | 11.0 | 94 | C10 | 10 | C10 | 22.30 | 16.91 | |
| 3C 459 (2313+03) | 0.2199 | A | 0.388 | 164 | V03 | 30 | G19 | 17.44 | 13.92 | |
References: C92 – Carilli et al. (1992), C98 — Carilli et al. (1998), C99 – Chengalur et al. (1999), K02 – Kanekar & Chengalur (2002), K03a – Kanekar & Briggs (2003), K03b – Kanekar et al. (2003), V03 – Vermeulen et al. (2003), K05 – Kanekar et al. (2005), O05 – O’Dea et al. (2005), O06 – Orienti et al. (2006), C06 – Curran et al. (2006), C07 – Curran et al. (2007), G09 – Gupta et al. (2009), B10 – Borthakur et al. (2010), C10 – Curran et al. (2011b), G10 – Gupta et al. (2010), G13 – Gupta et al. (2013), S15 – Srianand et al. (2015), D16 – Dutta et al. (2017), M17 – Maccagni et al. (2017), G18a – Gupta et al. (2018a), G18b – Gupta et al. (2018b), G19 – Grasha et al. (2019), D20 – Dutta et al. (2020), G20 – Grasha et al. (2020), Z20 – Zheng et al. (2020).
2.2 Colours
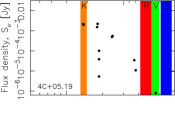
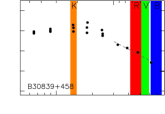
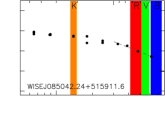
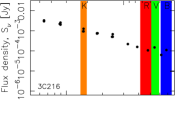
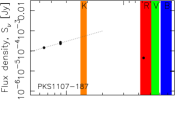
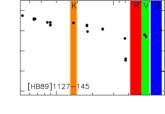
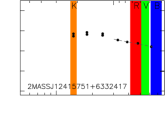
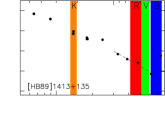
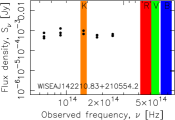
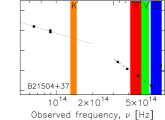
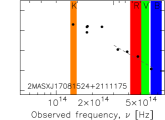
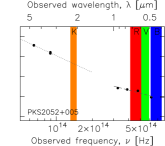
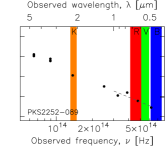
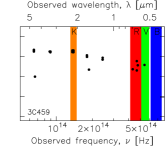
Previously (Curran et al., 2006, 2007, 2008, 2011b), the colours came from a variety of disparate sources in the literature. As well as being non-uniform, this is not ideal when considering a large number of sources, which will be the case in the analysis of SKA and SKA pathfinder data. We therefore use a similar method to that of Curran & Moss (2019), where the photometry are scraped from NASA/IPAC Extragalactic Database (NED), the Wide-Field Infrared Survey Explorer (WISE, Wright et al. 2010) and the Two Micron All Sky Survey (2MASS, Skrutskie et al. 2006). If a datum fell into either the or -bands, this was used, with multiple values being averaged. If not, this was extrapolated from a power-law fit to near-by bands – the WISE & -bands for and the & -bands for (Fig. 1).
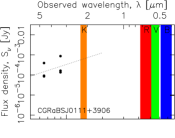
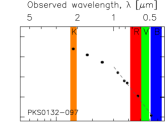
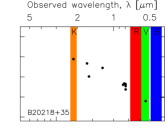
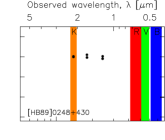
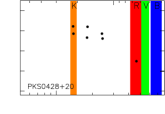
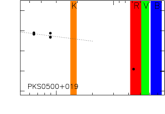


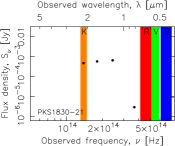
Our photometry scraping does not yield a magnitude for PKS 1830–21. Although, we had previously (e.g. Curran et al. 2007) used , we have no record of the magnitude’s origin. Being one of the few detections, this is important for our analysis and so on the presumption that , and using the measured , we assign . We apply the same reasoning to the other sources with a magnitude but no measurement nor fit — for PKS 0428+20 , giving , PKS 0500+019 , giving and for PKS 1107–187 , giving . Although as yet unsearched for OH absorption, we note that PKS B1740–517, detected in CO (Allison et al., 2019), thus being the only other detected redshifted rotational-band absorber (Sect. 3.3), has giving .
2.3 OH limits
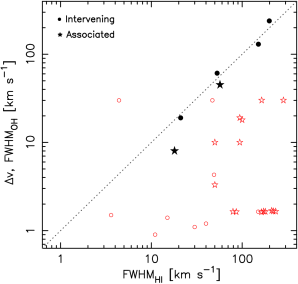
As seen from Table 1, the limits to the non-detections are given at a wide variety of spectral resolutions, therefore requiring normalisation (see Curran 2012). It was previously noted that for the OH detections the full width at half-maxima of the profiles were very similar to those of the H i (Curran et al., 2007).333As per the literature, when discussing OH we are referring to the 1667 MHz transition. Showing FWHM versus FWHM in Fig. 2, we see this is also the case for the new detection, [HB89] 0248+430 (Gupta et al., 2018a), with the only real outlier being the absorber in [HB89] 1413+135. For this, FWHM (Carilli et al., 1992) compared to FWHM , which we obtain from our own fit as only the total width of is quoted (Kanekar & Chengalur, 2002). With an rms noise level of 1.6 mJy per and a peak of mJy, from our fitting, this is a weak detection making the line width quite uncertain. Therefore,
2.4 Results
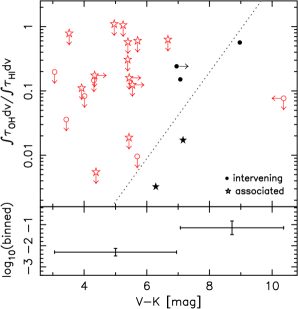
Since our previous analysis of the relationship between the absorption strength and colour (Curran et al., 2011b), there has only been one new detection of OH (Gupta et al., 2018a), although a plethora of non-detections (Curran et al., 2016, 2017; Gupta et al., 2018a, 2021b; Grasha et al., 2019, 2020; Dutta et al., 2020; Zheng et al., 2020). As stated above, all OH absorbers were previously detected in H i 21-cm absorption and so we consider only these (Table 1). In order to incorporate the limits (Fig. 3), we use the Astronomy SURVival Analysis (asurv) package (Isobe et al., 1986) which adds these as censored data points, allowing a generalised non-parametric Kendall-tau test.444Since asurv cannot apply an upper and lower limit simultaneously, we do not include the three non-detections with lower limits (Sect. 2.2).
In Table 2, we summarise the two-sided probability of the observed distributions occuring by chance and the associated significance, assuming Gaussian statistics. Although, due to the small number of OH detections, the correlations are not greatly significant,
| Normalised | Un-normalised | ||||
|---|---|---|---|---|---|
| Description | |||||
| With 4C +05.19 limit | 21 | 0.018 | 0.0058 | ||
| No 4C +05.19 limit | 21 | 0.028 | 0.018 | ||
| Detections only | 5 | 0.033 | 0.040 | ||
it is apparent from Fig. 3 that all but one of H i absorbers searched for OH absorption have not reached the required sensitivity based upon the degree of reddening. For the only source which has been, 4C +05.19 (J0414+054), there is much debate over the origin of its extremely red colour (), whether it arises in the intervening gravitational lens responsible for the H i absorption (Curran et al., 2007), the background emitter (Falco et al., 1997; Tonry & Kochanek, 1999), which also exhibits strong H i 21-cm absorption (Moore et al., 1999), or another possible foreground object (Elíasdóttir et al., 2006; Tanna et al., 2013). We therefore flag the optical–near-infrared colour as . Using this upper limit and the lower limit to PKS 1830–21 (Sect. 2.2), results in a significance of for the normalised OH line-strength and for the un-normalised line-strength. These fall to , respectively, when is used and , respectively, for the five detections with measurements only.
In addition to 4C +05.19, for one other source the normalised OH strength appears close to detection (Fig. 3, left) – PKS 2052+005, which has and . This limit is based upon the rms noise level of mJy per after removal of the bandpass ripple, although RFI still affects the bandpass close to the expected absorption frequency (Zheng et al., 2020).
In the bottom panels of Fig. 3, we show the binned values, where the upper limits are included via the Kaplan-Meier estimator (Kaplan & Meier, 1958). This gives a maximum likelihood estimate based upon the parent population (Feigelson & Nelson, 1985) and requires at least one detection in each bin, limiting the number of bins to two. From this, it is clear that, even without the limits555It is not possible to simultaneously include the limits in the binning, but we can see how the normalised OH absorption strength varies between the two bins., there is a positive correlation between the OH absorption strength and the degree of reddening.
3 Discussion
3.1 Depth of current OH searches
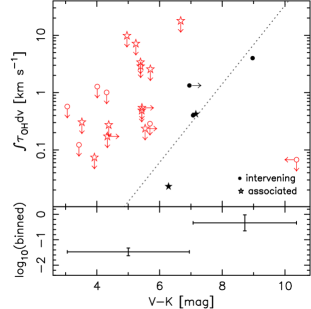
By adding all of the published searched for OH absorption to date and formalising the measurement of the optical–near-infrared colour, we confirm our previous assertion that the OH absorption strength is correlated with the colour (Curran et al., 2006). This has a physical motivation, since we expect higher molecular abundances along dustier sight-lines, which would be evident through a higher degree of reddening. Nevertheless, this is usually not a consideration when discussing the scarcity of redshifted OH absorption (e.g. Gupta et al. 2018a; Zheng et al. 2020). Here we show that, for the sensitivities reached by these surveys, the sources are simply not sufficiently red, which is most likely due to a bias towards the most optically bright sources, in which spectroscopic redshifts are more readily available (e.g. in DLAs). For instance, Gupta et al. (2018a) note that the absorber with the highest H i column density666Actually integrated optical depth (see Curran et al. 2013). in their sample, 2MASS J09422198+0623362, exhibits no OH absorption at a limit of per 3.3 channel. This has and, from the normalised fit (Fig. 3, left),
| (1) |
where , we expect and, from the un-normalised fit (Fig. 3, right),
| (2) |
we expect . Resampling the limit to FWHM, gives per , which is significantly higher than either estimate thus explaining the non-detection.
For the only H i absorber which has been searched sufficiently deeply, but not detected in OH, there has been some debate over the source of the reddening, whether in the gravitational lens, the host galaxy, or an another intervening galaxy (Sect. 2.3). We note that the H i 21-cm absorption in the host galaxy is five times stronger than in the lens ( , Moore et al. 1999, cf. , Curran et al. 2007) and, since the 21-cm absorption strength is also correlated with (Curran et al., 2019), we may expect the bulk of the reddening to occur in the host galaxy. However, Moore et al. (1999) did not detect HCN absorption to a optical depth limit of at . It should be noted, however, that, although there is strong H i and OH absorption in the absorber towards PKS 0132–097, HCO+ was undetected at a limit of per 5 channel (Kanekar et al., 2005). This was subsequently detected with (Wiklind et al., 2018) and so it is possible that 4C +05.19 could also be subject to the same apparent variability. In any case, the non-detection of HCN could be due to the smaller filling factor of the millimetre-band molecular absorption (Zwaan & Prochaska, 2006), whereas the OH is more diffuse, as evident through the profile widths tracing those of the H i (Fig. 2).
3.2 Reddening of 4C +05.19
In order to check the validity of placing an upper limit on the red colour due to the gravitational lens towards 4C +05.19, we can compare this sight-line with a large sample of quasi-stellar objects (QSOs) to gauge just how likely it is that the reddening is due to a single object. For this we use the photometry compiled by Curran et al. (2021) for the first 100 337 QSOs with accurate spectroscopic redshifts () of the Sloan Digital Sky Survey (SDSS) Data Release 12 (DR12, Alam et al. 2015). With a central wavelength of nm, the -band is located between the SDSS ( nm) and ( nm) bands. We would therefore expect for 4C +05.19. Only two sources satisfy this condition (Fig. 4),
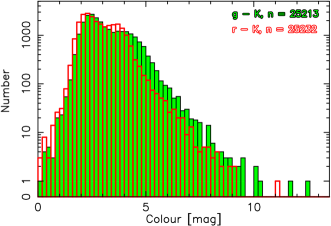
SDSS J113415.20+392826.1 (), with , and SDSS J150759.72+041512.1 (), with (and ). Out of sources, this makes the colour of 4C +05.19 extremely rare. We note that the two SDSS sources are also at high redshift, thus being more likely to be subject to additional reddening due to intervening gas along the sight-line.777The obvious way to quantify this would be the correlation between colour and redshift, but since this is in the observed-frame it is an inconsistent measure of the source properties over a large redshift range (Curran & Moss, 2019). It is therefore perfectly plausible that all of the reddening towards 4C +05.19 is not solely due to the intervening lens and that the host galaxy would be a good candidate for OH absorption. Assuming the power-law fits to the detected OH absorbers, we estimate the reddening due to the gravitational lens to be (Equ. 1) and (Equ. 2), both of which remain relatively high limits.
3.3 Millimetre-band absorption
In the millimetre (mm)-band the many rotational transitions of the large variety of molecules provide an excellent probe of the physical and chemical conditions of the gas and its potential for star formation (e.g. Israel 1988; Aalto et al. 1995; Henkel et al. 2005). Sensitive temperature measurements from the relative line strengths can also offer extremely accurate measures of the cosmic evolution of the microwave background temperature at various look-back times (Wiklind & Combes, 1997; Muller et al., 2013) and time delays due to molecular absorbing gravitational lenses can be used to measure cosmological parameters (Wiklind & Combes, 2001). Furthermore, since these transitions are insensitive to the value of the fine structure constant, but sensitive to the electron–proton mass ratio, mm-band lines provide useful “anchors” to measure shifts in the line frequencies and diagnostics of the values of the fundamental constants at large look-back times (Drinkwater et al., 1998; Curran et al., 2004).
However, these are equally as rare, with the five OH absorbers, in conjunction with the CO absorption in the radio galaxy PKS B1740–517 (Allison et al., 2019), constituting all of the redshifted mm-band absorbers. There has also been a number of non-detections of the strongest transitions (CO, HCO+ & HCN)888See Combes & Wiklind (1997); Muller et al. (2011, 2016, 2017); Wallström et al. (2019); Tercero et al. (2020) for the other detected transitions. published (Wiklind & Combes, 1995, 1996b; Drinkwater et al., 1996; Murphy et al., 2003a; Curran et al., 2008, 2011a)99957 transitions along 43 different sight-lines., the majority of which have been searched to sufficiently deep sensitivities based upon their colour (Curran et al., 2011a). However, applying the same prerequisite as for the OH searches, only three, [HB89] 0438–436, PKS 0500+019 & PKS 1107–187, have been detected in H i 21-cm absorption.101010Although several are DLAs, i.e. strongly detected in H i Lyman- absorption. The latter two belong to the OH sample (Table 1) and have been searched in HCO+ and CO , respectively (Curran et al., 2011a), with [HB89] 0438–436 having been searched in CO (Drinkwater et al., 1996).
Again, the noise levels of the non-detections are quoted at various spectral resolutions (0.51 – 3.4 ) and so we must normalise each one according to the expected line-width. In Fig. 5, we show the approximate millimetre band profile widths111111Often these are not given (Wiklind & Combes, 1998, 1996a; Wiklind et al., 2018; Muller et al., 2013) and have to be estimated from FWHM (e.g. Allison et al. 2013). versus that of the H i 21-cm.
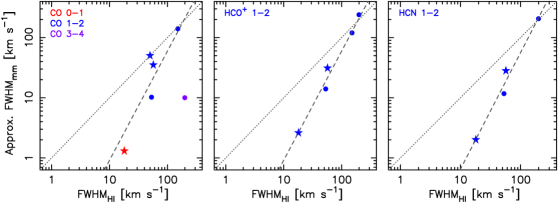
From this we see that, in general, FWHMFWHM, with the divergence decreasing with increasing line width. Although we fit the data with a power law, we suspect that the H i and mm line widths remain equal at FWHM . This non-equivalence could be due to the dense mm-band absorbing gas being more localised than a more diffuse OH, although this requires the OH to be non-coincident with the other molecular species. Alternatively, Curran et al. (2007) suggested that the non-detection of mm-band absorption in 4C +05.19 (and PKS 0132–097) could be due to the millimetre wavelength emission, as opposed to or in addition to the absorption, being much more localised than that at decimetre wavelengths, so that a molecular cloud has a much smaller chance of occulting the higher frequency radiation. However, as seen in Fig. 5, FWHMFWHM with increasing line width, which would suggest that these have correspondingly larger mm-emission regions. While high resolution imaging in the millimetre-band is available for the two broadest absorbers, PKS 0132–097 and PKS 1830–21, revealing the lensed components (Wiklind et al. 2018; Muller et al. 2020, respectively), imaging of the remaining sight-lines would be required to confirm this.
Resampling the limits to the FWHM expected from the HCO+ transition121212The CO data could not be fit and the smaller sample of HCN data have a similar fit., in Fig. 6, we show the limits together with the absorption strengths of the most commonly detected transitions versus the optical–near-infrared colour.
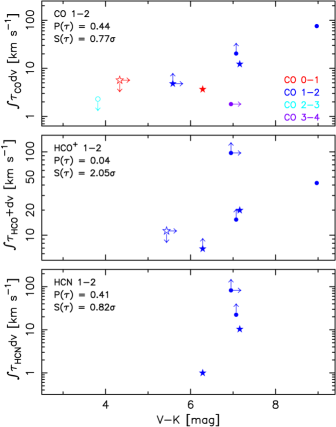
Note that some of the detections are lower limits, since the millimetre-band absorption is often optically thick, and so the assumption that the optical depth, , is the ratio of the observed optical depth to the fraction of flux intercepted, , cannot be made. That is,
Due to the lower limits, we cannot obtain a least-squares fit and, although the correlations are weak due to the very limited numbers, an increase in (and ) with is evident. From this it is clear that, although many sources have been searched to sufficiently deep limits on the basis of their colour alone (Curran et al., 2011a), those few which have also been detected in H i 21-cm fall far short of the required sensitivities. This re-emphasises the need to target extremely red sight-lines (), which have previously been detected in 21-cm absorption.
4 Conclusions
Since the suggestion that the strength of redshifted OH absorption is correlated with the optical–near-infrared colour of the sight-line (Curran et al., 2006), there have been many unsuccessful searches for OH absorption. However, these studies do not take the red colour into account, leading to some puzzlement with regard to the continual non-detections (e.g. Gupta et al. 2018a). Here we add the new to the previous searches and, taking into account that all of the six known OH absorbers were previously detected in H i 21-cm absorption:
-
1.
In order to be applicable to future searches with the SKA and its pathfinders, rather than compiling the magnitudes from the variety of disparate sources in the literature (e.g. Curran et al. 2008), we automate and formalise the attainment of the colour by:
-
(a)
Scraping the photometry from NED, 2MASS and WISE, extracting the and magnitudes from the former two.
-
(b)
Where these are not available, extrapolating from near-by bands (WISE & for the mid-infrared and & for the visible).
-
(c)
And, where only a single optical-band photometry datum exists which is outside, but close to, the -band, we use this to place a limit on the magnitude.
-
(a)
-
2.
In order to normalise the limits, since FWHMFWHM, we re-sample the limits to FWHM, giving the limit of a single channel smoothed to FWHM.
From the resulting OH absorption strengths we find that, according to their colour, only one of the published limits is sufficiently sensitive to detect OH absorption. This is in the gravitational lens towards 4C +05.19 (Curran et al., 2007). However, this sight-line contains at least one other H i 21-cm absorber (Moore et al., 1999) and the source of its extremely red colour () has long been a subject of debate (Falco et al., 1997; Tonry & Kochanek, 1999; Elíasdóttir et al., 2006). Comparing the colour with those of a large sample of QSOs, we find this to be at the tail of the distribution ( of the sample). Using the fits to the known OH absorbers, we estimate the colour due to the lens to be (based upon the un-normalised limit ) and ( limit). Given that the 21-cm absorption in the continuum source is five times stronger than in the lens, suggests that the host quasar is likely to contribute significantly to the degree of reddening.
Using for 4C +05.19 and adding the limits as censored data points, we find that the observed — and — distributions to be significant at and , respectively. Although not highly significant, due to the low number of non-censored data points (five of the detections), binning of the data shows a clear correlation between the normalised OH strength and the colour of the sight-line, thus confirming that the degree of reddening is a key contributor in the detection of molecular absorption.
Since five of the redshifted OH absorbers are the same sources in which the equally elusive mm-band absorbers have been detected, we apply the same prerequisite of H i 21-cm absorption. Although several sources have been searched in CO and HCO+ absorption to sufficiently deep limits based upon their colour (Curran et al., 2011a), those three which have been detected in H i 21-cm have not. Thus, we demonstrate that the degree of reddening is also crucial in the detection of the rotational transitions. This could explain the severe dearth in redshifted mm-band absorption (also limited to six detections), with previous searches having been biased towards sources which are sufficiently bright in the optical-bands (e.g. damped Lyman- absorbers) to yield a redshift, to which to tune the narrow band millimetre receivers. As per the OH, we therefore suggest that sight-lines with detected in 21-cm absorption should be targetted in order to increase the number of known molecular absorbers in both the millimetre and decimetre-bands.
Acknowledgements
I wish to thank the referee for their helpful comments. This research has made use of the NASA/IPAC Extragalactic Database (NED) which is operated by the Jet Propulsion Laboratory, California Institute of Technology, under contract with the National Aeronautics and Space Administration and NASA’s Astrophysics Data System Bibliographic Service. This research has also made use of NASA’s Astrophysics Data System Bibliographic Service and asurv Rev 1.2 (Lavalley et al., 1992), which implements the methods presented in Isobe et al. (1986).
Data availability
Data available on request.
References
- Aalto et al. (1995) Aalto S., Booth R. S., Black J. H., Johansson L. E. B., 1995, A&A, 300, 369
- Alam et al. (2015) Alam S. et al., 2015, ApJS, 219, 12
- Allison et al. (2013) Allison J. R., Curran S. J., Sadler E. M., Reeves S. N., 2013, MNRAS, 430, 157
- Allison et al. (2019) Allison J. R. et al., 2019, MNRAS, 482, 2934
- Allison et al. (2017) Allison J. R. et al., 2017, MNRAS, 465, 4450
- Allison et al. (2020) Allison J. R. et al., 2020, MNRAS, 494, 3627
- Balashev et al. (2014) Balashev S. A., Klimenko V. V., Ivanchik A. V., Varshalovich D. A., Petitjean P., Noterdaeme P., 2014, MNRAS, 440, 225
- Borthakur et al. (2010) Borthakur S., Tripp T. M., Yun M. S., Momjian E., Meiring J. D., Bowen D. V., York D. G., 2010, ApJ, 713, 131
- Carilli et al. (1998) Carilli C. L., Menten K. M., Reid M. J., Rupen M. P., Yun M. S., 1998, ApJ, 494, 175
- Carilli et al. (1992) Carilli C. L., Perlman E. S., Stocke J. T., 1992, ApJ, 400, L13
- Carilli et al. (1993) Carilli C. L., Rupen M. P., Yanny B., 1993, ApJ, 412, L59
- Chengalur et al. (1999) Chengalur J. N., de Bruyn A. G., Narasimha D., 1999, A&A, 343, L79
- Combes & Wiklind (1997) Combes F., Wiklind T., 1997, Academie des Sciences Paris Comptes Rendus Serie B Sciences Physiques, 5, 297
- Curran et al. (2016) Curran S., Allison J. R., Whiting M. T., Sadler E. M., Combes F., Pracy M. B., Bignell C., Athreya R., 2016, MNRAS, 457, 3666
- Curran et al. (2017) Curran S., Whiting M. T., Allison J. R., Tanna A., Sadler E. M., Athreya R., 2017, MNRAS, 467, 4514
- Curran (2012) Curran S. J., 2012, ApJ, 748, L18
- Curran (2021) Curran S. J., 2021, MNRAS, 506, 1548
- Curran et al. (2013) Curran S. J., Allison J. R., Glowacki M., Whiting M. T., Sadler E. M., 2013, MNRAS, 431, 3408
- Curran et al. (2007) Curran S. J., Darling J. K., Bolatto A. D., Whiting M. T., Bignell C., Webb J. K., 2007, MNRAS, 382, L11
- Curran et al. (2019) Curran S. J., Hunstead R. W., Johnston H. M., Whiting M. T., Sadler E. M., Allison J. R., Athreya R., 2019, MNRAS, 484, 1182
- Curran et al. (2004) Curran S. J., Kanekar N., Darling J. K., 2004, Science with the Square Kilometer Array, New Astronomy Reviews 48, Carilli C. L., Rawlings S., eds., Elsevier, Amsterdam, pp. 1095–1105
- Curran & Moss (2019) Curran S. J., Moss J. P., 2019, A&A, 629, A56
- Curran et al. (2021) Curran S. J., Moss J. P., Perrott Y. C., 2021, MNRAS, 503, 2639
- Curran et al. (2011a) Curran S. J. et al., 2011a, MNRAS, 416, 2143
- Curran et al. (2011b) Curran S. J. et al., 2011b, MNRAS, 413, 1165
- Curran et al. (2006) Curran S. J., Whiting M. T., Murphy M. T., Webb J. K., Longmore S. N., Pihlström Y. M., Athreya R., Blake C., 2006, MNRAS, 371, 431
- Curran et al. (2008) Curran S. J., Whiting M. T., Wiklind T., Webb J. K., Murphy M. T., Purcell C. R., 2008, MNRAS, 391, 765
- Darling (2003) Darling J. K., 2003, PhRvL, 91, 011301
- Drinkwater et al. (1996) Drinkwater M. J., Combes F., Wiklind T., 1996, A&A, 312, 771
- Drinkwater et al. (1998) Drinkwater M. J., Webb J. K., Barrow J. D., Flambaum V. V., 1998, MNRAS, 295, 457
- Dutta et al. (2020) Dutta R., Raghunathan S., Gupta N., Joshi R., 2020, MNRAS, 491, 838
- Dutta et al. (2017) Dutta R., Srianand R., Gupta1 N., Momjian E., Noterdaeme P., Petitjean P., Rahmani H., 2017, MNRAS, 465, 588
- Elíasdóttir et al. (2006) Elíasdóttir Á., Hjorth J., Toft S., Burud I., Paraficz D., 2006, ApJS, 166, 443
- Falco et al. (1997) Falco E. E., Lehár J., Shapiro I. I., 1997, AJ, 113, 540
- Feigelson & Nelson (1985) Feigelson E. D., Nelson P. I., 1985, ApJ, 293, 192
- Grasha et al. (2020) Grasha K., Darling J., Leroy A. K., Bolatto A. D., 2020, MNRAS, 498, 883
- Grasha et al. (2019) Grasha K., Darling J. K., Bolatto, A. D. Leroy A., Stocke J., 2019, ApJS, 245, 3
- Gupta et al. (2021a) Gupta N. et al., 2021a, ApJ, 907, 11
- Gupta et al. (2018a) Gupta N., Momjian E., Srianand R., Petitjean P., Noterdaeme P., Gyanchandani D., Sharma R., Kulkarni S., 2018a, ApJ, 860, L22
- Gupta et al. (2010) Gupta N., Srianand R., Bowen D. V., York D. G., Wadadekar Y., 2010, MNRAS, 408, 849
- Gupta et al. (2018b) Gupta N. et al., 2018b, MNRAS, 476, 2432
- Gupta et al. (2013) Gupta N., Srianand R., Noterdaeme P., Petitjean P., Muzahid S., 2013, A&A, 558, A84
- Gupta et al. (2009) Gupta N., Srianand R., Petitjean P., Noterdaeme P., Saikia D. J., 2009, MNRAS, 398, 201
- Gupta et al. (2021b) Gupta N. et al., 2021b, ApJ, 255, 28
- Henkel et al. (2005) Henkel C., Jethava N., Kraus A., Menten K. M., Carilli C. L., Grasshoff M., Lubowich D., Reid M. J., 2005, A&A, 440, 893
- Isobe et al. (1986) Isobe T., Feigelson E., Nelson P., 1986, ApJ, 306, 490
- Israel (1988) Israel F. P., 1988, in Millimetre and Submillimetre Astronomy, Wolstencroft R. D., Burton W. B., eds., Kluwer, Dordrecht, pp. 281–305
- Kanekar & Briggs (2003) Kanekar N., Briggs F. H., 2003, A&A, 412, L29
- Kanekar et al. (2005) Kanekar N. et al., 2005, PhRvL, 95, 261301
- Kanekar & Chengalur (2002) Kanekar N., Chengalur J. N., 2002, A&A, 381, L73
- Kanekar et al. (2003) Kanekar N., Chengalur J. N., de Bruyn A. G., Narasimha D., 2003, MNRAS, 345, L7
- Kaplan & Meier (1958) Kaplan E. L., Meier P., 1958, J. Amer. Statist. Assoc., 53, 457
- Lavalley et al. (1992) Lavalley M. P., Isobe T., Feigelson E. D., 1992, in BAAS, Vol. 24, pp. 839–840
- Levshakov & Varshalovich (1985) Levshakov S. A., Varshalovich D. A., 1985, MNRAS, 212, 517
- Maccagni et al. (2017) Maccagni F. M., Morganti R., Oosterloo T. A., Geréb K., Maddox N., 2017, A&A, 604, A43
- Moore et al. (1999) Moore C. B., Carilli C. L., Menten K. M., 1999, ApJ, 510, L87
- Muller et al. (2013) Muller S. et al., 2013, A&A, 551, 109
- Muller et al. (2011) Muller S. et al., 2011, A&A, 535, 103
- Muller et al. (2020) Muller S., Jaswanth S., Horellou C., Martí-Vidal I., 2020, A&A, 641, L2
- Muller et al. (2016) Muller S. et al., 2016, A&A, 595, A128
- Muller et al. (2017) Muller S. et al., 2017, A&A, 606, A109
- Murphy et al. (2003a) Murphy M. T., Curran S. J., Webb J. K., 2003a, MNRAS, 342, 830
- Murphy et al. (2003b) Murphy M. T., Webb J. K., Flambaum V. V., Curran S. J., 2003b, Astrophys. Space Sci., 283, 577
- Noterdaeme et al. (2015) Noterdaeme P., Srianand R., Rahmani H., Petitjean P., Pâris I., Ledoux C., Gupta N., López S., 2015, A&A, 577, A24
- O’Dea et al. (2005) O’Dea C. P., Gallimore J., Stanghellini C., Baum S. A., Jackson J. M., 2005, AJ, 129, 610
- Orienti et al. (2006) Orienti M., Morganti R., Dallacasa D., 2006, A&A, 457, 531
- Skrutskie et al. (2006) Skrutskie M. F. et al., 2006, AJ, 131, 1163
- Srianand et al. (2015) Srianand R., Gupta N., Momjian E., Vivek M., 2015, MNRAS, 451, 917
- Tanna et al. (2013) Tanna A., Curran S. J., Whiting M. T., Webb J. K., Bignell C., 2013, ApJ, 772, L25
- Tercero et al. (2020) Tercero B., Cernicharo J., Cuadrado S., de Vicente P., Guélin M., 2020, A&A, 636, L7
- Tonry & Kochanek (1999) Tonry J. L., Kochanek C. S., 1999, AJ, 117, 2034
- Vermeulen et al. (2003) Vermeulen R. C. et al., 2003, A&A, 404, 861
- Wallström et al. (2019) Wallström S. H. J., Muller S., Roueff E., Le Gal R., Black J. H., Gérin M., 2019, A&A, 629, A128
- Webb et al. (2011) Webb J. K., King J. A., Murphy M. T., Flambaum V. V., Carswell R. F., Bainbridge M. B., 2011, PhRvL, 107, 191101
- Wiklind & Combes (1994) Wiklind T., Combes F., 1994, A&A, 286, L9
- Wiklind & Combes (1995) Wiklind T., Combes F., 1995, A&A, 299, 382
- Wiklind & Combes (1996a) Wiklind T., Combes F., 1996a, Nat, 379, 139
- Wiklind & Combes (1996b) Wiklind T., Combes F., 1996b, A&A, 315, 86
- Wiklind & Combes (1997) Wiklind T., Combes F., 1997, A&A, 328, 48
- Wiklind & Combes (1998) Wiklind T., Combes F., 1998, ApJ, 500, 129
- Wiklind & Combes (2001) Wiklind T., Combes F., 2001, in Gravitational Lensing, Brainerd T. G., Kochanek C. S., eds., ASP Conf. Ser. 237, San Francisco, p. 155
- Wiklind et al. (2018) Wiklind T., Combes F., Kanekar N., 2018, ApJ, 864, 73
- Wright et al. (2010) Wright E. L. et al., 2010, AJ, 140, 1868
- Zheng et al. (2020) Zheng Z., Li D., Sadler E. M., Allison J. R., Tang N., 2020, MNRAS, 499, 3085
- Zwaan & Prochaska (2006) Zwaan M. A., Prochaska J. X., 2006, ApJ, 643, 675