Theoretical investigation of decoherence channels in athermal phonon sensors
Abstract
The creation and evolution of nonequilibrium phonons is central in applications ranging from cosmological particle searches to decoherence processes in qubits. However, the fundamental understanding of decoherence pathways for athermal phonon distributions in solid-state systems remains an open question. Using first-principles calculations, we investigate the primary decay channels of athermal phonons in two technologically relevant semiconductors – Si and GaAs. We quantify the contributions of anharmonic, isotopic, and interfacial scattering in these materials. From this, we construct a model to estimate the thermal power in a readout scheme as a function of time. We discuss the implication of our results on noise limitations in current phonon sensor designs and strategies for improving coherence in next-generation phonon sensors.
I Introduction
Athermal phonon distributions are generated through many types of interactions in condensed matter physics. However, accessing information in these distributions is challenging despite the value this information could bring to efforts including searches for cosmological particles like dark matter Amaral et al. (2020), and for neutrino-less double beta decay experiments Dolinski et al. (2019). Efficient sensing of athermal phonons is also valuable for other scattering events that initially generate other quasiparticles such as excitons, photons, or magnons that readily down convert to phonons Antonius and Louie (2017); Krauss and Wise (1997); Li et al. (2014); Berk et al. (2019); Streib et al. (2019). However, phonon decay processes lead to losses that limit overall detection efficiency. Mitigating these losses is challenging, but research on quantum acoustodynamic circuits has shown that some phonons have coherence times long enough to be used as carriers of quantum information O’Connell et al. (2010); Chu et al. (2017, 2018); Moores et al. (2018), which motivates the study of coherence properties of phonons for sensing.
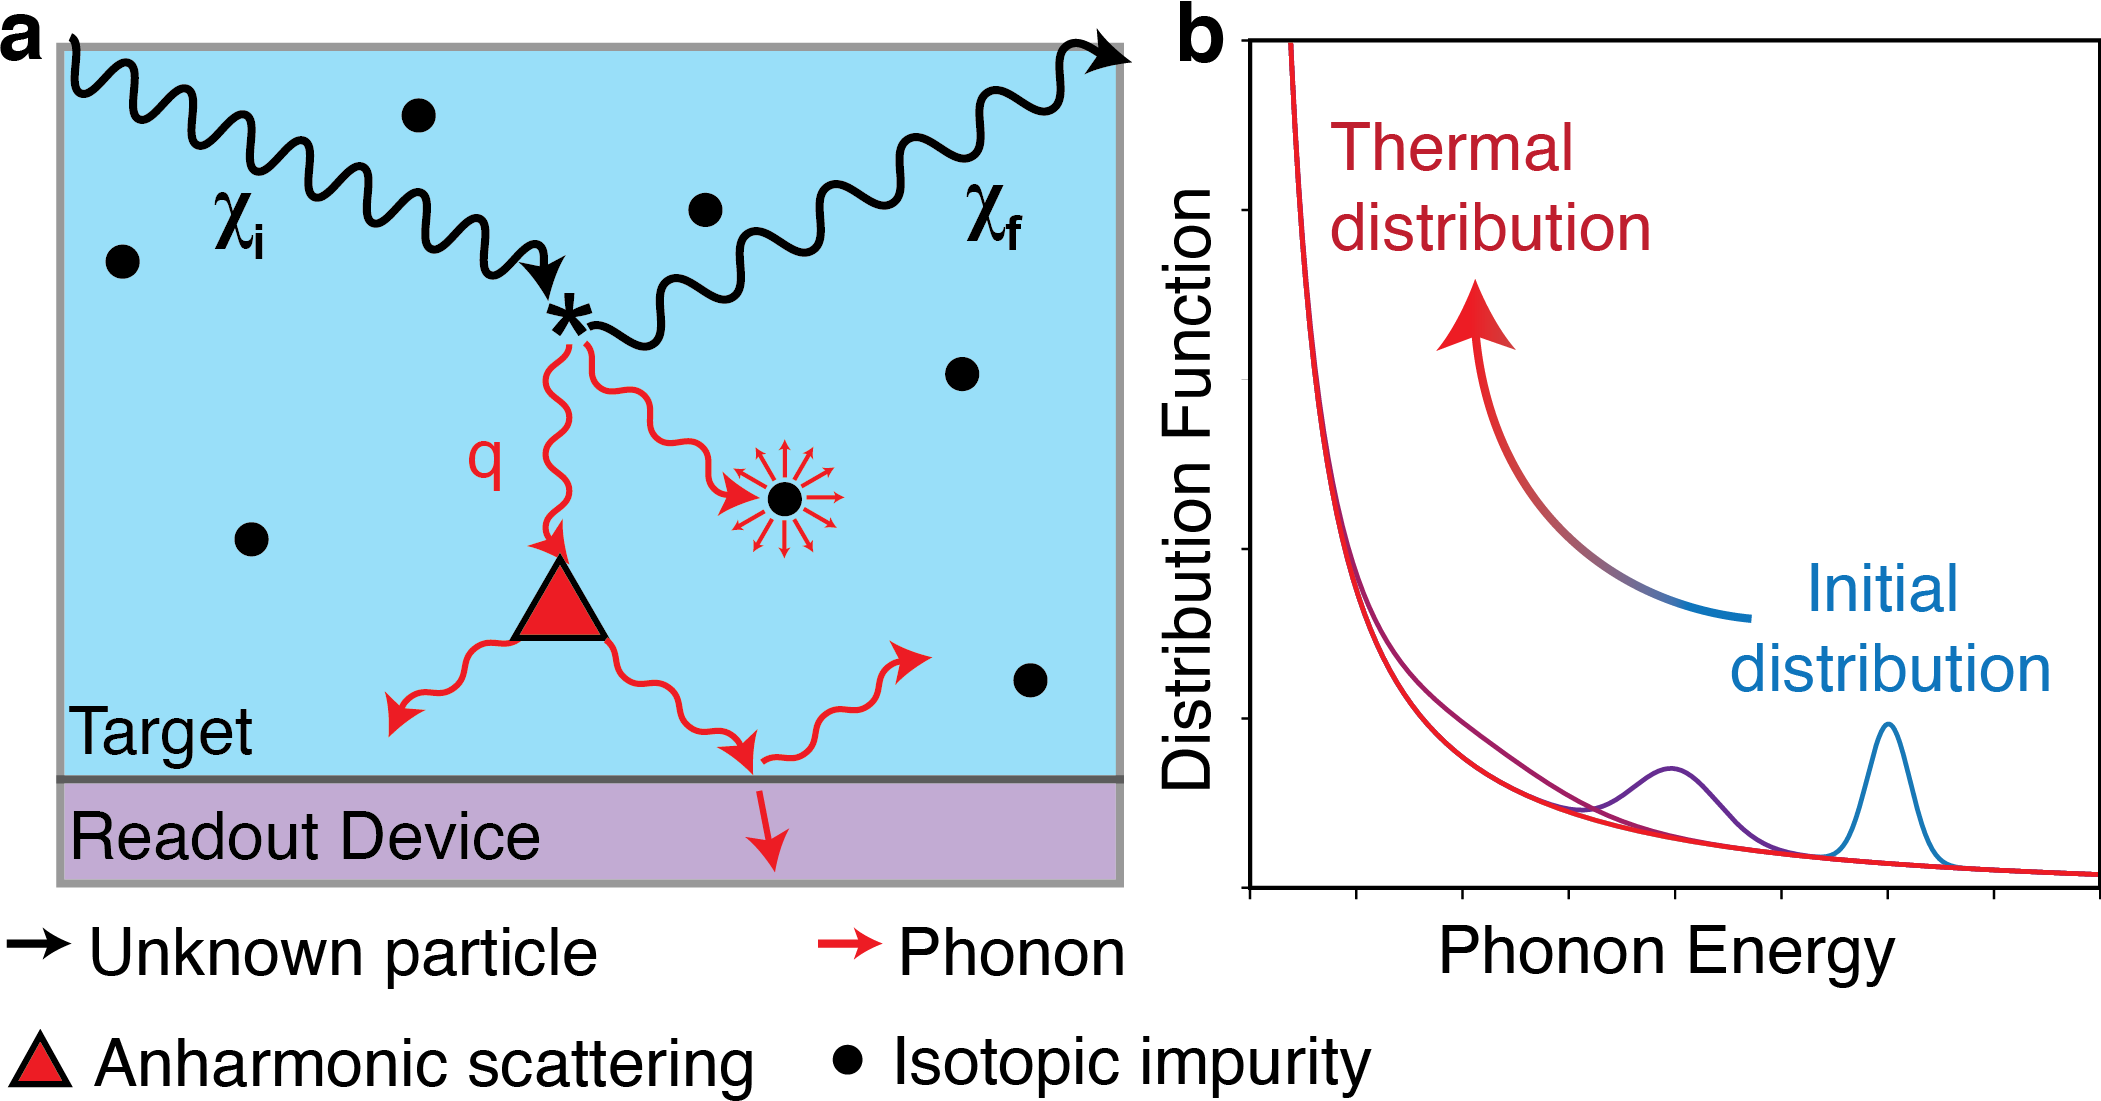
Most non-equilibrium phonon sensors have a readout device attached to a phonon absorber material (also called a “target”) that interacts with an external signal to generate non-equilibrium phonon distributions (see Figure 1). In searches for dark matter, these absorber materials are typically high-quality single-crystal semiconductors such as Si and Ge Agnese et al. (2014); Amaral et al. (2020). Increasing the design space for the types of target materials to lower dark matter masses is a recent focus of the community, with several alternative target materials already identified Knapen et al. (2017); Griffin et al. (2021, 2018); Kurinsky et al. (2019); Griffin et al. (2020); Trickle et al. (2020); Hochberg et al. (2018); Røising et al. (2021); Inzani et al. (2021). Common readout devices include kinetic-inductance detectors (KIDs) Zmuidzinas (2012), metallic magnetic calorimeters Fleischmann et al. (2005), and transition-edge sensors (TES) Irwin et al. (1995); Romani et al. (2018). In particular, TES devices are currently used in low-mass dark matter search experiments such as SuperCDMS and CRESST Amaral et al. (2020); Angloher et al. (2016); Petricca et al. (2020), and KIDs have been used for cosmic microwave background experiments Day et al. (2003). Recent advances have improved the energy resolution of TES devices to energies comparable to that of a single optical phonon Fink et al. (2020), which has critical implications for the detection of sub-MeV dark photons derived from GeV hidden sector dark matter Arkani-Hamed and Weiner (2008); Cheung et al. (2009); Morrissey et al. (2009). A dark photon is a particle that exists in a hypothetical sector of dark matter particles, and dark photons are kinetically mixed with ordinary photons Fabbrichesi et al. (2021), which allow interactions with optical phonons near the Brillouin zone center. A current challenge for the detection of dark photons is that optical phonons near the Brillouin zone center have near-zero group velocities, and cannot be directly detected with current devices. As a result, the phonons created after optical phonon decay must be detected.
The dominant phonon decay mechanisms in solid-state materials are due to anharmonic, isotopic, and surface interactions (see Figure 1). Ab initio calculations, such as density functional theory (DFT) Hohenberg and Kohn (1964); Kohn and Sham (1965), are used to calculate anharmonic and isotopic phonon scattering rates, accurately predicting properties such as heat transfer coefficients and electron/phonon lifetimes Togo et al. (2015); Tamura (1983); Lindsay et al. (2014); Esfarjani et al. (2011). The key requirement for obtaining these properties is accurate calculations of the interatomic potential energy surfaces of the system (e.g. three-phonon matrix elements) – this can either be calculated perturbatively from static DFT calculations, or by sampling the atomic dynamics at a finite temperature using ab-initio molecular dynamics (MD)Ganose et al. (2021); Zhou et al. (2014). The latter observes the phonon dynamics directly at all orders of perturbation theory by calculating the dynamics of a large system over long enough time scales to incorporate the relevant phonons. This makes such MD methods more suitable for higher temperatures where typical phonon wavelengths and lifetimes are smaller than at low temperatures. For low-temperature phenomena, however, the construction of anharmonic matrix elements from static DFT calculations is preferable because quantum effects become more important at temperatures smaller than phonon frequencies. Previous work has found that while anharmonic interactions impact phonon dynamics at low temperatures ( K), the dominant contribution to heat transport at these cryogenic temperatures is surface scattering Glassbrenner and Slack (1964); Carlson et al. (1965). However, a fully atomistic DFT calculation of the interface scattering with both chemical and structural specificity is computationally demanding owing to the large scale of the structures required. As a result, phenomenological models have been developed to describe surface scattering that incorporate materials-specific properties such as the phonon group velocity Morelli et al. (2002), and interfacial properties such as the surface roughness Malhotra and Maldovan (2016).
In this work, we use ab-initio calculations to understand the role of different decay processes on athermal phonon distributions in two of the most prevalent semiconductors in quantum technologies – Si and GaAs Sipahigil et al. (2014); Sukachev et al. (2017); Bluhm et al. (2011); Cao et al. (2016). Si and GaAs are current or near-term targets in phonon-based dark matter direct detection experiments, so understanding the phonon dynamics for these materials is especially timely. GaAs – a polar semiconductor – is of particular interest for dark matter detection since its optical phonons can couple to dark photons, providing a phonon-based pathway for probing dark-photon-based models of the dark sectorGriffin et al. (2018). We first use DFT to calculate nonequilibrium phonon decoherence channels due to anharmonic, isotopic, and surface scattering. We next combine these results with a thermal transport model to calculate the athermal distribution as a function of time, and the rate of phonon energy transport across a readout device interface. We select a specific case that is especially relevant for dark matter detection, namely the creation of a single optical phonon by dark-photon-mediated interactions (see Figure 1b). This case is particularly important for exploring dark photon models in the terahertz range since they are predicted to generate a single optical phonon near the point of the Brillouin zone Griffin et al. (2020). Finally, we discuss the implications of our materials-specific thermal transport model on single phonon detection and suggest routes to improving phonon coherence in such quantum sensing applications in near-term experiments.
II Methods
DFT calculations were performed with the Vienna Ab initio Simulation Package (VASP) Kresse and Hafner (1993); Kresse and Furthmüller (1996) using the PBE functional Perdew et al. (1996). We chose the VASP recommended pseudopotentials in which the 4s, 4p electrons are treated as valence in Ga and As, and the 3s, 3p electrons are treated as valence in Si and Al; all other electrons were frozen into the core of the pseudopotential. We used a 600 eV plane-wave basis, and a Monkhorst-Pack grid of k-points, shifted from the point by half a grid point, for the conventional unit cell. Born effective charges were calculated within VASP using density functional perturbation theory Baroni et al. (2001). We used an electronic convergence criterion of eV, and force minimization criterion of eV/Å. Phonon band structures were calculated with Phonopy Togo and Tanaka (2015) with the force constant matrices calculated with VASP using a supercell of the conventional standard cell, a k-point grid of , and a q-point grid of for all three materials. Anharmonic scattering rates and interaction parameters (square modulus of anharmonic matrix elements) were calculated with Phono3py Togo et al. (2015).
Calculations of the phonon frequencies with isotopic variation were performed using isotopic supercells generated from our own code available at https://github.com/IbraHajar/GaAs_Phonon_Frequencies. In this code, we explicitly include isotopic variation by constructing supercells of atoms with distributions consistent with their natural abundances. The workflow for generating these explicit isotopic supercells is in the Appendix. We wrote a code to build the thermal transport model which is available at https://www.github.com/tfharrelson/MPDSF/scripts/readout_temperature_model. All phonon-related parameters such as those used to construct the matrices in Eq. (8) were calculated using either Phonopy or Phono3py. Numerical integration of Eq. (8) was done via both forward and backward Euler’s method. Forward Euler was used for the small time plots in Figure 5a, and backward Euler was used to compute the curve in Figure 5b. For both methods, we integrated time steps, and the time step was 1 ps, and ps for forward and backward Euler methods, respectively. We chose a time step of 1 ps for the forward Euler method since it is a factor of 10 smaller than the lifetime of any optical phonon (the smallest time scale in the calculation). A time step of 104 ps was chosen for the backward Euler method since 105 time steps could be integrated in a reasonable timeframe to calculate transport up to 1 ms from the initial scattering event. As the backward Euler method is always stable with respect to the time step size, it is determined by computational requirements.
III Results
III.1 First-principles calculations
Si and GaAs adopt the diamond and zincblende crystal structures, respectively (see Supplementary Information). We calculated the lattice parameters to be 5.47 Å and 5.76 Å, consistent with previous calculations Jain et al. (2013) and experiments Chiarotti and Goletti (2005) which have measured the lattice constants to be 5.43 Å and 5.65 Å, respectively. The corresponding phonon band structures were also calculated (see SI, Fig. S1) and agree with previous phonon calculations using first-principles methods Jain et al. (2013).
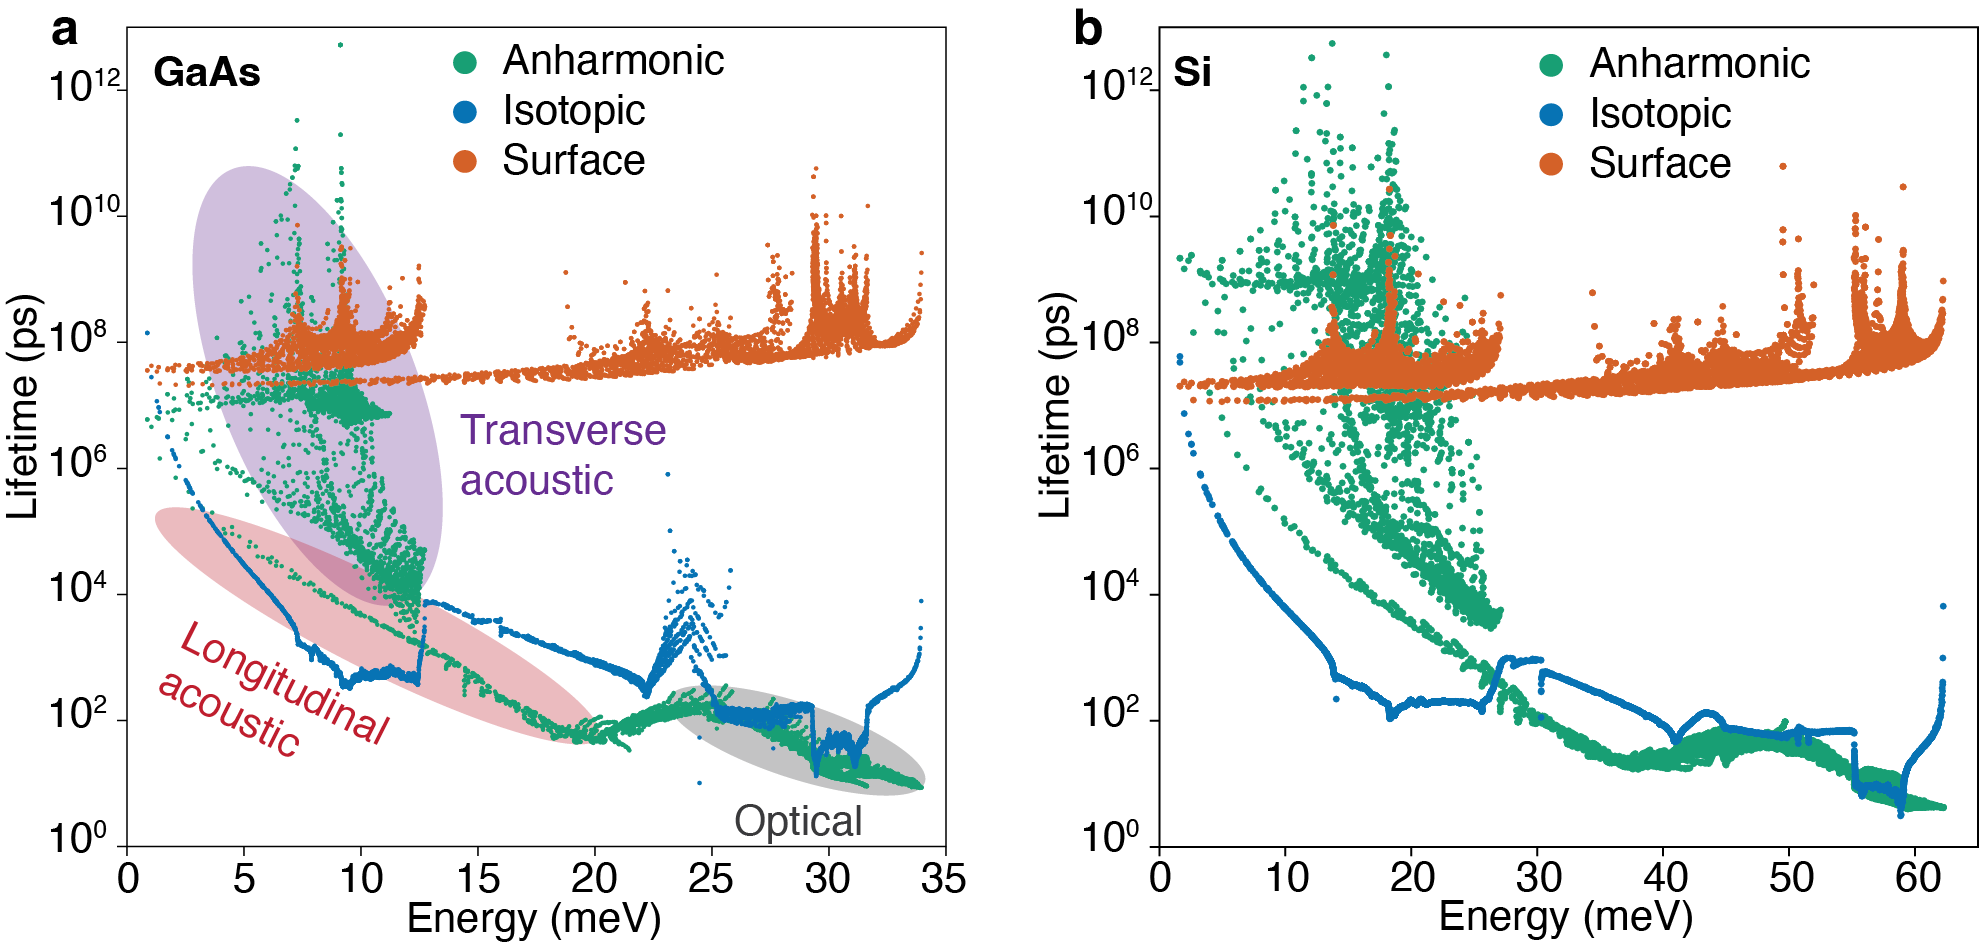
We next calculated the relaxation times associated with isotopic impurities Tamura (1983) and anharmonic interactions Maradudin and Fein (1962) for GaAs and Si, which are shown in Figure 2. The isotopic scattering rates were calculated assuming the natural isotopic distributions of the relevant atoms (92.2% 28Si, 4.7% 29Si, 3.1% 30Si, and 60.1% 69Ga, 39.9% 71Ga), and assuming that the positions of the isotopic impurities are uncorrelated. As expected, we find that the shapes of the distribution of the lifetimes are very similar between GaAs and Si owing to their similar crystal structure and phonon structure (see SI section LABEL:si:sec:pbands for more details). We find that the optical modes (shaded grey in Figure 2a) have relatively short anharmonic decay lifetimes of ps, which agrees with previous experiments Canonico et al. (2002), and suggest that the anharmonic interactions are the dominant decay process for optical modes in these materials. As the phonon energy decreases into the acoustic regions (shaded red and purple), we find that the lifetimes increase, including extremely large anharmonic lifetimes ( s) for transverse acoustic modes at meV for GaAs (shaded purple), and meV for Si. Since transverse acoustic modes typically have a finite group velocity, these modes propagate coherently over macroscopic distances in the absence of other decay processes. Therefore, these acoustic modes are the dominant information carriers of the original scattering event.
III.2 Anharmonic Scattering of a Single Optical Phonon
We next examine the scattering of a single optical phonon mode at the point from anharmonic scattering processes. As mentioned previously, this process is particularly relevant for dark photon models, and so we examine it more closely here. We first calculate the rate at which that optical phonon is anharmonically converted into lower energy phonons in Figure 3a, finding the optical phonon lifetime to be 10.9 ps from anharmonic contributions. We calculate the optical phonon decay channels (interpreted as a probability density of a phonon decaying into a particular secondary channel) via,
| (1) | ||||
| (2) | ||||
where is the three-phonon anharmonic matrix element, is the combined notation for both the branch index and k-point of a specific phonon mode, is the expectation value of the number of phonons in mode , is the frequency of mode , is the frequency-dependent scattering rate, and is called the decay rate probability distribution. In this equation, we group each of the phonons generated by the anharmonic matrix element into energy bins and sum over all allowed matrix elements before normalizing by the integral of the resulting function. In Figure 3a, we observe that the optical modes for GaAs decay most frequently into phonons at meV and meV and the optical modes for Si decay primarily into phonons at meV and meV. Inspection of the phonon band structures for both GaAs and Si (see SI Section LABEL:si:sec:pbands) concludes that all phonons generated by the anharmonic decay are acoustic phonons.
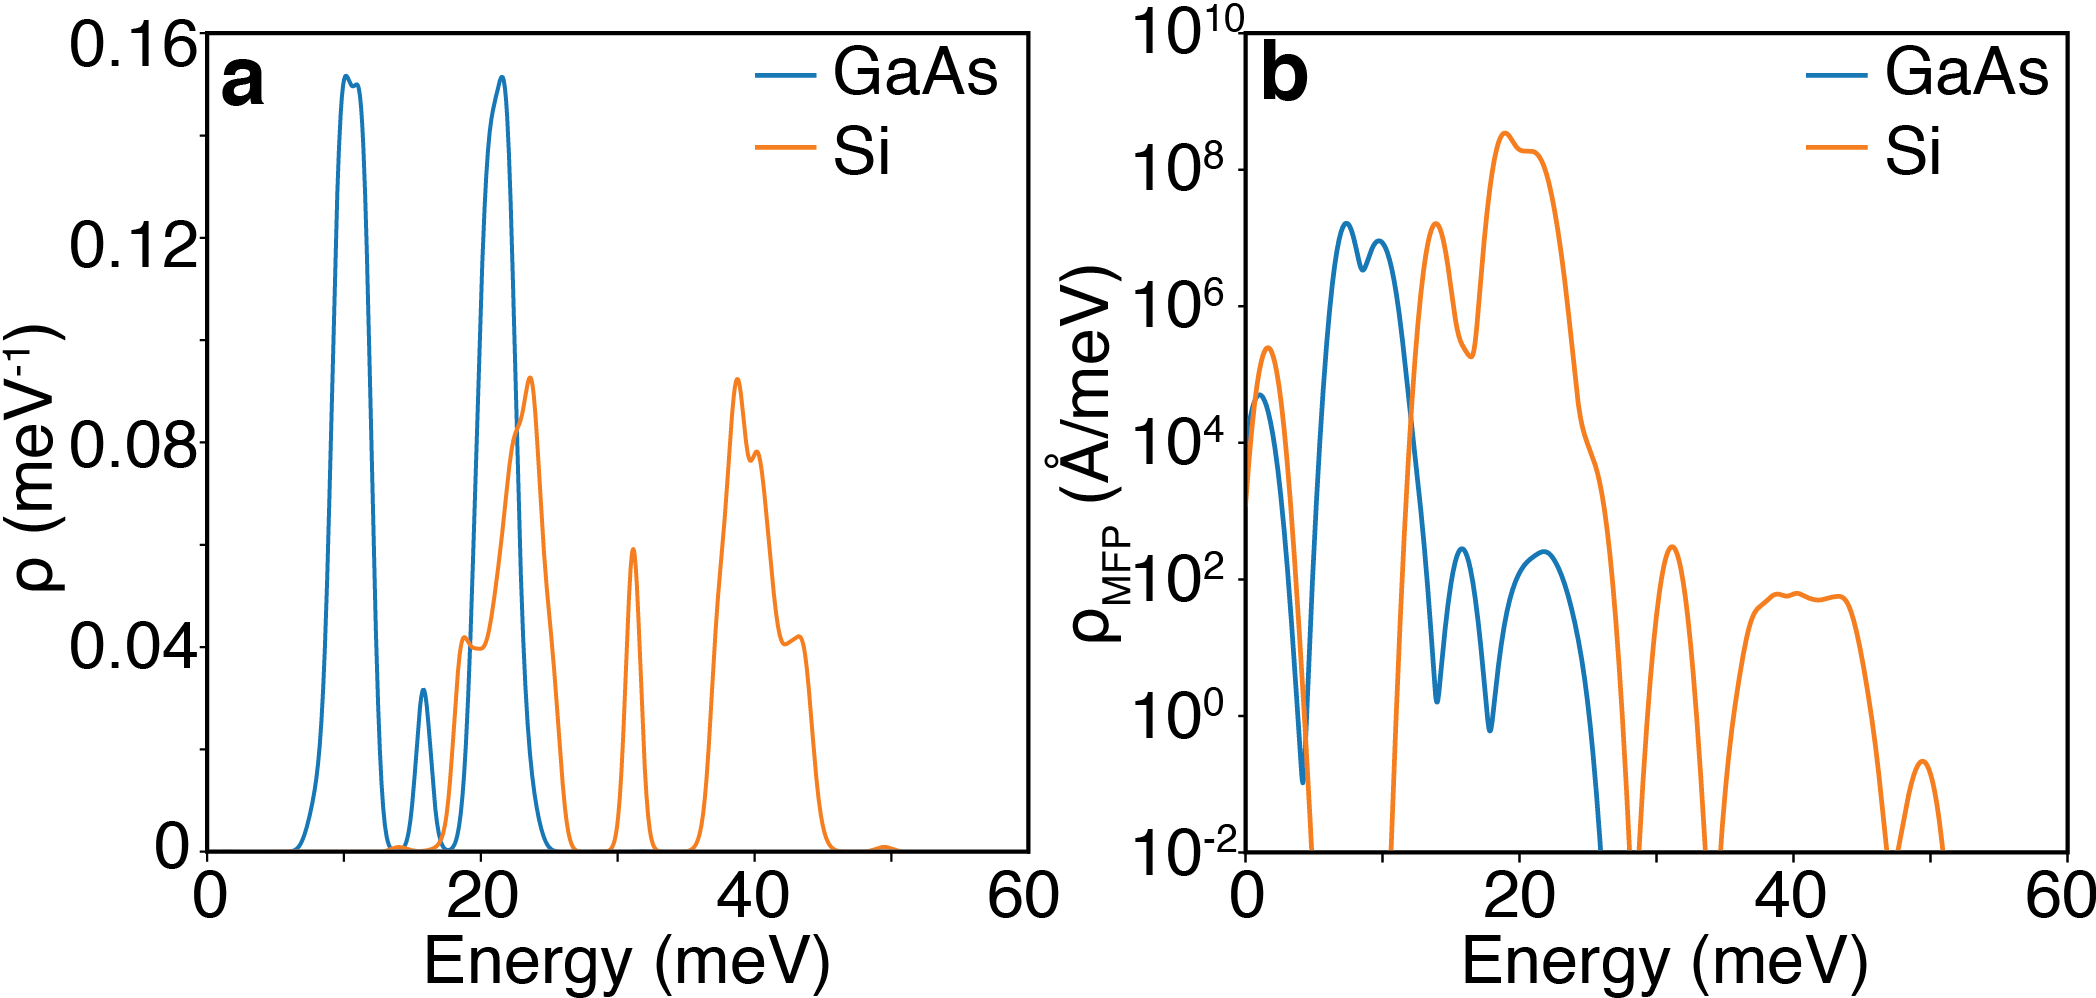
We next use the probability density defined in Eq. (1) to construct mean free path distributions (Figure 3b) for secondary scattered phonon populations. These are defined as,
| (3) |
where is the average mean free path for each phonon with frequency . For clarity, we suppress the mode-specific relaxation times (mean free paths) in this expression, but to evaluate this they are inserted as weighting factors in the sum of Eq. (2) before normalizing against the integral of the rate distribution in Eq. (1). The large mean free paths in Figure 3b demonstrate that the low energy decay channel (10 meV for GaAs and 23 meV for Si) includes a significant contribution of long-lifetime transverse acoustic modes in Figure 2, confirming that these modes are the dominant information carriers in the sensor in the absence of other scattering mechanisms. We also find that phonons centered at meV become relevant despite their apparent absence in Figure 3a since these are long-lived phonons compared to phonons in the other decay channels.
III.3 Isotopic Scattering Effects
As discussed above, while anharmonic contributions to phonon scattering are small for the low-energy decay channels of GaAs and Si, we find that the isotopic contributions are relatively large (see Figure 2), and interfere with the low-energy decay channels of GaAs and Si. For both GaAs and Si, we find that the isotopic scattering is sub-dominant to anharmonic scattering for optical phonons, and becomes dominant for acoustic phonons. We next address the question of whether phonon scattering due to isotopic variation can cause phonons to thermalize (Figure 1b). At first glance, since isotopic scattering matrix elements couple two phonon fields, Fermi’s golden rule would suggest that energy is conserved through the interaction, meaning that isotopic scattering cannot thermalize the phonon distribution. However, heat transport studies find that isotopic scattering rates must be included in a relaxation time model to accurately determine the temperature dependence of the phonon flux Lindsay (2016), suggesting that isotopic scattering rates cannot be ignored in thermalization processes. To explore this, we calculate the frequency of the -point optical mode in GaAs for a series of random isotopic configurations of Ga masses (distributed according to the natural isotopic abundances; see SI section LABEL:si:sec:isotopes). We find that the optical phonon frequency distribution has a finite width, implying that energy is not necessarily conserved in these isotopic scattering processes. In addition, this finite width is similar to the isotopic scattering rate calculated from first principles. Since the isotopic decay rates lead to mean free paths that are much smaller than typical device sizes, we expect that the transport of phonons dominated by isotopic decay is diffusive, causing a substantial reduction in predicted thermal flux (see SI Section LABEL:si:sec:diffusive).
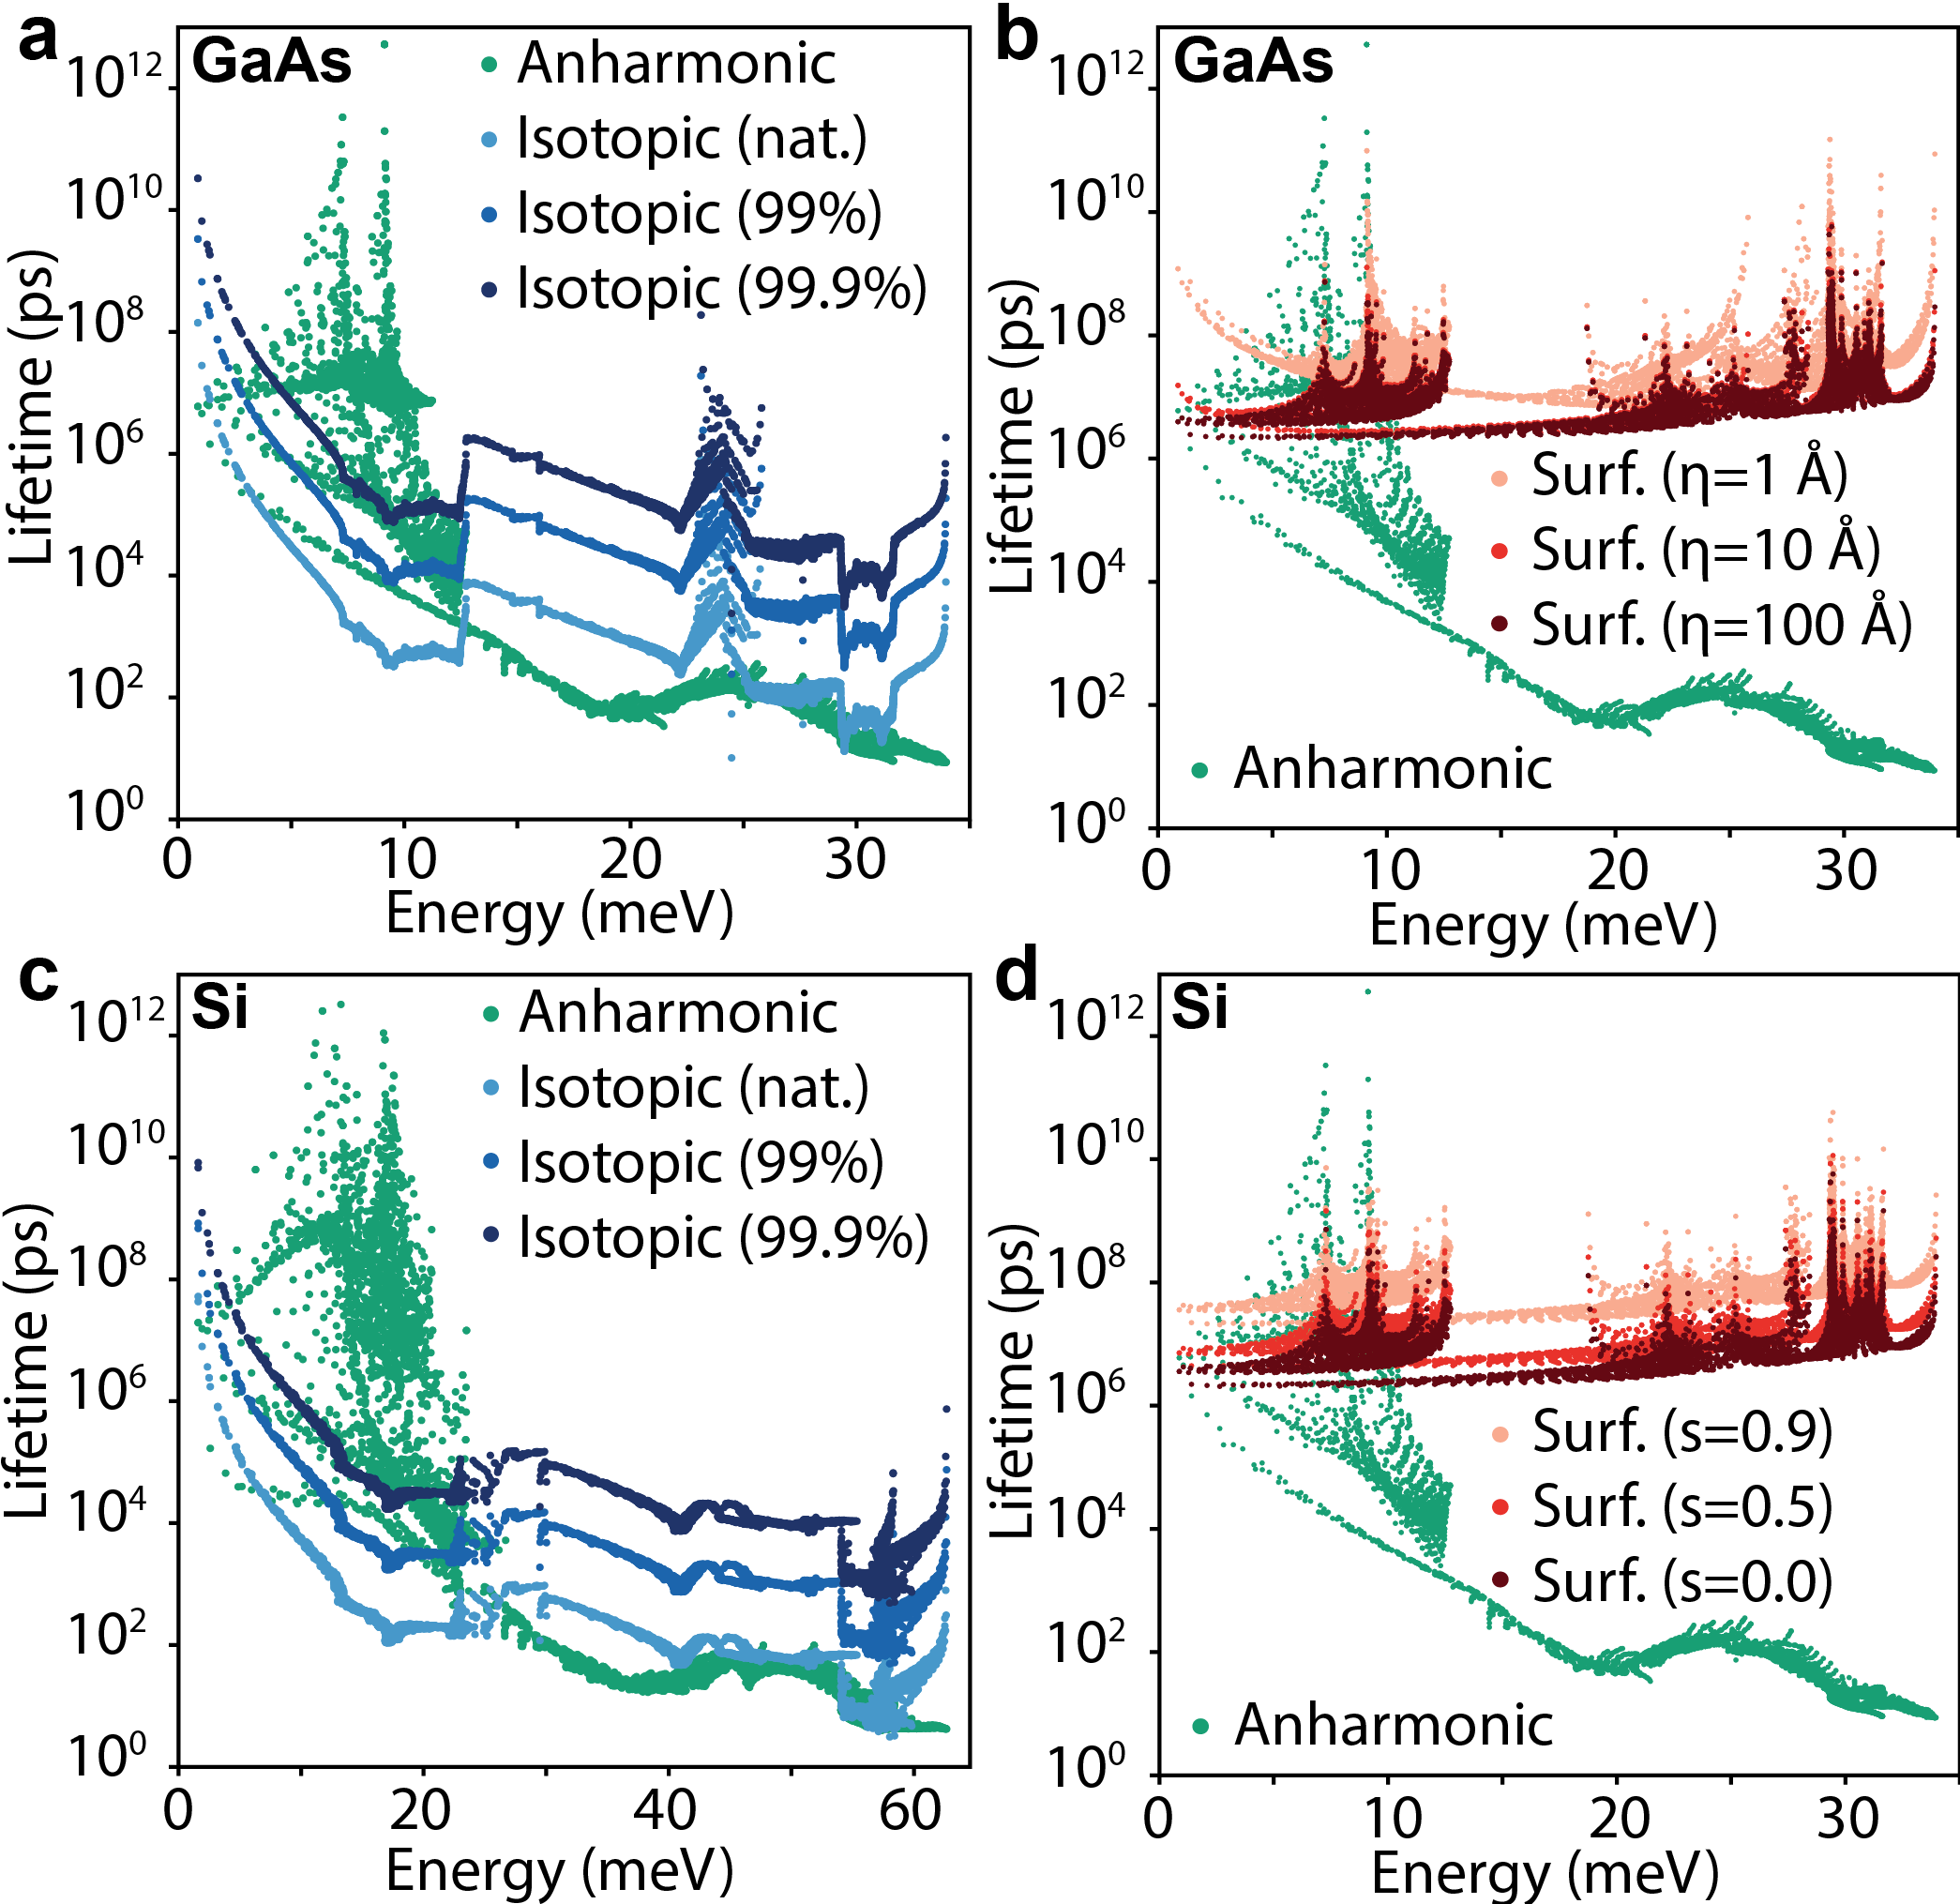
Since we find that isotopic contributions to phonon decoherence need careful consideration for the design of next-generation athermal phonon sensors, we next explore how these scattering sources can be reduced. Mitigation of isotopic decay processes can be achieved through isotopic enrichment of the constituent elements prior to crystal growth. In the past, Si and GaAs have been enriched to 99.99% and 99.4% purity, respectively Veldhorst et al. (2014); Inyushkin et al. (2003). In Figures 4a and 4c, we compare the calculated phonon decay lifetimes due to isotopic scattering at the natural isotopic abundance, at 99% isotopic purity, and at 99.9% isotopic purity. We find that the isotopic decay lifetimes become larger than the longitudinal acoustic lifetimes limited by anharmonic processes at 99% isotopic purity for GaAs and 99.9% for Si. At 99.9% purity, the isotopic lifetimes become comparable to many of the transverse acoustic lifetimes for both materials, indicating that isotopic decay is no longer dominant – but still relevant – for those phonon modes.
III.4 Surface Scattering Effects
The final phonon decay processes we consider are those associated with surfaces and interfaces. We calculated the surface scattering rates using two different analytic models – (1) a phenomenological model from ballistic phonon-interface interactions that account for all inelastic interactions (including defects) in a crude way, and (2) the Kirchhoff model that accounts for the impact of surface roughness on diffusive scattering while assuming there are no inelastic collisions from defects at the interface. The first follows a phenomenological equation,
| (4) |
in which is the surface scattering lifetime, is the group velocity of the phonon mode, is the length of the crystal, and is the specularity parameter determining the fraction of phonons that are specularly (elastically) reflected from the interface. In a previous study Morelli et al. (2002), are not treated as independent variables and rather combined in a single fitting parameter. There, no longer represents the length and is equivalent to fixing and varying in our Eq. (4). In Figure 2, we compare the surface scattering lifetimes with a specularity parameter of 0.9 and a 1 cm crystal size against the anharmonic and isotopic lifetimes. A specularity parameter of 0.9 is equivalent to asserting that the phonon mean free path is 10-fold greater than the crystal size, which reasonably agrees with experimentally measured mean free paths of phononic metamaterials Alaie et al. (2015). We find that the surface scattering rates are typically around 0.1 ms, which is greater than all other lifetimes considered in both materials, aside from the highest transverse acoustic anharmonic lifetimes. In this case, the non-specular surface scattering rates are the limiting factor in the overall phonon lifetime.
One route to reduce surface scattering is to fabricate exceptionally clean and flat surfaces (hence reducing ). To gain more insight into the effect of surface roughness on the scattering specularity, we consider the Kirchhoff surface model Malhotra and Maldovan (2016),
| (5) |
which relates (the momentum-dependent specularity parameter) to , the surface roughness (with units of length), and , the phonon wavevector incident to the interface. Derivation of this equation is given in the SI Section LABEL:si:sec:kirchhoff. The scattering lifetimes are computed by replacing in Eq. (4) with above. In this model, the scattering interactions decrease as the phonon wavelength exceeds the length scale of the interface deformation.
In Figure 4, we plot our calculated lifetimes for phonons in GaAs with different values of surface roughness, (Figure 4b), and a constant specularity parameter, (Figure 4d). We find that a roughness of 1 Å generates lifetimes similar to that of a constant specularity parameter of 0.9 in Figure 4d. While the magnitudes of the lifetimes are similar, we find that the low-energy shapes are qualitatively different – the surface lifetimes Eq. (5) increase with decreasing energy, while the lifetimes from Eq. (4) remain constant with decreasing energy. This difference is due to the strength of the scattering interaction from the Kirchhoff model scaling with the phonon wavevector.
In Figure 4b, we show that the onset of this scaling behavior increases in energy as the surface roughness () decreases. For a surface roughness of Å, the lifetimes become very similar to the lifetimes in Figure 4d, indicating that the phenomenological model in Eq. (4) and the Kirchhoff model coincide for rough interfaces. We expect that a combination of both models is required to explain the surface scattering in experiments because all fabricated material interfaces have some roughness and some defects leading to inelastic scattering. For example, assuming a pure Kirchhoff model could lead to a very inaccurate characterization of the surface scattering if defect scattering rates dominate. The exact details of the surface roughness, defect profile, etc. of the fabricated system are therefore needed for more accurate predictions.
Despite the lack of surface information for our materials, our results in Figure 4 have enough information to draw reasonable conclusions regarding the critical scattering rates in GaAs and Si. For the and Å cases of the phenomenological and Kirchhoff models, respectively, the phonon lifetimes due to surface scattering are between ps, which is significantly larger than many of the anharmonic lifetimes. This indicates that surface scattering is not expected to dominate with reasonably well-polished surfaces until the athermal phonon distribution down converts below meV. Experiments have shown that Si surface roughnesses are of the order of nm Teichert et al. (1995), suggesting that the surface scattering rate is small for well-studied materials like Si and GaAs.
III.5 Thermal transport model
We next construct a model to describe the energy transport into a readout device originating from a non-equilibrium -point optical phonon distribution in a macroscopically-sized GaAs crystal using the ab initio parameters. The equation for the heat flux Swartz and Pohl (1989) is,
| (6) |
where is the mean group velocities of modes at , is the phonon density of states, is the transmission coefficient of phonons, is the non-equilibrium part of the full phonon distribution, and , where is the angle between the phonon wavevector and the surface normal. We first set , that is, we assume an average value of , which is reasonable since is the only -dependent quantity in the integrand. The value of 0.5 is consistent with another study Harrelson et al. . Averaging over yields another factor of 0.5, which simplifies the previous equation to,
| (7) |
Normalization of the crystal volume sets the correct scale with in the limit that a single phonon is created in the crystal. We assume a cubic crystal volume of 50 cm3 (similar to crystal absorbers in the CRESST dark matter experiment Petricca et al. (2020)), and a crystal surface coverage of 2.7% for the readout (consistent with transmission edge sensor coverage Fink et al. (2020)).
To calculate the time-dependent thermal power, , ( = surface area), we evolve with time according to the phonon scattering rates in the material, via,
| (8) |
where is the rate at which is converted to due to anharmonic scattering, and is the rate of isotopic decoherence at frequency . We break into diagonal and off-diagonal components, which represent the decay from an initial state (diagonal components) and the transfer to other states at different energies (off-diagonal components). The diagonal components are approximated as,
| (9) |
where is the average inverse anharmonic lifetime of the phonons created at frequency in Figure 3. Similarly, we assume the isotopic scattering rates to be purely diagonal, which we find by replacing the anharmonic lifetimes with isotopic lifetimes in the equation above. The off-diagonal terms in represent the growth of the athermal distribution at at the expense of the decay at , and are provided by the scattering rates in Figure 3a. This implicitly assumes that rearrangement of the non-equilibrium distribution function only occurs once from the optical -point mode into the decay channels in Figure 3a, and that any subsequent scattering, either anharmonic or isotopic, directly leads to thermalization.
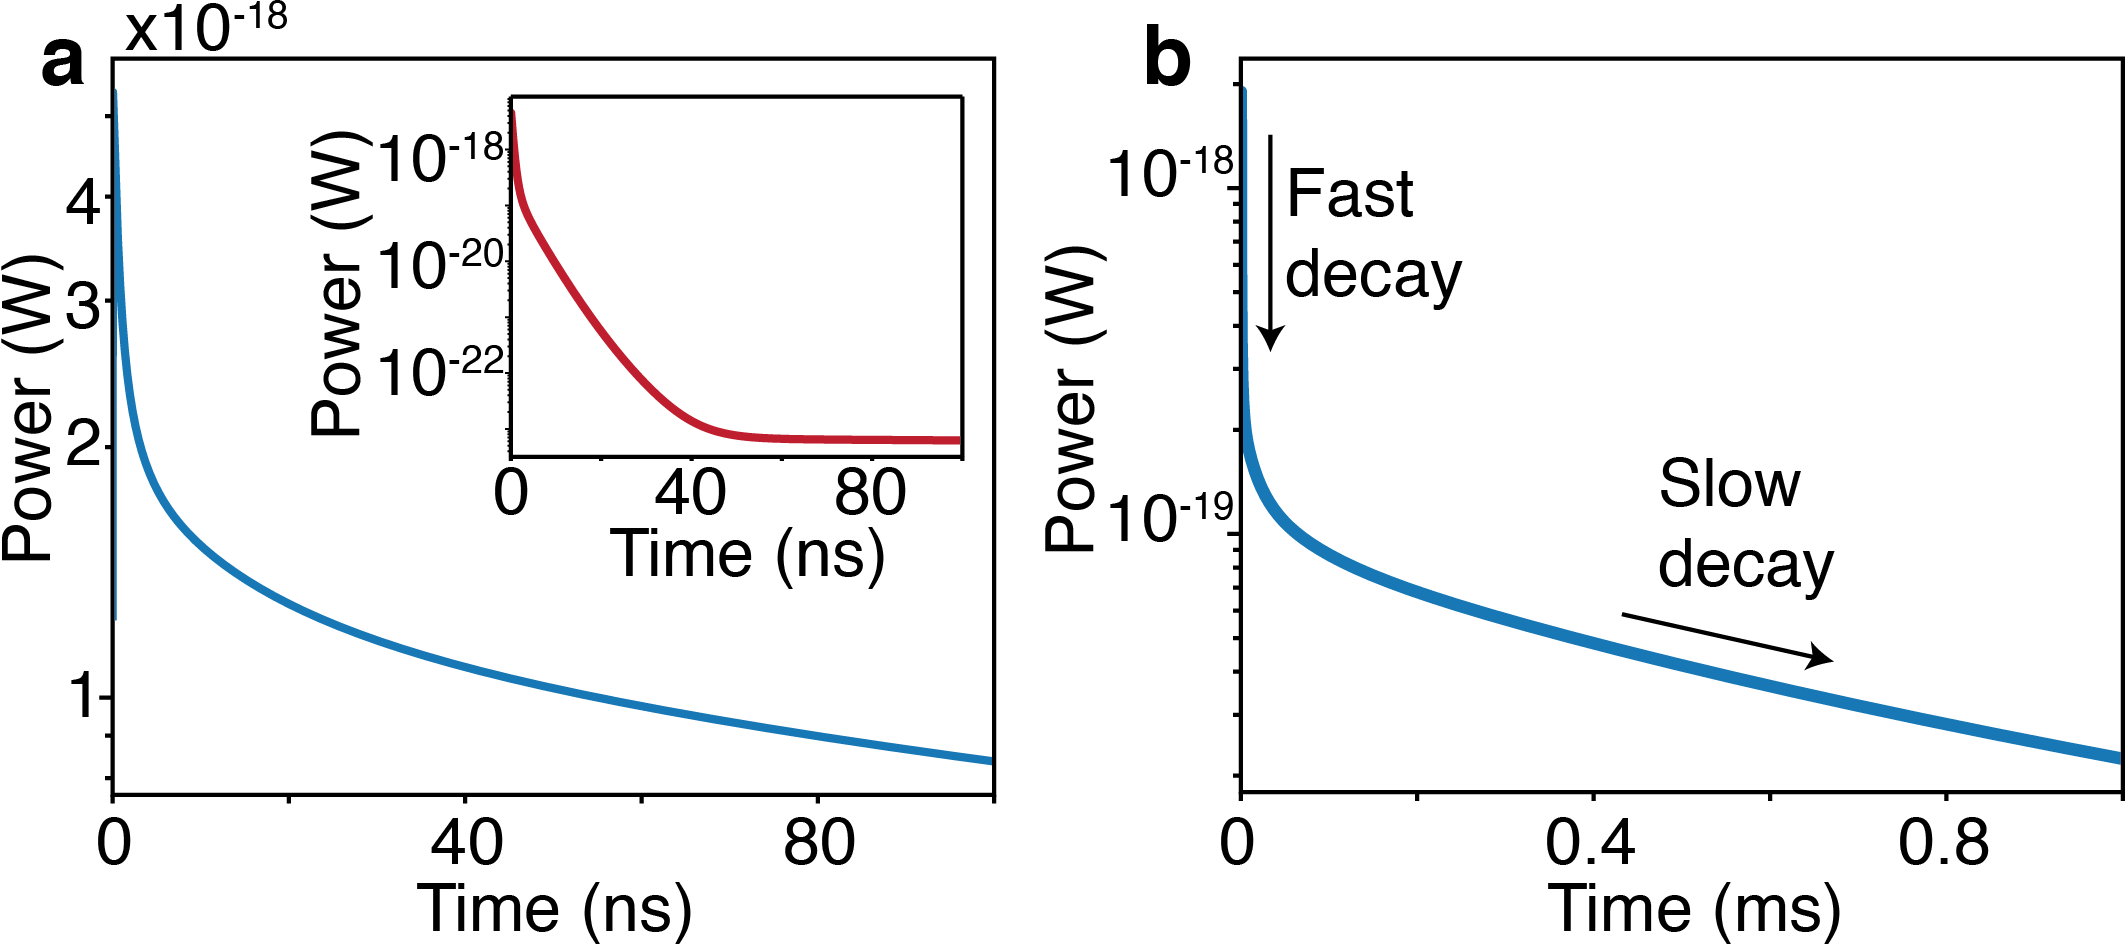
Having defined all of the terms in Eq. (8), we numerically integrate , and insert the time-dependent values into Eq. (7) to find the thermal power that crosses the readout interface as a function of time. In Figure 5a, we plot the short-time results for the thermal power excluding the impact of isotopic decoherence. The initial power is W, before quickly decaying to half the initial value over a time scale on the order of 1 ns, and slowly decaying further over 100s of ns. The scale of the predicted thermal power is similar to W/Hz1/2, which is the reported noise equivalent power of a current TES device Fink et al. (2020). Adding isotopic decoherence to the thermal power model (inset Figure 5a) removes the slow decay process, and the predicted thermal power decreases to W after 40 ns.
We observe that the isotopic-free thermal power does not completely decay after 100 ns, suggesting that there are transport channels that are active for time scales longer than 100 ns. To examine this, we show the long-time scaling behavior of the power in Figure 5b. We find two distinct scaling regions separated at ns, which represent the two peaks in Figure 3b near 20 meV (fast decay), and 10 meV (slow decay), respectively. The linear relationship in Figure 5b shows that the exponential decay process has an effective lifetime of 0.77 ms, which is comparable to the timescale associated with the 2.6 kHz bandwidth for a TES readout device.
IV Discussion
We find that isotopic scattering in non-enriched GaAs and Si-based sensors will severely diminish their performance. The reason for this is illustrated in Figure 2; the isotopic lifetimes are significantly smaller than anharmonic lifetimes for the optical phonon decay channels with large mean free paths near 10 meV and 20 meV in GaAs and Si, respectively. The impact of isotopic decay is clearly observed when we include isotopic interactions in the thermal transport model. The thermal power signal reaches peak power on the order of 10-18 W, and the signal only survives for 1 ns. Given that the noise-equivalent power of a TES readout device is W/Hz1/2 with a bandwidth of 2.6 kHz Fink et al. (2020), the effective noise power is 7.6 W, making the signal from a single optical phonon undetectable without significant isotopic enrichment with current TES limits. For GaAs, assuming enrichment to purity, then the phonons near 10 meV have ps lifetimes. Assuming that the characteristic velocity is cm/s, then the mean free path becomes cm. Therefore, we find that purity is necessary to successfully mitigate the isotopic decoherence for cm size GaAs absorbers. We continue our analysis of the feasibility of single phonon detection assuming the isotopic impurity-free case (or sufficiently enriched).
We find that, even in the limit of zero isotopic scattering, the predicted thermal power is too weak to be observed in current TES devices. Specifically, a single optical phonon in a 50 cm3 absorber creates a thermal power impulse starting near W in the absence of isotopic scattering. The initial signal decays quickly over ns, which is not long enough to be detected with a TES readout device that has a noise equivalent power of W/Hz1/2 operating with a bandwidth of 2.6 kHz. Additionally, the noise power with this bandwidth is greater than the initial power from the phonons. The slow decay process allows the predicted signal to survive for 100s of s, suggesting a 1 MHz bandwidth should ideally be used. However, the corresponding power is between 10 W, which is 2-3 orders of magnitude smaller than the effective noise power of the readout device.
Despite the substantial readout noise relative to the predicted signal, we note that there are several assumptions in the thermal transport model that can impact our predictions. The first is due to the simplifications made to the integration of the non-equilibrium distribution function. We assume that one of two things happens after the initial optical phonon decays: (1) the phonon transports out of the absorber to the readout device, or (2) the phonon decays to the thermal background. There is an intermediate option in which the secondary phonon population anharmonically decays again into lower-energy acoustic phonons that contribute to the thermal power. We are also assuming that the calculated phonon lifetimes represent a reasonable approximation to the actual scattering rate in a real material. Prior work comparing phonon lifetimes observed from Raman and inelastic neutron scattering experiments with DFT calculations show that the agreement is very reasonable as long as the temperature is small compared to the phonon frequency Debernardi et al. (1995); Glensk et al. (2019). The temperature of the detector in a sensor experiment is mK (equivalent to 1-10 eV), which is much smaller than the phonon energies that we calculate. Thus, we expect that our first-principles calculations of phonon lifetimes are accurate, and any errors inherent to the calculation procedure are subdominant to other sources of error. As a result, our results in Figure 5a represent a reasonable first approximation that is a lower bound for the actual result.
While phonons that are generated from a small number of decay events contribute to thermal flux, phonons that arise after many decay events are not expected to contribute to the thermal flux. This is because the phonon momentum relaxes over several scattering processes, causing diffusive transport (instead of ballistic transport for coherent phonons) out of the absorber which has significantly reduced transport rates (see SI Section LABEL:si:sec:diffusive for details). Diffusive transport can be avoided by decreasing the effective phonon travel distance to become comparable to the mean free paths in Figure 3.
Additionally, the volume of the absorber and surface coverage of the readout device have a critical impact on the observed thermal power in Figure 5. Linearly decreasing the volume of the absorber, causes a linear increase in the observed thermal power because the surface area also decreases with the volume. Another consideration is that the surface scattering rate scales with , meaning that surface scattering effects become much more relevant as the absorber volume decreases. The volume can be held constant while increasing the surface area of the readout device by changing the form factor from a cube to a film. This has the benefit of decreasing one of the dimensions of the absorber to be closer to more of the phonon mean free paths, which increases the collection efficiency. However, as the surface area to volume ratio increases, the expected residence time of a phonon decreases, which decreases the allowed integration time to collect the observed signal. Therefore, decreasing the surface area to volume ratio increases the noise bandwidth, causing an increase in the effective noise power. Thus, optimization studies including such geometric effects are needed to determine the number and size of detectors required to achieve a targeted sensitivity threshold.
V Conclusions and Outlook
We calculate the anharmonic, isotopic, and surface scattering rates for both GaAs and Si and find that anharmonic scattering dominates for optical phonons and high-energy acoustic phonons. Isotopic scattering begins to dominate at 12 meV and 25 meV for GaAs and Si, respectively. This type of scattering is significantly detrimental to the predicted thermal power crossing the readout device interface. This can be significantly mitigated with isotopic enrichment greater than 99.9%. We also find that surface scattering is not a dominant decay channel for most phonons modes, particularly when surface roughnesses are near 1 Å.
In the limit of zero isotopic scattering, the thermal power from a single optical phonon in a 50 cm3 device reaches power levels comparable to that of current TES devices. However, the time scale for the signal decay is too small to overcome the effective noise power over small time scales in TES devices. Further device optimization is required to increase the observed signal-to-noise ratio. One possibility for design is to reduce the detector volume, while simultaneously increasing the interfacial area between the readout device and the absorber to maximize the initial signal magnitude.
The preceding discussion is based on the limit of zero isotopic scattering in the absorber, which is mitigated through isotopic enrichment. Another path for mitigation of isotopic scattering noise is to choose a material with constituent atoms that have no natural isotopic variation. Of the possible materials, aluminum arsenide (AlAs) seems to be a viable candidate that is most similar to GaAs and Si. AlAs is a polar semiconductor, and forms into a crystal with the same space group (zincblende, Fm) as GaAs. Because of this, AlAs’s sensitivity to dark matter models should be similar to that of GaAsGriffin et al. (2020), in addition to similar anharmonic scattering properties as GaAs and Si. Since Al is lighter than Ga, the phonon energies and group velocities of AlAs are larger (see SI, Fig. S1(b) and (c)). Since the thermal power is proportional to group velocity, this should correspondingly increase the thermal power relative to the noise. The transmission coefficient should also increase from the improved impedance mismatch between AlAs and Al. Also, single crystals of AlAs have been fabricated and used in waveguide devices Gourley and Drummond (1986). Thus, AlAs could feasibly produce detectable signals for single optical phonons with additional device optimization and/or advances in readout technology. The final option for increasing the predicted thermal power is to search for another material with anomalously low anharmonic interactions.
VI Acknowledgments
We thank Sean Lubner, Aritoki Suzuki, Matt Pyle, Kathryn Zurek, and Maurice Garcia-Sciveres for useful discussions. This work was supported by the Quantum Information Science Enabled Discovery (QuantISED) for High Energy Physics (KA2401032). Work at the Molecular Foundry was supported by the Office of Science, Office of Basic Energy Sciences, of the U.S. Department of Energy under Contract No. DE-AC02-05CH11231. This research used resources of the National Energy Research Scientific Computing Center (NERSC), a U.S. Department of Energy Office of Science User Facility operated under Contract No. DE-AC02-05CH11231. This work used the Extreme Science and Engineering Discovery Environment (XSEDE), which is supported by National Science Foundation grant number ACI-1548562. IH acknowledges support from the DOE Science Undergraduate Laboratory Internship (SULI) program.
References
- Amaral et al. (2020) D. W. Amaral, T. Aralis, T. Aramaki, I. J. Arnquist, E. Azadbakht, S. Banik, D. Barker, C. Bathurst, D. A. Bauer, L. V. S. Bezerra, and et al., Physical Review D 102 (2020), 10.1103/physrevd.102.091101.
- Dolinski et al. (2019) M. J. Dolinski, A. W. Poon, and W. Rodejohann, Annual Review of Nuclear and Particle Science 69, 219 (2019).
- Antonius and Louie (2017) G. Antonius and S. G. Louie, “Theory of the exciton-phonon coupling,” (2017), arXiv:1705.04245 [cond-mat.mtrl-sci] .
- Krauss and Wise (1997) T. D. Krauss and F. W. Wise, Phys. Rev. B. 55, 9860 (1997).
- Li et al. (2014) E. Li, B. J. Eggleton, K. Fang, and S. Fan, Nature Communications 5, 3225 (2014).
- Berk et al. (2019) C. Berk, M. Jaris, W. Yang, S. Dhuey, S. Cabrini, and H. Schmidt, Nature Communications 10 (2019), 10.1038/s41467-019-10545-x.
- Streib et al. (2019) S. Streib, N. Vidal-Silva, K. Shen, and G. E. Bauer, Phys. Rev. B 99, 1 (2019).
- O’Connell et al. (2010) A. D. O’Connell, M. Hofheinz, M. Ansmann, R. C. Bialczak, M. Lenander, E. Lucero, M. Neeley, D. Sank, H. Wang, M. Weides, J. Wenner, J. M. Martinis, and A. N. Cleland, Nature 464, 697 (2010).
- Chu et al. (2017) Y. Chu, P. Kharel, W. H. Renninger, L. D. Burkhart, L. Frunzio, P. T. Rakich, and R. J. Schoelkopf, Science 358, 199–202 (2017).
- Chu et al. (2018) Y. Chu, P. Kharel, T. Yoon, L. Frunzio, P. T. Rakich, and R. J. Schoelkopf, Nature 563, 666 (2018).
- Moores et al. (2018) B. A. Moores, L. R. Sletten, J. J. Viennot, and K. W. Lehnert, Physical Review Letters 120, 227701 (2018).
- Agnese et al. (2014) R. Agnese, A. J. Anderson, M. Asai, D. Balakishiyeva, R. Basu Thakur, D. A. Bauer, J. Billard, A. Borgland, M. A. Bowles, D. Brandt, and et al., Physical Review Letters 112 (2014), 10.1103/physrevlett.112.041302.
- Knapen et al. (2017) S. Knapen, T. Lin, and K. M. Zurek, Physical Review D 95, 1 (2017).
- Griffin et al. (2021) S. M. Griffin, Y. Hochberg, K. Inzani, N. Kurinsky, T. Lin, and T. C. Yu, Physical Review D 103 (2021), 10.1103/physrevd.103.075002.
- Griffin et al. (2018) S. Griffin, S. Knapen, T. Lin, and K. M. Zurek, Physical Review D 98, 115034 (2018).
- Kurinsky et al. (2019) N. Kurinsky, T. C. Yu, Y. Hochberg, and B. Cabrera, Physical Review D 99 (2019), 10.1103/physrevd.99.123005.
- Griffin et al. (2020) S. M. Griffin, K. Inzani, T. Trickle, Z. Zhang, and K. M. Zurek, Physical Review D 101, 1 (2020).
- Trickle et al. (2020) T. Trickle, Z. Zhang, and K. M. Zurek, Physical Review Letters 124, 1 (2020).
- Hochberg et al. (2018) Y. Hochberg, Y. Kahn, M. Lisanti, K. M. Zurek, A. G. Grushin, R. Ilan, S. M. Griffin, Z.-F. Liu, S. F. Weber, and J. B. Neaton, Physical Review D 97, 015004 (2018).
- Røising et al. (2021) H. S. Røising, B. Fraser, S. M. Griffin, S. Bandyopadhyay, A. Mahabir, S.-W. Cheong, and A. V. Balatsky, Physical Review Research 3 (2021), 10.1103/physrevresearch.3.033236.
- Inzani et al. (2021) K. Inzani, A. Faghaninia, and S. M. Griffin, Physical Review Research 3, 013069 (2021).
- Zmuidzinas (2012) J. Zmuidzinas, Annual Review of Condensed Matter Physics 3, 169 (2012).
- Fleischmann et al. (2005) A. Fleischmann, C. Enss, and G. Seidel, “Metallic magnetic calorimeters,” in Cryogenic Particle Detection, edited by C. Enss (Springer Berlin Heidelberg, Berlin, Heidelberg, 2005) pp. 151–216.
- Irwin et al. (1995) K. D. Irwin, S. W. Nam, B. Cabrera, B. Chugg, and B. A. Young, Review of Scientific Instruments 66, 5322 (1995).
- Romani et al. (2018) R. K. Romani, P. L. Brink, B. Cabrera, M. Cherry, T. Howarth, N. Kurinsky, R. A. Moffatt, R. Partridge, F. Ponce, M. Pyle, A. Tomada, S. Yellin, J. J. Yen, and B. A. Young, Applied Physics Letters 112 (2018), 10.1063/1.5010699.
- Angloher et al. (2016) G. Angloher, A. Bento, C. Bucci, L. Canonica, X. Defay, A. Erb, F. von Feilitzsch, N. F. Iachellini, P. Gorla, A. Gütlein, D. Hauff, J. Jochum, M. Kiefer, H. Kluck, H. Kraus, J. C. Lanfranchi, J. Loebell, A. Münster, C. Pagliarone, F. Petricca, W. Potzel, F. Pröbst, F. Reindl, K. Schäffner, J. Schieck, S. Schönert, W. Seidel, L. Stodolsky, C. Strandhagen, R. Strauss, A. Tanzke, H. H. Trinh Thi, C. Türkoğlu, M. Uffinger, A. Ulrich, I. Usherov, S. Wawoczny, M. Willers, M. Wüstrich, and A. Zöller, The European Physical Journal C 76, 25 (2016).
- Petricca et al. (2020) F. Petricca, G. Angloher, P. Bauer, A. Bento, C. Bucci, L. Canonica, X. Defay, A. Erb, F. v. Feilitzsch, N. F. Iachellini, P. Gorla, A. Gütlein, D. Hauff, J. Jochum, M. Kiefer, H. Kluck, H. Kraus, J. C. Lanfranchi, A. Langenkämper, J. Loebell, M. Mancuso, E. Mondragon, A. Münster, C. Pagliarone, W. Potzel, F. Pröbst, R. Puig, F. Reindl, J. Rothe, K. Schäffner, J. Schieck, S. Schönert, W. Seidelf, M. Stahlberg, L. Stodolsky, C. Strandhagen, R. Strauss, A. Tanzke, H. H. T. Thi, C. Türkoğlu, A. Ulrich, I. Usherov, S. Wawoczny, M. Willers, and M. Wüstrich, Journal of Physics: Conference Series 1342, 012076 (2020).
- Day et al. (2003) P. K. Day, H. G. LeDuc, B. A. Mazin, A. Vayonakis, and J. Zmuidzinas, Nature 425, 817 (2003).
- Fink et al. (2020) C. W. Fink, S. L. Watkins, T. Aramaki, P. L. Brink, S. Ganjam, B. A. Hines, M. E. Huber, N. A. Kurinsky, R. Mahapatra, N. Mirabolfathi, W. A. Page, R. Partridge, M. Platt, M. Pyle, B. Sadoulet, B. Serfass, and S. Zuber, AIP Advances 10, 085221 (2020).
- Arkani-Hamed and Weiner (2008) N. Arkani-Hamed and N. Weiner, Journal of High Energy Physics 2008, 104 (2008).
- Cheung et al. (2009) C. Cheung, J. T. Ruderman, L.-T. Wang, and I. Yavin, Physical Review D 80, 035008 (2009).
- Morrissey et al. (2009) D. E. Morrissey, D. Poland, and K. M. Zurek, Journal of High Energy Physics 2009, 050 (2009).
- Fabbrichesi et al. (2021) M. Fabbrichesi, E. Gabrielli, and G. Lanfranchi, The Physics of the Dark Photon, SpringerBriefs in Physics (Springer International Publishing, Cham, 2021).
- Hohenberg and Kohn (1964) P. Hohenberg and W. Kohn, Phys. Rev. 136, B864 (1964).
- Kohn and Sham (1965) W. Kohn and L. J. Sham, Phys. Rev. 140, A1133 (1965).
- Togo et al. (2015) A. Togo, L. Chaput, and I. Tanaka, Phys. Rev. B 91 (2015), 10.1103/PhysRevB.91.094306.
- Tamura (1983) S.-i. Tamura, Phys. Rev. B 27, 858 (1983).
- Lindsay et al. (2014) L. Lindsay, W. Li, J. Carrete, N. Mingo, D. A. Broido, and T. L. Reinecke, Phys. Rev. B 89, 155426 (2014).
- Esfarjani et al. (2011) K. Esfarjani, G. Chen, and H. T. Stokes, Phys. Rev. B 84, 085204 (2011).
- Ganose et al. (2021) A. M. Ganose, J. Park, A. Faghaninia, R. Woods-Robinson, K. A. Persson, and A. Jain, Nature Communications 12, 2222 (2021).
- Zhou et al. (2014) F. Zhou, W. Nielson, Y. Xia, and V. Ozoliņš, Physical Review Letters 113, 185501 (2014).
- Glassbrenner and Slack (1964) C. J. Glassbrenner and G. A. Slack, Physical Review 134, A1058 (1964).
- Carlson et al. (1965) R. O. Carlson, G. A. Slack, and S. J. Silverman, J. Appl. Phys. 36, 505 (1965).
- Morelli et al. (2002) D. T. Morelli, J. P. Heremans, and G. A. Slack, Phys. Rev. B 66, 195304 (2002).
- Malhotra and Maldovan (2016) A. Malhotra and M. Maldovan, Scientific Reports 6, 25818 (2016).
- Sipahigil et al. (2014) A. Sipahigil, K. D. Jahnke, L. J. Rogers, T. Teraji, J. Isoya, A. S. Zibrov, F. Jelezko, and M. D. Lukin, Physical Review Letters 113, 113602 (2014).
- Sukachev et al. (2017) D. D. Sukachev, A. Sipahigil, C. T. Nguyen, M. K. Bhaskar, R. E. Evans, F. Jelezko, and M. D. Lukin, Physical Review Letters 119, 223602 (2017).
- Bluhm et al. (2011) H. Bluhm, S. Foletti, I. Neder, M. Rudner, D. Mahalu, V. Umansky, and A. Yacoby, Nature Physics 7, 109 (2011).
- Cao et al. (2016) G. Cao, H. O. Li, G. D. Yu, B. C. Wang, B. B. Chen, X. X. Song, M. Xiao, G. C. Guo, H. W. Jiang, X. Hu, and G. P. Guo, Physical Review Letters 116, 086801 (2016).
- Kresse and Hafner (1993) G. Kresse and J. Hafner, Phys. Rev. B 47, 558 (1993).
- Kresse and Furthmüller (1996) G. Kresse and J. Furthmüller, Computational Materials Science 6, 15 (1996).
- Perdew et al. (1996) J. P. Perdew, K. Burke, and M. Ernzerhof, Physical Review Letters. 77, 3865 (1996).
- Baroni et al. (2001) S. Baroni, S. de Gironcoli, A. Dal Corso, and P. Giannozzi, RMP 73, 515 (2001).
- Togo and Tanaka (2015) A. Togo and I. Tanaka, Scripta Materialia 108, 1 (2015).
- Jain et al. (2013) A. Jain, S. P. Ong, G. Hautier, W. Chen, W. D. Richards, S. Dacek, S. Cholia, D. Gunter, D. Skinner, G. Ceder, and K. A. Persson, APL Materials 1, 011002 (2013).
- Chiarotti and Goletti (2005) G. Chiarotti and C. Goletti, in Encyclopedia of Condensed Matter Physics (Elsevier, 2005) pp. 133–144.
- Maradudin and Fein (1962) A. A. Maradudin and A. E. Fein, Phys. Rev. 128, 2589 (1962).
- Canonico et al. (2002) M. Canonico, C. Poweleit, J. Menéndez, A. Debernardi, S. R. Johnson, and Y.-H. Zhang, Physical Review Letters 88, 215502 (2002).
- Lindsay (2016) L. Lindsay, Phys. Rev. B 94, 174304 (2016).
- Veldhorst et al. (2014) M. Veldhorst, J. C. C. Hwang, C. H. Yang, A. W. Leenstra, B. de Ronde, J. P. Dehollain, J. T. Muhonen, F. E. Hudson, K. M. Itoh, A. Morello, and A. S. Dzurak, Nature Nanotechnology 9, 981 (2014).
- Inyushkin et al. (2003) A. V. Inyushkin, A. N. Taldenkov, A. Y. Yakubovsky, A. V. Markov, L. Moreno-Garsia, and B. N. Sharonov, Semiconductor Science and Technology 18, 685 (2003).
- Alaie et al. (2015) S. Alaie, D. F. Goettler, M. Su, Z. C. Leseman, C. M. Reinke, and I. El-Kady, Nature Communications 6, 7228 (2015).
- Teichert et al. (1995) C. Teichert, J. F. MacKay, D. E. Savage, M. G. Lagally, M. Brohl, and P. Wagner, Applied Physics Letters 66, 2346 (1995).
- Swartz and Pohl (1989) E. T. Swartz and R. O. Pohl, Reviews of Modern Physics 61, 605 (1989).
- (65) T. F. Harrelson, K. Inzani, and S. M. Griffin, Submitted .
- Debernardi et al. (1995) A. Debernardi, S. Baroni, and E. Molinari, Physical Review Letters 75, 1819 (1995).
- Glensk et al. (2019) A. Glensk, B. Grabowski, T. Hickel, J. Neugebauer, J. Neuhaus, K. Hradil, W. Petry, and M. Leitner, Physical Review Letters 123, 235501 (2019).
- Gourley and Drummond (1986) P. L. Gourley and T. J. Drummond, Applied Physics Letters 49, 489 (1986).