A Differential RR Lyrae Line-of-Sight Distance Between M31 and M33
Abstract
We present a purely differential line-of-sight distance between M31 and M33 using ab-type RR Lyrae variables observed in each galaxy by the Hubble Space Telescope Advanced Camera for Surveys in the F606W filter. Using 1501 RR Lyraes in 13 M31 fields and 181 RR Lyraes in 6 M33 fields, and placing all of these stars on a uniform photometric scale with internally consistent corrections for metal abundance and extinction, we find a relative absolute distance modulus of (m-M)o = –0.298 0.016 in the sense of (m-M)o,M31 – (m-M)o,M33. Adopting an absolute distance modulus of (m-M)o=24.460.10 for M31 places M33 115 kpc beyond M31 in line-of-sight distance.
keywords:
Stars:horizontal branch, stars:variables:RR Lyrae, galaxies:interactions1 Introduction
The distance of a celestial object is arguably its most important astronomical property. In the case of Local Group galaxies, there is an extensive literature on efforts to use the distances of the Large Magellanic Cloud (LMC) and M31 as anchors in the cosmic distance ladder (e.g. Riess et al. 2012; de Grijs et al. 2014; de Grijs & Bono 2014). In addition, relative distance measurements of M31 and M33 have figured prominently in the realization that M33 appears to be a satellite of M31 (i.e. the Andromeda system) and that their past dynamical interactions have influenced their detailed morphological and stellar population properties (McConnachie et al. 2009, Tepper-Garcia et al. 2020). In fact, the present-day distance between M31 and M33 is one of the most important parameters in constraining dynamical models of the system (e.g. Semczuk et al. 2018; van der Marel et al. 2012; 2019, Tepper-Garcia et al. 2020), which, in the big picture, can then shed light on the details of the CDM hierarchical formation scenario (e.g. Lewis et al. 2013).
A number of different and complimentary techniques have been employed to infer the distances of M31 and M33. de Grijs & Bono (2014) present a comprehensive summary of these efforts. They surveyed the literature from 1918 to 2014 and compiled a list of 168 distance measurements to M31 and 90 for M33. Based on these lists and the techniques employed in each case, de Grijs & Bono (2014) derive a “recommended" distance modulus of (m-M)o=24.460.10 for M31 and (m-M)o=24.670.07 for M33 leading to a difference of –0.210.12 mag in distance modulus. More recent observations of distance indicators to M33 and M31 such as those by Tanakul et al. (2017) and Tanakul & Sarajedini (2018), respectively, using RR Lyrae variables find consistent results with those from de Grijs & Bono (2014). These studies are discussed more below.
In this work, we present the results of a purely differential method to measure the line-of-sight distance between M31 and M33 using ab-type RR Lyrae variables in both galaxies. This paper is organized as follows. The next section describes the nature of the observations employed herein while section 3 presents details of the photometric corrections made to the observations to ensure a uniform and internally consistent photometric scale. The results are presented in Section 4 and comparisons are made to previous work in Section 5. The conclusions are presented in Section 6.
2 Observations
Details of the data-sets used in the present study are given in Table 1, which lists the publications from which the data for M31 and M33 ab-type RR Lyrae variables are taken. The sky locations of the M31 fields are shown in Figs. 1 and 2 of Tanakul & Sarajedini (2018), while the M33 fields are illustrated in Fig. 1 of Tanakul et al. (2017). We are focused exclusively on observations obtained by the Hubble Space Telescope Advanced Camera for Surveys (HST/ACS) taken in the F606W filter. Because the photometric performance of ACS has been closely tracked since it began operations on HST, we can make detailed corrections for the variation in its photometric zeropoint over time. As such, this is likely to be the most precise photometry available for these stars.
| Reference | Field | RA (J2000) | Dec (J2000) | Original Photometric | Original | F606W VegaMag |
|---|---|---|---|---|---|---|
| Name | (h m s) | (o ’ ") | System | Zeropoint | Zeropoint | |
| Sarajedini et al. (2009) | Field 1 | 00 42 41 | +40 46 38 | VegaMag F606W | 26.388 | 26.410 |
| M31 | Field 2 | 00 43 21 | +40 57 25 | VegaMag F606W | 26.388 | 26.409 |
| Yang et al. (2010) | Disk 2 | 01 33 40 | +30 29 00 | Johnson V | Synthetic | 26.412 |
| M33 | Disk 3 | 01 33 21 | +30 22 15 | Johnson V | Synthetic | 26.411 |
| Disk 4 | 01 33 08 | +30 15 07 | Johnson V | Synthetic | 26.411 | |
| Jeffery et al. (2011) | Stream | 00 44 18 | +39 47 32 | STMag F606W | 26.655 | 26.412 |
| M31 | Disk | 00 49 09 | +42 45 02 | STMag F606W | 26.655 | 26.411 |
| Halo11 | 00 46 07 | +40 42 39 | STMag F606W | 26.655 | 26.415 | |
| Halo21 | 00 49 05 | +40 17 32 | STMag F606W | 26.655 | 26.393 | |
| Halo35b | 00 54 09 | +39 47 26 | STMag F606W | 26.655 | 26.393 | |
| Bernard et al. (2012) | Warp | 00 38 05 | +39 37 55 | VegaMag F606W | 26.420 | 26.414 |
| M31 | Outer Disk | 00 36 38 | +39 43 26 | VegaMag F606W | 26.420 | 26.414 |
| Sarajedini et al. (2012) | M32 | 00 44 56 | +40 50 50 | Johnson V | Synthetic | 26.411 |
| M31 | Control | 00 43 29 | +41 03 44 | Johnson V | Synthetic | 26.411 |
| Tanakul et al. (2017) | F1 | 01 34 59 | +31 12 00 | Johnson V | Synthetic | 26.412 |
| M33 | M9 | 01 34 30 | +30 38 13 | Johnson V | Synthetic | 26.411 |
| U49 | 01 33 40 | +30 47 59 | Johnson V | Synthetic | 26.411 | |
| Tanakul & Sarajedini (2018) | NE7 | 00 44 54 | +41 31 47 | Johnson V | Synthetic | 26.413 |
| M31 | SW20a | 00 38 06 | +40 05 37 | Johnson V | Synthetic | 26.397 |
3 Photometric Corrections
The published RR Lyrae magnitudes (m(F606W)pub) need to be corrected (m(F606W)corr) for a number of effects before we can perform a purely differential distance calculation. The general form of the equation used to correct the published magnitudes is given by:
| (1) |
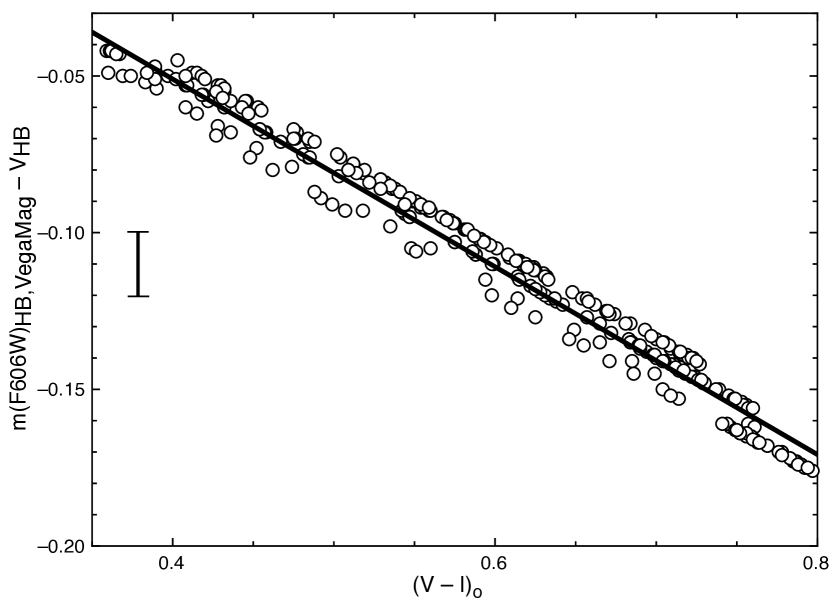
For stars with published photometry in the VegaMag or STmag systems, the original zero-points are subtracted first before adding the appropriate VegaMag zero-point for the time of the observation as given by http://www.stsci.edu/hst/acs/analysis/zeropoints/zpt.py. In the case of stars with published photometry in the ground-based Johnson-Cousins VI system, conversions between V and m(F606W)VegaMag are applied in the following manner. Using photometry for the globular clusters listed in Table 2 from the HST ACS survey of Sarajedini et al. (2007), we derived the following relation between ground-based Johnson-Cousins V magnitude and m(F606W)VegaMag in terms of the dereddened ground-based V–I color as shown in Fig. 1. The globular cluster reddenings are from Schlafly & Finkbeiner (2011) and the tabulated metallicities, which are listed for illustrative purposes, are from Harris (1996).
| (2) |
These Galactic globular clusters were chosen because they span a range of metallicities and have relatively low reddenings of less than E(B–V)=0.10. For each RR Lyrae star in M31 and M33, we use its dereddened (V–I) color to calculate from equation (2) and apply it to bring the photometry onto the VegaMag System of Mack et al. (2007), since this is the system used by Sarajedini et al. (2007). This zero-point is subtracted and, as per equation (2) above, the appropriate VegaMag zero-point for the time of the observation is added as given by http://www.stsci.edu/hst/acs/analysis/zeropoints/zpt.py.
| Cluster | E(B-V) | [Fe/H] |
|---|---|---|
| NGC 4590 | 0.05 | -2.23 |
| NGC 5272 | 0.01 | -1.50 |
| NGC 5904 | 0.03 | -1.29 |
| NGC 6341 | 0.02 | -2.31 |
| NGC 6362 | 0.07 | -0.99 |
The metallicity correction is effected using the following relation published by Chaboyer (1999):
| (3) |
It should be mentioned that in their theoretical calculations on the same question, Catelan et al. (2004) found that
| (4) |
which comes from the following original version
| (5) |
Catelan et al. (2004) note that at a metallicity of Z=0.001, this equation yields MV(RR)0.235[Fe/H], which is compatible with the results of Chaboyer (1999). As a result, since we are primarily interested in the differential distance between M31 and M33, we will adopt MV(RR)0.23[Fe/H].
In order to estimate the metal abundance for each RR Lyrae star, we make use of the relation published by Alcock et al. (2000), namely
| (6) |
where Log P(ab) is the period of the ab-type RR Lyrae in days, Amp(V) is the amplitude in the V filter and equals 1.08 times the amplitude in the F606W filter (Sarajedini et al. 2009; Brown et al. 2004), and Amp(V) = 1.60Amp(I) as derived by Sarajedini et al. (2006).
The extinction corrections are determined based on the reddening maps of Schlafly & Finkbeiner (2011). Using the work of Sirianni et al. (2005) and Sarajedini et al. (2007), we find the following equality assuming Av = 3.1E(B–V):
| (7) |
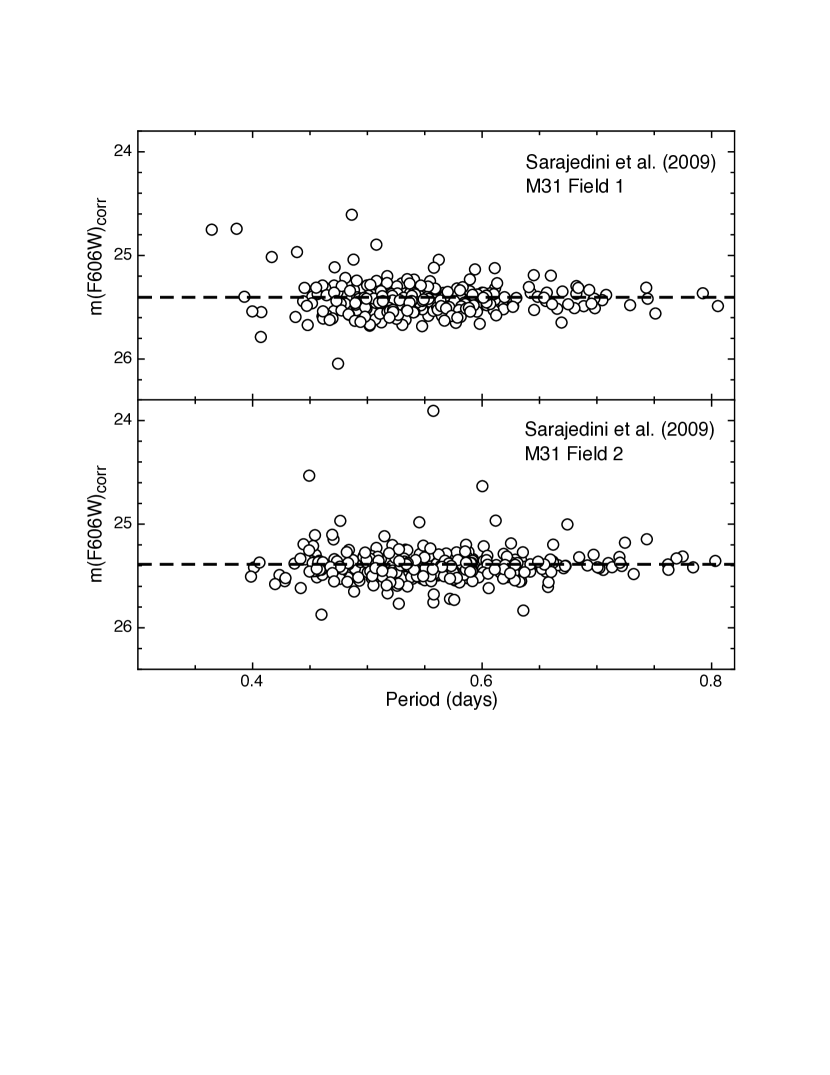
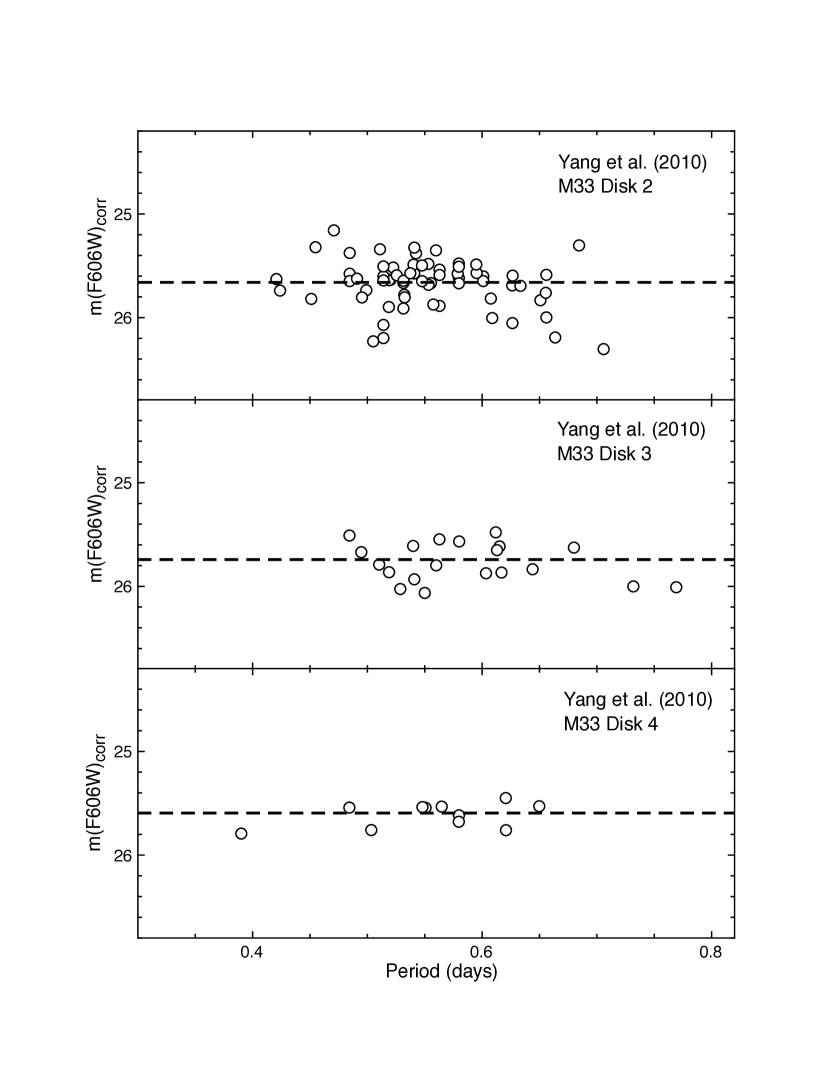
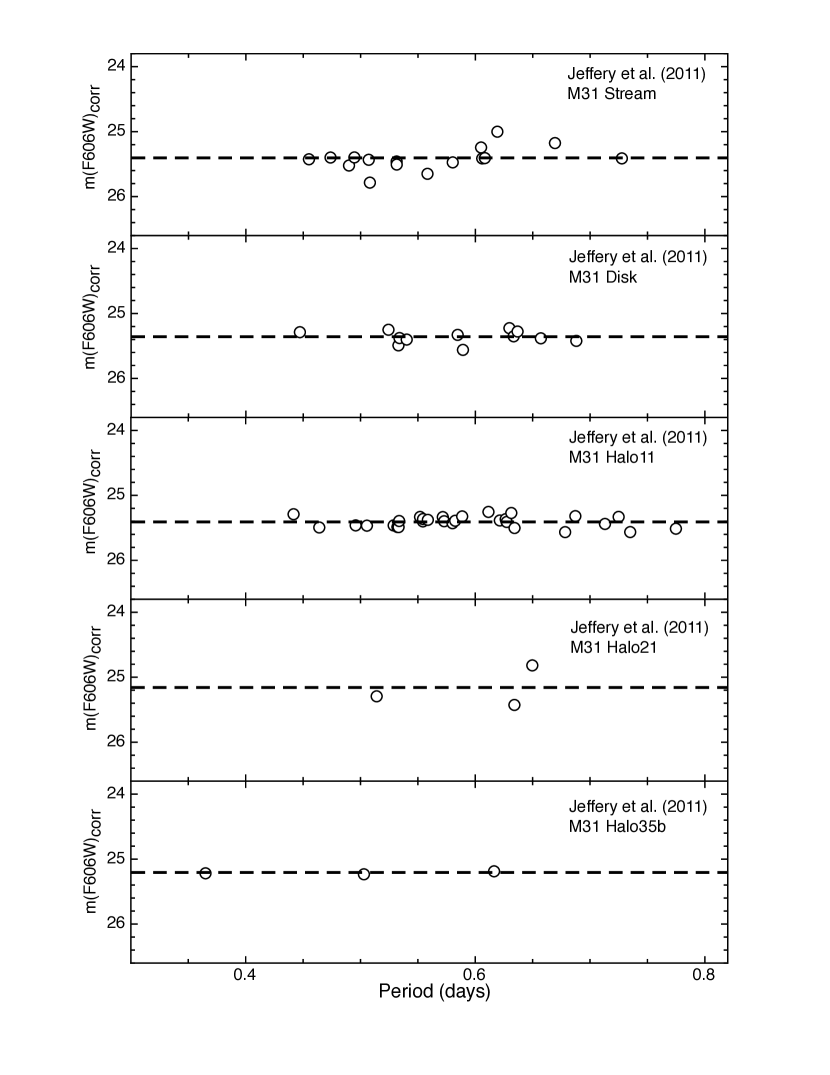
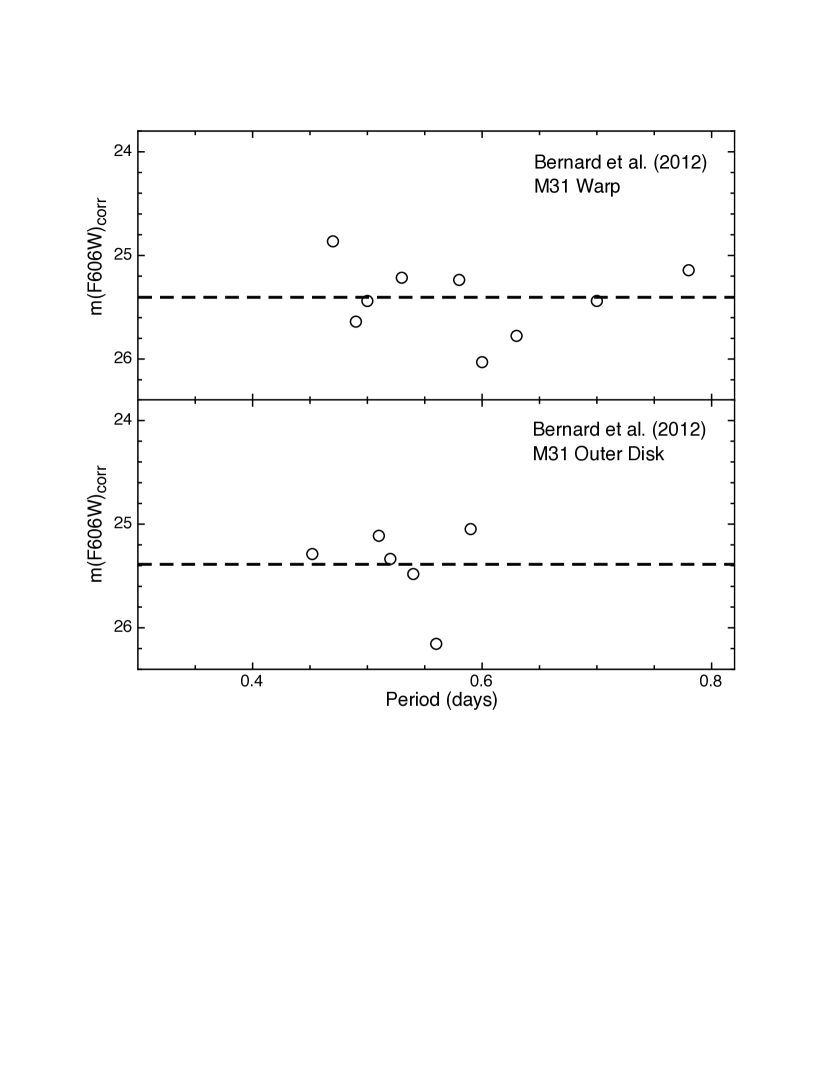
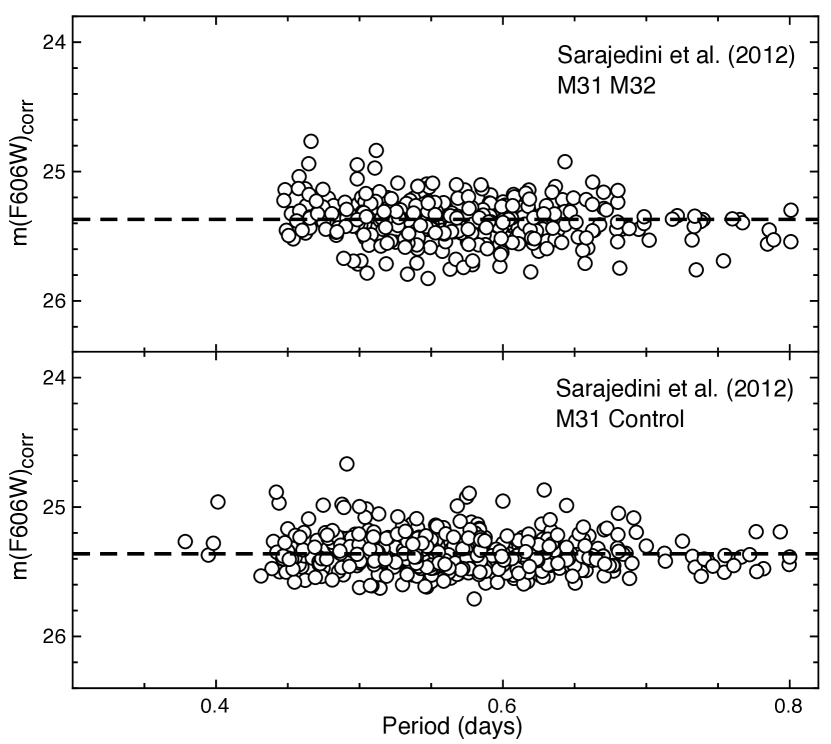
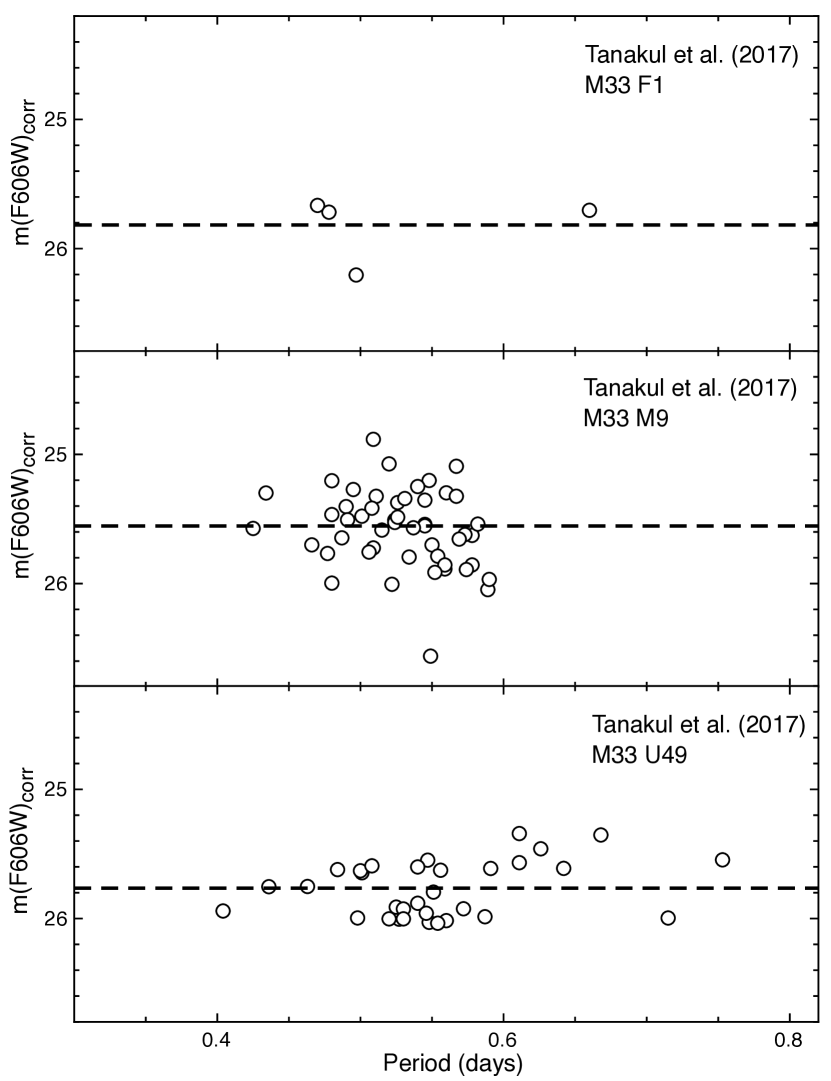
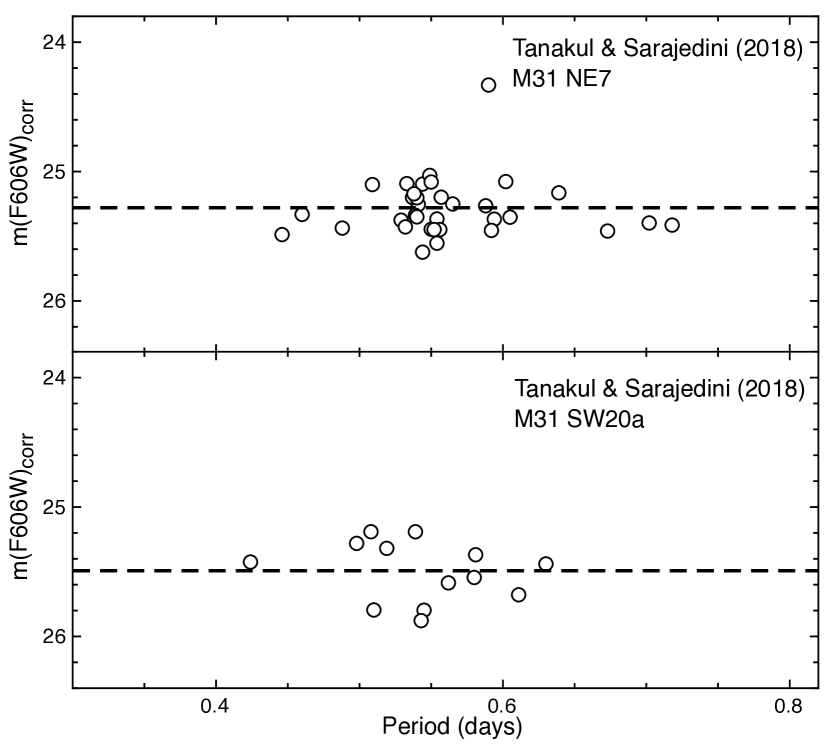
All of the inputs as listed in Tables 2 and 3 for each field are used to calculate the mean corrected F606W magnitudes (m(F606W)corr) using Equation 1 above. Table 3 lists the mean results for the ab-type RR Lyrae variables in each field. It should be noted that, in cases where the numbers of RR Lyrae stars is less than 10, the small-number statistical formulae of Keeping (1962) are used to calculate the standard error of the mean. Figures 2 through 8 illustrate the values of m(F606W)corr as a function of period for each ab-type RR Lyrae in this study.
| Reference | Field Name | E(B–V) | [Fe/H] | m(F606W)corr | Standard Error of the Mean | N(RRab) | |
|---|---|---|---|---|---|---|---|
| (SEM) | |||||||
| Sarajedini et al. (2009) | Field 1 | 0.054 | –1.46 0.03 | 25.424 | 0.009 | 267 | |
| M31 | Field 2 | 0.054 | –1.54 0.03 | 25.398 | 0.010 | 288 | |
| Yang et al. (2010) | Disk 2 | 0.039 | –1.39 0.05 | 25.671 | 0.026 | 65 | |
| M33 | Disk 3 | 0.041 | –1.69 0.11 | 25.767 | 0.046 | 20 | |
| Disk 4 | 0.044 | –1.46 0.13 | 25.613 | 0.046 | 11 | ||
| Jeffery et al. (2011) | Stream | 0.054 | –1.61 0.07 | 25.419 | 0.045 | 16 | |
| M31 | Disk | 0.070 | –1.54 0.08 | 25.363 | 0.028 | 12 | |
| Halo11 | 0.054 | –1.74 0.06 | 25.408 | 0.015 | 29 | ||
| Halo21 | 0.054 | –1.46 0.38 | 25.179 | 0.208 | 3 | ||
| Halo35b | 0.047 | –0.77 0.74 | 25.213 | 0.016 | 3 | ||
| Bernard et al. (2012) | Warp | 0.048 | –1.76 0.20 | 25.420 | 0.131 | 9 | |
| M31 | Outer Disk | 0.049 | –1.56 0.18 | 25.403 | 0.179 | 6 | |
| Sarajedini et al. (2012) | M32 | 0.054 | –1.42 0.02 | 25.385 | 0.008 | 375 | |
| M31 | Control | 0.054 | –1.39 0.02 | 25.376 | 0.007 | 446 | |
| Tanakul et al. (2017) | F1 | 0.042 | –1.14 0.34 | 25.823 | 0.131 | 4 | |
| M33 | M9 | 0.040 | –1.50 0.06 | 25.576 | 0.043 | 49 | |
| U49 | 0.036 | –1.61 0.08 | 25.771 | 0.038 | 32 | ||
| Tanakul & Sarajedini (2018) | NE7 | 0.054 | –1.51 0.07 | 25.282 | 0.039 | 34 | |
| M31 | SW20a | 0.054 | –1.27 0.09 | 25.500 | 0.065 | 13 |
4 Results
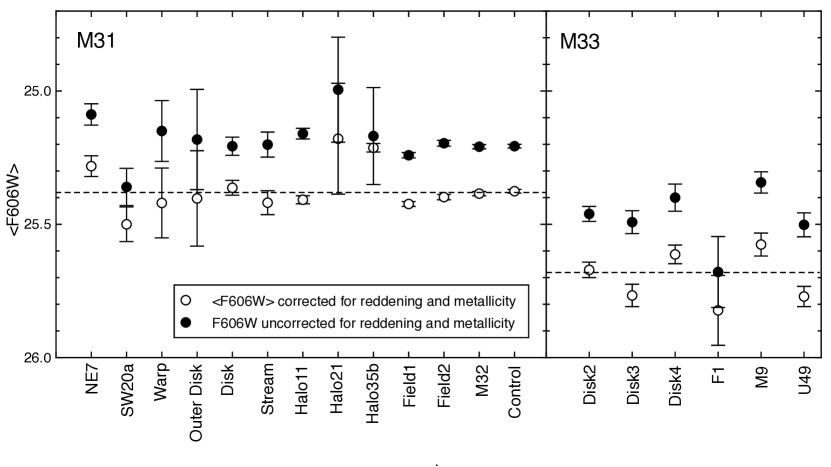
Figure 9 shows the results listed for each observed field in Table 2. In this figure, the open symbols have been corrected for the relative effects of reddening and metallicity between the different observed fields while the filled symbols have not been so corrected. For each field, we calculate a weighted mean of the values of m(F606W)corr using (1/SEM2) as weights. For the M31 fields, this procedure yields a mean value of m(F606W)corr = 25.382 0.004, and for M33, we calculate m(F606W)corr = 25.680 0.016. These are shown as the horizontal dashed lines in Fig. 9. As a point of comparison, if instead of a weighted average, we perform a straight unweighted average, we find m(F606W)corr = 25.367 0.025 and for M31, and we calculate m(F606W)corr = 25.704 0.041 for M33.
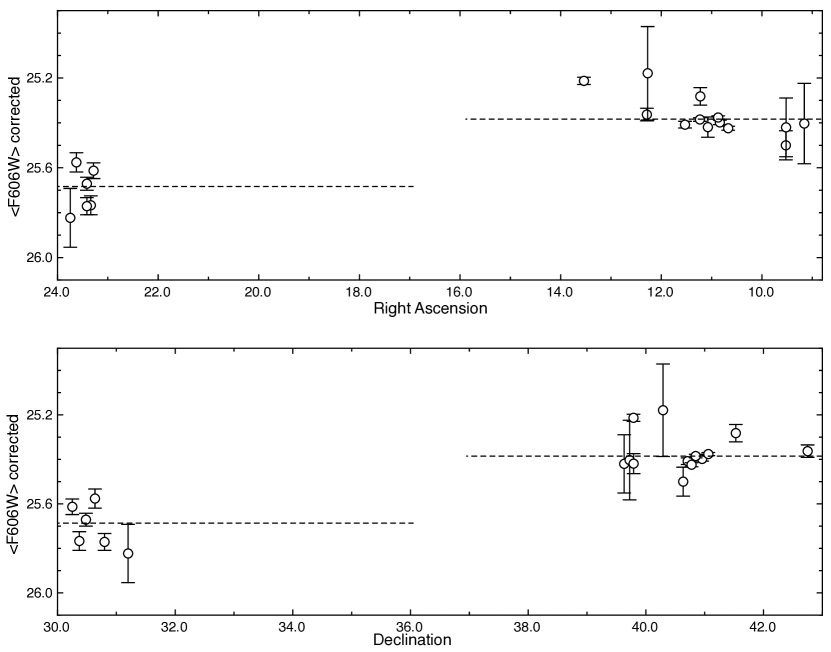
Figure 10 shows our resultant m(F606W)corr values as a function of position on the sky in the form of Right Ascension (RA) and Declination (Dec). Here we are looking for significant trends between line-of-sight distance and sky position. The dashed horizontal lines indicate the mean magnitude of each field for each galaxy. Keeping the error bars on each point in mind, there do not appear to be any positional trends in the mean RR Lyrae magnitude data. As such, taking the difference between the weighted mean corrected ab-type RR Lyrae magnitudes in M31 and M33, we arrive at the primary result of the present study; we find a relative absolute distance modulus of (m-M)o = –0.298 0.016 in the sense of (m-M)o,M31 – (m-M)o,M33 so that M33 is located 0.2980.016 mag further than M31 in the line of sight. de Grijs & Bono (2014) have surveyed the literature and derived a “recommended" distance modulus of (m-M)o = 24.46 0.10 for M31. If we adopt a (m-M)o = 24.46 for M31, then for M33, we get (m-M)o = 24.76. As a result, M31 would be at 780 kpc and M33 at 895 kpc - a difference of 115 kpc - leading to a distance of 236 kpc separating these galaxies in space.
Furthermore, we can use our measurement of the mean magnitude of the ab-type RR Lyrae stars to calculate a distance modulus for M31 or the zeropoint of the MV(RR)[Fe/H] relation if we adopt a distance modulus for M31. In the first instance, there are several choices for the zeropoint of the MV(RR)[Fe/H] relation. For example, Dotter et al.(2010) derive a relation of the form MF606W(HB) = (0.227 0.011)[Fe/H] + (0.802 0.020) using isochrone fitting to Galactic globular clusters observed by HST/ACS. The zeropoint of this relation when combined with the mean magnitude of the RR Lyraes yields an absolute distance modulus of (m-M)o = 24.58 0.02 for M31, where the quoted error is dominated by random errors and does not reflect the contribution of the systematic ones. As a comparison, the "recommended" value from de Grijs & Bono (2014) of (m-M)o = 24.46 0.10 for M31 is statistically consistent with our distance modulus value.
Chaboyer (1999) quotes a RR Lyrae luminosity relation of the form MV(RR) = 0.23[Fe/H] + 0.93. In order to apply this to our results, we convert the 0.93 zeropoint to VegaMag using Equation (2) above after adopting a (V–I)o = 0.6 for the ab-type RR Lyrae variables. Doing this, we arrive at an absolute distance modulus of (m-M)o = 24.56 for M31. Turning the problem around and adopting the “recommended" distance modulus of (m-M)o = 24.46 0.10 for M31 from De Grijs & Bono (2014), we infer a zeropoint of 0.92 for the MF606W(HB) 0.23[Fe/H] relation.
5 Discussion
In their study of the red supergiant content of these galaxies, Massey et al. (2021) adopt a distance modulus difference of 0.20 mag between M31 and M33 as quoted from van den Bergh (1964). Similarly, Massey et al. (2016) adopt 760 kpc (24.40) for M31 and 830 kpc (24.60) for M33 from van den Berg (2000). de Grijs & Bono (2014) present a recommended distance modulus of (m-M)o=24.460.10 for M31 and (m-M)o=24.670.07 for M33 leading to a difference of 0.210.12.
With respect to the dynamical models attempting to study the interaction between M31 and M33, Tepper-Garcia et al. (2020) adopted a distance of 20327 kpc between these two galaxies. This is also the value used in the "canonical" model of van der Marel et al. (2012). Our newly derived value of 236 kpc, which comes from our line-of-sight distance modulus difference of (m-M)o = –0.298 0.016, is substantially different than this value. In fact, our value is higher than any of the distance values adopted by van der Marel et al. (2012), of which 223 kpc is the largest for their "first-M33" model. It stands to reason therefore that this new relative M31-M33 distance could have a significant impact on the outcome of the dynamical models attempting to simulate the interacations between these two galaxies.
6 Conclusions
The primary focus of this work has been to derive a fully self-consistent and therefore fully differential line-of-sight relative distance between M31 and M33 using the ab-type RR Lyrae variables in each galaxy. For our sample of 1501 RR Lyraes in 13 M31 fields and 181 RR Lyraes in 6 M33 fields, and after placing all of these stars on a uniform photometric scale, we find a relative absolute distance modulus of (m-M)o = –0.298 0.016 in the sense of (m-M)o,M31 – (m-M)o,M33.
Acknowledgements
The author is grateful to the Bjorn Lamborn Endowment in Physics for support as this work was nearing completion. The comments from an anonymous referee greatly improved this manuscript.
Data Availability
All of the data used in this work is available in the published articles referenced herein.
References
- (1) Alcock et al. 2000, AJ, 199, 2194
- (2) Bernard, E. et al. 2012, MNRAS, 420, 2625
- (3) Brown, T. et al. 2004, AJ, 127, 2738
- (4) Catelan, M., Pritzl, B. J., & Smith, H. A. 2004, ApJS, 154, 633
- (5) Chaboyer, B. 1999, in Post-Hipparcos Cosmic Candles, ed. A. Heck & F. Caputo (Dordrecht: Kluwer), p. 111
- (6) de Grijs, R., Wicker, J. E., & Bono, G. 2014, AJ, 147, 122
- (7) de Grijs, R. & Bono, G. 2014, AJ, 148, 17
- (8) Harris, W. E. 1996, AJ, 112, 1487
- (9) Jeffery, E. J. et al. 2011, AJ, 141, 171
- (10) Keeping, E. S. 1962, Introduction to Statistical Inference, (Princeton: Van Nostrand )
- (11) Lewis, G. et al. 2013, ApJ, 763, 4
- (12) Mack, J. et al. 2007, ACS-ISR-2007-02
- (13) Massey, P., Neugent, K. F., & Smart, B. (2016) AJ, 152, 62
- (14) Massey, P., Neugent, K. F., Levesque, E. M., Drout, M. R. & Courteau, S. 2021, AJ, 161, 79
- (15) McConnachie, A. et al. 2009, Nature, 461, 66
- (16) Riess, A. et al. 2012, ApJ, 745, 156
- (17) Sarajedini, A. et al. 2006, AJ, 132, 1361
- (18) Sarajedini, A. et al. 2007, AJ, 133, 1658
- (19) Sarajedini, A. et al. 2009, AJ, 138, 184
- (20) Sarajedini, A. et al. 2012, MNRAS, 425, 1459
- (21) Schlafly, E. F. & Finkbeiner, D. P. 2011, ApJ, 737, 103
- (22) Semczuk, M., Lokas, E. L., Salomon, J.- B., Athanassoula, E., & D’Onghia, E. 2018, ApJ, 864, 34
- (23) Sirianni, M. et al. 2005, PASP, 117, 1049
- (24) Tanakul, N. & Sarajedini, A. 2018, MNRAS, 478, 4590
- (25) Tanakul, N., Yang, S. -C., & Sarajedini, A. 2017, MNRAS, 468, 870
- (26) Tepper-Garcia, T., Bland-Hawthorn, J., & Li, D. 2020, MNRAS, 493, 5636
- (27) van den Bergh, S. 1964, ApJS, 9, 65
- (28) van den Bergh, S. 2000, The Galaxies of the Local Group (Cambridge: Cambridge Univ. Press)
- (29) van der Marel, R., Besla, G., Cox, T. J., Sohn, S. T., & Anderson, J. 2012, ApJ, 753, 9
- (30) van der Marel, R., Fardal, M. A., Sohn, S. T., Patel, E., Besla, G., del Pino, A., Sahlmann, J., & Watkins, L. L. 2019, ApJ, 872, 24
- (31) Yang, S. -C., Sarajedini, A., Holtzman, J. A., & Garnett, D. R. 2010, ApJ, 724, 799
- (32)