Selecting Datasets for Evaluating an Enhanced Deep Learning Framework
Abstract
A framework was developed to address limitations associated with existing techniques for analysing sequences. This work deals with the steps followed to select suitable datasets characterised by discrete irregular sequential patterns. To identify, select, explore and evaluate which datasets from various sources extracted from more than 400 research articles, an interquartile range method for outlier calculation and a qualitative Billauer’s algorithm was adapted to provide periodical peak detection in such datasets. The developed framework was then tested using the most appropriate datasets. The research concluded that the financial market-daily currency exchange domain is the most suitable kind of data set for the evaluation of the designed deep learning framework, as it provides high levels of discrete irregular patterns.
Index Terms:
Sequential analysis artefacts, deep learning framework for irregular sequential analysis, sequential prediction environment, enhanced deep learning framework, and irregular sequential patterned dataset.I Introduction
The current technological transformation, named the fourth industrial revolution (4IR) [1] has positively transformed society by its: abundance of data; enhanced connectivity; industrial and workplace automation; autonomous and intelligent agents; artificial intelligence (AI) solutions; the Internet of things (IoT) technologies, etc. [2]. Every other industrial revolution, produced a different type of cutting-edge technology which had its own challenges. Institutions and individuals are investing in a considerable amount of resources such as capital, human talent, infrastructure, hardware platforms, environments and software tools to remain competitive and sustainable. It is important to note that research within 4IR, is assisting science to improve the lives of people. This can be validated by how researchers such as Geoffrey Hinton, Yoshua Bengio, Ian Goodfellow, Andrew Ng, etc., have leveraged developments for the advancement of AI [3].
The underlying challenges associated with existing deep learning frameworks for the analysis of discrete irregular patterned complex sequences were identified [4]. Specific concerns raised were: performance robustness; transparency of the methodology; literature consistency; internal and external architectural design and configuration issues. Inconsistencies and discord in the literature highlight some of the challenges associated with existing approaches to the analysis of irregular sequences and makes it possible to address them. It was suggested that addressing these challenges might lead to a systematic, accurate, stable, explainable and repeatable deep learning framework for the analysis of these types of datasets. The explainability of any system is determined by the ability to present and explain its underlying features in a way that can be understood [5]. The relationship between data and deep learning solutions has become important for the development of better artefacts for analysis [6]. Current interest in innovative developments in the field of AI is often driven by large scale data. Data is both a push and a pull factor for the development of AI technologies, which are producing and consuming an unprecedented abundance of data. For example data is produced by financial markets, social media, astronomy, weather, traffic, surveillance, etc. [7]. There is an emerging trend that datasets are characterised by a high level of irregularities as a result of incompleteness, extreme randomised patterns and noise [8]. Dealing with such massive datasets remains challenging.
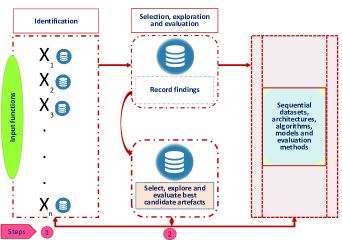
This paper builds towards a framework named the Systematic enhanced deep Learning Framework for Irregular Sequential Analysis (SeLFISA) for the analysis of these kinds of datasets. The framework will be a combination of architectures, algorithms and models aimed at predicting the future behaviour of complex sequences. The intention is to produce an explainable and straightforward framework as part of a solution within the 4IR space. The initial step of such a framework involves selecting suitable and appropriate datasets, which is the focus of this paper. The dataset selection process of the intended SeLFISA framework is shown in Fig. 1. As such, the aim of this research is to address the question: How should such a dataset be identified to evaluate the SeLFISA framework? A design science research methodology guided the research.
Referring to the process in Fig. 1, a class of datasets with irregular patterns were identified as a key stage of developing better deep learning artefacts for sequential analysis. Seventy three sequential datasets from eight domains of different sources were extracted from 400 research articles, by means of a systematic literature review process [4]. Datasets, characterised with the most irregular patterns, were then identified for the evaluation of the deep learning framework. The daily financial market currency exchange domain provided high levels of discrete irregular patterned environments and the Pound to Dollar exchange rate was used for the evaluation.
II Materials and Methods
The implementation process of the SeLFISA framework illustrated in Fig. 1 involves detailed activities at each step to create a systematic, and repeatable way of analysing irregular discrete patterns in sequential environments.
The two steps in the framework shown in Fig. 1 were:
Step 1—Identify existing sequential datasets, analysis artefacts, and an evaluation mechanism using the systematic literature review process (SLR): This stage creates an initial node that receives input from the SLR guided by reporting items for systematic reviews and meta-analyses (PRISMA) [9]. Artefacts in the form of algorithms and models provide hints to guide the choice of implementation approaches, datasets and performance evaluation techniques. This stage focuses on trying to find initial answers to the following questions:
-
1.
Which datasets are sequential in nature with irregular characteristics?
-
2.
Which artefacts in the form of algorithms and models have been applied elsewhere to analyse such datasets?
-
3.
How were those artefacts evaluated in terms of determining their performance?
This step also creates a precondition for implementing the SeLFISA framework by ensuring that it produces repeatable and reliable output.
Failure to satisfy the initial condition will not only affect the entire development process of better artefacts to analyse such datasets but will negatively affect substantiation of the results.
Step 2—Select, explore and evaluate candidate requirements: Here identified datasets, classical algorithms for irregular sequential analysis, and evaluation mechanisms were loaded into a database of records. This was done to implement an ecosystem comprising high performance computing resources coupled with specific software libraries and tools. An analysis that considered different dimensions had to be made and applied to add insights into eradicating elements of inconsistency and ambiguity that may affect future implementation steps and procedures. Once this analysis was done, a selection process commenced based on the following:
-
1)
Datasets—Select a dataset with most irregular patterns. Determine the number of irregular patterns of datasets by combining both descriptive numerical and visualization approaches. Check the levels of irregularity of selected datasets by considering the following:
-
(a)
Box and whisker plot: apply statistical descriptive analysis of irregular patterns on all datasets by considering the interquartile range (IQR) outlier calculation [10]. This approach illustrates the minimum and maximum values of any dataset. The first, second and third quartiles Q1, Q2 and Q3 of the data are shown in the in the box plot. The difference between the minimum and maximum provides the range of values within the dataset. Finally, the difference between Q3 and Q1 provides an inter-quartile range (IQR) given by Equation (1):
(1) Outliers in irregular patterns can easily be detected as those data points that are either one and a half times IQR below Q1 or above Q3, i.e. :
(2) (3) -
(b)
Billauer’s algorithm is used to validate outcomes of the box and whisker plot results and to detect local maxima and minima in a signal [11]. It provides a graphical visualization analysis of peaks to measure the degree of irregularity of the original data environment. The algorithm is then customised to provide irregular-pattern peak period detection (IPPD) which detects discrete peak values by searching for values that are surrounded by lower or larger values for maxima and minima across the y-axis and corresponding x-axis. A look-ahead value for determining the look-ahead distance for a potential peak needs to be a set as a specific value to provide a maximum number of discrete peaks.
-
(c)
Further exploratory data analytics then needs to be conducted for insights into how variables of the chosen sequential dataset are connected to each other. Data description, data pre-processing, data munching, data cleaning, and exploratory data analysis all are executed under this umbrella procedure to understand a dataset in detail.
-
(a)
-
2)
Artefacts—Candidate artefacts were then selected, based on their intrinsic design, application, context and veracity. At this stage, attention has to be focused on topical issues associated with common, debatable and contradicting issues highlighted by different authors. Attention was also paid to the search space through variable clipping.
-
3)
Evaluation—Evaluation allowed for the development of a narrow list of multidimensional performance criteria. This was done to find the best metrics for each criterion that captures the requirements of the sequential analysis challenge. The multidimensional criteria encompass a basket of factors covering complexity accuracy, efficiency, stability, straightforwardness, explainability and repeatability.
III Results
A summary of the results for these implementation steps is given below:
Step 1—The identification of existing sequential datasets, analysis artefacts, and evaluation criteria. This step is an extension of the systematic literature review work [4] which reviewed over 400 research articles from year 2015 to 2020 and narrowed them to the 33 most relevant articles. A summary of identified sequential models, architecture, datasets and evaluation techniques is shown in Table I.
| Sequential Models and Architectures | Sequential Datasets | Evaluation Techniques |
|---|---|---|
| architectures | datasets from domains of different sources. | evaluation techniques |
| See Section VI for Annexure_1_Results.pdf in GitHub. | ||
Step 2—The selection, exploration and the evaluation of candidate requirements
-
i
Datasets—At this stage, all datasets identified were collected into a bank of datasets—see Section VI Annexure_2-Datasets_Models in GitHub. A hybrid high-end computational processing environment was provided by the South African Centre for High Performance Computing which provides NVIDIA GeForce MX130 graphical processing units (GPUs) and random access memory ranging between 20–210 GB, 10 TB HDD; a CUDA toolkit for GPU deployment; Anaconda distribution software with Python and Jupyter Notebook, and the Keras, TensorFlow, Pandas and other libraries.
This dual mathematical and visualisation approach identified a dataset of financial daily exchange data between the GB Pound and the US Dollar from 1990 to 2016 [12] with the highest number of irregular patterns, i.e. 639 from 6135 daily records. The financial daily exchange data between the Japanese Yen and the US Dollar from the same period has around 24 irregular patterns from 5000 daily records.
Applying Billauer’s algorithm produced irregular patterns peak period detection (IPPD) visualisation analysis of the daily exchange data between the GB Pound and the US Dollar. See Fig. 2. The financial daily exchange rate data between the GB Pound and the US Dollar became our primary candidate dataset for the SeLFISA framework evaluation, and the daily exchange rate data between the Japanese Yen and the US Dollar became the elected validation dataset to test performance stability and consistency.
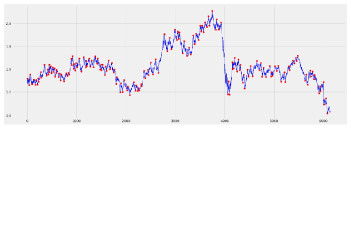
Figure 2: IPPD visualisation analysis of daily exchange data between the GB Pound and the US Dollar from 1990 to 2016 [12] -
ii
Algorithms—The experimental process identified 12 implementable or executable algorithms for sequential analysis from different authors which became the candidate artefacts. The selection process considered a combination of architecture uniqueness and referenced performance properties. Some of these algorithms were based on gated recurrent neural networks (RNN), autoencoders, convolutional neural networks, bidirectional mechanisms, attention mechanisms, ensemble techniques, deep and vanilla architectures.
Specific architectural design features of these 12 selected algorithms were: the gated LSTM architecture suggested [13], [14] and [15]; the bidirectional mechanism combined with both LSTMs and GRUs influenced [16]; the attention mechanism combined with gated neural networks [17]; deep convolutional neural network (CNN) ensemble with LSTM and an attention mechanism [18]; a GRU [19] autoencoders combined with LSTM [20] and finally a deep gated recurrent neural network architectures made up of both GRU and LSTM [21].
-
iii
Evaluation—The following factors were considered as potential performance evaluation criteria with specific metrics: complexity measure through the total number of built parameters of every architecture, accuracy considered a mean absolute error (MAE) which is robust in environments associated with discrete irregular patterns when measuring the average magnitude of the errors in a set of predictions, without considering their direction. Mean squared error (MSE) provided an accuracy performance measure of the variance of the residuals and a quadratic scoring rule of root mean squared error (RMSE) which gives a relatively high weight to large errors. The measures how well the independent variables in the linear regression model predict the dependent variable. The lower the value of MAE, MSE and RMSE the more favourable the performance accuracy of the implemented model. Higher values indicate better performance.
Efficiency was measured as a ratio of execution time and the total number of parameters—whilst explainability and repeatability were identified qualitatively.
IV Discussion
There is still not much agreement on how to solve the challenges posed by the analysis of irregular sequential datasets [4]. Contrary to existing frameworks—which are skewed towards probabilistic randomization or ad-hoc design approaches, which are prone to accuracy, stability, explainability and repeatability deficiencies—the SeLFISA framework aims at addressing these deficiencies [22]. To test the developed framework, appropriate datasets had to be identified.
IV-A Datasets
This paper has shown that analysing discrete irregular patterns or behaviour in sequential environments is more centred on a framework approach beyond just an architecture- or an algorithm- or a model-approach. The framework provides guidance for developing a robust analysis artefact. The suggested SeLFISA framework has proved to be useful—as it integrates outputs and outcomes from a wide range of research approaches to provide a systematic way to address performance, robustness, literature inconsistencies, straightforwardness and design limitations associated with existing sequential analysis techniques. Iterative steps of the SeLFISA framework deliver an explainable and understandable way of determining the levels of irregularity of such datasets. It applied Billauer’s algorithm and mathematical and interquartile range outlier calculations to select, explore and evaluate a variety of sequential datasets [11]. The daily exchange rate data between the GB Pound and the US Dollar has been identified as a dataset which is very suitable for learning because of high irregularity [12]. The daily exchange between the Japanese Yen and the US Dollar data can then be used as a validation dataset.
IV-B Algorithms
On the other hand, models and algorithms designed through gated sequential architectures in the form of LSTMs and GRUs have been widely used in such analysis environments [13], [14], [15]. Thus the guidance from the SeLFISA framework will influence the development of deep learning with artefacts that may demonstrate better performance over these suggested gated models.
IV-C Evaluation
This framework is useful when evaluating performance criteria with specific metrics for a particular analysis artefact. SelFISA provides a multidimensional perspective for examining critical design aspects and properties of chosen artefacts.
V Conclusion and Future Recommendations
The SelFISA framework was developed to address limitations associated with existing sequential analysis techniques. The identification, selection, exploration and evaluation of datasets characterised by irregular discrete sequential characteristics using the SeLFISA framework provides a starting point towards the design of better performing, straightforward, explainable and understandable deep learning analysis artefacts. It creates a consistent shareable technical and literature platform which consists of a knowledge bank of implemented irregular sequential analysis frameworks, datasets, algorithms and literature.
A literature bank of financial sequential datasets with varying complexity was created. This provides a source to the solution of existing literature inconsistencies and deficiencies in explaining the performance of deep learning artefacts for modelling irregular sequential behaviour see Section VI.
It is recommended to further develop the SeLFISA framework to create a consistent shareable technical and literature platform. The framework will consist of a knowledge bank of implemented irregular sequential analysis frameworks, datasets, algorithms and literature.
VI Annexures
The annexures of results and datasets can be found on GitHub: https://github.com/Dandajena/SATNAC_2021_Paper.
VII Acknowledgment
This work is funded by the Research Committee of the University of the Western Cape and Telkom/Aria Technology Africa Centre of Excellence. The work received computational processing environment support from the South African Centre for High Performance Computing.
References
- [1] K. Schwab, The Fourth Industrial Revolution. New York, NY: Crown Business, 2017.
- [2] J. Lee, H. Davari, J. Singh, and V. Pandhare, “Industrial artificial intelligence for industry 4.0-based manufacturing systems,” Manufacturing Letters, vol. 18, pp. 20–23, 2018.
- [3] I. J. Goodfellow, Y. Bengio, and A. Courville, Deep Learning. Cambridge, MA: MIT Press, 2016.
- [4] K. Dandajena, I. M. Venter, M. Ghaziasgar, and R. Dodds, “Complex sequential data analysis: A systematic literature review of existing algorithms,” in Conference of the South African Institute of Computer Scientists and Information Technologists 2020, Cape Town, 2020, pp. 44–50.
- [5] F. Doshi-Velez and B. Kim, “Towards a rigorous science of interpretable machine learning,” arXiv:1702.08608, vol. [stat.ML], pp. 1–13, 2017.
- [6] S. S. Sarmah, “Concept of artificial intelligence, its impact and emerging trends,” International Research Journal of Engineering and Technology, vol. 6, no. 11, pp. 2164–2019, 2019.
- [7] N. Srivastava, G. Hinton, A. Krizhevsky, I. Sutskever, and R. Salakhutdinov, “Dropout: A simple way to prevent neural networks from overfitting,” Journal of Machine Learning Research, vol. 15, pp. 1929–1958, 2014.
- [8] W. Souma, I. Vodenska, and H. Aoyama, “Enhanced news sentiment analysis using deep learning methods,” Journal of Computational Social Science, vol. 2, pp. 33–46, 2019.
- [9] D. Moher, A. Liberati, J. Tetzlaff, and D. G. Altman, “Preferred reporting items for systematic reviews and meta-analyses: the PRISMA statement,” Epub, pp. 123–130, 2009.
- [10] K. M. Myat and S. S. M. Win, “Analysis of outlier detection on structured data,” in Proceedings of 2020 the 10th International Workshop on Computer Science and Engineering, Yangon, Myanmar, 2020, pp. 16–21.
- [11] J. Xiao, H. Li, X. Wang, and S. Yuan, “Traffic peak period detection from an image processing view,” Journal of Advanced Transportation, vol. 2018, pp. 1–10, 2018.
- [12] Y.-Y. Chang, F.-Y. Sun, Y.-H. Wu, and S.-D. Lin, “A memory-network based solution for multivariate time-series forecasting,” arXiv:1809.02105, vol. [cs.LG], pp. 1–8, 2019.
- [13] A. Azlan, Y. Yusof, and M. F. M. Mohsin, “Determining the impact of window length on time series forecasting using deep learning,” International Journal of Advanced Computer Research, vol. 9, no. 44, pp. 260–267, 2019.
- [14] M. Glenski, T. Weninger, and V. Volkova, “Improved forecasting of cryptocurrency price using social signals,” arXiv:1907.00558, vol. [q-fin.ST], pp. 1–11, 2019.
- [15] C. Chalvatzisa and D. Hristu-Varsakelis, “High-performance stock index trading: making effective use of a deep long short-term memory network,” arXiv:1902.03125, vol. [q-fin.ST], pp. 1–30, 2019.
- [16] M. Sardelicha and S. Manandhar, “Multimodal deep learning for short-term stock volatility prediction,” arXiv:1812.10479, vol. [q-fin.ST], pp. 1–40, 2018.
- [17] S. Huang, D. Wang, X. Wu, and A. Tang, “DSANet: Dual self-attention network for multivariate time series forecasting,” in CIKM ’19, Beijing, 2019, pp. 2129–2132.
- [18] M. Mäkinen, J. Kanniainen, M. Gabbouj, and A. Iosifidis, “Forecasting of jump arrivals in stock prices: New attention-based network architecture using limit order book data,” arXiv:1810.10845, vol. [q-fin.TR], pp. 1–29, 2018.
- [19] H. Qin, “Comparison of deep learning models on time series forecasting: A case study of dissolved oxygen prediction,” arXiv:1911.08414, vol. [eess.SP], pp. 1–16, 2019.
- [20] W. Wei, H. Wu, and H. Ma, “An autoencoder and LSTM-based traffic flow prediction method,” in Sensors, Beijing, 2016, pp. 1–16.
- [21] S. Bai, J. Z. Kolter, and V. Koltun, “Deep equilibrium models,” in 33rd Conference on Neural Information Processing Systems (NeurIPS 2019), Vancouver, 2019, pp. 1–16.
- [22] V. Kuleshov, N. Fenner, and S. Ermon, “Accurate uncertainties for deep learning using calibrated regression,” arXiv:1807.00263, vol. [cs.LG], pp. 1–9, 2018.
| Kudakwashe Dandajena is a Ph.D. student in Computer Science at the University of the Western Cape, investigating the optimisation of deep learning algorithms in discrete irregular sequential patterns. He is program manager for the community of scientists of the Next Einstein Initiative at the African Institute for Mathematical Sciences Global Secretariat in Rwanda. Kuda holds a Master’s degree in Computer Science. Mobile: +25078 582 1565. |
| Isabella M. Venter is an Emeritus Professor in Computer Science at the University of the Western Cape, South Africa and the Chair of the Management Committee of the Telkom/Aria Technologies Africa Centre of Excellence. Her research interests include: computer science education, human computer interaction and information communication technologies for development. Mobile: +2782 202 3520. |
| Mehrdad Ghaziasgar holds a PhD in Computer Science and is a Senior Lecturer in Computer Science at the University of the Western Cape. He heads up the Assistive Technologies Research Group at the Department which investigates applications of computer vision and machine learning to novel assistive technologies. Tel: +2721 959 3012. |
| Reg Dodds has lectured in Computer Science at Stellenbosch, Natal, Port Elizabeth Universities and at the University of the Western Cape. |