Outflows from starburst galaxies with various driving mechanisms and their X-ray properties
Abstract
Outflows in starburst galaxies driven by thermal-mechanical energy, cosmic rays and their mix are investigated with 1D and 2D hydrodynamic simulations. We show that these outflows could reach a stationary state, after which their hydrodynamic profiles asymptotically approach previous results obtained semi-analytically for stationary outflow configurations. The X-rays from the simulated outflows are computed, and high-resolution synthetic spectra and broadband light curves are constructed. The simulated outflows driven by thermal mechanical pressure and CRs have distinguishable spectral signatures, in particular, in the sequence of the keV K lines of various ions and in the L-shell Fe emission complex. We demonstrate that broadband colour analysis in X-rays is a possible alternative means to probe outflow driving mechanisms for distant galaxies, where observations may not be able to provide sufficient photons for high-resolution spectroscopic analyses.
keywords:
galaxies: starburst – hydrodynamics – ISM: jets and outflows – X-rays: galaxies – cosmic rays – methods: numerical1 Introduction
Large-scale outflows (winds) in galaxies are often initiated by star-forming activities, e.g. in the nearby starburst galaxies Arp 220 (e.g. Varenius et al., 2016; Barcos-Muñoz et al., 2018), M82 (e.g. Shopbell & Bland-Hawthorn, 1998; Bland & Tully, 1988) and NGC 253 (e.g. Walter et al., 2017; Krieger et al., 2019), while more distant, younger galaxies are also known to host such phenomena (Frye et al., 2002; Rubin et al., 2014; Rupke et al., 2005a; Arribas et al., 2014). These outflows develop from the confluence of stellar winds from young stars, and energetic particles and gas from supernova events. Galactic outflows tend to have a bi-conical structure, extending above and below the plane of their host galaxy, following the path of least resistance through the interstellar environment (Veilleux et al., 2005). The structures of outflows, however, vary among galaxies, showing a variety of subtleties in morphology and dynamics. Velocities of galactic outflows are mostly between km s-1 (Cecil et al., 2002a; Rupke et al., 2005b; Rubin et al., 2014). Outflow extents may reach a few tens of kpc (Veilleux et al., 2005; Bland-Hawthorn et al., 2007; Bordoloi et al., 2011; Martin et al., 2013; Rubin et al., 2014; Bordoloi et al., 2016), often with X-ray emitting gas at lower altitudes bound by a cap a few kpc from the starburst nucleus (Strickland et al., 2000; Cecil et al., 2002b; Cecil et al., 2002a; Devine & Bally, 1999; Tsuru et al., 2007). The gas temperature in some outflows may reach K (McKeith et al., 1995; Shopbell & Bland-Hawthorn, 1998). There is evidence of multi-phase structure in galactic winds, with cooler dense clumps, of temperature (Strickland et al., 1997; Lehnert et al., 1999), entrained within the hot gas (see Heckman, 2003; Zhang et al., 2014; Walter et al., 2017; Wu et al., 2020). The presence of this multi-phase structure implies the coexistence of material with very different structural and local thermal conditions. The diversity of the physical conditions within an outflow naturally gives rise to a multitude of radiative processes, and this complexity is not often present in more uniform astrophysical systems.
Non-AGN associated outflows are a consequence of star-forming activities in galaxies. Such outflows carry away energy, gas and metals from star-forming regions to the circum-galactic medium of their host galaxy. This regulates the inflow of circum-galactic gas and, hence, subsequently star formation activity, thus acting as a feedback mechanism alongside other processes operating within the interior of the host (e.g. Owen et al., 2018). This inter-dependence between galactic outflows and the star-forming activity of a galaxy implies that the two processes co-evolve together (see Mannucci et al., 2010). Thus, the thermal and hydrodynamic (HD) properties and the observational characteristics of galactic outflows would show evolutionary trends (see Sugahara et al., 2019). This is consistent with the finding that galactic properties and sizes vary over redshift (with younger galaxies at higher redshift being bluer and smaller than those at , see Madau et al., 1996; Dickinson et al., 2003).
Outflows driven by thermal mechanical pressure, radiation, and cosmic rays (CRs), were investigated by Yu et al. 2020 (hereafter Y20) using a phenomenological HD model (see also Chevalier & Clegg, 1985; Thompson et al., 2015; Sharma & Nath, 2013; Ipavich, 1975; Samui et al., 2010). Outflows predominantly driven by thermal mechanical pressure were found to be the hottest and have the highest velocities. Radiation-driven outflows are unable to attain similar velocities for realistic opacities. These tend to be cooler and denser, and are prone to cooling instability. CR-driven outflows have velocities which fall between thermal-mechanically driven and radiatively driven cases. They could be very extended in altitude (see, e.g. Jacob et al., 2018), when their entrained magnetic field is sufficiently strong to interact with CRs.
Although analytical studies, e.g. Chevalier & Clegg (1985) and Y20, provide some useful insights, they have their limitations (cf. the recent numerical simulations of Tanner, 2020), e.g. they cannot describe the time-dependent development of an outflow, or model the transition of an outflow from a transient to a stationary state. They are also unable to determine if an outflow even has a stationary state. An example of such would be an outflow from a galaxy with a very massive dark-matter halo. Outflow gas would be trapped by its deep gravitational well, being unable to escape into intergalactic space. The metal-enriched gas trapped under the gravity of the dark-matter halo would return back to the host galaxy, fueling subsequent episodes of star formation (see e.g. Fox & Davé, 2017, for various aspects of the galactic recycling process). Another example is the fragmentation of a flow subject to strong radiative cooling. This induces instabilities and leads to the development of multi-phase gas components in the flow. The phase transition between the components is regulated by thermal mechanical (e.g. shocks) and ionisation processes, which compete with each other globally and locally (see e.g. Hoopes et al., 2003), hence contributing to the regulation of the HD energy and momentum budget.
This paper presents a time-dependent study
of galactic outflows using HD simulations.
It is an extension of
the phenomenological study of Y20,
with a focus on outflows driven by thermal mechanical pressure,
CRs and their mix.
§ 2
presents the HD formulation
and its numerical implementation
using a FLASH-based code.
§ 3
shows the results of our numerical simulations
of galactic outflows with the considered driving mechanisms,
and § 4
shows the X-ray emission computed from the simulated outflows.
Astrophysical implications are discussed in § 5,
and a conclusion is presented in § 6.
2 Time-dependent Model
The outflows are comprised of two coupled fluid components: a hot ionised thermal gas, and CRs. The flows are inviscid and non-turbulent. CRs are treated as a relativistic non-thermal fluid with pressure but negligible bulk kinetic energy (cf. the approach adopted by Ipavich, 1975; Breitschwerdt et al., 1991). The outflows are driven by either thermal mechanical pressure (associated with the thermal content of the gas), CRs or their mix. Radiative cooling is included in the simulations, unless otherwise stated. A spherically symmetric geometry is assumed in the 1-dimensional (1D) simulations, and a cylindrical geometry is assumed in the 2-dimensional (2D) simulations.
The HD formulation is the same as in Y20, but with full consideration of the evolutionary and time-dependent properties of the flows. This formulation is valid, provided that the ram pressure of a galactic outflow is sufficiently larger than the pressure of the ambient gas. (Note that the radial profiles and 2D plots shown later in this paper extend only to 10 kpc, which is smaller than the virial radius of their host galaxy, to ensure this constraint is met.) Unless otherwise stated, we adopt the reference model parameters listed in Table 1. These parameters are appropriate for star-forming galaxies resembling the nearby starburst galaxy M82.
2.1 Hydrodynamic formulation
The HD equations describing the outflows are:
| (1) | |||
| (2) | |||
| (3) | |||
| (4) |
Here, is density, is velocity, is pressure and is total energy per unit mass for the fluid component. The corresponding quantities for the CR component are , , and . ) is the external force term, which is the sum of radiative and gravitational forces (see § 2.1.2). is the radiative cooling rate of the thermal gas, is the energy transfer rate from the CR to the thermal component of the wind, and , and are the injection rates of mass, energy and CR energy respectively (see § 2.1.3 for details). Setting the partial time derivatives in Equations 1 to 4 to zero gives the set of HD equations for stationary-state flows. Solutions to these were obtained by Y20, providing a model describing galactic outflows after they have reached a stationary state. Here, we consider more general time-dependent flows with specific driving mechanisms and initial conditions, using numerical HD simulations.
2.1.1 Cosmic rays
The CRs are treated as a relativistic fluid with pressure. The bulk kinetic energy of the CRs, which is negligible compared to the CR pressure, is assumed to have no direct mechanical interaction with the gas component of the outflow. The rate of energy transfer from the CRs to the gas, which is magnetised and is assumed to be in local thermal equilibrium, is given by
| (5) |
(see Ipavich, 1975; Breitschwerdt et al., 1991), where is the Alfvén velocity. Unlike AGN jets, galactic wind outflows are not magnetically collimated, and the magnetic fields are carried along with gas flows. The magnetic fields are therefore tangled. As such, we may take an effective field strength to derive the magnitude of the Alfvén velocity. Without losing generality, the global direction of the Alfvén velocity vector is assumed to be in the same direction as the flow velocity, i.e. , where
| (6) |
as in Y20, where is the radial position along the outflow, and .
The radius of the starburst region is set to be , a value similar to that estimated for the M82 starburst core (see de Grijs, 2001). The magnetic field strength of the starburst region is set to in the fiducial case. This strength is comparable to estimates of M82 (Klein et al., 1988). The magnetic field here is not self-consistently derived from CR streaming and HD, but for the purposes of this work, this treatment will give an acceptable rate for the transfer of energy from the CR fluid to the gas. A more complicated numerical magneto-hydrodynamic treatment does not necessarily give more reliable results, when the exact interactions between CRs, magnetic fields (including their seeding) and gas (which is clumpy, not fully ionised and out of local thermal equilibrium) are uncertain. Our previous calculations (Y20), which were conducted under a stationary condition, demonstrated that outflows with (where CR heating cannot be facilitated) would yield temperatures several times lower than outflows with (where CR heating can contribute substantially). Similar effects are expected in outflows, where the stationary condition is relaxed.
| Parameter | Value | Reference |
| de Grijs (2001) | ||
| de Grijs (2001) | ||
| Veilleux et al. (2005) | ||
| Veilleux et al. (2005) | ||
| a | Li & Draine (2001) | |
| b | Klein et al. (1988) | |
| c | Oehm et al. (2017) | |
| c | Oehm et al. (2017) | |
| c | Oehm et al. (2017) |
a is the mean opacity of the wind, averaged over all frequencies.
b is the maximum galactic magnetic field strength (external to the wind).
c , and are the parameters for the Navarro et al. 1996 DM profile.
2.1.2 External forces
In equation 3, represents the external forces acting on the gas, which is the combination of the radiative force and the gravitational force. The radiative force is provided by the radiation from the starburst core. It is proportional to the gas density and the effective opacity of the gas, , weighted across all wavelengths. It also depends on the radiation field, and is hence determined by the local radiation energy density, which, at the location , is given by , where is the speed of light. In our calculations, we take (Li & Draine, 2001), which corresponds to a strong radiative driving scenario. For radiation uniformly emitted from the starburst core, the luminosity, as seen by the gas at , can be parametrised as
| (7) |
This implicitly assumes that the decrease in luminosity over distance is predominantly caused by geometrical dilution of the radiation field, instead of by absorptive attenuation through its interaction with the outflowing gas. The luminosity of the radiation generated by the starburst core, , specifies the radiative power injected into the system (see also § 2.1.3).
The gravitational force is provided by the dark matter (DM) halo of the galaxy, which takes the form of a Navarro-Frenk-White profile:
| (8) |
where
| (9) |
(Navarro et al., 1996). Here is the total halo mass, is the virial radius of the halo, and is the halo scale radius. The fiducial values adopted in this study are , and , from Oehm et al. (2017). These values are appropriate for the DM halo of a galaxy similar to M82. The total external force, accounting for radiation and gravity, is therefore
| (10) |
2.1.3 Source terms
The source terms in the HD equations are given by
| (11) |
for mass,
| (12) |
for energy, and
| (13) |
for CR energy, where is the total mass injection rate, and and are respectively the energy injection rates into the thermal gas and CR fluid across the entire starburst region. Unless stated otherwise, matter and energy are injected at constant rates, uniformly throughout the starburst region.
The mass injection rate, , and the total energy injection rate, , are parametrised by the star formation rate (SFR) , and are given by
| (14) |
where 0.26 is the estimated fraction of mass lost to stellar winds and supernovae (SNe) (computed using Starburst99, if adopting solar metallicity – see Leitherer et al. 1999; Veilleux et al. 2005), and
| (15) |
(Veilleux et al., 2005; Leitherer et al., 1999), with values scaled from M82, for which (de Grijs, 2001). 90% of the total injected energy is radiated away (Leitherer et al., 1999; Thornton et al., 1998), and only the remaining 10% is available to drive the system (via CRs or thermal pressure). We take the CR and thermal powers to be equal in our fiducial model, i.e.
| (16) | ||||
| (17) | ||||
| (18) |
where , , and . We vary and investigate these driving efficiencies in § 3.2.
2.1.4 Cooling
Cooling processes play an important role
in regulating the thermal properties and HD of galactic outflows
and, hence, their observational characteristics
(see e.g. Silich et al., 2004).
A self-consistent treatment of radiative heating and cooling
in the presence of magnetic fields and CRs
is non-trivial and computationally demanding.
For the purposes of this work,
a simplified treatment of a cooling function is sufficient to give acceptable qualitative results to investigate the impacts of the three different driving mechanisms
of galactic outflows.
A cooling function generally
depends on the local properties of the flows,
such as the thermal temperature and gas density .
The CLOUDY code111http://www.nublado.org/ (Ferland
et al., 2017)
is used to compute the cooling function,
(see also Sutherland &
Dopita 1993),
giving a cooling rate
(see equation 3),
where is the mean molecular mass,
i.e the same value
as that adopted in Veilleux et al. (2005).
2.2 Code implementation and treatment of cosmic rays
FLASH222http://flash.uchicago.edu/ version 4 (Fryxell
et al., 2000; Dubey
et al., 2008), a Eulerian grid code,
is used as the numerical solver for the HD
equations 1 to 4.
The CRs are treated as a single fluid, i.e.
the CR species, their energy spectra
and the CR cooling/heating processes
associated with individual species are not considered explicitly.
The energy evolution of the CR fluid is determined by
, where the equation of state, , is adopted with an adiabatic index . The thermal gas pressure is computed using the equation of state where, this time, the adiabatic index is . All source terms are implemented with a 2nd order central difference method.
The initial values of , , and are used throughout the grid in all the simulations, with other necessary initial HD quantities being derived from these. The 1D simulations have spherical symmetry and an extent of 10 kpc, with a resolution of about 4.88 pc. The 2D simulations have cylindrical symmetry in a square simulation grid with 10 kpc on each side, and a resolution of about 19.53 pc. Uniform grid is used in all simulations, and the ”outflow” boundary conditions are set at the edge of the simulation domain, except in cases where ”reflecting” boundary conditions (e.g. between quadrants in 2D cylindrical simulations) can make use of the symmetry of the model to avoid unnecessary duplication of computations in equivalent simulation regions.
2.3 Numerical simulations
| Run ID | 1D/2D | Cooling | HD section(s) | X-ray section(s) | |||||
Sim1C |
1D | ✓ | 0.05 | 0.05 | 0.9 | 1 | 3.1.1 | 4.2, 4.3 | |
Sim1c |
1D | ✗ | 0.05 | 0.05 | 0.9 | 1 | 3.1.1 | 4.2.1, 4.3 | |
Sim2C |
2D | ✓ | 0.05 | 0.05 | 0.9 | 1 | 3.1.1 | N/A | |
Sim2c |
2D | ✗ | 0.05 | 0.05 | 0.9 | 1 | 3.1.1 | N/A | |
Sim1CR |
1D | ✓ | 0.025 | 0.075 | 0.9 | 1 | 3.2 | 4.2.2, 4.2.3, 4.3 | |
Sim1th |
1D | ✓ | 0.075 | 0.025 | 0.9 | 1 | 3.2 | 4.2.2, 4.2.3, 4.3 | |
Sim1P |
1D | ✓ | 0.05 | 0.05 | 0.9 | 1 | 3.3.1 | N/A | |
Sim2P |
2D | ✓ | 0.05 | 0.05 | 0.9 | 1 | 3.3.1 | N/A | |
Sim1S |
1D | ✓ | 0.05 | 0.05 | 0.9 | 1 | 3.3.2 | 4.3 | |
Sim2C2 |
2D | ✓ | 0.05 | 0.05 | 0.9 | 2 | 3.4 | N/A | |
Sim2C5 |
2D | ✓ | 0.05 | 0.05 | 0.9 | 5 | 3.4 | N/A | |
Sim2C10 |
2D | ✓ | 0.05 | 0.05 | 0.9 | 10 | 3.4 | N/A |
We perform numerical simulations to investigate the evolution and characteristics of outflows emerging from star-forming galaxies. They are appropriate for outflows in starburst galaxies similar to M82. The fiducial model in this study adopts the parameters listed in Table 1, and four sets of simulations are conducted to investigate different scenarios, whose characteristics are summarised in Table 2.
The first set of simulations investigates
the effects of radiative cooling,
and the consistency between 1D and 2D simulations.
Sim1C is the 1D reference case
(with parameters in Table 1).
Sim1c adopts the same parameter choices, but
with no radiative cooling.
Sim2C and Sim2c
are the corresponding cases in a 2D configuration.
The second set of simulations investigates
the relative efficiency of thermal mechanical pressure and CRs
in driving the outflow.
For realistic opacities,
radiation is inefficient in driving an outflow
when compared to thermal mechanical pressure and CRs.
We set (Leitherer
et al., 1999; Thornton et al., 1998)
in this set of simulations,
so that we can discern
the partition between thermal mechanical and CR drivings
with more clarity.
In Sim1C, the reference case,
the fractions of energy supplied to the thermal and CR components of the outflow are equal, i.e. and . The injection of energy supplied to CRs dominates in Sim1CR where and , while Sim1th is thermally dominated with and .
The third set of simulations investigates
the effects of the variations in .
In Sim1P and Sim2P,
we assign the variations as stochastic fluctuations,
which is a Poisson process caused by SN events.
A SN event rate
(de Grijs, 2001; Veilleux et al., 2005)
is adopted,
and the event rate in each time step of the simulation
is determined following a Poisson distribution.
In Sim1S we consider multiple episodes of star-forming activities.
Without losing generality,
we consider periodic star formation episodes.
The strengths of the episodes are roughly equal
and a sinusoidal model is adopted for the SFR:
| (19) |
with and . This suffices to mimic successive alternation of quenching and rejuvenation of star formation in the galaxy.
The last set of simulations investigates the effects of the starburst region’s geometry. Without losing generality, we adopt a simple geometrical model in terms of the aspect ratio of a starburst core. The starburst core is an ellipsoid, with a height and radius , which can be parametrised by the ratio . In the simulations, three values of are considered: 2, 5 and 10. The volume of the ellipsoid is conserved in all cases, with , where retains its fiducial value.
3 Hydrodynamics of outflows
3.1 General characteristics
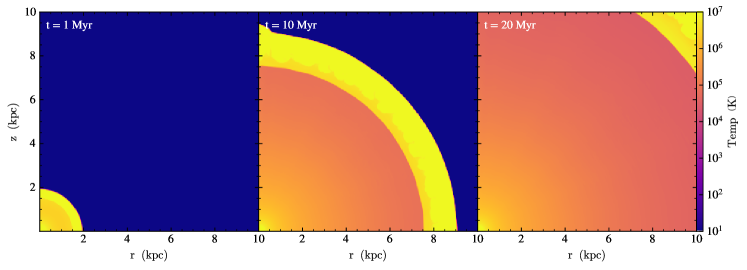
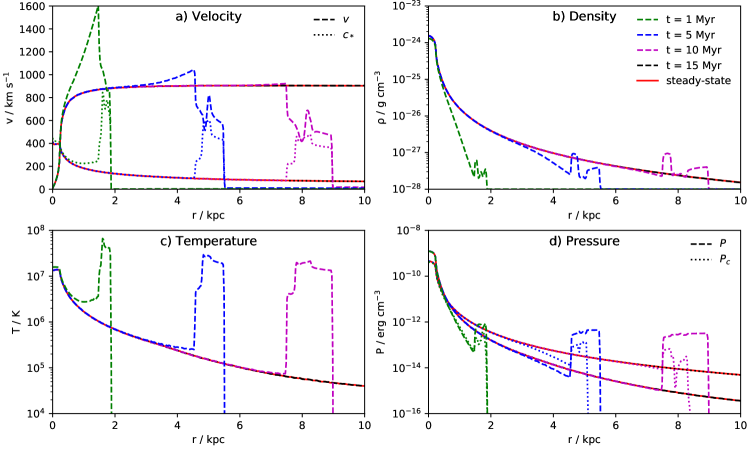
Figure 1 shows the 2D temperature map
in simulated galactic outflows
at three different evolutionary stages for the fiducial case, Sim2C.
Figure 2
shows the corresponding
radial velocity, sound speed, density,
temperature and pressure profiles at four different evolutionary stages,
against the stationary-state profiles
obtained at the end of the simulations.
As shown,
the stationary state is reached by 15 Myr
in this case.
The right-most panel
in Figure 1
shows the temperature profile
of the outflow at 20 Myr,
which is essentially
the stationary-state temperature profile.
The asymptotic stationary-state profiles of the flows
shown here
are in good agreement with those obtained by calculations
using the analytic approach of Y20 (see Appendix A),
if adopting the same set of system parameters.
The interstellar gas is initially uniform in density and temperature. The injection of material and energy from the starburst region exerts a pressure force onto the surrounding interstellar medium (ISM), pushing gas outwards. The material leaves the starburst region, accelerates, and a hot “bubble” of gas begins to develop. As this bubble expands, an outflow is launched, with its maximum value greatly exceeding the velocity expected for a stationary-state flow. Its front quickly acquires a supersonic speed (cf. the flow velocity and the sound speed333The effective sound speed is given by (20) (Ipavich, 1975; Breitschwerdt et al., 1991). profiles in panel a of Figure 2), and a shock is formed in the interface between the outflow and the ISM.
As the hot bubble expands and the outflow proceeds, the shock propagates outward and a shock transitional layer is formed. The cooling time of the material in the shock transition layer is longer than the dynamical time of shock propagation, and the shock is approximately locally adiabatic. This is indicated in panel c of Figure 2, as the shock jump temperature does not decrease significantly, and the thickness of the shock transitional layer grows with the bubble’s expansion, i.e. with the development of the outflow. Behind the shock transitional layer, the post-shock flow settles asymptotically to attain its stationary-state profile, on a time scale Myr (see panels b and d of Figure 2).
When the shock sweeps through the ISM, it produces a hot, dense shell of compressed gas. The swept-up material accumulates inertia and thus slows down the shock propagation. By Myr, becomes comparable to the stationary-state “wind” outflow velocity (a of Figure 2). At this stage, after the initiation of the material and energy injection, the entire post-shock outflow behind the shock transitional layer settles almost immediately into its stationary-state configuration. This is in contrast to post-shock flow in the earlier stages in the development, where and a substantial amount of time is required for the flow to settle into its corresponding stationary-state profile.
The timescale for the system to reach stationary state is comparable to the global dynamical timescale of the outflow, which may be expressed as . Such time scales are much shorter than the duration of a starburst episode (expected to last Myr) of a starburst galaxy similar to M82. Thus, we may conclude from this simulation that the outflow would quickly settle into a stationary state (if the conditions allow such a configuration to be reached), implying that most of the outflows observed in the starburst galaxies would have already settled into their stationary-state configurations.
While the outflow beyond the starburst region is supersonic, the flow within the starburst region is subsonic in our model (where , for ). With the subsonic flow in the region and the flow velocity set to be at , the velocity of the outflowing gas would need to increase very substantially in the starburst region and through its interface with the outflow beyond the region. Note that the injection terms , and adopted in the model resemble a step-function, which results in a very strong pressure gradient across the boundary region . With these distinct boundary conditions, the acceleration in the starburst region and through its boundary could be artificially extreme. The increase in flow velocity would be more moderate through this point if a smoother boundary to the injection region is considered, as shown in some studies (e.g. Owen et al., 2019a). Provided that the total amount of material and energy injected in the flow beyond the starburst region is properly accounted for, the detailed treatment of the micro-physics in the transitional boundary interface zone has inconsequential global impacts on the macroscopic HD structures and thermal properties of a galactic outflow.
3.1.1 Effects of cooling
The radiative cooling of gas in an outflow
generally produces one of three outcomes
(see Silich et al., 2004).
(1) Radiative cooling is inefficient
in tenuous (and hot) outflows,
as both free-free and bound-free processes
are strongly dependent on the gas density.
With negligible radiative energy loss,
the flows are indistinguishable from
flows where radiative cooling is not considered.
(2) Radiative cooling is effective in warm, dense outflows.
Severe radiative cooling
can cause fragmentation in the outflow,
and clumps are formed under self-gravity.
This fragmentation would destabilise an outflow,
and those with strong radiative losses
are often unstable.
Clumpy outflows are multi-phase fluids.
The complexity in the phase transitions and interactions,
together with HD instabilities,
make the outflow highly variable.
(3) Between the two extreme situations above
are cases where cooling in the flow
is significant,
but not substantial enough
to prevent a stationary state from being reached.
The outflow in simulation Sim1C,
is an example of this scenario.
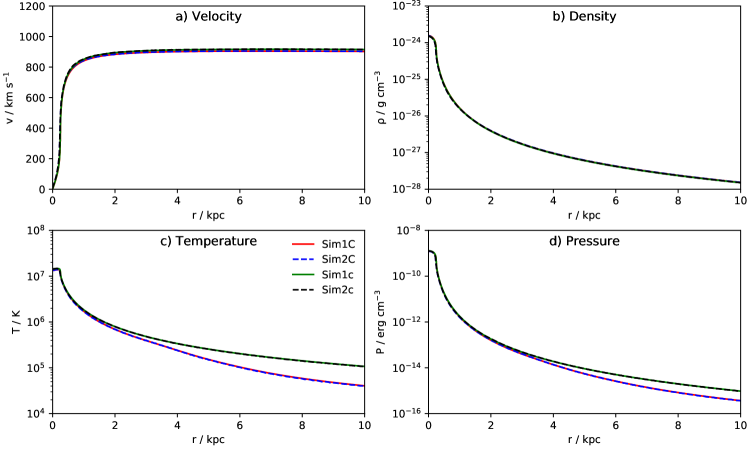
Figure 3 shows the comparison
of outflows with cooling (Sim1C) and without cooling
(Sim1c),
after they have reached their stationary states.
The stationary-state temperature and pressure profiles
of an outflow are modified in the presence of cooling.
As shown, the temperature and pressure in the outflows
are lower in Sim1C than in Sim1c
at large radii,
and in Sim1C the gas temperature of the outflow
shows a noticeable drop
near , at .
The velocity profile is slightly adjusted
when radiative cooling is present
(as the thermal pressure would be reduced, hence altering the pressure force,
when some portion of thermal energy in the gas is radiated away).
The density is, however, less affected by radiative cooling.
3.1.2 Comparison between 1D and 2D simulations
2D flows and 1D flows
can show very different thermal and dynamical properties.
These differences can be manifested in their HD instability.
For example, Kelvin-Helmholtz instabilities and Rayleigh-Taylor instabilities,
commonly present in astrophysical flows,
occur in 2D flows but are not allowed in 1D flows.
There are certain instabilities
that can occur in 1D as well as 2D flows –
an example being the thermal instability
in non-relativistic shocked heated flows
in accreting magnetic compact objects
(e.g. Chevalier &
Imamura, 1982; Saxton et al., 1998).
While dimensionality-introduced instabilities
can be important in time-dependent flows,
they would either reach saturation or be damped out
if the system can evolve into a stationary state.
The galactic outflows investigated in this study
could evolve into a stationary state, at least locally,
for certain conditions appropriate for starburst galaxies.
It is therefore useful to compare
the resulting HD structures
of the outflows obtained in 1D and 2D simulations.
In the comparison we consider
the 1D simulated flows
(Sim1C with radiative cooling and Sim1c without radiative cooling),
which assume a spherical symmetry,
and 2D simulated flows
(Sim2C with radiative cooling and Sim2c without radiative cooling),
which assume a cylindrical symmetry,
when they reach their corresponding stationary states.
As shown in Figure 3,
the stationary-state profiles of the 1D and 2D outflows, with or without radiative cooling,
agree remarkably well.
Their agreement is of astrophysical importance,
as it implies that
1D simulations are sufficient to generate templates
of galactic outflow HD profiles
in post-processing radiative transfer calculations,
for the systems that reach a (quasi-)stationary state.
3.2 Driving mechanisms
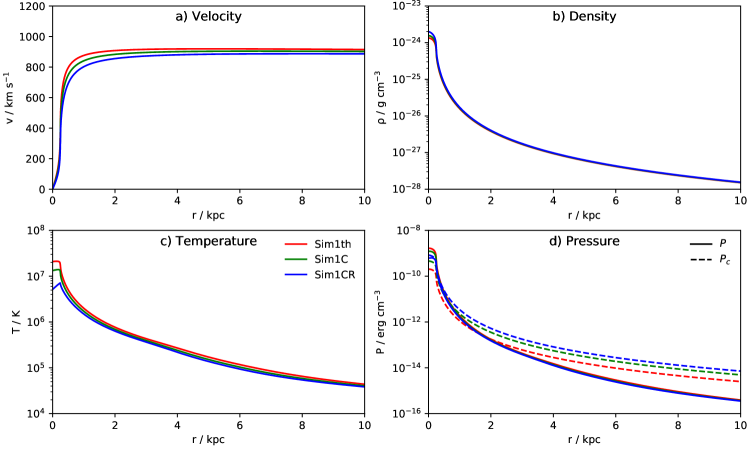
As radiative pressure is inefficient in driving the outflow in general situations, this study puts focus in outflows driven by thermal mechanical pressure and/or CRs. Table 2 lists the configuration of the simulations (and the HD formulation can be found in § 2.1.3). The stationary-state results were already presented in Y20, which showed, in general, thermal mechanical pressure is an effective mechanism to accelerate the gas in the outflows. The efficiency of CRs is weaker in comparison, and the gas at the base of the outflow has lower temperatures relative to the thermally-driven case. This can be seen in Figure 4, where the radial HD profiles of Sim1th (thermal-mechanically driven), Sim1CR (CR driven), and Sim1C (both) are shown. While the temperature of the central region in Sim1CR is low, the CRs can be seen to provide a driving effect at larger distances, via Alfvénic coupling. As a consequence, the gas is not only accelerated but also heated. This results in a shallower temperature gradient in an outflow at large galactocentric distances.
3.3 Star formation rate
3.3.1 Stochastic variation
In the simulations,
when a fixed SFR ()
is used to parametrise
the injection of energy and mass from the starburst core
into the outflows,
a time-averaged rate
(associated with star formation and hence SN activity)
is implicitly adopted.
This implementation does not always fully capture
the full picture of how galactic outflows
are determined by the star formation activity
in the galaxies, which, in reality, is not stationary.
Time variations in the energy injection and their effects
are addressed in the simulations Sim1P and Sim2P,
by introducing fluctuations of
in each simulation time step.
Stochastic variations are assigned to SN events,
specified by a rate ,
assuming a Poisson process.
The sole parameter of these Poisson fluctuations is
the expected value of the SN rate,
(and this value can be considered as statistically equivalent
to the time-averaged value of the SN event rate).
A SN event rate
(appropriate of M82-like galaxies, see e.g. de Grijs, 2001; Veilleux et al., 2005)
is adopted in the simulations Sim1P and Sim2P.
As the simulated outflow approaches stationary state, the time step is roughly 250 yr, which corresponds to an expected value of 50
SN events in each time step,
with a variance of 50 events
for Poisson fluctuations.
The HD profile of the outflows
obtained in Sim1P and Sim2P
are indistinguishable
from those of Sim1C and Sim2C respectively,
implying that
stochastic amplitude variations,
following a Poisson process,
on time scales shorter than
the dynamical time of the outflow ()
have no significant effects
on the asymptotic properties of outflows
that have reached a stationary state.
Hence,
assuming a parametric mean SFR is sufficient
for the general application purpose
when the variations are not on timescales
comparable to the dynamical timescale of the outflow.
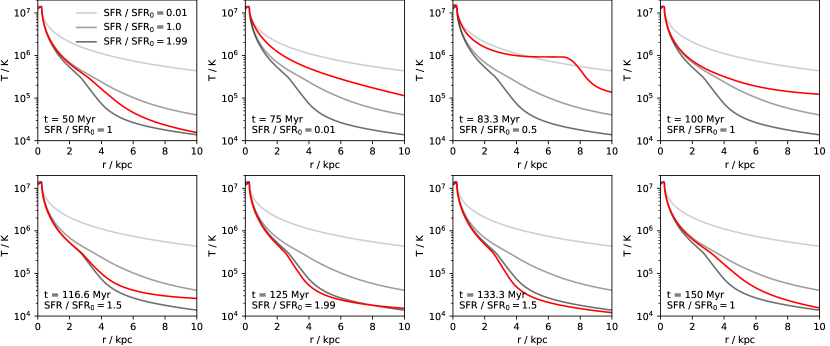
3.3.2 Episodes of starburst and quenching
The SFR in galaxies may vary over time, on timescales comparable to or longer than the dynamical time of the outflows. The burst of star formation in M82, induced by its last tidal encounter with M81 has substantially subsided, as indicated by age analyses of its the stellar population (see de Grijs, 2001; Mayya et al., 2004). Some proto-galaxies, e.g. MACS1149JD1, at (Hashimoto et al., 2018), had already exhibited multiple episodes of rapid star formation and quenching within a very short interval of a few hundred Myr (see e.g. Owen et al., 2019b, for a possible mechanism to quench star formation in very young galaxies in the early Universe).
The effects of episodic
star formation and quenching
on the HD properties
of galactic outflows
are investigated
in the simulation Sim1S.
Figure 5 shows the
temperature profiles in outflows
obtained by Sim1S
at eight different times.
The simulation adopts a cyclic variation in the SFR,
modelled by a sinusoidal function with cycles of 100 Myr,
a timescale appropriate for merger-driven starbursts
(see e.g. Di Matteo et al., 2008),
as described in equation 19.
The variations in the temperature profiles over time,
though still a cyclic process,
have a certain subtleness
because of the response of the gas in the outflow
to the time-dependent boundary conditi on
(via the cyclic SFR variations).
The first and the last panels
correspond to
the initial and last evolutionary stage
of a 100-Myr cycle.
Before this cycle begins,
the initial shock
has already propagated out of the simulation domain.
The simulation shows that
the outflow temperature
at a given time and position
can be approximated
by the value obtained from an analytic calculation
at its designated SFR,
with a time delay that is proportional
to the galactocentric distance .
This delay is characterised by the dynamical timescale
of the outflow,
which is approximately given by
(similar to § 3.1).
Simulations of flows with
shorter SFR cycles (10 and 30 Myr) were also conducted,
but we found that the behaviours are qualitatively similar
to the cases presented above,
with the timescales of variations in the HD variables
shortened accordingly.
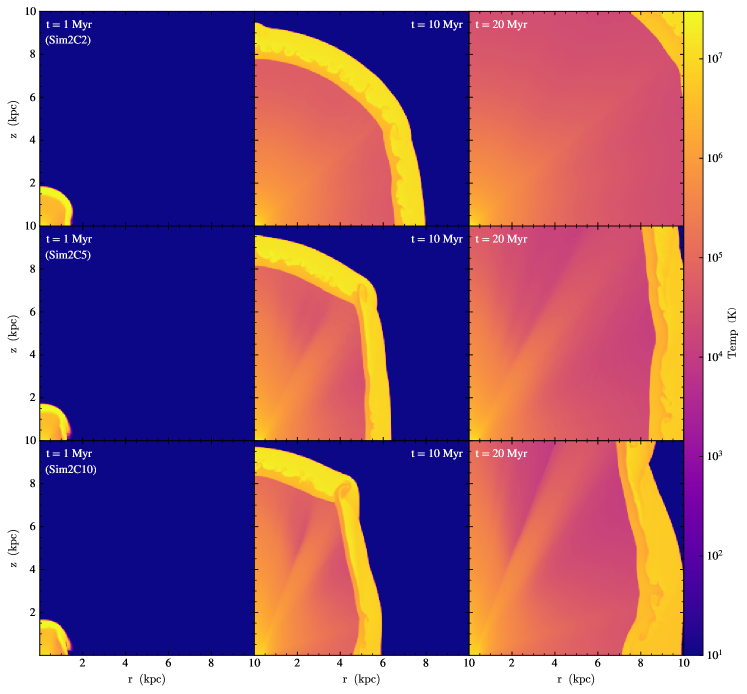
3.4 Geometry of the starburst region
The morphology of outflows is predominantly governed by the path of least resistance encountered by a developing wind in the ISM of the galaxy. This typically result in a bi-conical structure (Veilleux et al., 2005). So far a spherical starburst core has been considered in the simulations. If the starburst core deviates substantially from a sphere, this path of least resistance would alter, thus modifying the development of outflow and hence its morphology and HD structure. Although 3D simulations with a realistic ISM distribution would be needed in order to better capture the details of geometrical effects and the convolution of geometry with astrophysical processes, 2D simulations can still provide useful insights into how geometry of the starburst core would affect the outflow that it launches to engage with a surrounding ISM. 2D simulations are therefore conducted in this study, with non-spherical central star-forming regions (starburst cores).
The shape of the starburst core
is a geometrical boundary condition
in the HD formulation.
As 2D simulations would require
an axi-symmetric boundary condition,
axi-symmetric ellipsoids
are the assumed geometrical shape
for the starburst core.
Thus, these starburst cores
can be parametrised by an aspect ratio ,
whose values are assigned to be 2, 5 and 10
for the simulations
Sim2C2, Sim2C5 and Sim2C10,
respectively.
Figure 6
shows the 2D temperature maps of the outflows
in the simulations,
at 1 Myr, 10 Myr and 20 Myr after their onset.
The asymmetric morphology and development of the flows
can be seen,
as the emerging of outflow echoes
the geometrical shape of the star-forming region.
Though there are similarities among the three simulated outflows,
the connection between core shape and outflow shape
is not particularly strong
(cf. Sim2C5 and Sim2C10,
whose values of differ by a factor of 2).
This indicates that
the shape of the star-forming region
(the geometrical boundary condition)
is not a major factor
to determine the outflow morphology and development.
The path of least resistance
is determined mainly
by the conditions exterior to the star-forming core,
i.e. the physical conditions in the ambient ISM
and the global energy injection into the gas
and redistribution within the outflow.
3.5 Comparison with observations
Simulations in this work have adopted parameters appropriate for M82-like galaxies. We therefore consider M82 as a reference for comparison with observations. M82 was observed in X-rays on many occasions (e.g. Ranalli et al., 2008; Konami et al., 2011; Lopez et al., 2020). Outflows from starburst galaxies, e.g. NGC 253 and M82 generally have several ionised gas components with different thermal temperatures, which is evident in the multi-temperature fits to their X-ray spectra. In M82, the presence of charge exchange lines (Konami et al., 2011; Zhang et al., 2014) in the X-ray spectra implies that the outflow in M82 must be multi-phase, with also substantial amount of neutral material.
The treatment of flows with multiple thermal components and phases involves non-trivial processes, e.g. the interplay between heating and mass exchange, phase mixing, phase transitions, and the relative drag between the components, which are beyond the scope of this study. Nonetheless, some meaningful comparisons can still be drawn between this work and observations, under certain simplifications and appropriate approximations. In a broad perspective, an outflow can be considered to consist of a hot ionised component and a cold component. The former is the highly ionised and generally satisfies a fluid description; the latter is a mix of minimally-ionised and neutral gas and clumps, for which the standard HD description needs to be modified. As such, we restrict the comparison of our results to observations of the hot component.
The temperature of the hot phase may reach , and the observation of Lopez et al. (2020) showed a temperature of near the base of the outflow in M82. Our simulations show that these temperatures can be achieved if the flows are thermally driven, (see simulation Sim1th). They are, however, substantially higher than the temperatures of the outflows driven by CRs (see simulation Sim1CR). The observations of Lopez et al. (2020) also showed outflow temperatures in M82 decrease to and at and respectively. These temperatures are higher than the values obtained at corresponding locations in our simulations, even when radiative cooling is not considered (cf. Figure 3). As has been shown previously in Y20, the temperature of the outflow gas would be altered by the input values for the magnetic field strength or mass loading. It is possible that M82 has a lower mass load and/or a more highly structured and turbulent magnetic field (see Lopez-Rodriguez et al., 2021) than considered in our simulations. The M82 outflow is at least a two-component fluid, as indicated by the observation of Lopez et al. (2020) and also others, and the mass loading into the hot component is expected to be lower than into the wind overall at lower altitudes, before substantial evaporation of a colder, denser gas phase and mixing of the two components could arise444This scenario would be consistent with the findings of Lopez et al. (2020), which also suggest that the hot winds are being mass loaded due to the mixing and heating of cooler entrained gas into the hot phase as it is advected with the flow.. This work has put a focus on the global HD for different driving mechanisms and the consequential X-ray properties. Complexities of multi-component, multi-phase flows have not been fully accounted for. It is therefore not surprising that there are some temperature discrepancies between our work and observations at large distances from the starburst core. With these factors taken into consideration, the results obtained here are not inconsistent with the X-ray observations of M82 and other starburst galaxies, e.g. NGC 253 (e.g. Bauer et al., 2007; Mitsuishi et al., 2013).
4 X-ray emission
4.1 Synthesis of X-ray spectra
Starburst galaxies are known to be X-ray sources, with X-rays being emitted from their hot ISM, stars, accreting compact objects (in particular, X-ray binaries), SNe, and galactic wind outflows (see e.g. Fabbiano, 1988; Soria & Wu, 2002; Mitsuishi et al., 2013; Lopez et al., 2020). For nearby galaxies, e.g. NGC 253 and M82, where outflows can be resolved in X-ray observations, there have been attempts to infer the outflow HD profiles from X-ray imaging data. Lopez et al. (2020) derived the temperature profiles of the outflows in M82 from the variation of their X-ray surface brightness across galacto-centric distances along their minor axis, and the X-ray profiles of galactic outflows, with mass loading, were also computed very recently by Nguyen & Thompson (2021) using numerical HD models.
Outflows in distant starburst galaxies are, however, not always resolvable spatially in X-ray imaging observations. Despite this, spectral information in X-rays from outflows observed in such distant galaxies would still be retained and, hence, the thermal properties of the gas in their outflows could be inferred from this. In particular, the relative fluxes in different, properly selected X-ray bands can provide constraints for the physical conditions within X-ray emitting outflow gas. With this in mind, we compute synthetic X-ray spectra for the simulated galactic outflows considered in the previous sections. Solar metallicity is adopted in the X-ray spectral calculations, unless otherwise stated. The procedures for computing X-ray spectra in outflows from star-forming protogalaxies and young galaxies at high redshifts are the same as those adopted for nearby outflows, with only the metallicity being modified to appropriate levels.
X-ray spectra are computed using APEC (version 3),
with the density and temperature inputs
provided by the HD simulations555The emission volume
of the outflowing gas is
,
where is the solid opening angle of the outflow cone.
In spectral computations,
we set the inner boundary kpc
and the outer boundary kpc
(§ 4.2.1).
For optically thin emission,
the spectral properties are independent of .
Hence, we simply set without losing generality.
The total luminosity of the outflow should therefore
be scaled with a factor equal to the
“real” solid opening angle of the outflow cone divided by radians.,
with energies between 0.1 and 10 keV
and resolution of 0.01 dex
(i.e. a resolution of 0.01).
The chosen spectral energy range is appropriate
for thermal emission
associated with bound-free and free-free
processes from optically thin gas
at temperatures ,
as indicated
by observations of the hot ISM
in nearby starburst galaxies, e.g.
NGC 253 (Mitsuishi et al., 2013)
and M83 (Soria &
Wu, 2002).
It is also the spectral energy range
where the X-ray observatories XMM-Newton
and ATHENA would have large effective photon collecting areas
and good spectral resolving capability
(see Jansen
et al., 2001; Barcons
et al., 2017; Barret
et al., 2020).
For broadband spectral calculations, four energy bands, (0.10.5) keV, (0.51.0) keV, (1.02.0) keV and (2.010.0) keV are selected. These bands correspond respectively to spectral regions associated with Galactic absorption, extra-galactic line-of-sight absorption, thermal bound-bound emission from optically thin hot gas at , and emission from stellar X-ray sources that can contaminate the emission from the outflow. In each energy band, the ”luminosity” is obtained by summing the emission over the energies within the band.
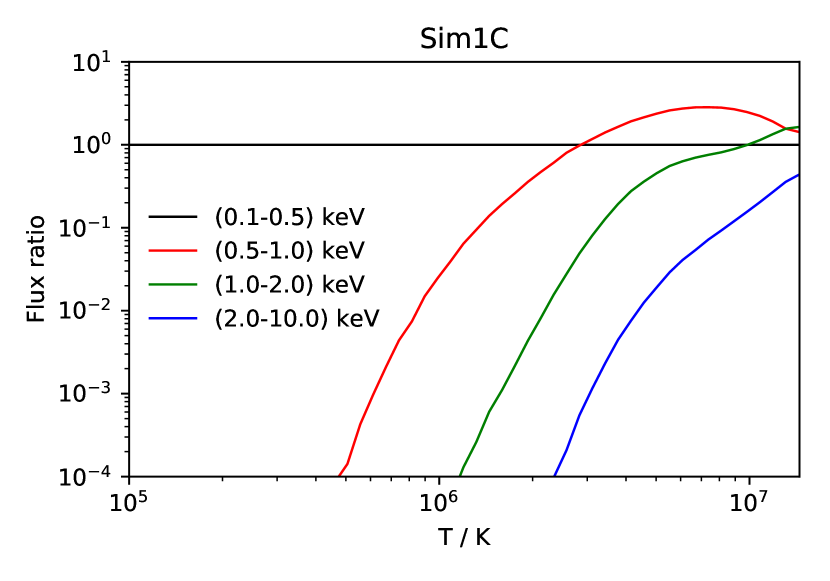
Galactic outflows are composite plasmas with a wide spread of temperatures. The X-ray luminosities of an outflow in the 4 energy bands specified above contain emission from the entire flow, although more contribution comes from regions where the gas temperatures match the thermal temperature for the emission flux to peak within the energy range of the band. Figure 7 illustrates the relative contribution of gas with different temperatures to the energy bands. As expected, cool gas (with ) dominates the emission in the () keV band, while only the hot gas (with and above) would make a significant contribution to the keV band. Overall, most of the X-ray emission originates from gas at temperatures , which is associated with the inner 4 kpc of the outflow (see Figure 3)666We show the outflow in simulation Sim1C in Figure 7 as an illustration. The outflows of the other simulations considered in this work produce qualitatively similar temperature-emission curves. For instance, Sim1th yields slightly lower X-ray emission in the softer energy bands for higher gas temperatures, above , and slightly higher X-ray emission in the higher energy bands than Sim1C..
4.2 X-ray spectroscopy
4.2.1 Cooling and outflow development
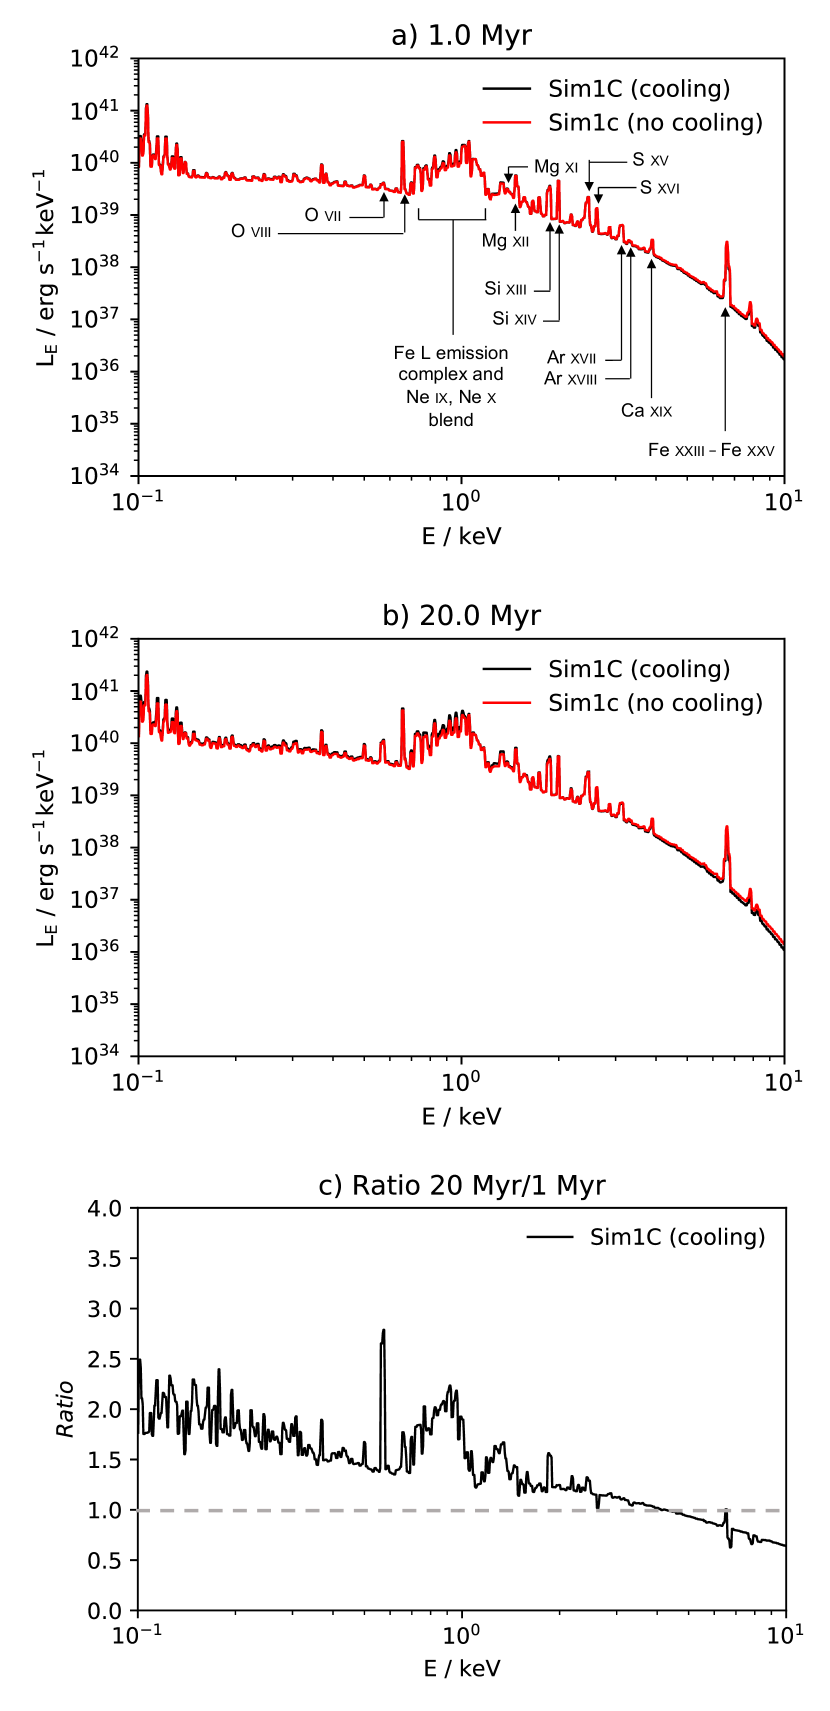
Figure 8,
panels (a) and (b),
shows the computed X-ray spectra
in the energy range,
from the outflows
in simulations Sim1c (which has no cooling)
and Sim1C (with cooling),
at two epochs,
1 Myr and 20 Myr after the launch of the outflow.
In both cases,
the emission region is restricted
to the main body of outflow,
which spans from to ,
measured radially from
the center of the galaxy.
The emitting gas has a solar abundance
(cf. the metallicity in M82, Origlia et al., 2004).
A quotient spectrum of the outflow in simulation Sim1C
is also shown in Figure 8, panel (c),
for comparison of the X-ray emission
at 20 Myr to that at 1 Myr.
The X-ray spectra of the simulated outflows
are typical of
that of
a multiple-temperature coronal plasma
(see e.g. Mewe et al., 1985; Kaastra &
Mewe, 1993; Bryans
et al., 2009; Porquet
et al., 2010, for X-ray emission and the associated electronic transition processes in coronal plasma).
Overall, the spectra of the outflows
in simulations Sim1c and Sim1C
are similar.
The most noticeable spectral feature
is the broad bump at energies slightly below 1 keV.
This is the emission complex
arising from the L-shell transitions of Fe777The
Ne K emission lines are blended with the
Fe L emission complex.(see e.g. Bryans
et al., 2009; Foster et al., 2012).
Another striking feature is a sequence of
H-like and He-like K emission lines
of O, Mg, Si, S, Ar, Ca and Fe ions.
The Fe K emission line
is located at around keV
(Figure 9, top panel).
There is insignificant line emission at 6.4 keV,
which corresponds to emission from neutral Fe
and weakly ionised Fe species.
The 6.95 keV line
corresponding to emission from H-like Fe ions
is absent.
The Fe K emission
is therefore contributed mostly by He-like
(which has a closed-shell configuration in the ground state)
and Li-like Fe ions,
some from Be-like Fe ions
and a small amount from B-like Fe ions.
There is a relative excess
in the Fe L emission complex,
and a slightly weaker continuum
at higher energies (above 4 keV)
in the outflow in simulation Sim1C
when compared to that in simulation Sim1c.
This result is not too surprising,
as lowering the temperature of the gas
by radiative cooling
reduces free-free emission
but enhances L-shell transitions.
The evolution of the X-ray spectrum as an outflow progresses is not obvious through visual comparison. The differences between the spectra are better distinguished using quotient spectra, which are the ratios between a spectra at a specifically chosen evolution stage, and a reference spectrum. At 1 Myr there is a shock in the outflow, located about 2 kpc from the starburst core. By 20 Myr, the shock has already propagated beyond 10 kpc.
The shock is the outer boundary of the body of X-ray emission gas in the outflow, and the total power in the X-rays is determined by the emission volume888For bound-bound and free-free processes in a collisional ionised plasma, the power is determined by the emission measure, which is proportional to , where the volume of the emission region would have a proportionality. Mass continuity requires that . Thus, and the emission is dominated by the high density gas at the base of the outflow, if the emission from the high-temperature compressed shock-heated gas is not present., which depends on the shock location in the transient stage. The difference in the emission volumes at 1 Myr and 20 Myr is reflected in the “specific intensity” in the quotient spectrum, in Figure 8. This shows values exceeding unity in most part of the quotient spectrum, except beyond about 4 keV. The value of the “specific intensity” falls below unity at these higher energies because of the absence of the hot gas associated with the shock transition layer in the outflow at 20 Myr, despite some compensation by the increase in the total emission volume.
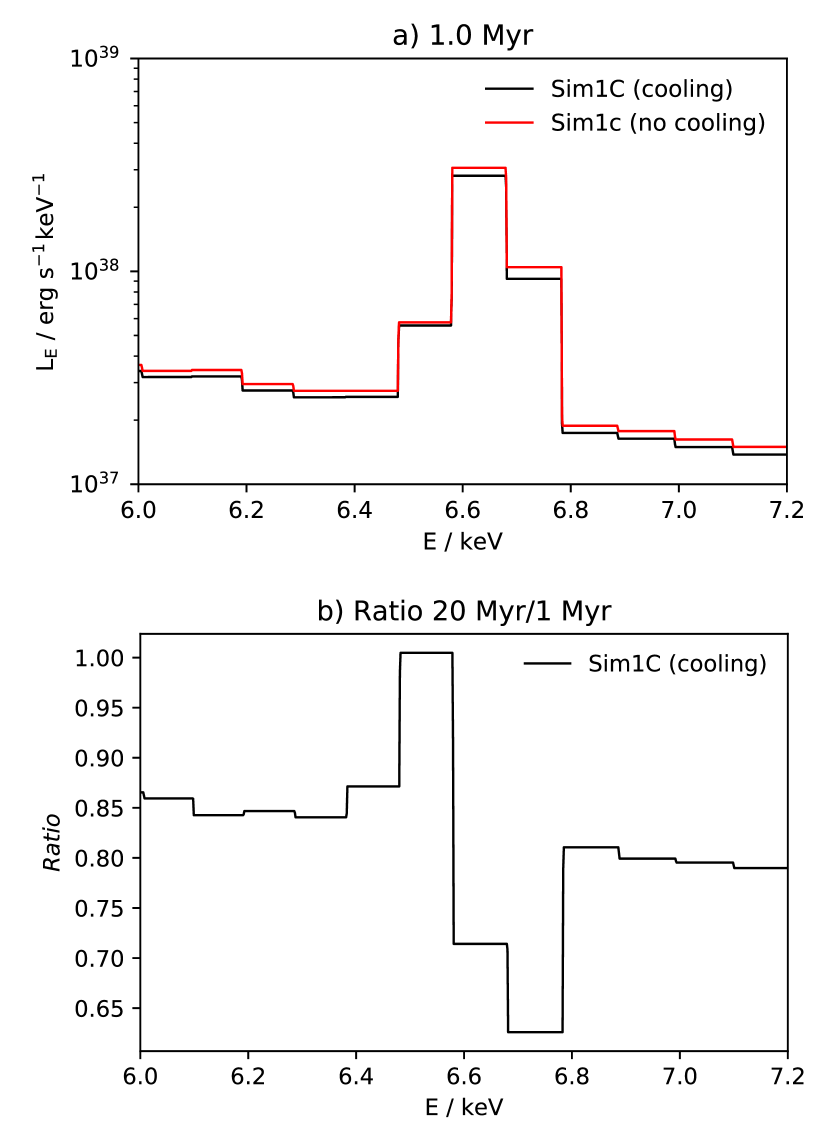
The most obvious feature in the quotient spectrum is the Fe L emission bump at around 1 keV. This indicates that the Fe L-shell transitions become more prominent when the outflow approaches its stationary state. Except for the He-like Si line, almost the entire sequence of K emission of Mg, Si, S, Ar and Ca (all of which are clearly present in the spectra at all evolutionary stages) has become almost unnoticeable in the quotient spectrum, indicating that the strength of the K emission from these species is essentially unchanged. There is, however, a stronger presence of the emission from He-like O vii and He-like Si xiii ions, and their asymmetric line profiles suggests that these lines are complex, consisting of z forbidden, (x,y) inter-combination and w resonance components (see e.g. Silver et al., 2000). Interestingly, the Fe K emission in the quotient spectrum has a P Cyg profile. However, the depression in higher energy wing of the F emission is not caused by line-of-sight absorption. Instead, this is a decrease in the strength of He-like, Li-like and Be-like Fe emission accompanied by an increase in the strength of B-like Fe emission (see Figure 9, bottom panel).
4.2.2 Driving mechanisms
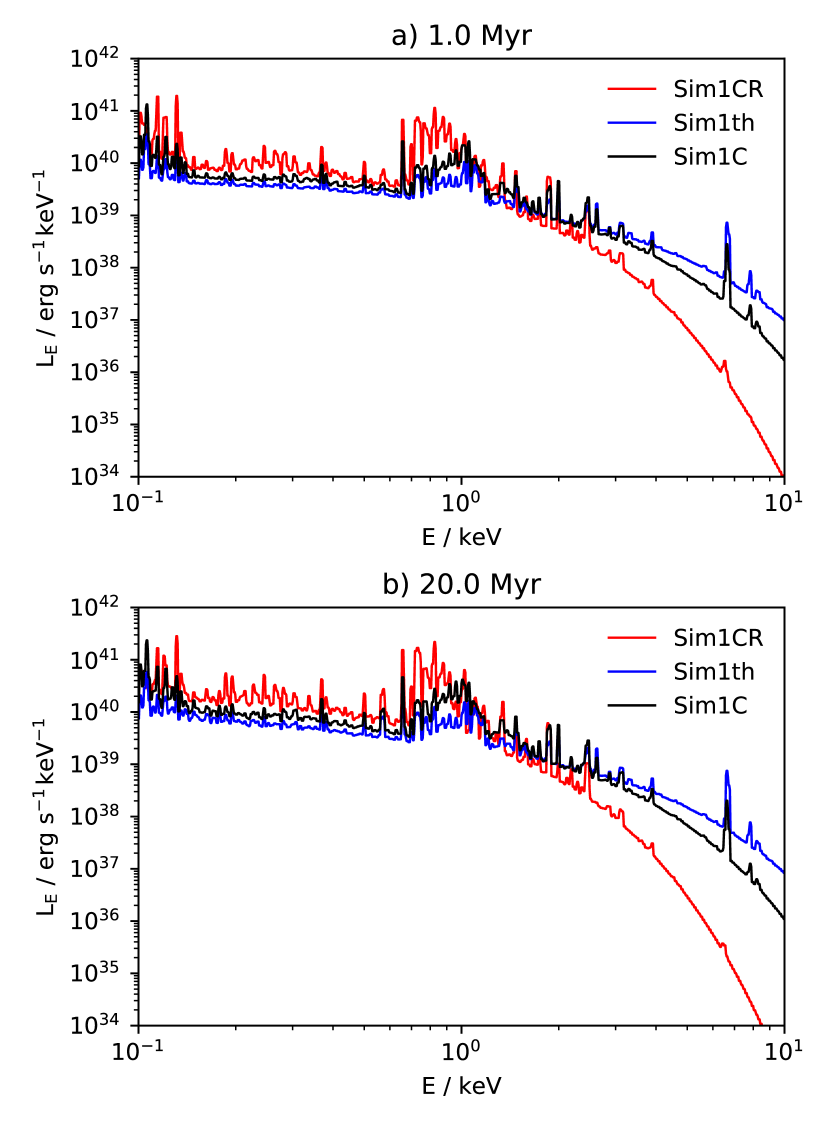
Figure 10 shows the X-ray spectra of outflows
driven thermal-mechanically (Sim1th), by CRs (Sim1CR)
and with a 50-50 split between thermal-mechanical and CR driving (Sim1C),
at
1 Myr and 20 Myr
after the launch of the outflow (in panels a and b respectively).
The Fe L emission complex
and the sequence of H-like and He-like
K emission lines of
O, Mg, Si, S, Ar, Ca and Fe ions
are present in all the spectra.
The spectra of the CR driven outflow
has the weakest keV emission and steepest continuum (Sim1CR)
at both 1 Myr and 20 Myr,
while the corresponding spectrum
of the thermal-mechanically driven outflow (Sim1th)
has the strongest keV emission and flattest continuum.
The keV continuum weakening and steepening
among the outflows
is accompanied by a reduction in the strength of the Fe K line,
and an enhancement of the Fe L emission complex.
In addition, this is also accompanied by a skew of the Fe L complex towards lower energies.
A careful inspection reveals
that the He-like K emission,
in particular that of the O ions,
is stronger for the CR driven outflow
than for the thermal-mechanically driven outflow.
Moreover, the N K emission lines become more visible in the CR driven case,
while they are much weaker
in the thermal-mechanical driven outflow.
Comparing the outflows at 20 Myr and 1 Myr
shows the weakening and steepening of the keV continuum emission,
and the accompanying change in the emission line morphology.
This is more noticeable in the CR driven outflow
than the thermal-mechanically driven case.
The overall spectral properties
of the X-ray emission from the the hybrid outflow (Sim1C)
are between those of the CR driven and the thermal-mechanically driven cases.
These outflow spectral variations are mostly
caused by the differences in the relative outflow temperatures
(the densities of the outflows are almost identical
when reaching their stationary state, see Figure 4),
as the drop in gas temperature
reduces the efficiency of the free-free process,
but increases stronger bound-bound processes.
Similar to the time development of the spectra of the outflows
in simulations Sim1c and Sim1C
(see § 4.2.1),
the factor determining the spectral evolution of each individual outflow
in simulation SimCR and Sim1th
is the change in the temperature of the emission region,
which contributes the most to the total emission measure999The emission measure is the product of the square of the density
and the effective emitting volume. of the outflow.
4.2.3 Metallicity and redshift evolution
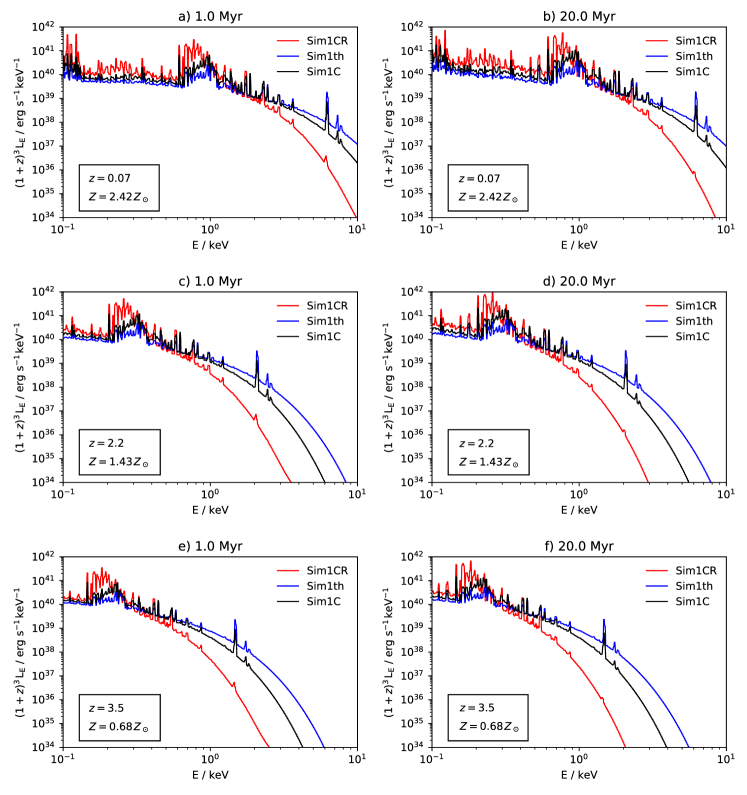
Features in the X-ray spectra of outflows are markers of the abundances of elements, although the strengths of such features are also determined by the HD and thermal properties of the emitting gas. Abundances of elements change with the evolutionary history of the galaxies and, hence, the spectra of outflows from galaxies would reflect this: both the emission and radiative cooling are dependent on metallicity, and thus the X-ray spectra of outflows would show variations over redshift regardless of the underlying outflow driving mechanisms. This is indeed seen in the redshift-corrected spectra in Figure 11, where cases are shown with metallicities of 2.42, 1.43 and 0.68 times solar abundance, appropriate for their respective selected redshifts of , 2.2 and 3.5 (see Sommariva et al., 2012)101010These values are derived from scaling of the solar abundances. In reality, the chemical abundances in galactic outflows are determined by evolution and stellar populations in the galaxy. Core collapse SN, which track star formation, preferentially inject light elements (e.g. O and Ne) and elements heavier than Zn (e.g. Nakamura et al., 1999) into the ISM and hence the outflowing gas. Type 1a SNe, which emerge much later, inject Fe and heavy elements (e.g. Nomoto et al., 1984). Young galaxies at high redshifts are expected to have weaker Fe L emission, but less significant reduction in strengths of O K lines than as in the spectra present in this work.. At higher redshifts, metal abundances may be lower, leading to a decrease in the overall strengths of the sequence of the O, Mg, Si, S, Ar and Ca K lines. This strength reduction is particularly obvious for the two O H-like and He-like K lines. The strength of the Fe L emission complex is also reduced, but this reduction is less evident from visual inspection.
The keV continuum, which is mainly due to free-free processes,
is determined predominantly by the density
(and, to a lesser extent, by the temperature) of an outflow.
Sim1c and Sim1C
show that the HD properties of outflows
are not particularly sensitive to variations in radiative cooling
(Figure 8;
see also Figure 3).
The amount of variation in the metallicity considered here
would not substantially alter free-free processes,
and hence the continuum does not show strong variation
between the outflows at these three redshifts.
Despite changes in metallicity,
the overall trend of spectral variations among the driving mechanisms
is similar to that seen when assuming a solar metallicity,
cf. Figure 11
and Figure 10.
4.3 Broadband X-ray emission
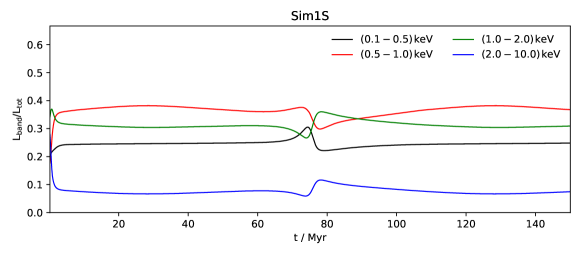
The large number of photons needed
for the construction of a high-resolution X-ray spectrum
requires a long observation time
on an X-ray telescope
with a large effective collecting area.
Thus, the diagnoses using spectroscopic analyses
described in the above subsections,
though applicable to nearby galaxies,
are not practical in the investigation of outflows
from distant galaxies.
Colour-colour analysis
is a more economical alternative,
as it requires only broadband information,
which is less demanding in terms of the net photon flux.
We therefore compute the broadband X-ray emission
from the simulated galactic outflows,
and construct corresponding X-ray light curves.
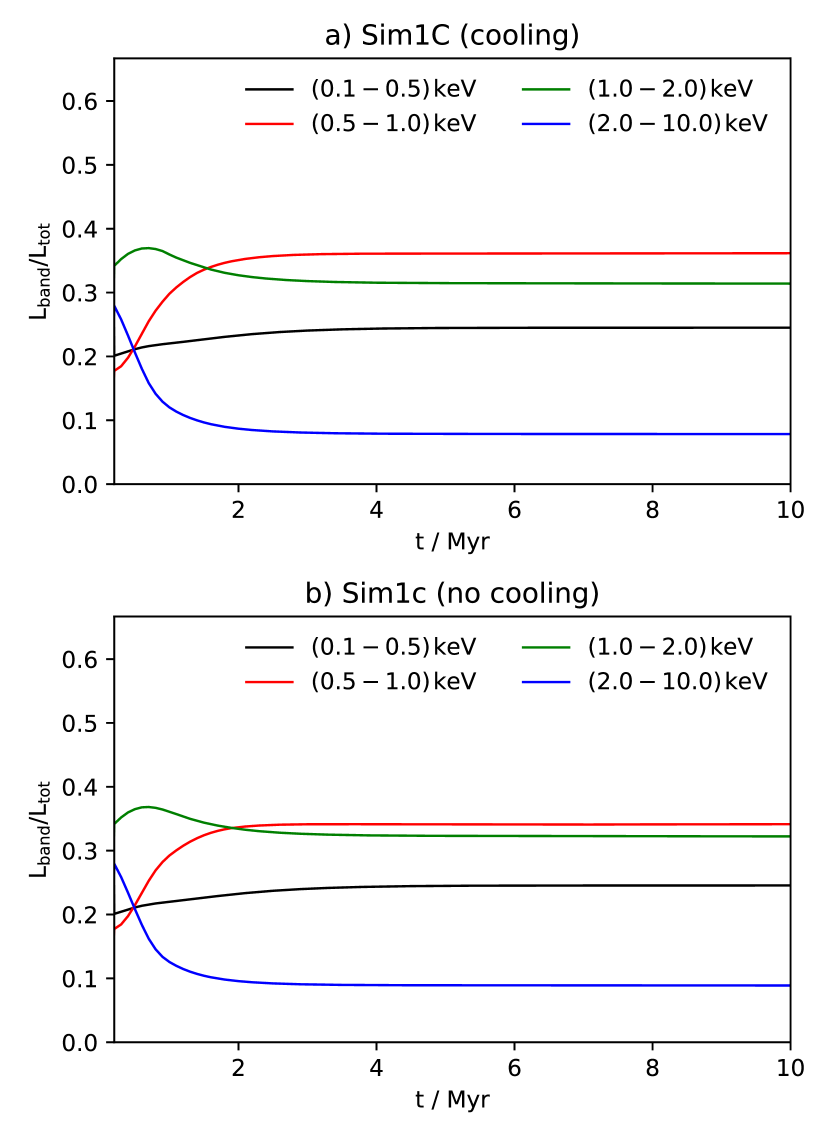
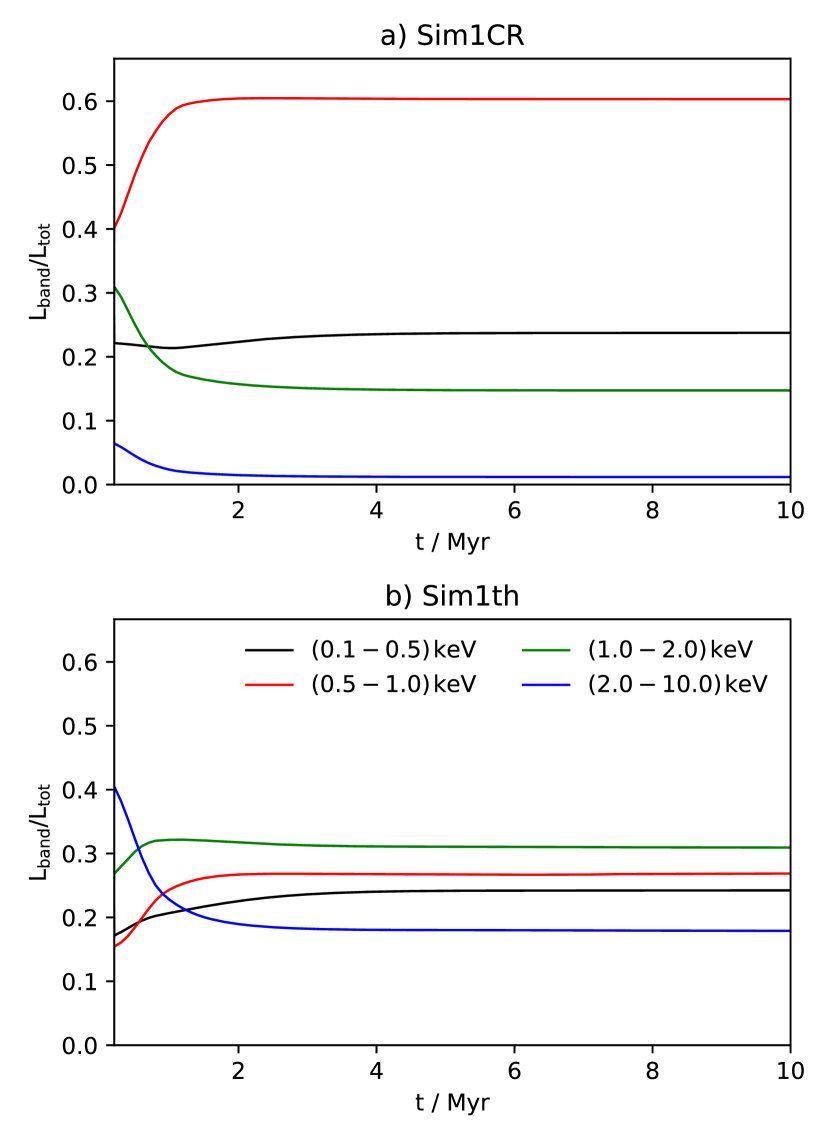
Figure 12
shows the normalised broadband light curves
of the outflows
in simulations Sim1c (cooling ignored)
and Sim1C (radiatively cooling included),
while Figure 13
shows the normalised broadband light curves
of the outflows in simulations Sim1CR (CR driven)
and Sim1th (thermal-mechanically driven).
As shown,
the X-ray emission becomes stationary
after the outflows reach their stationary state, after about 2 Myr.
Comparing the stationary state broadband X-ray emission
shows obvious contrasts between the outflows in Sim1CR (CR driven)
and sim1th (thermal-mechanically driven).
The differences between the broadband X-rays
for outflows in sim1c (cooling ignored)
and sim1C (cooling included)
are not as prominent, but still distinguishable.
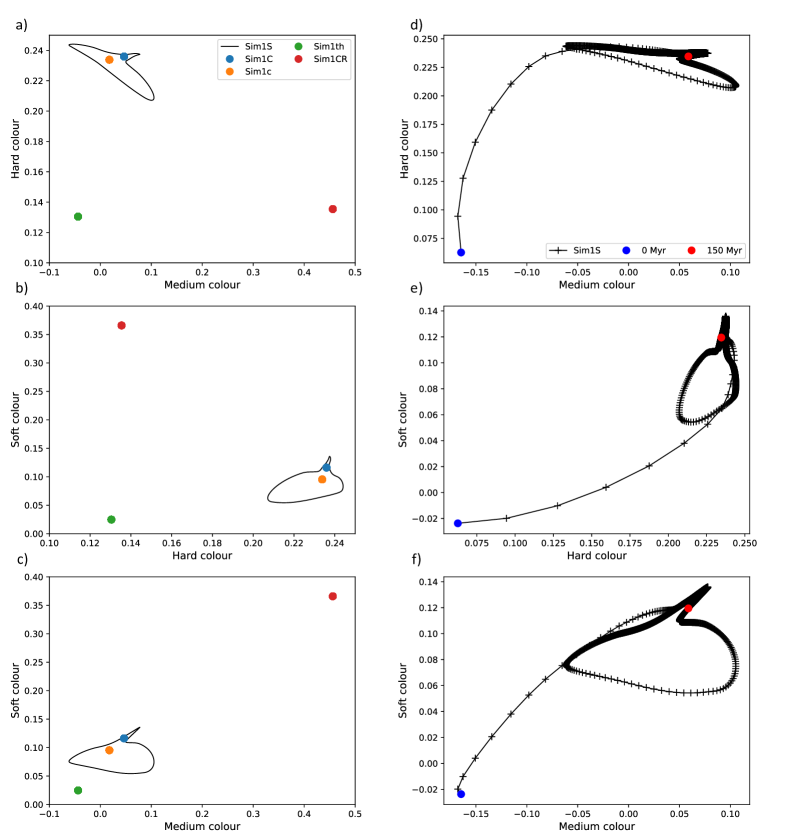
The differences of the broadband X-rays
among the simulated outflows
are better revealed with a three-colour representation, using:
(i) soft colour =
band ( keV) band ( keV),
(ii) medium colour =
band ( keV) band ( keV),
and
(iii) hard colour =
band ( keV) band ( keV).
The fluxes in the bands above
are normalised to the fluxes
in the sum of all bands.
In this representation,
an outflow from a galaxy at any instant
is a phase point in the 3D colour space.
Figure 14, left panel,
shows the 3D colour-colour-colour plot projected onto 3 2D axes
for simulated galactic outflows in their stationary states.
The four outflows are distinguishable by their locations.
Alternating episodes of star-formation and quenching
would introduce cumulative effects
on a galactic outflow,
and this issue is addressed here
using the broadband X-ray emission
of the outflow in simulation Sim1S
(Figure 15)
as an illustration.
Noticeably,
the outflow in the second episode of star-formation
does not produce the same broadband X-ray light curves seen in the first episode.
More specifically,
the X-ray emission
seems not to settle into a stationary state over a timescale of 2 Myr
(cf. the light curves
in Figures 12 and 13).
This can be explained as follows:
In the first episode of star-formation,
the outflow propagates in a pristine ISM,
which is uniform and is practically cold
while, in the following episode of star-formation,
the outflow propagates into the material left-over by the previous outflow activity.
This left-over material is warm
and has non-negligible density and flow velocities.
Moreover, the material is not uniform
and has spatial gradients in its density and pressure.
As the outflow during the two star-forming episodes
does not have identical physical conditions,
its X-ray emission, in both time domain and spectral domain,
is different.
This is illustrated in Figure 14:
the track of the outflow in the 3 colour-colour plot projections
does not trace a closed orbit.
The failure of the outflow to reach
a stationary state in 2 Myr during the second star-forming episode
is caused by the introduction of additional time scales and length scales
associated with the spatial variations
in the warmer, denser material
that the outflow is ploughing through in its propagation
from the starburst core.
5 Discussion
5.1 Outflow simulation configuration and hydrodynamics
Several recent works have developed sophisticated HD simulations to investigate outflow properties and/or medium substructure in detail, with some invoking 3D realisations, multi-phase media configurations and various treatments of CR physics (e.g. Tanner et al., 2016; Schneider & Robertson, 2018; Schneider et al., 2020; Hopkins et al., 2021a; Bustard & Zweibel, 2021). While detailed modelling of the internal flow structure and micro-physics fall beyond the scope of this paper, relevant comparisons can still be drawn between the hot wind component considered in those works and the HD properties of the simulations presented in section 3.1.
Our outflow simulations show the initial development of a super-bubble, forward shock and contact discontinuity. These propagate outwards, and the flow settles into a stationary state relatively quickly after the forward shock has passed. The leading edge of the flow traverses the full simulation domain within 15 Myr, after which the stationary-state configuration is maintained. We typically find outflow terminal velocities of 800-900 km s-1 across all our simulations and, when the stationary state has been attained, density and temperature profiles fall away radially from the starburst core, with central values of around and , respectively. While the exact set-up of their simulations is different, this early evolutionary behaviour and the stationary-state HD characteristics are broadly similar to the results shown in Schneider & Robertson (2018), although their adoption of higher mass loading and thermalisation efficiencies yield denser flows with faster terminal velocities, and a slower development. Simulations by Tanner et al. (2016) and Cooper et al. (2008) further showed that the rate at which an outflow develops is slowed by mass-loading, or boosted by energy injection rates via the star-formation rate and/or thermalisation efficiency of energy into the hot wind component.
In their initial models, Schneider & Robertson (2018) do not include radiative cooling. This matter is considered further in Schneider et al. (2020) where it was shown that, for mass loading rates similar to those adopted in this work, radiative cooling would not greatly impact the structure of the hot phase of a galactic wind (this is also evident in our results – see Figure 3, where only moderate differences appear above 4 kpc when radiative cooling is included). Instead, Melioli et al. (2013) demonstrated that this depends strongly on the fraction of mass in a high density wind component compared to the total mass of the galactic wind, and becomes more important in winds where the mass fraction in a cool, dense phase is higher.
The results shown in Hopkins et al. 2021a (for simulated galaxy parameters, see Hopkins et al. 2021b) target lower resolution scales than this work, however the general features seen in their simulations also reflect the trends seen here, with similar flow temperatures and densities at 10 kpc for models where the halo mass is comparable. Hopkins et al. 2021a also showed that, regardless of the exact propagation physics adopted, the presence of CRs in an outflow leads to a cooler and more extended flow. Although this is also consistent with our findings (see Figure 4) and previous work (e.g. Girichidis et al., 2018), it has been demonstrated that the exact flow structure and extent is quite sensitive to the detailed CR propagation physics adopted in a simulation (Wiener et al., 2017; Jacob et al., 2018; Farber et al., 2018; Hopkins et al., 2021a).
5.2 Collisional equilibrium and X-ray spectroscopy
Several implicit assumptions have been made in the spectral calculations (§ 4). Among these are that the X-ray emitting gas is in collisional equilibrium, and that the X-ray emission is optically thin from a collisionally-ionised gas. The 1D simulated outflows in this study are stratified structures, showing a decrease in their gas density and temperature as the outflows proceed. When the variation in the gas density and temperature is substantial, local collisional equilibrium may not be guaranteed, and this occurs in stratified flows in solar corona, supernova shocks and accretion shocks (see e.g. Shapiro & Moore, 1977; Gorenstein et al., 1974; Wu et al., 2001), where thermal equilibrium between ions and electrons and Maxwellian distributions for the energies of the particles may not be maintained. The deviation from thermal distribution of the electrons and the deviation from electron-ion collisional equilibrium would affect the bound-bound transitions in the ions and hence their corresponding radiative processes (Masai, 1984; Tatischeff, 2003; Decaux et al., 2003; Gu et al., 2005; Cui et al., 2019). The alternation of the spectral line features caused by such deviations would, in turn, affect the reliability of using X-ray spectroscopy to diagnose galactic outflows and their driving mechanisms.
The collisional time of an ionised gas is
| (21) |
(Spitzer, 1956), where is the electron number density (in ), is the electron temperature (in ), is the mean molecular weight (normalised to hydrogen mass), is the ionic charge, and is the Coulomb logarithm. The outflow at a radial distance , from the starburst core , would be able to reach a local collisional equilibrium if
| (22) |
where is the dynamical time of the flow, and is the outflow velocity. Specific emissivity of X-ray lines and continuum arising from bound-bound, bound-free and free-free processes generally depend on (see e.g. Rybicki & Lightman, 2004), and hence the inner 4 kpc of the outflow would dominate the emission. The dynamical time scale of an outflow is . With the densities and temperatures of the simulated outflows (see Figures‘2, 3 and 4), the collisional equilibrium condition is satisfied in most of the outflow, except in outermost region where the density drops below , corresponding to particle number density of . The gas density in the outflow could be higher in reality, as molecular clumps could fall into the outflows, from which material would be stripped and dissolved into the hot outflow gas, while external gas can also swept into the hot wind fluid. While these complications will not substantially distort the emission spectra from the dense, hot inner outflow region, they would add some complexity to the X-ray spectral analysis. Molecular clumps and entrained gas are distinguishable by their multi-wavelength spectral signatures and, hence, they also provide additional dimensions in outflow diagnostics.
5.3 Observational implications
X-rays are a useful means of probing the thermal properties of hot gases and, hence, the HD of galactic outflows (see e.g. Strickland & Stevens, 2000). Galactic outflows have been imaged in X-rays by Chandra and XMM-Newton observations, and spatially resolved high-resolution X-ray spectra have been obtained for outflows in several nearby starburst galaxies, e.g. NGC 253 (Mitsuishi et al., 2013) and M82 (Lopez et al., 2020). As was shown in Lopez et al. (2020) (see also Strickland & Heckman, 2007), X-ray brightness is not uniform across the M82 outflows. Instead, it can be seen to decrease over distance from the galactic centre, with spectral variations also being observed.
Although the synthetic X-ray spectra of the simulated galactic outflows in this work show the same trend as the observations of M82 and other nearby starburst galaxies (regardless of their driving mechanism), there are subtle differences between thermal-mechanically driven and CR driven systems. Unambiguously distinguishing these differences will require high quality spectroscopic data and, for galaxies at distances substantially beyond M82 or NGC 253 (beyond 5 Mpc), next generation facilities, such as ATHENA, will be needed. Nonetheless, this work has demonstrated that 1D HD simulations and analytic calculations are sufficient to provide acceptable model structures, and that post-processed X-ray spectral templates and colour templates can be computed for different outflow models with modest computational effort. With the upcoming ATHENA and other next generation X-ray observatories, we will be able to probe galactic outflows beyond the local Universe with observations, theoretical modelling and even population analyses and stacking analyses (for the investigation of metallicity evolution in the diffuse gas of galactic outflows over redshift).
Outflows from distant galaxies are not always spatially resolved. Thus, their X-ray emission is contaminated by stellar sources such as X-ray binaries, and the brightest among these, ULXs (ultra-luminous X-ray sources), could have X-ray luminosities reaching (see e.g. Swartz et al., 2004), i.e. a substantial fraction of the X-ray power of an entire outflow. However, X-ray binaries and ULXs tend to contaminate spectra in energies above 2 keV (see e.g. Strickland & Heckman, 2007). Their keV X-ray emission also has noticeable Fe K lines, with a 6.4 keV neutral component arising from the accretion disk and a 6.97 keV H-like component from the photo-ionised gas in or around the binary. The 6.4 keV neutral component and the 6.97 keV H-like component of Fe K are, however, not present (or extremely weak) in galactic outflow X-ray emission, where the Fe emission is instead dominated by L-shell transitions (see § 4.2). Note that X-ray binaries and ULXs generally have thermal black-body like emission at around 1 keV, which originates from their accretion disk. This thermal black-body like emission at around 1 keV and the properties of Fe K lines together with survey studies (e.g. Swartz et al., 2004), will provide a means to estimate the X-ray binary and ULX populations (see e.g. Fabbiano, 2006; Feng & Soria, 2011). With the X-ray binary and ULX populations modelled (see Wu, 2001; Mineo et al., 2012), their contribution to the X-rays, including the spectral region of energies below 1 keV, can be estimated, thus allowing the extraction of information about spatially unresolved outflows in distant galaxies using the stacking method, as is also employed in studies of galaxies and AGN in X-rays and other wavebands (e.g. Vito et al., 2016; Fornasini et al., 2018).
The complex phase structure of outflows, particularly near the starburst region, implies that charge exchange processes would contribute to the X-ray emission lines, together with radiative processes in a collisional ionised plasma. Observations (e.g. of the outflows in M82 Konami et al., 2011; Zhang et al., 2014) have shown a substantial contribution of charge exchange in sub-keV emission lines. The contamination of emission lines by charge exchange processes appear to be less significant for X-ray lines at higher energies, say above (see Zhang et al., 2014). It is unlikely that the Fe L-emission bump, which contributes to most of the X-ray flux at energies around , would be severely contaminated by the charge exchange emission. Moreover, the thermal continuum would dominate the total X-ray flux at energies higher than . Although charge exchange processes would need to be properly accounted for when line spectroscopy is used for flow diagnosis, analysis using broad-band X-ray colour photometry would be much less affected.
For spatially resolved outflows, the Fe K line in observed spectra could provide a measure of their non-HD aspects. For instance, the detection of a neutral 6.4 keV Fe K line in a spectrum, which requires a substantial amount dense cold material, implies the presence of cold clumps which may indicate condensation due to thermal instabilities and/or strong infall of cold clouds from circum-galactic environments. A further confirmation of the cold clumps could be derived from the strengths of charge-exchange lines (see e.g. Zhang et al., 2014; Wu et al., 2020). The detection of a H-like 6.97 keV Fe K line, due to photo-ionisation, implies the presence of a strong hard X-ray radiation field, which might be provided by a weak AGN, or by populations of ULXs in the host galaxy of an outflow.
5.4 Further remarks
There are particular uncertainties involved in modelling the HD of outflows, and therefore caution may be needed when applying X-ray spectral results in practical analyses of outflows from starburst galaxies. In particular, three issues – the treatment of CRs, the amount of mass loading, and the presence of multiple phases in the outflow – are worthy of attention and further discussion. Here we briefly comment on the effect of each of these.
How CRs propagate within galaxies remains unsettled. Our limitation in the understanding of the transport of energetic particles in magnetised interstellar and intergalactic media will inevitably introduce uncertainties when we implement CRs as energy-momentum sources contributing to the power of a galactic outflow in a HD formulation. This in turn will affect the density and temperature profile of the outflow obtained from HD calculations and simulations (see e.g. Ramzan et al., 2020; Hopkins et al., 2021a, b). Different CR propagation models can lead to substantial differences in the gas temperatures by as much as an order of magnitude, and the high-density region, where most of the X-ray flux is produced, is often the most affected by uncertainties in CR propagation modelling (see Peters et al., 2015; Hopkins et al., 2021a). However, the role of CRs in a HD formulation is to act as agents of energy injection. If we can establish the CR calorimetry in the context of energy deposition through an alternative method, it is possible to by-pass theoretical calculations of CR transport, together with their complexities and various uncertainties. Baryonic CRs deposit energies into an astrophysical medium via hadronic processes. In galactic environments, a major channel is the production of charged and neutral pions (see Owen et al., 2018), and the branching ratio is roughly the same for the formation of three pion species (Dermer & Menon, 2009). The charged pions decay via a weak interaction, generating cascades of less energetic and lighter particles, such as electrons, which are efficient in passing the energy and momentum to the galactic outflow gas. Neutral pions decay via an electromagnetic interaction, with a pair of gamma-ray photons being produced (Dermer & Menon, 2009; Owen et al., 2021). A galactic outflow will therefore emit gamma-rays if CRs are depositing energy into the outflowing gas (Chan et al., 2019; Bustard et al., 2020). From the measurement of the luminosities of the gamma-ray glow from the outflows of starburst galaxies, we could empirically derive the source terms associated with CRs in the HD equations, without being hampered by a limited ability to theoretically resolve CR transportation complexities. Measuring the gamma-ray glow in external galaxies is one of the science themes of the Cherenkov Telescope Array (CTA) (Cherenkov Telescope Array Consortium et al., 2019), and future observations of nearby starburst galaxies, such as the identified CTA targets, NGC 253 and M82, will provide us with an empirical means to model the efficiency of energy and momentum deposition of CRs into galactic outflows. Nevertheless, in this study we have shown that for the same energy injection rate, CR-driven outflows are colder than thermally-driven outflows, and this trend is generally insensitive to the CR physics model adopted in the HD formulation (see also Hopkins et al., 2021a).
While CRs affect the energy and momentum input in an outflow, mass loading affects the relative amount of injected energy and momentum shared between the hot ionised gas and the other flow components. Although both would alter the density and temperature profiles of outflows (Chevalier & Clegg, 1985; Veilleux et al., 2005; Martizzi et al., 2016), and hence the spectral properties of their emitted X-rays, the amount of mass loading can be estimated using some X-ray lines, while additional gamma-ray observations would be needed to disentangle the CR involvement in energy deposition. More specifically, the variation of mass-loading and thermalisation efficiency would leave observational signatures in X-ray emission line spectra. For example, Oxygen can be used as a tracer of mass-loading. As shown in the study of Martin et al. (2002) a galactic wind carries almost all the metals ejected in a starburst driven outflow. The Oxygen in the wind is from the stellar ejecta rather than from entrained interstellar gas. Oxygen emission lines in X-rays and the derived abundances would therefore offer relatively strong constraints on the mass loading of the hot outflowing component of a wind. Mass loading together with thermalization efficiency were determined in previous studies (e,g, Strickland & Heckman, 2009) using the S, Ar and Ca emission lines and the total X-ray flux in the energy band.
Galactic outflows are multi-phase in nature (see Aguirre et al., 2005; Konami et al., 2011; Zhang et al., 2014; Martizzi et al., 2016; Li et al., 2017; Kim & Ostriker, 2018; Lopez et al., 2020; Schneider et al., 2020; Wu et al., 2020). The charge-exchange lines observed in the X-ray spectra of outflows from starburst galaxies indicate the presence of neutral clumps (Konami et al., 2011; Zhang et al., 2014). Entrainment of these cold clumps would alter the thermal and HD properties of the hot flow component, from where keV X-rays originate. A cold neutral clump can take away thermal energy from the hot component of a flow when it evaporates. At the same time, the hot component would gain mass if the vaporised material from the clumps becomes thermalised and ionised. For a clump with a density cm-3 (Melioli et al., 2013), a minor-axis size of 10 pc and a velocity of (e.g. Strickland & Heckman, 2009) (comparable to the galactic outflow velocities obtained the HD simulations shown in this work) embedded within the hot component of a flow of temperature , the evaporation length-scale (and, presumably, the length-scale over which such entrainment would persist) is of order 10s of kpc (see Wu et al., 2020). This evaporation length would be longer if the temperature of the outflow gas is cooler. The thermalisation of an outflow would therefore not be modified significantly by entrained clumps, even if the velocity of the clumps were lower than assumed here, as the clumps would be advected out to the intergalactic/circumgalactic environment by the outflow before the completion of the thermalisation process.
Although charge-exchange lines are produced at interfaces between cold neutral clumps and the hot flow component, emission lines with energies of 1 keV or higher are not strongly affected, and the keV continuum is practically unaffected. The contamination caused by charge-exchange lines from the surfaces of of the cold clumps would not selectively affect the outflows of any particular driving mechanism. Thus, the overall trend for X-ray emission across the different driving mechanisms that we have considered is still relatively robust, despite the presence of cold clumps and their associated charge-exchange emission lines in the sub-keV part of the X-ray spectrum.
The most noticeable effect of the presence of the low-temperature gas component is the absorption that it causes at X-ray energies of just below 2 keV. Observations can, however, determine the amount of this low-temperature gas by fitting appropriate absorber models, a standard practice in the analysis of X-ray spectral observations. The remaining question is now whether or not the X-rays would be severely contaminated by emission from the mass-loading cooler gas with temperatures below . The keV X-ray emission from optically thin collisionally-dominated plasmas satisfying the coronal condition (see e.g. Mewe & Gronenschild, 1981; Mewe et al., 1985), as would be applicable to the hot gas in galactic outflows, is determined by the density and temperature of the emitting gas. The specific flux of the emission from a plasma in a coronal condition is given by
| (23) |
where is the mass density, is the volume of the emission region, and is a function of thermal temperature (), the charges of the ion species (), and the populations of electrons in the upper level and lower level of the transition ( and respectively). Generally, , where is the Planck constant, is the Boltzmann constant, and , and for bound-bound, bound-free and free-free processes respectively (Jefferies, 1968; Rybicki & Lightman, 2004). Because of the drop-off, only gas with temperatures of or above will make a substantial contribution to the keV part of the X-ray spectrum, while gas with lower temperatures will not make a significant contribution in collision-induced radiative processes. Similarly, gas with temperatures lower than will not make a significant contribution to the keV part of the spectrum. This result is also reflected in the flux ratio plot in Figure 7, which shows that the contribution of gas with a temperature below to the keV X-ray is practically zero.
6 Conclusions
In this work, we investigate the HD and X-ray emission properties of galactic outflows, driven by thermal-mechanical energy, CRs and their mix. We use simulations to investigate their HD profiles and properties as they evolve from their initial condition to a stationary state, and find their stationary-state configurations to be consistent with those previously determined analytically, in Y20. We compute synthetic X-ray spectra from the HD properties of the flows to assess their observable properties, and demonstrate how broadband X-ray analyses can be used to discriminate between outflows according to their principal driving mechanism at different stages of their evolution. We find that the keV X-ray emission of the simulated outflows are dominated by the inner 4 kpc of the flow, where the collisional equilibrium timescale would be substantially shorter than the dynamical time of the outflow. The continuum emission is mainly determined by the density and temperature, with minimal dependence on other factors, while spectral features (in particular the Fe K line and L emission complex, the He-like K emission from O, and the N K emission) are more strongly impacted by the flow metallicity, as well as being sensitive to temperature.
Outflows from starburst galaxies in the nearby Universe (such at M82) have been studied extensively, and their emission properties can easily be resolved in observations over a short integration time. However, outflows in more distant galaxies are not as easy to access. Galactic outflows are a consequence of star-forming activity, and their properties and characteristics are inextricably linked to the evolution of their host galaxy (Mannucci et al., 2010). As such, the properties of outflows would show evolutionary trends over redshift (Sugahara et al., 2019), reflecting those seen in their parent galaxy populations (Madau et al., 1996; Dickinson et al., 2003). We have demonstrated that this variation between flows and their evolution can be captured observationally by carefully selected broad X-ray bands, which would retain the crucial information necessary to probe their internal HD and composition (including metallicity), while avoiding the need for the construction of a high-resolution spectrum with long observational integration times and large effective collecting areas. Such an approach therefore opens up the possibility of studying the internal physical properties of outflows into the distant Universe, allowing the importance of different galactic outflow driving mechanisms and internal properties to be studied over cosmic time, reaching systems in the earlier Universe, e.g. during the cosmic noon, when conditions and physical processes in and around galaxies would be very different to those seen today.
Acknowledgements
BPBY’s visit to National Tsing Hua University (NTHU)
was supported by an NTHU international exchange scholarship,
and by the Ministry of Science and Technology of Taiwan (ROC)
through grant 107-2112-M-007-032-MY3.
ERO is supported by the Ministry of Education of
ROC (Taiwan) at the NTHU Center for Informatics and Computation in Astronomy (CICA).
This research made use of the high-performance computing facilities at CICA,
operated by the NTHU Institute of Astronomy
and funded by the Ministry of Education and
the Ministry of Science and Technology
of Taiwan (ROC).
This research has also made use of NASA’s Astrophysics Data Systems.
The software FLASH used in this work was in part
developed by the DOE NNSA-ASC OASCR Flash Center at the University of Chicago. We thank the anonymous referee for their comments, which helped to improve the manuscript.
Data Availability
The data underlying this article will be shared on reasonable request to the corresponding author.
References
- Aguirre et al. (2005) Aguirre A., Schaye J., Hernquist L., Kay S., Springel V., Theuns T., 2005, ApJ, 620, L13
- Arribas et al. (2014) Arribas S., Colina L., Bellocchi E., Maiolino R., Villar-Martin M., 2014, A&A, 568, A14
- Barcons et al. (2017) Barcons X., et al., 2017, Astronomische Nachrichten, 338, 153
- Barcos-Muñoz et al. (2018) Barcos-Muñoz L., et al., 2018, ApJ, 853, L28
- Barret et al. (2020) Barret D., Decourchelle A., Fabian A., Guainazzi M., Nandra K., Smith R., den Herder J.-W., 2020, Astronomische Nachrichten, 341, 224
- Bauer et al. (2007) Bauer M., Pietsch W., Trinchieri G., Breitschwerdt D., Ehle M., Read A., 2007, A&A, 467, 979
- Bland & Tully (1988) Bland J., Tully B., 1988, Nature, 334, 43
- Bland-Hawthorn et al. (2007) Bland-Hawthorn J., Veilleux S., Cecil G., 2007, Ap&SS, 311, 87
- Bordoloi et al. (2011) Bordoloi R., et al., 2011, ApJ, 743, 10
- Bordoloi et al. (2016) Bordoloi R., Rigby J. R., Tumlinson J., Bayliss M. B., Sharon K., Gladders M. G., Wuyts E., 2016, MNRAS, 458, 1891
- Breitschwerdt et al. (1991) Breitschwerdt D., McKenzie J. F., Voelk H. J., 1991, A&A, 245, 79
- Bryans et al. (2009) Bryans P., Landi E., Savin D. W., 2009, ApJ, 691, 1540
- Bustard & Zweibel (2021) Bustard C., Zweibel E. G., 2021, ApJ, 913, 106
- Bustard et al. (2020) Bustard C., Zweibel E. G., D’Onghia E., Gallagher J. S. I., Farber R., 2020, ApJ, 893, 29
- Cecil et al. (2002a) Cecil G., Ferruit P., Veilleux S., 2002a, in Henney W. J., Steffen W., Binette L., Raga A., eds, Revista Mexicana de Astronomia y Astrofisica Conference Series Vol. 13, Revista Mexicana de Astronomia y Astrofisica Conference Series. pp 170–176
- Cecil et al. (2002b) Cecil G., Bland-Hawthorn J., Veilleux S., 2002b, ApJ, 576, 745
- Chan et al. (2019) Chan T. K., Kereš D., Hopkins P. F., Quataert E., Su K. Y., Hayward C. C., Faucher-Giguère C. A., 2019, MNRAS, 488, 3716
- Cherenkov Telescope Array Consortium et al. (2019) Cherenkov Telescope Array Consortium et al., 2019, Science with the Cherenkov Telescope Array, doi:10.1142/10986.
- Chevalier & Clegg (1985) Chevalier R. A., Clegg A. W., 1985, Nature, 317, 44
- Chevalier & Imamura (1982) Chevalier R. A., Imamura J. N., 1982, ApJ, 261, 543
- Cooper et al. (2008) Cooper J. L., Bicknell G. V., Sutherland R. S., Bland-Hawthorn J., 2008, ApJ, 674, 157
- Cui et al. (2019) Cui X., Foster A. R., Yuasa T., Smith R. K., 2019, ApJ, 887, 182
- Decaux et al. (2003) Decaux V., Jacobs V. L., Beiersdorfer P., Liedahl D. A., Kahn S. M., 2003, Phys. Rev. A, 68, 012509
- Dermer & Menon (2009) Dermer C. D., Menon G., 2009, High Energy Radiation from Black Holes: Gamma Rays, Cosmic Rays, and Neutrinos
- Devine & Bally (1999) Devine D., Bally J., 1999, ApJ, 510, 197
- Di Matteo et al. (2008) Di Matteo P., Bournaud F., Martig M., Combes F., Melchior A. L., Semelin B., 2008, A&A, 492, 31
- Dickinson et al. (2003) Dickinson M., Papovich C., Ferguson H. C., Budavári T., 2003, ApJ, 587, 25
- Dubey et al. (2008) Dubey A., Reid L. B., Fisher R., 2008, Physica Scripta Volume T, 132, 014046
- Fabbiano (1988) Fabbiano G., 1988, ApJ, 330, 672
- Fabbiano (2006) Fabbiano G., 2006, ARA&A, 44, 323
- Farber et al. (2018) Farber R., Ruszkowski M., Yang H. Y. K., Zweibel E. G., 2018, ApJ, 856, 112
- Feng & Soria (2011) Feng H., Soria R., 2011, New Astron. Rev., 55, 166
- Ferland et al. (2017) Ferland G. J., et al., 2017, Rev. Mex. Astron. Astrofis., 53, 385
- Fornasini et al. (2018) Fornasini F. M., Civano F., Fabbiano G., Elvis M., Marchesi S., Miyaji T., Zezas A., 2018, ApJ, 865, 43
- Foster et al. (2012) Foster A. R., Ji L., Smith R. K., Brickhouse N. S., 2012, ApJ, 756, 128
- Fox & Davé (2017) Fox A., Davé R., 2017, Gas Accretion onto Galaxies. Springer, doi:10.1007/978-3-319-52512-9
- Frye et al. (2002) Frye B., Broadhurst T., Benítez N., 2002, ApJ, 568, 558
- Fryxell et al. (2000) Fryxell B., et al., 2000, ApJS, 131, 273
- Girichidis et al. (2018) Girichidis P., Naab T., Hanasz M., Walch S., 2018, MNRAS, 479, 3042
- Gorenstein et al. (1974) Gorenstein P., Harnden F. R. J., Tucker W. H., 1974, ApJ, 192, 661
- Gu et al. (2005) Gu M. F., Schmidt M., Beiersdorfer P., Chen H., Thorn D. B., Träbert E., Behar E., Kahn S. M., 2005, ApJ, 627, 1066
- Hashimoto et al. (2018) Hashimoto T., et al., 2018, Nature, 557, 392
- Heckman (2003) Heckman T. M., 2003, in Avila-Reese V., Firmani C., Frenk C. S., Allen C., eds, Revista Mexicana de Astronomia y Astrofisica Conference Series Vol. 17, Revista Mexicana de Astronomia y Astrofisica Conference Series. pp 47–55
- Hoopes et al. (2003) Hoopes C. G., Heckman T. M., Strickland D. K., Howk J. C., 2003, ApJ, 596, L175
- Hopkins et al. (2021a) Hopkins P. F., Chan T. K., Squire J., Quataert E., Ji S., Kereš D., Faucher-Giguère C.-A., 2021a, MNRAS, 501, 3663
- Hopkins et al. (2021b) Hopkins P. F., Squire J., Chan T. K., Quataert E., Ji S., Kereš D., Faucher-Giguère C.-A., 2021b, MNRAS, 501, 4184
- Ipavich (1975) Ipavich F. M., 1975, ApJ, 196, 107
- Jacob et al. (2018) Jacob S., Pakmor R., Simpson C. M., Springel V., Pfrommer C., 2018, MNRAS, 475, 570
- Jansen et al. (2001) Jansen F., et al., 2001, A&A, 365, L1
- Jefferies (1968) Jefferies J. T., 1968, Spectral line formation
- Kaastra & Mewe (1993) Kaastra J. S., Mewe R., 1993, A&AS, 97, 443
- Kim & Ostriker (2018) Kim C.-G., Ostriker E. C., 2018, ApJ, 853, 173
- Klein et al. (1988) Klein U., Wielebinski R., Morsi H. W., 1988, A&A, 190, 41
- Konami et al. (2011) Konami S., Matsushita K., Tsuru T. G., Gandhi P., Tamagawa T., 2011, PASJ, 63, S913
- Krieger et al. (2019) Krieger N., et al., 2019, ApJ, 881, 43
- Lehnert et al. (1999) Lehnert M. D., Heckman T. M., Weaver K. A., 1999, ApJ, 523, 575
- Leitherer et al. (1999) Leitherer C., et al., 1999, ApJS, 123, 3
- Li & Draine (2001) Li A., Draine B. T., 2001, ApJ, 554, 778
- Li et al. (2017) Li M., Bryan G. L., Ostriker J. P., 2017, ApJ, 841, 101
- Lopez-Rodriguez et al. (2021) Lopez-Rodriguez E., Guerra J. A., Asgari-Targhi M., Schmelz J. T., 2021, ApJ, 914, 24
- Lopez et al. (2020) Lopez L. A., Mathur S., Nguyen D. D., Thompson T. A., Olivier G. M., 2020, ApJ, 904, 152
- Madau et al. (1996) Madau P., Ferguson H. C., Dickinson M. E., Giavalisco M., Steidel C. C., Fruchter A., 1996, MNRAS, 283, 1388
- Mannucci et al. (2010) Mannucci F., Cresci G., Maiolino R., Marconi A., Gnerucci A., 2010, MNRAS, 408, 2115
- Martin et al. (2002) Martin C. L., Kobulnicky H. A., Heckman T. M., 2002, ApJ, 574, 663
- Martin et al. (2013) Martin C. L., Shapley A. E., Coil A. L., Kornei K. A., Murray N., Pancoast A., 2013, ApJ, 770, 41
- Martizzi et al. (2016) Martizzi D., Fielding D., Faucher-Giguère C.-A., Quataert E., 2016, MNRAS, 459, 2311
- Masai (1984) Masai K., 1984, Ap&SS, 98, 367
- Mayya et al. (2004) Mayya Y. D., Bressan A., Rodríguez M., Valdes J. R., Chavez M., 2004, ApJ, 600, 188
- McKeith et al. (1995) McKeith C. D., Greve A., Downes D., Prada F., 1995, A&A, 293, 703
- Melioli et al. (2013) Melioli C., de Gouveia Dal Pino E. M., Geraissate F. G., 2013, MNRAS, 430, 3235
- Mewe & Gronenschild (1981) Mewe R., Gronenschild E. H. B. M., 1981, A&AS, 45, 11
- Mewe et al. (1985) Mewe R., Gronenschild E. H. B. M., van den Oord G. H. J., 1985, A&AS, 62, 197
- Mineo et al. (2012) Mineo S., Gilfanov M., Sunyaev R., 2012, MNRAS, 419, 2095
- Mitsuishi et al. (2013) Mitsuishi I., Yamasaki N. Y., Takei Y., 2013, PASJ, 65, 44
- Nakamura et al. (1999) Nakamura T., Umeda H., Nomoto K., Thielemann F.-K., Burrows A., 1999, ApJ, 517, 193
- Navarro et al. (1996) Navarro J. F., Frenk C. S., White S. D. M., 1996, ApJ, 462, 563
- Nguyen & Thompson (2021) Nguyen D. D., Thompson T. A., 2021, arXiv e-prints, p. arXiv:2108.07343
- Nomoto et al. (1984) Nomoto K., Thielemann F. K., Yokoi K., 1984, ApJ, 286, 644
- Oehm et al. (2017) Oehm W., Thies I., Kroupa P., 2017, MNRAS, 467, 273
- Origlia et al. (2004) Origlia L., Ranalli P., Comastri A., Maiolino R., 2004, ApJ, 606, 862
- Owen et al. (2018) Owen E. R., Jacobsen I. B., Wu K., Surajbali P., 2018, MNRAS, 481, 666
- Owen et al. (2019a) Owen E. R., Jin X., Wu K., Chan S., 2019a, MNRAS, 484, 1645
- Owen et al. (2019b) Owen E. R., Wu K., Jin X., Surajbali P., Kataoka N., 2019b, A&A, 626, A85
- Owen et al. (2021) Owen E. R., Lee K.-G., Kong A. K. H., 2021, MNRAS, 506, 52
- Peters et al. (2015) Peters T., et al., 2015, ApJ, 813, L27
- Porquet et al. (2010) Porquet D., Dubau J., Grosso N., 2010, Space Sci. Rev., 157, 103
- Ramzan et al. (2020) Ramzan B., Ko C. M., Chernyshov D. O., 2020, ApJ, 905, 117
- Ranalli et al. (2008) Ranalli P., Comastri A., Origlia L., Maiolino R., 2008, MNRAS, 386, 1464
- Rubin et al. (2014) Rubin K. H. R., Prochaska J. X., Koo D. C., Phillips A. C., Martin C. L., Winstrom L. O., 2014, ApJ, 794, 156
- Rupke et al. (2005a) Rupke D. S., Veilleux S., Sanders D. B., 2005a, ApJS, 160, 87
- Rupke et al. (2005b) Rupke D. S., Veilleux S., Sanders D. B., 2005b, ApJS, 160, 115
- Rybicki & Lightman (2004) Rybicki G. B., Lightman A. P., 2004, Radiative Processes in Astrophysics, Wiley-VCH Verlag, Weinheim. Wiley-VCH
- Samui et al. (2010) Samui S., Subramanian K., Srianand R., 2010, MNRAS, 402, 2778
- Saxton et al. (1998) Saxton C. J., Wu K., Pongracic H., Shaviv G., 1998, MNRAS, 299, 862
- Schneider & Robertson (2018) Schneider E. E., Robertson B. E., 2018, ApJ, 860, 135
- Schneider et al. (2020) Schneider E. E., Ostriker E. C., Robertson B. E., Thompson T. A., 2020, ApJ, 895, 43
- Shapiro & Moore (1977) Shapiro P. R., Moore R. T., 1977, ApJ, 217, 621
- Sharma & Nath (2013) Sharma M., Nath B. B., 2013, ApJ, 763, 17
- Shopbell & Bland-Hawthorn (1998) Shopbell P. L., Bland-Hawthorn J., 1998, ApJ, 493, 129
- Silich et al. (2004) Silich S., Tenorio-Tagle G., Rodríguez-González A., 2004, ApJ, 610, 226
- Silver et al. (2000) Silver E., et al., 2000, ApJ, 541, 495
- Sommariva et al. (2012) Sommariva V., Mannucci F., Cresci G., Maiolino R., Marconi A., Nagao T., Baroni A., Grazian A., 2012, A&A, 539, A136
- Soria & Wu (2002) Soria R., Wu K., 2002, A&A, 384, 99
- Spitzer (1956) Spitzer L., 1956, Physics of Fully Ionized Gases. Dover Publications
- Strickland & Heckman (2007) Strickland D. K., Heckman T. M., 2007, ApJ, 658, 258
- Strickland & Heckman (2009) Strickland D. K., Heckman T. M., 2009, ApJ, 697, 2030
- Strickland & Stevens (2000) Strickland D. K., Stevens I. R., 2000, MNRAS, 314, 511
- Strickland et al. (1997) Strickland D. K., Ponman T. J., Stevens I. R., 1997, A&A, 320, 378
- Strickland et al. (2000) Strickland D. K., Heckman T. M., Weaver K. A., Dahlem M., 2000, AJ, 120, 2965
- Sugahara et al. (2019) Sugahara Y., Ouchi M., Harikane Y., Bouché N., Mitchell P. D., Blaizot J., 2019, ApJ, 886, 29
- Sutherland & Dopita (1993) Sutherland R. S., Dopita M. A., 1993, ApJS, 88, 253
- Swartz et al. (2004) Swartz D. A., Ghosh K. K., Tennant A. F., Wu K., 2004, ApJS, 154, 519
- Tanner (2020) Tanner R., 2020, ApJ, 899, 108
- Tanner et al. (2016) Tanner R., Cecil G., Heitsch F., 2016, ApJ, 821, 7
- Tatischeff (2003) Tatischeff V., 2003, in Motch C., Hameury J.-M., eds, EAS Publications Series Vol. 7, EAS Publications Series. p. 79 (arXiv:astro-ph/0208397), doi:10.1051/eas:2003038
- Thompson et al. (2015) Thompson T. A., Fabian A. C., Quataert E., Murray N., 2015, MNRAS, 449, 147
- Thornton et al. (1998) Thornton K., Gaudlitz M., Janka H. T., Steinmetz M., 1998, ApJ, 500, 95
- Tsuru et al. (2007) Tsuru T. G., et al., 2007, PASJ, 59, 269
- Varenius et al. (2016) Varenius E., et al., 2016, A&A, 593, A86
- Veilleux et al. (2005) Veilleux S., Cecil G., Bland-Hawthorn J., 2005, ARA&A, 43, 769
- Vito et al. (2016) Vito F., et al., 2016, MNRAS, 463, 348
- Walter et al. (2017) Walter F., et al., 2017, ApJ, 835, 265
- Wiener et al. (2017) Wiener J., Pfrommer C., Oh S. P., 2017, MNRAS, 467, 906
- Wu (2001) Wu K., 2001, Publ. Astron. Soc. Australia, 18, 443
- Wu et al. (2001) Wu K., Cropper M., Ramsay G., 2001, MNRAS, 327, 208
- Wu et al. (2020) Wu K., Li K. J., Owen E. R., Ji L., Zhang S., Branduardi-Raymont G., 2020, MNRAS, 491, 5621
- Yu et al. (2020) Yu B. P. B., Owen E. R., Wu K., Ferreras I., 2020, MNRAS, 492, 3179
- Zhang et al. (2014) Zhang S., Wang Q. D., Ji L., Smith R. K., Foster A. R., Zhou X., 2014, ApJ, 794, 61
- de Grijs (2001) de Grijs R., 2001, Astronomy and Geophysics, 42, 4.12
Appendix A Comparison between numerical simulations and analytic models

The asymptotic stationary-state HD profiles computed in our numerical simulations are compared with the analytical stationary-state outflow solution of Y20 in Figure 16. The fractional residuals in the velocity, density, temperature and pressure profiles show that there is excellent agreement between the stationary-state results of this work and those of Y20, if the same set of system parameters is adopted. We note that the minor differences seen in the temperature and pressure profiles at around 2 kpc arise due to radiative cooling, which is strongest at these locations.