SDSS J1059+4251, a highly magnified star-forming galaxy:
ESI observations of the rest-frame UV spectrum
Abstract
Detailed analyses of high-redshift galaxies are challenging due to their faintness, but this difficulty can be overcome with gravitational lensing, in which the magnification of the flux enables high signal-to-noise ratio (S/N) spectroscopy. We present the rest-frame ultraviolet (UV) Keck Echellette Spectrograph and Imager (ESI) spectrum of the newly discovered lensed galaxy SDSS J1059+4251. With an observed magnitude and a magnification factor , J1059+4251 is both highly magnified and intrinsically luminous, about two magnitudes brighter than at –3. With stellar mass , star formation rate , and stellar metallicity , J1059+4251 is typical of bright star-forming galaxies at similar redshifts. Thanks to the high S/N and the spectral resolution of the ESI spectrum, we are able to separate the interstellar and stellar features and derive properties that would be inaccessible without the aid of the lensing. We find evidence of a gas outflow with speeds up to , and of an inflow that is probably due to accreting material seen along a favorable line of sight. We measure relative elemental abundances from the interstellar absorption lines and find that -capture elements are overabundant compared to iron-peak elements, suggestive of rapid star formation. However, this trend may also be affected by dust depletion. Thanks to the high data quality, our results represent a reliable step forward in the characterization of typical galaxies at early cosmic epochs.
tablenum \restoresymbolSIXtablenum \turnoffeditone
1 Introduction
In the last two decades or so, the number of galaxies discovered at redshifts –10 has increased spectacularly thanks largely to the development of appropriate colour selection criteria, pioneered by Steidel et al. (1996) (see also Adelberger et al. 2004), and reviewed by Shapley (2011) (see also Madau & Dickinson 2014). However, galaxies at high redshifts are faint ( at ; Steidel et al. 1999; Reddy et al. 2008) and the signal-to-noise ratio (S/N) needed to enable detailed spectroscopic studies is hard to achieve, until the next generation of 30+ m optical/IR telescopes comes on line. Besides long integration times (e.g. Erb et al. 2010) and stacking techniques (e.g. Zhu et al. 2015, Steidel et al. 2016, Rigby et al. 2018a, 2018b), another effective way to overcome these difficulties is to study high redshift gravitationally lensed galaxies, where the magnification furnished by the gravitational lensing provides high S/N spectra which can be analyzed in greater detail. In particular, rest-frame ultraviolet wavelengths are especially interesting, since they encode meaningful information about the star formation processes that took place in the early Universe. UV stellar continua can be used to infer the galaxy luminosity, star-formation rate and dust extinction (e.g. Kennicutt 1998, Calzetti et al. 2000, Salim et al. 2007, Wilkins et al. 2012), while individual spectral features (in absorption and in emission) provide valuable information on both the galaxy stellar populations and the interstellar medium (ISM) (e.g. Shapley et al. 2003, Berry et al. 2012, Talia et al. 2012, Steidel et al. 2016, Du et al. 2018, Cullen et al. 2019), including the chemical composition of young OB stars and the ISM from which these stars have recently formed. Furthermore, the relative abundances of elements produced on different timescales (i.e. iron-peak vs. -capture elements) give clues about the galaxy’s past history of star formation, as shown by the recent optical study of SDSS galaxies by Gallazzi et al. (2021). However, the ability to recover accurately all of these properties relies on the acquisition of high quality spectra of sufficiently high S/N and resolution to recognize stellar spectral lines against the continuum and reliably separate them from interstellar features.
An increasing number of gravitationally lensed galaxies have been spectroscopically analyzed in the UV range in the past years. One of the best-known sources is MS 1512-cB58 (Pettini et al., 2000, 2002). Some other well-known cases are the Lynx arc (Fosbury et al., 2003), BD38 (Dow-Hygelund et al., 2005), the "Cosmic Horseshoe" (Quider et al., 2009; James et al., 2018), the "8 o’clock arc" (Dessauges-Zavadsky et al., 2010), the "Cosmic Eye" (Quider et al., 2010), and more recently SGAS J105039.6+001730 (Bayliss et al., 2014), Cassowary20 (Pettini et al., 2010; James et al., 2014), J1110+6459 (Rigby et al., 2017) and SL2S J021737–051329 (Berg et al., 2018). Through the study of gravitationally lensed sources it appears that the population of high redshift galaxies is characterized by low metallicities ranging from 1/20 (Berg et al., 2018) to 1/2 (Quider et al. 2009, 2010), ages of a few hundreds of Myrs (Pettini et al. 2002, Dessauges-Zavadsky et al. 2010) and high ionization levels (Hainline et al. 2009, Richard et al. 2011, Berg et al. 2018). Moreover, the observed overabundance of metals produced on shorter timescales by Type II supernovae (SNII) with respect to those produced on longer timescales by Type Ia supernovae (SNIa) suggests the presence of rapid star formation timescales. Evidence of large-scale outflows driven by stellar winds and supernovae have been found in most gravitationally lensed galaxies (e.g. Pettini et al. 2002, Bayliss et al. 2014), and in rare cases also indications of possible inflows of material have been observed. The latter might be produced by gas which has been previously ejected and is now falling back on to the galaxy (e.g. Quider et al. 2010). The majority of the studies performed on gravitationally lensed galaxies have involved sources which are magnified by factors , while only a few objects with magnification factors have been spectroscopically investigated at ultraviolet and optical wavelengths (Pettini et al., 2002, Ebeling et al., 2009 , van der Wel et al., 2013, Bayliss et al. 2014, Rigby et al. 2017, Rivera-Thorsen et al. 2017). Yet, the most highly magnified sources are certainly the most interesting ones, since they potentially provide the highest possible S/N and thus the most accurate results.
In this paper, we present the first results from a concerted study of a newly discovered, highly magnified, high redshift gravitationally lensed galaxy, J1059+4521 (J1059, hereafter). This galaxy has been identified in the course of a search for lensed QSOs, using SDSS ugriz and WISE photometry (Wright et al., 2010). J1059 has a redshift (see Section 4) and is magnified by a galaxy complex at by a factor , which is one of the highest magnifications known to date (similar to that of MS 1512-cB58; Seitz et al., 1998).
The aim of this paper is to define the average physical and evolutionary properties of J1059 by means of its stellar and interstellar UV spectral features, and to add another piece of knowledge to the characterization of the galaxy population at high redshift. It is worth noting that gravitationally lensed galaxies are also opening the way to spatially resolved studies. Their lensing magnification provides high resolution on sub-kpc-scales, enabling us to spatially resolve the internal kinematics (e.g. Swinbank et al. 2009, Jones et al. 2010, Stark et al. 2013, James et al., 2018). We will focus on this kind of analysis in a companion paper (James et al. 2021 in prep.).
The current paper is organized as follows. In Section 2 we describe the lensing model and the morphology of J1059; in Section 3 we explain how the J1059 photometry and the UV spectroscopy were obtained, while in Section 4 we derive the systemic redshift. In Section 5 we infer stellar population properties of J1059 such as the stellar mass and the star formation rate; in Section 6 and 7 we analyze the interstellar spectrum of J1059, including the gas kinematics and the column densities of neutral hydrogen and nine metal ions, while in Section 9 we discuss the chemical composition of the interstellar gas. Lastly, in Section 10 we summarize our findings.
We adopt throughout a CDM cosmology with km s-1 Mpc-1, , and . All distances are given in physical (proper) units unless stated otherwise. We use the abbreviations ppc and pkpc to indicate physical units of parsecs and kiloparsecs. At the redshift of J1059 (), 1 arcsec on the sky corresponds to 7.86 pkpc in the image plane. Moreover, throughout the paper, we consider high redshifts the range .
2 SDSS J1059+4251: one of the brightest galaxy-scale lensed galaxies identified to date
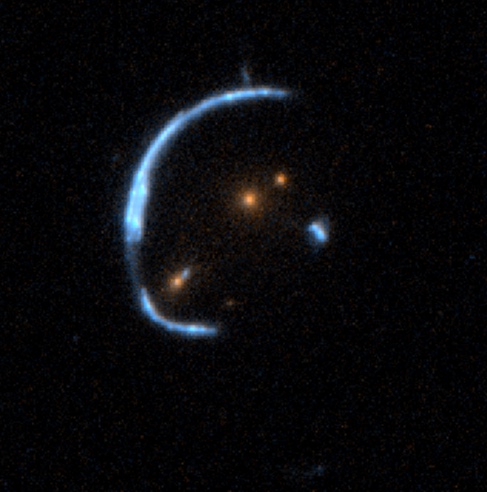
SDSS J1059+4251 was identified in the course of a search for lensed QSOs utilizing Sloan Digital Sky Survey (SDSS) and Wide-field Infrared Survey Explorer (WISE) photometry, due to its WISE color and multiple detections in SDSS (Lemon et al., 2018). The system consists of a blue background galaxy at redshift , gravitationally lensed into a bright arc and fainter counterimages by a foreground sparse group of galaxies whose colors suggest that they are at . The arc is unusually bright, with , , and magnitudes of 19.3, 18.7, and 18.5 respectively. These are times brighter than MS1512-cB58 (AB at , Ellingson et al. 1996), which remains one of the best studied high redshift galaxies.
HST images are reproduced in Figure 1. As can be appreciated from the figure, there is considerable structure in the lensed arc, with several bright knots indicating that the background galaxy has a complex morphology. To reconstruct the source image, we followed the adaptive pixellated source modeling technique described by Vegetti & Koopmans (2009). Our lens model is based on the F606W data, but we verified that adding the other bands does not improve the fit and that the F606W-based model reproduces very well the data in the other bands.
The intrinsic source surface brightness distribution was described on an irregular grid of pixels that approximately follows the magnification of the lens, with a PSF-deconvolved intensity at each pixel determined from the lens mass model and observed data. We model the lensing mass distribution as two singular isothermal models, one centered on the central galaxy and the other on the galaxy to its southeast (see the left panel of Figure 1); the former is modelled as an ellipsoid and the latter as a sphere, and we also include an external shear. The initial models also included the galaxy visible at about 1″ to the northwest of the main lens. However, since its resulting amplitude was consistent with zero, we excluded it from the final modeling to reduce the size of the parameter space.
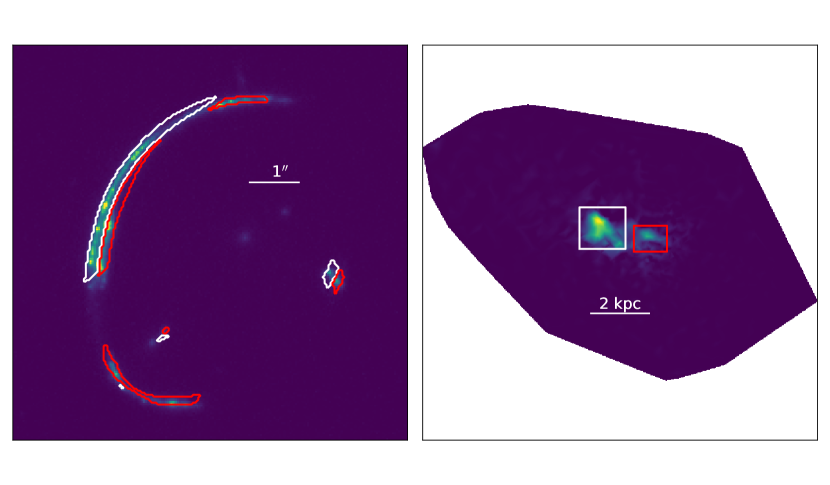
The reconstructed source surface brightness distribution can be seen in the right-hand panel of Figure 2. It shows an elongated structure with two main concentrations of stellar light, separated by pkpc, contributing to the lensed image. This morphology is not unusual for star-forming galaxies at –3, although without the aid of gravitational lensing it is normally seen on larger scales (Law et al., 2007, Conselice, 2014, but see also Johnson et al., 2017).
Our lensing model returns a remarkably high magnification for this system, which is, to our knowledge, one of the highest magnifications provided by a galaxy-scale lens. We also note that due to differential magnification across the extended source the spectroscopic features may experience different magnification than the flux observed in the broadband imaging. This cannot be quantified with the data analyzed in this paper, but will be investigated with spatially resolved spectroscopy in the future (James et al, in preparation).
3 Observations and data reduction
Prompted by the unusual brightness of the lensed arc in J1059, we have targeted this system with a variety of observations, including HST imaging, slit spectroscopy with the Echellette Spectrograph and Imager (ESI; Sheinis et al., 2000) on the Keck II telescope, and integral field spectroscopy with the Keck Cosmic Web Imager (KCWI; Morrissey et al., 2018), also on the Keck II telescope. The KCWI observations are the subject of a forthcoming paper (James et al, in preparation), although we use some of their findings here. This paper focuses primarily on the ESI spectroscopy, after a brief description of the HST imaging.
3.1 HST and WISE Imaging
We obtained photometry through the F606W, F814W, F125W and F160W filters of the Wide Field Camera 3 (WFC3) UVIS/IR imager on the HST in order to constrain the star formation and stellar population properties across the source and on sub-kpc scales. The F606W observations were acquired on 14 February 2018 (proposal ID 15223, PI Auger), and the F814W, F125W and F160W observations were obtained on 19 February 2019 (proposal ID 15467, PI Erb). The spatial sampling was optimized by using a 4-point box dither for the UVIS observations. For the IR observations with larger pixels, we used a 4-point box dither followed by a 3-point line, for a total of 7 exposures at 6 different positions. The repeated position, corresponding to the first exposure in each dither pattern, enables a consistency check of the slightly different exposure times of the two patterns, and the combination of the two patterns improves the sub-pixel sampling over either pattern alone. We used the STEP100 sampling sequence in order to obtain good sampling on both the lensed arc and on PSF stars to be used for the de-lensing model. The dither sequences also enable rejection of detector artifacts and cosmic rays. The final images in each filter are drizzled onto 004 pixels centered on the lensing galaxy using a Lanczos3 kernel for the UVIS images and a Gaussian kernel for the IR images. After finding the lens model using the F606W111Adding the other HST bands does not improve the lens model. We note that the model fitted to the F606W data does a very good job at modelling the data in the other bands with well-focused sources. data (Section 2), we then model the three foreground lensing galaxies as Sersic profiles and simultaneously solve for the best source surface brightness distribution to effectively model away the lens galaxy light and determine the image-plane source flux (the source and lens flux are well-separated in the UVIS data but there is significant overlap in the IR data).
WISE W1 and W2 imaging data were also used to extend the spectral energy distribution (SED) to redder wavelengths. Because of the much poorer spatial resolution compared to HST (the resolution is approximately 6″ in W1 and W2) the light from the background source is significantly contaminated by the light from the lensing galaxies. Nevertheless, if we use the fits to the HST imaging data described above as models for the surface brightness distributions of the background source and foreground lensing galaxies, we can attempt to remove the contribution of the foreground galaxy light. In particular, we convolve the model of the lensed background emission with models of the WISE W1 and W2 PSFs, and we do the same for the foreground lensing galaxies. We also do the same to the observed HST data of two galaxies immediately to the east and west of the lens system, as their light slightly overlaps with the lensed background emission due to the size of the WISE PSFs. We then find the best amplitudes for each of our four WISE model components (the foreground lensing galaxies, the background lensed emission, and the two galaxies to the east and west) that best fit the observed W1 and W2 images. We find that the foreground lensing galaxies have very blue W1-W2 colors while the background lensed arc is quite red, consistent with the initial selection of the system as a potential quasar. The HST and WISE magnitudes for the total observed light (i.e., in the image plane) of the background galaxy so obtained are listed in Table 1, together with the total exposure times for each band.
| Filter | Magnitude error | Central | Exposure |
|---|---|---|---|
| wavelength (Å) | time (s) | ||
| F606W | 19.07 0.02 | 5885 | 2572 |
| F814W | 18.84 0.02 | 8048 | 2572 |
| F125W | 18.68 0.05 | 12486 | 2494 |
| F160W | 18.37 0.05 | 15369 | 2494 |
| WISE1 | 17.59 0.03 | 33526 | 1480 |
| WISE2 | 17.50 0.02 | 46028 | 1440 |
3.2 ESI Slit Spectroscopy
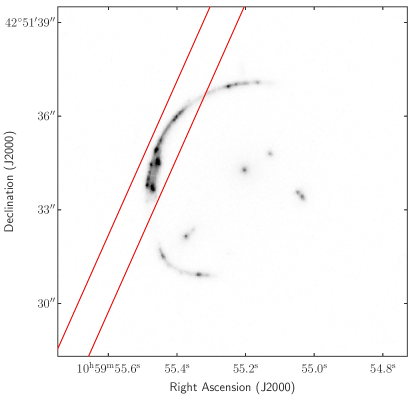
The ESI observations were conducted on the night between February 27 and 28 2019 UT. We used the 1 arcsec wide slit at position angle (see Figure 1). The total exposure time was 7 hours, split into 14 1800 s long integrations. The mean (median) airmass during the observations was 1.27 (1.20) and the seeing was stable at arcsec FWHM through the night.
The data were reduced with a custom pipeline developed by Becker et al. (2009) and described in some detail in López et al. (2016). For each 1800 s exposure, optimal sky subtraction was performed on the unrectified 2D frame following the prescriptions by Kelson (2003) to maximize the S/N ratio and minimize residuals from bright emission lines from the earth’s atmosphere. Wavelength calibration (to vacuum heliocentric values) was by reference to comparison spectra produced by Cu-Ar and Hg-Ne-Xe hollow-cathode lamps. Correction for telluric absorption used the atmospheric transmission spectrum of Hinkle et al. (2003).
The wavelength and flux calibrated, co-added 1D spectrum covers the wavelength range 3100–10300 Å, although the S/N deteriorates rapidly shortwards of Å and longwards of Å; therefore, we limit ourselves to the analysis of this wavelength region, which corresponds to the range 1075–2050 Å in the rest frame of J1059. The spectral resolution, determined from the widths of sky emission lines, is FWHM km s-1, sampled with three wavelength bins. The S/N in the continuum is between 30 and 40 per 20 km s-1 ( Å) bin over most of the above wavelength range, falling to below 1200 Å.
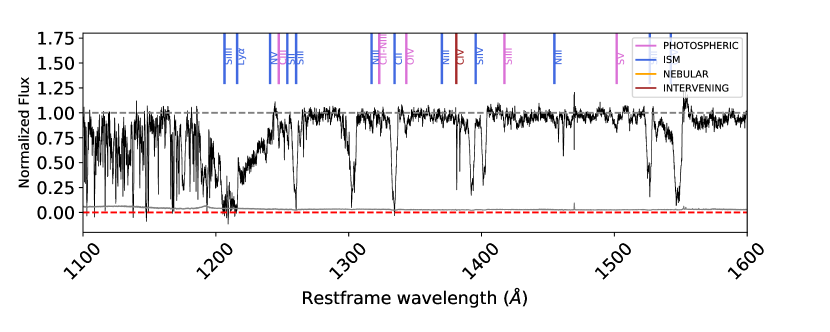
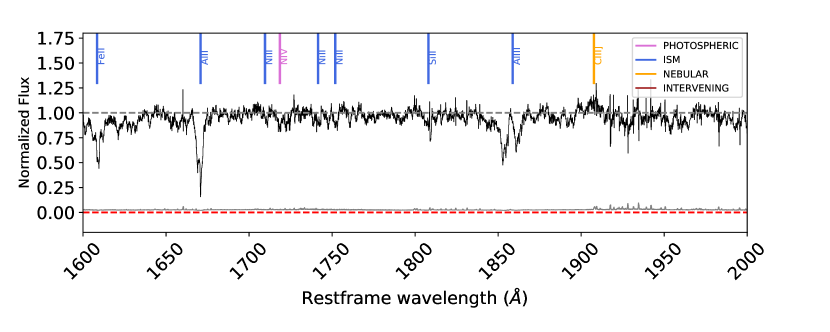
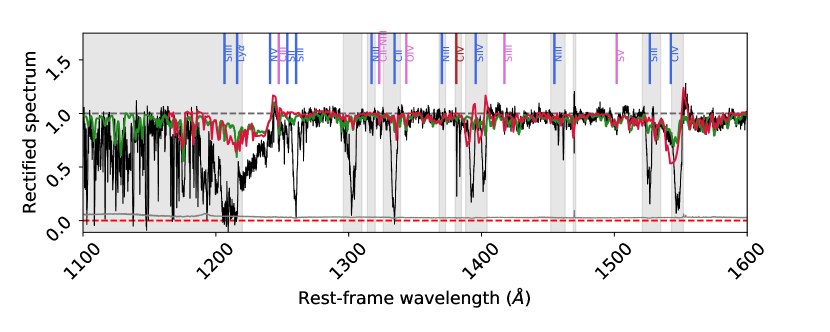
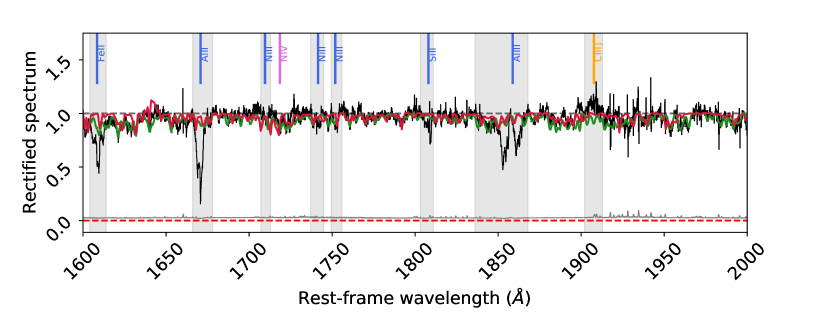
After transforming the spectrum to the rest-frame of J1059 at (see Section 4), we normalized it by dividing by our best estimate of the stellar continuum following the prescription of Rix et al. (2004); this final spectrum is reproduced in Figure 3. It is important to bear in mind throughout the subsequent analysis that the ESI slit (see Figure 1) captures the light from both regions in the reconstructed source image shown in Figure 2. Consequently, all of our findings should be interpreted as approximately average values for the galaxy, while the integral-field spectroscopy of James et al. (in preparation) will assess if and how the galaxy’s properties vary with location within the galaxy (on an unprecedented fine physical scale of ppc).
4 Systemic Redshift
As can be appreciated from Figure 3, the ESI spectrum of J1059 is rich in UV spectral features. The most obvious features are strong interstellar absorption lines (indicated in blue in the two panels of Figure 3) formed in the gas of J1059 located in front of (most of) the early-type stars producing the UV continuum. We interpret the very strong feature centred near 1210 Å as the blend of a damped Ly absorption line with mostly redshifted (relative to the stars) Ly emission (see Section 8.2). The interstellar lines are seen against a background of low contrast photospheric absorption lines due to OB stars; the earliest spectral types within the stellar population give rise to typical P-Cygni profiles in the high ionization resonance doublets of C iv , Si iv and N v . Emission lines are weak: apart from weak nebular C iii] , we do not detect O iii] , nor any emission lines due to transitions to fine structure levels of the ground states of C ii and Si ii (Scarlata & Panagia, 2015) which can sometimes be clearly visible in such spectra (see, for example, Erb et al., 2010). He ii is also not detected. Evidently, the spectrum of this starburst galaxy is dominated by strong absorption lines. Finally, we detect narrow absorption lines from intervening gas not associated with J1059; apart from the Ly forest due to the intergalactic medium, a pair of narrow absorption lines near 1380 Å is identified as a C iv doublet at .
| Ion | (Å) | (Å) | |
|---|---|---|---|
| C iii | 1247.38 | ||
| C ii | 1323.93 | ||
| N iii | 1324.31 | ||
| O iv | 1343.35 | ||
| Si iii | 1417.24 | ||
| S v | 1501.76 | ||
| N iv | 1718.55 | 0.00018 |
The first step in the analysis of this rich spectrum is to establish the systemic redshift of the galaxy. To this end, we use the line list in the UV spectroscopic atlas of starbursts by Leitherer et al. (2011) to identify photospheric lines which are unblended and sufficiently well defined for their wavelengths to be measured with confidence. We isolate seven suitable photospheric absorption lines, listed in Table 2. We deduce a mean systemic redshift if we take a weighted mean of the entries in Table 2; for comparison the unweighted mean is . We adopt the former as our estimate of .
5 Global properties of the stellar population
In this section we use the broadband photometry of J1059 to constrain its global stellar population properties, in order to place it in context within the high redshift galaxy population.
5.1 Physical properties from SED fitting
Here we use the HST and WISE photometry (see Table 1) corrected for both the lensing magnification and foreground Galactic extinction, for which we find using the Milky Way dust map of Green et al. (2015). We model the J1059 SED using the code Prospector (Johnson et al., 2021), which employs the Flexible Stellar Population Synthesis models (FSPS; Conroy et al. 2009; Conroy & Gunn 2010). We adopt the BPASS v2.2 stellar spectra and libraries, including binary stellar evolution, an upper mass limit of 100 , and a Chabrier (2003) IMF, leaving the metallicity as a free parameter of the fit. We adopt a constant star formation history and the Small Magellanic Cloud (SMC) extinction curve (Gordon et al., 2003), motivated by evidence that the relationship between dust attenuation and the UV slope for –2.5 galaxies with sub-solar metallicities is consistent with the SMC extinction law (Reddy et al., 2018a). We also performed the fit using the Calzetti et al. (2000) extinction law, but found that this resulted in best-fit models with unphysically young ages (), which are not compatible with the dynamical timescales () inferred for galaxies (e.g. Erb et al., 2006a; Reddy et al., 2018b).
Markov Chain Monte Carlo (MCMC) modeling of the SED results in a best-fit model with stellar mass , age Myr, , and metallicity . With a constant star formation history, these results then imply a star formation rate of 50 7 . We find that while the mass, extinction and age are generally well-constrained, the metallicity probability distribution is significantly broader, with the other parameters equally well-fit for metallicities in the range –0.5 . The metallicity is better constrained by the spectrum, as we describe in Section 6.
The values derived here for J1059 are typical of galaxies (lensed or not) at (e.g. Erb et al., 2006b, Shapley, 2011, Santini et al., 2017, Du et al., 2018, Nakajima et al., 2018, Pantoni et al., 2021). It is worth pointing out that our SED fitting results can be affected by the well-known degeneracy between age and dust (Papovich et al., 2001), which have similar effects of reddening the colors of galaxies. The derived stellar mass and SFR of J1059 (corrected for dust extinction and lensing magnification) are consistent with the SF main sequences at –3 (e.g. Santini et al., 2017). This suggests that J1059 is not experiencing a short-lived starburst episode (Rodighiero et al. 2011) and can be considered representative of the typical population of star-forming galaxies at high redshift ().
5.2 Star formation rate and UV slope
We also estimate the SFR and dust extinction from the ESI spectrum and rest-frame UV photometry alone, for comparison with the results of the photometric SED fitting. We use the HST F606W and F814W images, which for the redshift of J1059 have rest-frame central wavelengths 1550 Å and 2120 Å respectively. From these rest-frame UV images only, we find a UV slope of , where . Restricting the measurement to only the portions of the images falling within the spectroscopic slit results in a slightly bluer slope of .
We next use the HST photometry to finalize the flux calibration of the ESI spectrum, adjusting the spectrum so that synthetic F606W and F814W magnitudes calculated from it match the photometry within the slit. This calibration is intended to correct for potential wavelength-dependent slit losses due to differential refraction that may cause the spectroscopic and the photometric UV slopes to differ. We then fit the calibrated, telluric-corrected spectrum over the rest-frame wavelength range 1270–2300 Å, with the strong absorption lines masked. The resulting slope is , where the uncertainties are derived from Monte Carlo simulations and come primarily from the flux calibration of the spectrum. This slope is considerably bluer than the value of from the photometry alone we found above; we attribute this difference to the strong absorption lines in the spectrum that fall in the F606W filter, which are masked in the spectral fit but not accounted for in the photometry. We therefore adopt as the final UV slope. This value is consistent with those found in galaxies at in the COSMOS (Taniguchi et al., 2007) and VANDELS (McLure et al., 2018) fields (Pilo et al., 2019, Calabrò et al., 2020; see also Section 10 for further details).
Adopting the SMC extinction law (Gordon et al., 2003), we then obtain , which is in good agreement with the value of found from the SED fitting in Section 5.1 above. We derive an absolute UV magnitude , roughly two magnitudes brighter than at –3 and placing J1059 at the bright end of the UV luminosity function (Theios et al., 2019), (Reddy & Steidel, 2009). Using the lensing and dust-corrected F606W magnitude to trace the UV continuum luminosity, we use the Kennicutt & Evans (2012) relation to obtain an extinction-corrected , somewhat higher than the value obtained by SED fitting. However, we note that Theios et al. (2019) show that at sub-solar metallicities SFR-UV luminosity calibrations based on the BPASS models result in lower SFRs than the Kennicutt & Evans (2012) relation. Using their calibration based on BPASS models with a 100 upper mass cutoff and then gives a corrected , closer to the value of 50 obtained from the SED fitting in Section 5.1 above. We also recall that the SFRSED is derived from the best-fit stellar mass and age as described above, and therefore depends on the entire SED rather than on the rest-frame UV alone. Finally, we note that there is an additional uncertainty to be added to the luminosity and stellar mass estimates due to the uncertainty in the magnification correction.
6 The stellar spectrum
In this section we analyze the photospheric spectrum of J1059 in order to uncover further its stellar population properties. In particular, we use both the stellar continuum and stellar absorption features to derive the stellar metallicity. In order to perform this study, we fit the observed UV spectrum with a set of starburst99 synthetic models (Leitherer et al., 1999). We adopt 100 Myr old models with a continuous star formation history, which is a reasonable assumption for galaxies which are undergoing current star formation. Moreover, an age of 100 Myr ensures that the synthetic UV spectra are stable against the fast evolution of very massive stars, which occurs on timescales shorter than 30 Myr. We adopt a Salpeter initial mass function (IMF) (Salpeter, 1955) with a upper mass limit of 100 M⊙ (note that the Salpeter and the Chabrier IMF are the same in the high mass regime). We consider five different stellar metallicities: and , where is the solar value (in these models). We assume Geneva evolutionary tracks with high mass loss (Meynet et al., 1994), which are able to model the stellar winds and thus the P-Cygni profiles characterizing some of the absorption features within the considered wavelength range.
Before comparing the starburst99 model spectra with the data by means of a minimization, we smooth the former to match the velocity dispersion of the stars in J1059 as recorded with ESI. From the widths of the stellar lines listed in Table 2, we measure a velocity dispersion km s-1, a value typical of rather massive (M⊙) star-forming galaxies at –3 (see, for example, Erb et al., 2006b; Förster Schreiber et al., 2006). We therefore smooth the starburst99 output spectra accordingly and rebin them to the 20 km s-1 wide bins of the ESI spectrum. Since starburst99 is designed to model only the stellar component of a galaxy spectrum, we mask out the interstellar and nebular features before carrying out the comparison. We define the as:
| (1) |
where is the observed spectrum, is the model considered for the fit and is the error on the observed spectrum.
By performing the minimization, we derive a stellar metallicity (between and ). The errors represent the 68% confidence interval, obtained from 100 Monte Carlo re-simulations of the ESI spectrum. Figure 4 shows the J1059 normalized spectrum together with the best fit starburst99 model. It is possible to appreciate that the model is able to reproduce the multitude of low contrast photospheric features in the UV spectrum over the whole wavelength range (Leitherer et al., 2011). The ability of the fit to reproduce the observed spectrum also suggests that continuous mode models and a Salpeter IMF including stars as massive as 100 give a good representation of the properties of J1059.
We also fit the observed spectrum with BPASS models (Eldridge & Stanway, 2016), which include massive binary stars in the stellar population. We adopt BPASS models with properties as similar as possible to the starburst99 ones, i.e. with a 100 Myr old continuous star formation history, metallicities in the range and a Salpeter IMF up to 100 . We find that the BPASS best fit metallicity is (68% confidence interval, as before), in broad agreement with the starburst99 results.
The stellar mass and stellar metallicity we derived for J1059 fall on the stellar mass-stellar metallicity relation found by Cullen et al. (2019) through UV spectral fits of VANDELS (McLure et al., 2018) galaxies with and in the redshift range . They are also consistent with the stellar mass-stellar metallicity relation derived by Calabrò et al. (2020) by means of the photospheric absorption indices defined by Rix et al. (2004). The observed metallicity suggests rapid star formation that has polluted the ISM in a relatively short amount of time ( 500 Myr), giving birth to metal-enriched generations of stars. The general stellar properties of J1059 confirm the trends and the properties found so far that characterize the population of high- galaxies. Moreover, they show how different methods (i.e. full-UV spectrum fitting and photospheric absorption indices) are consistent in predicting the stellar properties of high redshift galaxies (see Section 10 for further details).
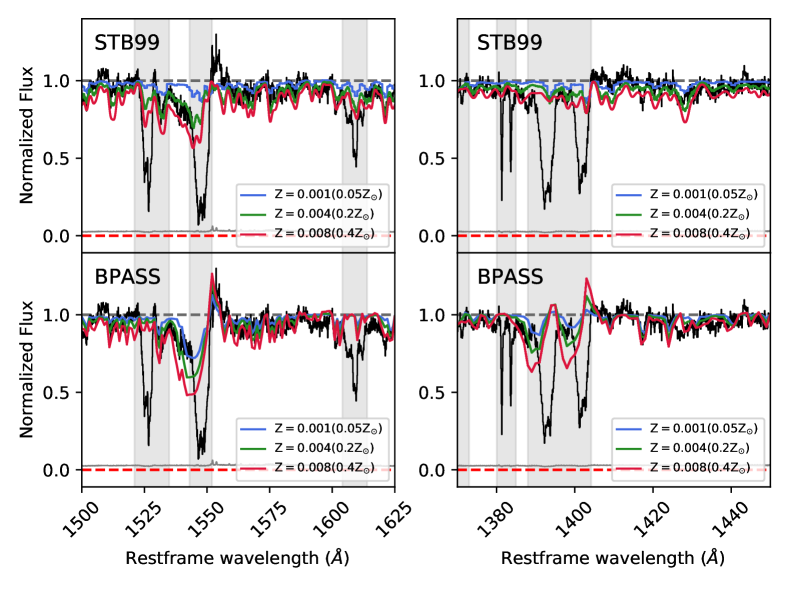
Figure 5 shows the portions of the J1059 spectrum encompassing the C IV 1548, 1550 and the Si IV 1393, 1402 absorption features, compared to three starburst99 and three BPASS synthetic spectra with different metallicities. The C IV 1548, 1550 and Si IV 1393, 1402 lines include both a stellar and an interstellar component, which can be easily distinguished from one another thanks to the high resolution of our data. These lines show the typical P-Cygni profile arising from stellar winds and consisting of a blueshifted absorption component and a redshifted emission component. The Si IV P-Cygni stellar feature is stronger in more evolved and/or higher metallicity stellar populations, where Si+++ is the dominant ionized species (see Chisholm et al., 2019 for further details), so it may be unsurprising that J1059 does not show noticeable Si IV P-Cygni emission.
As can be seen in the figure, the best fit starburst99 model is able to reproduce the absorption portion of the P-Cygni profile of the C IV line, while the lower () and the higher () metallicity models underpredict and overpredict it, respectively. However, the best fit model itself underpredicts the emission portion of the P-Cygni profile. Looking at the BPASS models, they are able to reproduce the emission portion of the P-Cygni profile, although overestimating the absorption. The situation is reversed for Si IV, where the starburst99 models do a better job in reproducing the whole P-Cygni profile than the BPASS models.
A possible explanation of the observed C IV emission might be the presence of redshifted nebular emission near 1551.6 Å (Leitherer et al., 2002). This is not unusual and has already been found in other high redshift lensed galaxies (e.g. the Cosmic Horseshoe and the Cosmic Eye; Quider et al. 2009, 2010). There are also known cases, among strongly lensed high redshift galaxies, where nebular emission is the dominant component of the C IV feature (see Christensen et al., 2012, Stark et al., 2014, Smit et al., 2017, Berg et al., 2018). However, the ability of the BPASS models to reproduce that same emission suggests that it might have a stellar origin, probably related to Wolf-Rayet (WR) stars. This latter hypothesis would imply that the BPASS models provide a better treatment of the WR stars and their evolution than starburst99. On the other hand, Si IV does not show a strong P-Cygni emission component, and the BPASS models that reproduce the C IV emission feature overpredict the Si IV emission.
The discrepancies between the starburst99 and BPASS models are probably related to a different treatment of mass loss, stellar rotation and stellar multiplicity. On the one hand, the BPASS models include binary evolution, which increases the lifetime of more massive stars producing hotter, bluer stellar spectra. On the other hand, the starburst99 models we are using do not include stellar rotation and therefore predict a lower mass loss rate, which weakens the stellar features associated with winds. These discrepancies show that further improvements are needed even in state-of-the-art stellar synthetic spectra to theoretically reproduce all the variables involved in stellar evolution.
A further potential complication is that the starburst99 and BPASS models do not consider non-solar element abundance patterns, such as the overabundance of alpha-capture elements relative to Fe-peak elements that seems to be a common feature of galaxies undergoing rapid star formation (e.g. Steidel et al., 2016, Strom et al., 2018), and is indeed found to apply to the interstellar gas in J1059 (see Section 9 and Figure 12.) This is a shortcoming of the synthetic models that has not yet been addressed. The 1100–2000 Å wavelength range covered by our ESI spectrum includes many spectral features from a variety of elements of the periodic table, from H to Ni. Consequently, the stellar metallicity we have derived here has to be considered as an approximate measure of the average degree of metal enrichment achieved by the early-type stars in J1059.
7 The Interstellar Spectrum
We now turn to the analysis of the interstellar spectrum of J1059, with its attendant information on the kinematics and chemical composition of diffuse gas in the galaxy.
7.1 Gas Kinematics
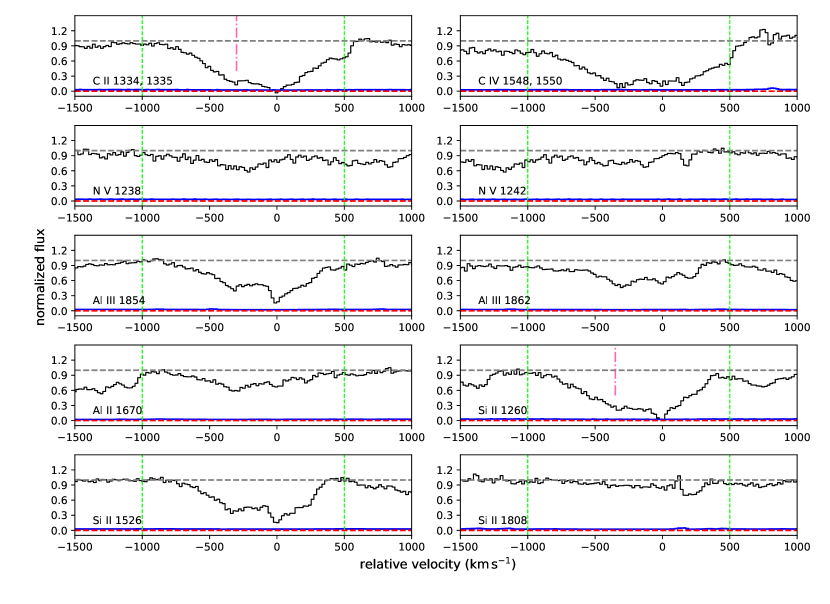
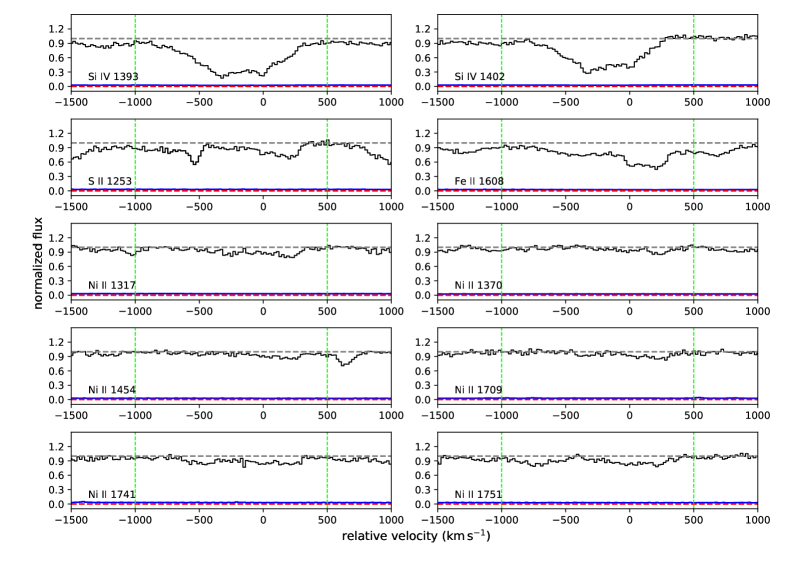
We identify 20 interstellar absorption lines (or blends of absorption lines) in the ESI spectrum of J1059, produced by elements from H to Ni, in a range of ionization stages from neutral hydrogen to four-times ionized nitrogen. The profiles of all 20 absorption lines are plotted in Figures 6 and 7 on a velocity scale relative to the systemic redshift . These plots show clearly the large velocity extent of the lines: there is gas at both negative and positive velocities relative to the redshift of the stars.
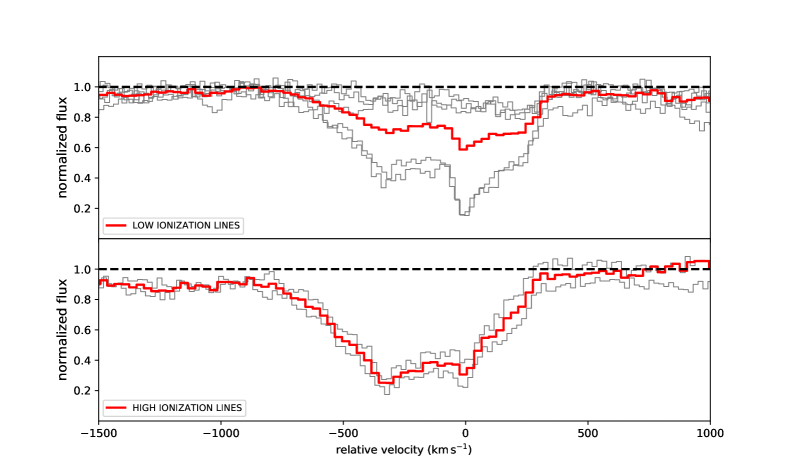
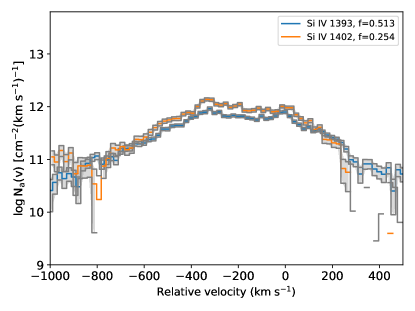
To better assess the full velocity extent of the absorbing gas, we construct average line profiles using all of the absorption lines, or portions of lines, that are not blended; we do this separately for species that are the dominant ionization stages of their elements in neutral gas (i.e. the first ions for the species considered here), and for more highly ionized species. In particular, for the low ionization lines, we only considered the Ni ii 1709, Ni ii 1741, Si ii 1526 and Al ii 1670 lines. For the high ionization, we only considered the Si iv 1393 and Si iv 1402 lines. The average profiles, reproduced in Figure 8, show absorption extending over the range to km s-1 for both neutral and ionized gas, although the balance between blueshifted and redshifted absorption is somewhat different between the two.
Blueshifted interstellar absorption is a common feature of star-forming galaxies at high as well as low redshifts (e.g. Heckman et al., 2000; Pettini et al., 2001; Shapley et al., 2003; Steidel et al., 2010; Marques-Chaves et al., 2020) and is generally interpreted as tracing galaxy-wide outflows powered by the kinetic energy and momentum deposited into the ISM by the starburst (see Veilleux et al., 2005; Heckman et al., 2015; Veilleux et al., 2020, for comprehensive reviews). That the outflowing gas should reach velocities as high as nearly km s-1 is not unexpected either; such an extended blue wing to the line profiles has been recorded in other well-studied gravitationally lensed galaxies at –3 (e.g. Pettini et al., 2002; Quider et al., 2009; Dessauges-Zavadsky et al., 2010).
On the other hand, in J1059 the absorption at positive velocities relative to the stars is somewhat stronger and extends further (kinematically) than in previous well-observed examples. If the interstellar medium of this galaxy has a similar velocity dispersion as the stars ( km s-1; see Section 6), some of this redshifted absorption (as well as some of the blue wing) could simply be the high velocity tail of the ambient ISM. The profiles of the high ionization absorption lines (see lower panel of Figure 8) are consistent with this interpretation. However, this is not entirely the case with the low ionization lines, which evidently show a discrete absorption component, rather than a smooth wing, at positive velocities.
We examined the integral field data of James et al. (in preparation) to check if the redshifted and blueshifted absorption could be ascribed separately to the two regions making up the source (see right panel of Figure 2) and found that this is not the case, although there are some differences in the velocity profiles presented by gas in front of each region. Presumably, much of the absorption we see arises in material well in front of the stars and covering both concentrations of stellar light. In a major new study of more than 200,000 foreground-background galaxy pairs at , Chen et al. (2020) found that galaxy-scale outflows dominate the kinematics of the gas in the circumgalactic medium (CGM) out to distances of pkpc from the starburst, while at a distance beyond pkpc infall of accreting gas takes over. Within this picture, we may be viewing J1059 along a line of sight that captures a cold filament of dense (given the strength of the absorption lines) accreting material (Dekel et al., 2009), as well as the near-ubiquitous galaxy-wide outflow.
In columns 4 and 5 of Table 3 we list the values of equivalent width (EW) and associated errors (EW) for the 20 interstellar absorption lines in J1059. EWs are measured by integrating the velocity profiles shown in Figs. 6 and 7 over the range to km s-1. The errors are calculated with a Monte Carlo approach: we perturb the observed spectrum in the region of each line by a random realization of the noise spectrum, and then refit the continuum and recalculate the EW. We repeat this procedure 500 times for each line; the resulting distributions of values of EW are found to be approximately Gaussian in shape, and we adopt their dispersion () as a measure of the error in EW.
| Ion | ||||||
|---|---|---|---|---|---|---|
| C ii | 1334.532 | 0.129 | 3.63 | >15.54 | ||
| C iv | 1548.202, 1550.774 | 0.2848 | 4.75 | |||
| N v | 1238.821 | 0.156 | 2.04 | 15.08 | ||
| N v | 1242.804 | 0.0777 | 1.12 | 15.09 | ||
| Al ii | 1670.7867 | 1.74 | 2.79 | 13.97 | ||
| Al iii | 1854.7164 | 0.561 | 2.36 | 14.23 | ||
| Al iii | 1862.7895 | 0.279 | 1.62 | 14.34 | ||
| Si ii | 1260.42 | 1.20 | 3.14 | >14.53 | ||
| Si ii | 1526.72 | 0.144 | 2.36 | >15.08 | ||
| Si ii | 1808.00 | 0.00245 | 0.74 | 16.06 | ||
| Si iv | 1393.76 | 0.513 | 2.83 | 14.70 | ||
| Si iv | 1402.77 | 0.254 | 1.99 | 14.81 | ||
| S ii | 1253.805 | 0.0104 | 1.31 | 16.02 | ||
| Fe ii | 1608.45078 | 0.0591 | 1.99 | 15.26 | ||
| Ni ii | 1317.217 | 0.0818 | 0.53 | 14.65 | ||
| Ni ii | 1370.132 | 0.0811 | 0.21 | 14.21 | ||
| Ni ii | 1454.842 | 0.0347 | 0.28 | 14.65 | ||
| Ni ii | 1709.604 | 0.0551 | 0.24 | 14.27 | ||
| Ni ii | 1741.553 | 0.0488 | 0.69 | 14.75 | ||
| Ni ii | 1751.910 | 0.0361 | 0.80 | 14.94 |
-
a
Rest wavelengths and -values from Cashman et al. (2017).
-
b
Blended with C ii∗
-
c
Partially blended with each other
-
d
Blended with S ii
-
e
Blended with stellar P-Cygni line (emission + absorption)
-
f
Mildly saturated.
8 Column Densities
8.1 Metal Lines
The resolved profiles of the interstellar absorption lines recorded with ESI allow us to use the apparent optical depth (AOD) method of Savage & Sembach (1991) to deduce the ion column densities from unsaturated absorption lines. As those authors pointed out, the advantage of the AOD approach is that it highlights cases where narrow, saturated components are masked by overlapping broader ones; this is a distinct possibility for our data, given the great velocity extent of the lines and the knowledge that the interstellar absorption we see is a composite of many unresolved sightlines with potentially widely differing optical depths.
In the AOD method, the column density of an ion per velocity bin, (cm-2), is related to the apparent optical depth in that bin, , by the expression:
| (2) |
where and f are, respectively, the wavelength (in Å) and oscillator strength of the atomic transition. Hidden saturation is revealed by discordant values of returned from lines with differing -values absorbing from the same ground state of an ion (since by definition there is only one value of the column density for that ground state). Partial, as opposed to complete, coverage of the stars by the absorbing gas would produce a similar effect; however, in our case we do not expect this to be a significant complication, as the cores of the strongest lines in Figure 6 reach down to the zero level. We calculate values of for each absorption line by integrating Equation 2 from to km s-1; the associated errors, , are estimated with the same Monte Carlo approach used for the errors in the equivalent widths. Values of and are listed in the last two columns of Table 3.
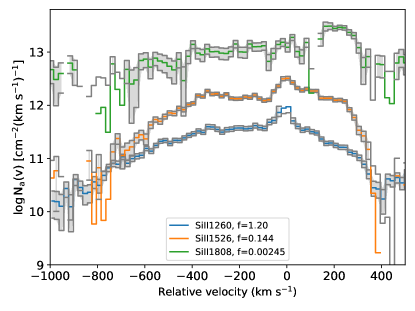
In Figure 9 we reproduce two examples of the run of apparent optical depth with velocity. The three Si ii transitions covered by our data have widely different -values (see Table 3), from for the strongest line () which is clearly saturated, to for ; accordingly, it is the weakest, apparently unsaturated (see bottom right panel of Figure 6), line that gives the highest measure of . There is mild saturation in the cores of the Si iv doublet lines (right panel of Figure 9), although out in the wings there is better agreement between the values of indicated by each line. Again, it is the weaker line which probably returns the more reliable estimate of the column density of Si iv. Thus, focusing on the first ions in Table 3, we consider the values of deduced for Si ii, S ii and Ni ii to be the most trustworthy, given that for each of these species our data include apparently unsaturated transitions. From the AOD method, Al iii 1854 also shows mild saturation. There may well be some mild saturation affecting the single Al ii and Fe ii absorption lines in the present set; without additional transitions we cannot estimate the severity of the upward corrections (if any) to be applied to the values of (Al ii) and (Fe ii) listed in the Table. The tabulated value of (C ii) is an uninformative lower limit because is strongly saturated.
Inspection of Table 3 also shows that our errors (and presumably EW) are evidently underestimated. This can most readily be appreciated by realizing that the six independent determinations of (Ni ii) differ from one another by much more than may be expected on the basis of the quoted errors. In this case, hidden saturation does not appear to be the culprit, since there is no trend of increasing with decreasing -value. Our Monte Carlo approach to determining the errors, which included random realizations of the continuum level, seems robust. The most plausible explanation, in our view, is that these weak lines are blended to different degrees with photospheric (i.e. stellar) absorption features which are difficult to resolve from interstellar absorption and thus fully account for (as the work of Rix et al. 2004 makes clear). As this problem may affect to some extent all of the interstellar features considered, we take the pragmatic approach of adopting the dispersion between the six (Ni ii) values, %, as a more conservative estimate of for all of the ion column densities.
8.2 Neutral Hydrogen Column Density from Ly
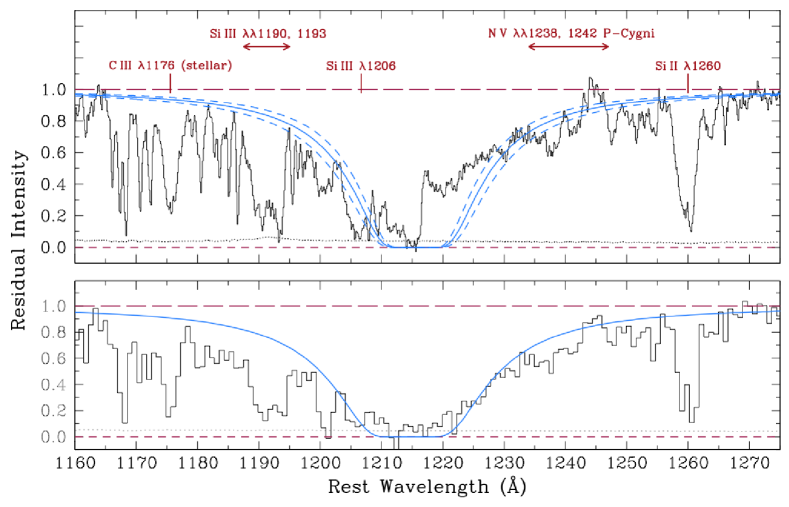
In the upper panel of Figure 10 we reproduce the portion of the ESI spectrum encompassing the Ly line. As can be seen, this region is a complex blend of several spectral features. In addition to Ly, there are a number of metal absorption lines (stellar and interstellar) at wavelengths close to that of Ly (Si ii ; N i ; Si iii ; N v ). These lines span velocities km s-1 (see Figure 8); together with the ever-present Ly forest, they make the interpretation of the Ly line itself somewhat problematic.
In this task, we are aided by the availability of the KCWI integral field spectroscopy of James et al. (in preparation), which allows us to explore how this spectral region changes as one moves along the arc of the lensed image. Inspection of the KCWI data cube reveals that the Ly line itself is a blend of absorption and emission. There are regions of the arc where the Ly emission is at a minimum, and others where we only see emission. An example of the former is reproduced in the lower panel of Figure 10; at this location, we see a clear damped profile indicative of a high column density of neutral hydrogen (H i) cm-2 ([(H i)/cm). A damped profile with a somewhat lower column density [(H i)/cm provides a reasonable fit to the absorption+emission blend of Ly in the averaged spectrum captured by the ESI slit. We adopt this value as our best estimate of the neutral hydrogen column density. Note, in this respect, that the metal absorption lines in the KCWI spectrum where Ly is in absorption are consistent within the noise with those in the ESI spectrum (compare the two panels of Figure 10), lending support to our procedure for establishing the neutral hydrogen column density. It is interesting that the value of (H i) in J1059 is one of the highest so far encountered in star-forming galaxies at –3, and is at the upper end of the distribution of values measured in damped Ly systems (DLAs; Noterdaeme et al., 2014).
The column density derived for J1059 is comparable to the values routinely encountered in Gamma-Ray Burst (GRB) DLAs (e.g. Jakobsson+2006, Krühler+2013, Bolmer+2019). GRBs occur in star-forming regions within their host galaxies and probe the hydrogen density only along the GRB line of sight. It is remarkable that similarly high values of (H i) apply to J1059, even though it is an extended object and the ESI slit averages the absorption along thousands of sightlines to OB stars within the –3 kpc physical scale of the source (Figure 2). James et al. (in prep) will further investigate the differential hydrogen column density in the galaxy.
9 Chemical Composition of the Interstellar Gas
In principle, having determined the column densities of five elements, from Al to Ni, as well as that of H, we are now in a position to attempt to measure the chemical composition of the interstellar gas in J1059. However, before proceeding we must sound several notes of caution. First, the background continuum against which we see absorption is not a point source but is a composite of many sightlines to the spatially extended starburst (right panel of Figure 2); furthermore, we know from the integral field observations of James et al. (in preparation) that there are variations in the absorption/emission mix along the ESI slit. As pointed out earlier, what we measure are average quantities for the regions encompassed by the spectrograph slit, but the mean residual intensity in an absorption line wavelength bin is only the same as the mean optical depth in that bin in the optically thin regime. This could potentially lead us to underestimate the ion column densities, particularly for species where only one absorption line is available to us, so that hidden line saturation cannot be assessed with the AOD method (e.g. Al ii and Fe ii ).
Second, there are the usual concerns with neglecting potential ionization corrections and dust depletions, which we do not have sufficient data here to estimate quantitatively. The very high neutral hydrogen column density would suggest that ionization corrections might be small (Vladilo et al., 2001) but, on the other hand, we do know that there is ionized gas (traced by Al iii, C iv, Si iv and N v) at the same velocities as the first ions that are the major ionization stages of their elements in H i regions (see Figure 8). As for depletions, the finding that the continuum of J1059 is reddened by dust assures that, for refractory elements at least, such corrections may well be important.
Finally, for the reasons explained in Section 8.1, the derivation of realistic uncertainties in the measures of ion column densities is not straightforward. Despite all of these caveats, it is still worthwhile examining the conclusions that can be drawn from the data in Table 3.
In Table 4 we collect element abundances in the interstellar gas of J1059 and compare them to the solar composition from Asplund et al. (2009). The abundances of the two -capture elements covered by our data, Si and S, are similar at solar within the errors: [Si, S/H]. If we have been pessimistic in assigning errors of % to the ion column densities, the true abundance in the gas may be closer to the S value, solar, with Si showing some mild depletion onto dust (among the elements considered here S has the least affinity for dust—see Jenkins, 2009; Jenkins & Wallerstein, 2017). Alternatively, as pointed out by Jenkins (2009), it may be the case that some of the singly ionized S is located in H ii gas, given that only photons with energies greater than 23.4 eV (significantly higher than the 13.6 eV required to ionize H) can produce S++.
The two Fe-peak elements considered here, Fe and Ni, are both less abundant than Si and S. This could be understood as a combination of dust depletion (both are refractory elements easily incorporated into dust grains) and an intrinsically lower than solar Fe-peak to -capture element ratio which is now acknowledged to be a common feature of galaxies that are rapidly forming stars (e.g. Steidel et al., 2016; Strom et al., 2018; Sanders et al., 2020).
More difficult to interpret are the relative abundances of Fe and Ni, with the former apparently four or five times less abundant than the latter. Such a difference is unexpected: these two elements usually track each other closely in stars (e.g. Reddy et al., 2003), and are depleted to similar extent in the interstellar medium of the Milky Way and the Small Magellanic Cloud (Jenkins, 2009; Jenkins & Wallerstein, 2017). Possible explanations for this apparent anomaly are that: (a) the column density of Fe ii has been underestimated if there is significant saturation in the absorption line, and/or (b) the column density of Ni ii has been overestimated if there is stellar photospheric contamination of the six Ni ii absorption lines (Table 3) which we consider to be exclusively interstellar. (Differential ionization effects are unlikely to account for the factor of difference given that the ionization potentials of Fe+ and Ni+ differ by less than 2 eV.)
| Ion | ||||
|---|---|---|---|---|
| H i | … | … | … | |
| Al ii | ||||
| Si ii | ||||
| S ii | ||||
| Fe ii | ||||
| Ni ii |
-
a
Solar abundance scale from Asplund et al. (2009)
-
b
We address the first of these options by considering Fe ii , the only other Fe ii line included in our spectrum. This line is recorded at lower S/N than , being close to the short wavelength limit of ESI, and its measurement is complicated by blending with the Ly forest (which is why it is not included in Table 3). Nevertheless, comparing its apparent optical depth to that of the weaker line does indicate some degree of saturation, which is likely to affect both transitions. On the other hand, inspection of the starburst99 best fitting spectrum reproduced in Figure 4 (see Section 6) does not support the second option as the main reason for the anomalously low Fe/Ni ratio.
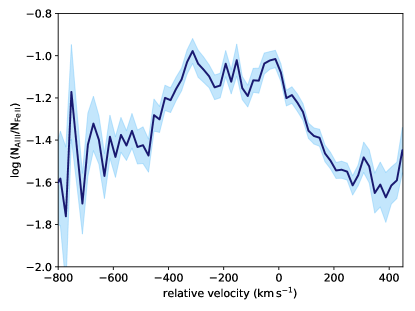
If Fe ii suffers significant, unresolved, saturation the same is likely to apply to Al ii which has similar apparent optical depth (see Figures 6 and 7) and this, together with dust depletion, may also explain the low abundance of Al in the gas. However, we note that there appear to be real differences with velocity in the ratio of the apparent optical depths of these two lines, as can be appreciated from Figure 11. Changes in the ionization balance (Vladilo et al., 2001), degree of depletion, and intrinsic abundance could all be playing a part.
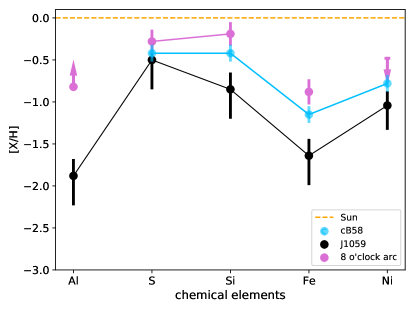
In Figure 12, we compare the pattern of abundances for the five elements considered here with analogous measurements in two other well-studied gravitationally lensed galaxies whose absorption-dominated spectra have allowed the composition of the interstellar gas to be determined: MS1512-cB58 (Pettini et al., 2002) and the 8 o’clock Arc (Dessauges-Zavadsky et al., 2010). All five elements are less abundant in J1059 than in the other two cases, but it is interesting to note that the difference is least pronounced for S, the element least likely to be incorporated into dust grains. Among the three galaxies, J1059 is also the one showing the highest value of neutral hydrogen column density ((H i)/cm), compared to 20.85 in cB58 and 20.57 in the 8 o’clock Arc, further pointing to a combination of line saturation and dust depletion as plausible causes for the much lower abundances of Fe and Al in J1059.
It is also of interest to compare the chemical enrichment in the interstellar gas with our earlier findings regarding the metallicity of the young stellar population, In Section 6, we concluded that a metallicity is favoured by the comparison of starburst99 models with the UV stellar spectrum of J1059, with a range –0.0085. The comparison with the data in Table 4 is made difficult by the uncertainties in both stellar and interstellar abundances, which are not insignificant, and by the fact that the starburst99 models are built with the solar relative abundance scale which probably does not apply to actively star-forming galaxies, as mentioned earlier. Thus, the "metallicity" of starburst99 model spectra is some average of the abundances of many elements, including both alpha (mainly O) and iron-peak (mainly Fe) elements, as well as C and N which we do not measure in the interstellar gas.
With all these reservations in mind, we note that corresponds to (Asplund et al., 2009) or dex, which agrees with the abundance of S (and Si, particularly if the latter suffers mild depletion) in Table 4.
James & Aloisi (2018) find that the abundances of S and O are correlated in local galaxies, and if we assume the same correlation we find .
With this oxygen abundance and our measured hydrogen column density (H i), J1059 falls on the local relationship between and (H i) (James & Aloisi, 2018).
However, local galaxies that have similar oxygen abundance and hydrogen column density are less massive than J1059 by an order of magnitude. This difference is broadly consistent with the offset of the mass-metallicity relation to lower metallicities at a given stellar mass at higher redshifts (Erb et al., 2006b; Henry et al., 2013; Steidel et al., 2014; Sanders et al., 2020), and with the finding that local galaxies matching the excitation properties of galaxies are times less massive than their higher redshift counterparts (Strom et al., 2017).
10 Discussion and Conclusions
In this paper we have presented ESI observations of the rest-frame UV spectrum of SDSS J1059+4251 (J1059), a star-forming galaxy at , gravitationally lensed by a complex of galaxies at . J1059 is very bright (), due both to its high intrinsic luminosity and the gravitational lensing that provides one of the highest magnification factors observed so far in a galaxy-scale lens (). The ESI observations therefore provide high S/N ( over the analyzed wavelength range) at high spectral resolution ().
The aim of this work was to characterize the average properties of J1059, while in a following paper (James et al. in prep.) we will focus on their variation on sub-kpc scales. The relevance of the present project is that the magnification of J1059, coupled with the high resolution of the ESI spectrum, enables us to separate the interstellar features from the stellar ones and to derive properties that would be inaccesible without the aid of the lensing. Our main findings can be summarized as follows.
-
•
From SED fitting of the HST and WISE photometry, we derive a stellar mass , age Myr, , and yr-1. From the UV spectrum calibrated with the HST photometry, we find a UV slope , while the rest-frame UV luminosity yields extinction-corrected SFRs of 70–90 yr-1 depending on the calibration used (see Section 5);
-
•
We fit the whole ESI UV spectrum, including the stellar continuum and stellar features with starburst99 and BPASS models, deriving a subsolar stellar metallicity of (Section 6);
-
•
We study the ISM line profiles, finding evidence of large scale outflows powered by the starburst and extending up to . We also find an absorption component at positive velocities which suggests the presence of inflowing gas (Section 7.1);
-
•
We analyze the pattern of chemical abundances in J1059 deduced from fitting individual ISM absorption features. We find that Fe-peak elements (Fe and Ni) are less abundant than -capture elements (Si and S). However, these trends can be affected by dust depletion, which seems to be higher in J1059 compared to other lensed galaxies studied so far. We find that the best-fit stellar metallicity is in agreement with the abundance of S (and Si, particularly if the latter suffers mild depletion) in the gas (Section 8.1).
J1059 is a typical example of a star-forming galaxy at , with a stellar mass and a star formation rate matching the star-forming main sequences of galaxies at similar redshifts (e.g. Santini et al. (2017)). This consistency suggests that J1059 is not experiencing a short-lived starburst or merger event, and fits in the picture that merger-enhanced SFRs are relatively unimportant in galaxies, as shown by Rodighiero et al. (2011).
The stellar mass and subsolar stellar metallicity we derived for J1059 fall on the stellar mass-stellar metallicity relation found by Cullen et al. (2019) for VANDELS (McLure et al., 2018) galaxies with in the redshift range . Similarly to our approach, these authors fit the galaxy rest-frame UV spectra with starburst99 models. Our stellar mass and stellar metallicity values also fall onto the stellar mass-stellar metallicity relation derived by Calabrò et al. (2020) by means of the photospheric absorption indices defined by Rix et al. (2004). Photospheric indices have the advantage of being relatively immune to overall changes in the continuum shape and therefore are less affected by the degeneracy between age and dust. Our metallicity result from the fit with starburst99 and BPASS models is also consistent with that obtained by Sommariva et al. (2012) for an ultraviolet-selected AMAZE (Mannucci et al., 2009) galaxy at with mass comparable to ours. In this context, J1059 represents additional evidence that subsolar metallicities are common among galaxies at . Our findings also show that different methods (i.e. full-spectrum fitting and photospheric absorption indices) are consistent in predicting the stellar properties of high redshift galaxies. It is also worth noting that, even though our full-spectrum analysis can be affected by the age-dust degeneracy, its agreement with the results from the photospheric indices points towards the robustness of our results.
Since bright star-forming disk galaxies contain most of the H i mass in the nearby Universe, it has always seemed likely that these galaxies and their high-redshift progenitors would be the origin of the Damped Ly systems (DLAs) seen in background quasar spectra. The current view, based on both theoretical (Pontzen et al., 2008; Berry et al., 2016; Di Gioia et al., 2020) and observational (Krogager et al., 2017, 2020) results is that DLAs are in fact a broad class of galaxies selected by H i cross-section spanning a range of 2–3 orders of magnitude in both mass and metallicity. Star-forming galaxies with absorption-dominated spectra tend to lie at the high value ends of the distributions of (H i) and spanned by the general DLA population, and in this respect the data reported here for J1059 fit this trend.
The stellar properties of J1059 we have discussed so far confirm some of the evolutionary trends that have been observed in high redshift galaxies in the past decades. This also holds for dust extinction, which we parameterized through the UV slope . The value that we derive is consistent, within the uncertainties, with the median value found by Pilo et al. (2019) in a sample of 517 bright () COSMOS (Taniguchi et al., 2007) star-forming galaxies. Moreover, our values of redshift and fall on the best fit relation found by Calabrò et al. (2020). They explored the slope of star-forming galaxies at redshifts extracted from the VANDELS (McLure et al., 2018) survey and found that increases on average from at to at . Our result therefore matches the strong evolution in seen at these cosmic epochs (Pannella et al., 2015).
Galaxy formation involves a continuous competition between gas cooling and accretion on the one hand, and feedback-driven heating and/or mass outflows on the other. Outflows, which are locally detected only in starburst galaxies (e.g. Heckman et al., 2000, Martin, 2005, Heckman et al., 2015) are very common at higher redshifts () among the general star-forming galaxy population. However, inflows of accreting cold gas at high redshift are very elusive and difficult to observe, since, as suggested by Steidel et al. (2010), they are often obscured by outflows or by absorption from the galaxy’s ISM. For example, Martin (2005) conducted an ESI study of the interstellar Na i D lines in 18 local ultraluminous infrared galaxies, finding evidence of outflows in 15 cases and of inflow in only one case. Also, theoretical studies have failed to fully predict the observational properties of inflows. The predictions are in fact rather model-dependent for both absorption lines and Ly emission. Moreover, the simulations which predict cold accretion generally do not account for interstellar gas that may have been carried to large galactocentric radii by outflows, nor for the scattering of Ly photons before escaping the galaxy (see Steidel et al., 2010). The investigation of observed velocity profiles is therefore considered one of the most effective ways to capture signatures of outflowing and cold inflowing gas filaments, which appear as blueshifted and redshifted components in the ISM absorption lines. These results are particularly clear in the case of J1059 thanks to the magnification and the high spectral resolution of the ESI spectrum, and offer still rare evidence of the presence of inflows in high redshift galaxies. In particular, we may be viewing J1059 along a line of sight that captures a cold filament of dense material accreting onto the galaxy.
Thanks to the high data quality, we are able to derive chemical abundances from individual absorption lines. This is remarkable considering that (to our knowledge) there are very few (lensed) galaxies with measured abundance patterns at these redshifts (cB58, Pettini et al., 2002; the 8 o’clock arc, Dessauges-Zavadsky et al., 2010). In particular, the picture emerging from our work is consistent with rapid star formation, where the elements produced by the short-lived Type II Supernovae are more abundant than the Fe-peak elements produced by later Supernovae Ia events. It is important to point out that the high hydrogen density of J1059 suggests a higher level of saturation and dust depletion than other lensed galaxies at similar redshifts, and these two factors may be playing a role in shaping the observed trends. However, this same trend of overabundant -capture elements has been observed in other lensed galaxies (Pettini et al. 2002, Dessauges-Zavadsky et al. 2010), and indeed appears to be common to most star-forming galaxies at –3 (Steidel et al. 2016, Strom et al. 2018).
From these results, we can conclude that a full understanding of the interplay of different factors on the observed chemical abundances still needs to be achieved and that our ability to perform exhaustive studies on the star formation histories of galaxies at very early epochs is still limited. However, spatially resolved studies of lensed galaxies afforded by high-sensitivity IFU instruments such as MUSE (Bacon et al., 2010), KCWI (Morrissey et al., 2018), and the upcoming NIRSpec (Bagnasco et al., 2007) on the James Webb Space Telescope will be useful to overcome complications due to the blending of sightlines. Larger samples of gravitationally lensed galaxies, especially the most highly magnified ones, are also needed. In this context, future surveys such as the Vera Rubin Observatory Legacy Survey of Space and Time are expected to discover new lenses (Collett, 2015), constituting a vast database for high-redshift studies such as the one we have presented here.
References
- Adelberger et al. (2004) Adelberger, K. L., Steidel, C. C., Shapley, A. E., et al. 2004, ApJ, 607, 226, doi: 10.1086/383221
- Asplund et al. (2009) Asplund, M., Grevesse, N., Sauval, A. J., & Scott, P. 2009, ARA&A, 47, 481, doi: 10.1146/annurev.astro.46.060407.145222
- Astropy Collaboration et al. (2013) Astropy Collaboration, Robitaille, T. P., Tollerud, E. J., et al. 2013, A&A, 558, A33, doi: 10.1051/0004-6361/201322068
- Astropy Collaboration et al. (2018) Astropy Collaboration, Price-Whelan, A. M., Sipőcz, B. M., et al. 2018, AJ, 156, 123, doi: 10.3847/1538-3881/aabc4f
- Bacon et al. (2010) Bacon, R., Accardo, M., Adjali, L., et al. 2010, in Society of Photo-Optical Instrumentation Engineers (SPIE) Conference Series, Vol. 7735, Ground-based and Airborne Instrumentation for Astronomy III, ed. I. S. McLean, S. K. Ramsay, & H. Takami, 773508, doi: 10.1117/12.856027
- Bagnasco et al. (2007) Bagnasco, G., Kolm, M., Ferruit, P., et al. 2007, in Society of Photo-Optical Instrumentation Engineers (SPIE) Conference Series, Vol. 6692, Cryogenic Optical Systems and Instruments XII, ed. J. B. Heaney & L. G. Burriesci, 66920M, doi: 10.1117/12.735602
- Bayliss et al. (2014) Bayliss, M. B., Rigby, J. R., Sharon, K., et al. 2014, ApJ, 790, 144, doi: 10.1088/0004-637X/790/2/144
- Becker et al. (2009) Becker, G. D., Rauch, M., & Sargent, W. L. W. 2009, ApJ, 698, 1010, doi: 10.1088/0004-637X/698/2/1010
- Berg et al. (2018) Berg, D. A., Erb, D. K., Auger, M. W., Pettini, M., & Brammer, G. B. 2018, ApJ, 859, 164, doi: 10.3847/1538-4357/aab7fa
- Berry et al. (2016) Berry, M., Somerville, R. S., Gawiser, E., et al. 2016, MNRAS, 458, 531, doi: 10.1093/mnras/stw231
- Berry et al. (2012) Berry, M., Gawiser, E., Guaita, L., et al. 2012, ApJ, 749, 4, doi: 10.1088/0004-637X/749/1/4
- Calabrò et al. (2020) Calabrò, A., Castellano, M., Pentericci, L., et al. 2020, arXiv e-prints, arXiv:2011.06615. https://arxiv.org/abs/2011.06615
- Calzetti et al. (2000) Calzetti, D., Armus, L., Bohlin, R. C., et al. 2000, ApJ, 533, 682, doi: 10.1086/308692
- Cashman et al. (2017) Cashman, F. H., Kulkarni, V. P., Kisielius, R., Ferland, G. J., & Bogdanovich, P. 2017, ApJS, 230, 8, doi: 10.3847/1538-4365/aa6d84
- Chabrier (2003) Chabrier, G. 2003, PASP, 115, 763, doi: 10.1086/376392
- Chen et al. (2020) Chen, Y., Steidel, C. C., Hummels, C. B., et al. 2020, MNRAS, 499, 1721, doi: 10.1093/mnras/staa2808
- Chisholm et al. (2019) Chisholm, J., Rigby, J. R., Bayliss, M., et al. 2019, ApJ, 882, 182, doi: 10.3847/1538-4357/ab3104
- Christensen et al. (2012) Christensen, L., Richard, J., Hjorth, J., et al. 2012, MNRAS, 427, 1953, doi: 10.1111/j.1365-2966.2012.22006.x
- Collett (2015) Collett, T. E. 2015, ApJ, 811, 20, doi: 10.1088/0004-637X/811/1/20
- Conroy & Gunn (2010) Conroy, C., & Gunn, J. E. 2010, ApJ, 712, 833, doi: 10.1088/0004-637X/712/2/833
- Conroy et al. (2009) Conroy, C., Gunn, J. E., & White, M. 2009, ApJ, 699, 486, doi: 10.1088/0004-637X/699/1/486
- Conselice (2014) Conselice, C. J. 2014, ARA&A, 52, 291, doi: 10.1146/annurev-astro-081913-040037
- Cullen et al. (2019) Cullen, F., McLure, R. J., Dunlop, J. S., et al. 2019, MNRAS, 487, 2038, doi: 10.1093/mnras/stz1402
- Dekel et al. (2009) Dekel, A., Birnboim, Y., Engel, G., et al. 2009, Nature, 457, 451, doi: 10.1038/nature07648
- Dessauges-Zavadsky et al. (2010) Dessauges-Zavadsky, M., D’Odorico, S., Schaerer, D., et al. 2010, A&A, 510, A26, doi: 10.1051/0004-6361/200913337
- Di Gioia et al. (2020) Di Gioia, S., Cristiani, S., De Lucia, G., & Xie, L. 2020, MNRAS, 497, 2469, doi: 10.1093/mnras/staa2067
- Dow-Hygelund et al. (2005) Dow-Hygelund, C. C., Holden, B. P., Bouwens, R. J., et al. 2005, ApJ, 630, L137, doi: 10.1086/491700
- Du et al. (2018) Du, X., Shapley, A. E., Reddy, N. A., et al. 2018, ApJ, 860, 75, doi: 10.3847/1538-4357/aabfcf
- Ebeling et al. (2009) Ebeling, H., Ma, C. J., Kneib, J. P., et al. 2009, MNRAS, 395, 1213, doi: 10.1111/j.1365-2966.2009.14502.x
- Eldridge & Stanway (2016) Eldridge, J. J., & Stanway, E. R. 2016, MNRAS, 462, 3302, doi: 10.1093/mnras/stw1772
- Ellingson et al. (1996) Ellingson, E., Yee, H. K. C., Bechtold, J., & Elston, R. 1996, ApJ, 466, L71, doi: 10.1086/310182
- Erb et al. (2010) Erb, D. K., Pettini, M., Shapley, A. E., et al. 2010, ApJ, 719, 1168, doi: 10.1088/0004-637X/719/2/1168
- Erb et al. (2006a) Erb, D. K., Steidel, C. C., Shapley, A. E., et al. 2006a, ApJ, 647, 128, doi: 10.1086/505341
- Erb et al. (2006b) —. 2006b, ApJ, 646, 107, doi: 10.1086/504891
- Foreman-Mackey et al. (2013) Foreman-Mackey, D., Hogg, D. W., Lang, D., & Goodman, J. 2013, PASP, 125, 306, doi: 10.1086/670067
- Förster Schreiber et al. (2006) Förster Schreiber, N. M., Genzel, R., Lehnert, M. D., et al. 2006, ApJ, 645, 1062, doi: 10.1086/504403
- Fosbury et al. (2003) Fosbury, R. A. E., Villar-Martín, M., Humphrey, A., et al. 2003, ApJ, 596, 797, doi: 10.1086/378228
- Gallazzi et al. (2021) Gallazzi, A. R., Pasquali, A., Zibetti, S., & Barbera, F. L. 2021, MNRAS, 502, 4457, doi: 10.1093/mnras/stab265
- Gordon et al. (2003) Gordon, K. D., Clayton, G. C., Misselt, K. A., Landolt, A. U., & Wolff, M. J. 2003, ApJ, 594, 279, doi: 10.1086/376774
- Green et al. (2015) Green, G. M., Schlafly, E. F., Finkbeiner, D. P., et al. 2015, ApJ, 810, 25, doi: 10.1088/0004-637X/810/1/25
- Hainline et al. (2009) Hainline, K. N., Shapley, A. E., Kornei, K. A., et al. 2009, ApJ, 701, 52, doi: 10.1088/0004-637X/701/1/52
- Heckman et al. (2015) Heckman, T. M., Alexandroff, R. M., Borthakur, S., Overzier, R., & Leitherer, C. 2015, ApJ, 809, 147, doi: 10.1088/0004-637X/809/2/147
- Heckman et al. (2000) Heckman, T. M., Lehnert, M. D., Strickland , D. K., & Armus, L. 2000, ApJS, 129, 493, doi: 10.1086/313421
- Henry et al. (2013) Henry, A., Scarlata, C., Domínguez, A., et al. 2013, ApJ, 776, L27, doi: 10.1088/2041-8205/776/2/L27
- Hinkle et al. (2003) Hinkle, K. H., Wallace, L., & Livingston, W. 2003, in American Astronomical Society Meeting Abstracts, Vol. 203, American Astronomical Society Meeting Abstracts, 38.03
- James & Aloisi (2018) James, B., & Aloisi, A. 2018, ApJ, 853, 124, doi: 10.3847/1538-4357/aa9ffb
- James et al. (2018) James, B. L., Auger, M., Pettini, M., et al. 2018, MNRAS, 476, 1726, doi: 10.1093/mnras/sty315
- James et al. (2014) James, B. L., Pettini, M., Christensen, L., et al. 2014, MNRAS, 440, 1794, doi: 10.1093/mnras/stu287
- Jenkins (2009) Jenkins, E. B. 2009, ApJ, 700, 1299, doi: 10.1088/0004-637X/700/2/1299
- Jenkins & Wallerstein (2017) Jenkins, E. B., & Wallerstein, G. 2017, ApJ, 838, 85, doi: 10.3847/1538-4357/aa64d4
- Johnson et al. (2021) Johnson, B., Foreman-Mackey, D., Sick, J., et al. 2021, dfm/python-fsps: python-fsps v0.4.1rc1, v0.4.1rc1, Zenodo, doi: 10.5281/zenodo.4737461
- Johnson et al. (2021) Johnson, B. D., Leja, J., Conroy, C., & Speagle, J. S. 2021, ApJS, 254, 22, doi: 10.3847/1538-4365/abef67
- Johnson et al. (2017) Johnson, T. L., Rigby, J. R., Sharon, K., et al. 2017, ApJ, 843, L21, doi: 10.3847/2041-8213/aa7516
- Jones et al. (2010) Jones, T. A., Swinbank, A. M., Ellis, R. S., Richard, J., & Stark, D. P. 2010, MNRAS, 404, 1247, doi: 10.1111/j.1365-2966.2010.16378.x
- Kelson (2003) Kelson, D. D. 2003, PASP, 115, 688, doi: 10.1086/375502
- Kennicutt (1998) Kennicutt, Robert C., J. 1998, ARA&A, 36, 189, doi: 10.1146/annurev.astro.36.1.189
- Kennicutt & Evans (2012) Kennicutt, R. C., & Evans, N. J. 2012, ARA&A, 50, 531, doi: 10.1146/annurev-astro-081811-125610
- Krogager et al. (2020) Krogager, J.-K., Møller, P., Christensen, L. B., et al. 2020, MNRAS, 495, 3014, doi: 10.1093/mnras/staa1414
- Krogager et al. (2017) Krogager, J. K., Møller, P., Fynbo, J. P. U., & Noterdaeme, P. 2017, MNRAS, 469, 2959, doi: 10.1093/mnras/stx1011
- Law et al. (2007) Law, D. R., Steidel, C. C., Erb, D. K., et al. 2007, ApJ, 656, 1, doi: 10.1086/510357
- Leitherer et al. (2002) Leitherer, C., Calzetti, D., & Martins, L. P. 2002, ApJ, 574, 114, doi: 10.1086/340902
- Leitherer et al. (2011) Leitherer, C., Tremonti, C. A., Heckman, T. M., & Calzetti, D. 2011, AJ, 141, 37, doi: 10.1088/0004-6256/141/2/37
- Leitherer et al. (1999) Leitherer, C., Schaerer, D., Goldader, J. D., et al. 1999, ApJS, 123, 3, doi: 10.1086/313233
- Lemon et al. (2018) Lemon, C. A., Auger, M. W., McMahon, R. G., & Ostrovski, F. 2018, MNRAS, 479, 5060, doi: 10.1093/mnras/sty911
- López et al. (2016) López, S., D’Odorico, V., Ellison, S. L., et al. 2016, A&A, 594, A91, doi: 10.1051/0004-6361/201628161
- Madau & Dickinson (2014) Madau, P., & Dickinson, M. 2014, ARA&A, 52, 415, doi: 10.1146/annurev-astro-081811-125615
- Mannucci et al. (2009) Mannucci, F., Cresci, G., Maiolino, R., et al. 2009, MNRAS, 398, 1915, doi: 10.1111/j.1365-2966.2009.15185.x
- Marques-Chaves et al. (2020) Marques-Chaves, R., Pérez-Fournon, I., Shu, Y., et al. 2020, MNRAS, 492, 1257, doi: 10.1093/mnras/stz3500
- Martin (2005) Martin, C. L. 2005, ApJ, 621, 227, doi: 10.1086/427277
- McLure et al. (2018) McLure, R. J., Pentericci, L., Cimatti, A., et al. 2018, MNRAS, 479, 25, doi: 10.1093/mnras/sty1213
- Meynet et al. (1994) Meynet, G., Maeder, A., Schaller, G., Schaerer, D., & Charbonnel, C. 1994, A&AS, 103, 97
- Morrissey et al. (2018) Morrissey, P., Matuszewski, M., Martin, D. C., et al. 2018, ApJ, 864, 93, doi: 10.3847/1538-4357/aad597
- Nakajima et al. (2018) Nakajima, K., Schaerer, D., Le Fèvre, O., et al. 2018, A&A, 612, A94, doi: 10.1051/0004-6361/201731935
- Noterdaeme et al. (2014) Noterdaeme, P., Petitjean, P., Pâris, I., et al. 2014, A&A, 566, A24, doi: 10.1051/0004-6361/201322809
- Pannella et al. (2015) Pannella, M., Elbaz, D., Daddi, E., et al. 2015, ApJ, 807, 141, doi: 10.1088/0004-637X/807/2/141
- Pantoni et al. (2021) Pantoni, L., Lapi, A., Massardi, M., et al. 2021, MNRAS, doi: 10.1093/mnras/stab674
- Papovich et al. (2001) Papovich, C., Dickinson, M., & Ferguson, H. C. 2001, ApJ, 559, 620, doi: 10.1086/322412
- Pettini et al. (2002) Pettini, M., Rix, S. A., Steidel, C. C., et al. 2002, ApJ, 569, 742, doi: 10.1086/339355
- Pettini et al. (2001) Pettini, M., Shapley, A. E., Steidel, C. C., et al. 2001, ApJ, 554, 981, doi: 10.1086/321403
- Pettini et al. (2000) Pettini, M., Steidel, C. C., Adelberger, K. L., Dickinson, M., & Giavalisco, M. 2000, ApJ, 528, 96, doi: 10.1086/308176
- Pettini et al. (2010) Pettini, M., Christensen, L., D’Odorico, S., et al. 2010, MNRAS, 402, 2335, doi: 10.1111/j.1365-2966.2009.16090.x
- Pilo et al. (2019) Pilo, S., Castellano, M., Fontana, A., et al. 2019, A&A, 626, A45, doi: 10.1051/0004-6361/201834442
- Pontzen et al. (2008) Pontzen, A., Governato, F., Pettini, M., et al. 2008, MNRAS, 390, 1349, doi: 10.1111/j.1365-2966.2008.13782.x
- Quider et al. (2009) Quider, A. M., Pettini, M., Shapley, A. E., & Steidel, C. C. 2009, MNRAS, 398, 1263, doi: 10.1111/j.1365-2966.2009.15234.x
- Quider et al. (2010) Quider, A. M., Shapley, A. E., Pettini, M., Steidel, C. C., & Stark, D. P. 2010, MNRAS, 402, 1467, doi: 10.1111/j.1365-2966.2009.16005.x
- Reddy et al. (2003) Reddy, B. E., Tomkin, J., Lambert, D. L., & Allende Prieto, C. 2003, MNRAS, 340, 304, doi: 10.1046/j.1365-8711.2003.06305.x
- Reddy & Steidel (2009) Reddy, N. A., & Steidel, C. C. 2009, ApJ, 692, 778, doi: 10.1088/0004-637X/692/1/778
- Reddy et al. (2008) Reddy, N. A., Steidel, C. C., Pettini, M., et al. 2008, ApJS, 175, 48, doi: 10.1086/521105
- Reddy et al. (2018a) Reddy, N. A., Shapley, A. E., Sanders, R. L., et al. 2018a, ApJ, 869, 92, doi: 10.3847/1538-4357/aaed1e
- Reddy et al. (2018b) Reddy, N. A., Oesch, P. A., Bouwens, R. J., et al. 2018b, ApJ, 853, 56, doi: 10.3847/1538-4357/aaa3e7
- Richard et al. (2011) Richard, J., Jones, T., Ellis, R., et al. 2011, MNRAS, 413, 643, doi: 10.1111/j.1365-2966.2010.18161.x
- Rigby et al. (2017) Rigby, J. R., Johnson, T. L., Sharon, K., et al. 2017, ApJ, 843, 79, doi: 10.3847/1538-4357/aa775e
- Rigby et al. (2018a) Rigby, J. R., Bayliss, M. B., Sharon, K., et al. 2018a, AJ, 155, 104, doi: 10.3847/1538-3881/aaa2ff
- Rigby et al. (2018b) Rigby, J. R., Bayliss, M. B., Chisholm, J., et al. 2018b, ApJ, 853, 87, doi: 10.3847/1538-4357/aaa2fc
- Rivera-Thorsen et al. (2017) Rivera-Thorsen, T. E., Dahle, H., Gronke, M., et al. 2017, A&A, 608, L4, doi: 10.1051/0004-6361/201732173
- Rix et al. (2004) Rix, S. A., Pettini, M., Leitherer, C., et al. 2004, ApJ, 615, 98, doi: 10.1086/424031
- Rodighiero et al. (2011) Rodighiero, G., Daddi, E., Baronchelli, I., et al. 2011, ApJ, 739, L40, doi: 10.1088/2041-8205/739/2/L40
- Salim et al. (2007) Salim, S., Rich, R. M., Charlot, S., et al. 2007, ApJS, 173, 267, doi: 10.1086/519218
- Salpeter (1955) Salpeter, E. E. 1955, ApJ, 121, 161, doi: 10.1086/145971
- Sanders et al. (2020) Sanders, R. L., Shapley, A. E., Reddy, N. A., et al. 2020, MNRAS, 491, 1427, doi: 10.1093/mnras/stz3032
- Santini et al. (2017) Santini, P., Fontana, A., Castellano, M., et al. 2017, ApJ, 847, 76, doi: 10.3847/1538-4357/aa8874
- Savage & Sembach (1991) Savage, B. D., & Sembach, K. R. 1991, ApJ, 379, 245, doi: 10.1086/170498
- Scarlata & Panagia (2015) Scarlata, C., & Panagia, N. 2015, ApJ, 801, 43, doi: 10.1088/0004-637X/801/1/43
- Seitz et al. (1998) Seitz, S., Saglia, R. P., Bender, R., et al. 1998, MNRAS, 298, 945, doi: 10.1046/j.1365-8711.1998.01443.x
- Shapley (2011) Shapley, A. E. 2011, ARA&A, 49, 525, doi: 10.1146/annurev-astro-081710-102542
- Shapley et al. (2003) Shapley, A. E., Steidel, C. C., Pettini, M., & Adelberger, K. L. 2003, ApJ, 588, 65, doi: 10.1086/373922
- Sheinis et al. (2000) Sheinis, A. I., Miller, J. S., Bolte, M., & Sutin, B. M. 2000, in Society of Photo-Optical Instrumentation Engineers (SPIE) Conference Series, Vol. 4008, Proc. SPIE, ed. M. Iye & A. F. Moorwood, 522–533, doi: 10.1117/12.395511
- Smit et al. (2017) Smit, R., Swinbank, A. M., Massey, R., et al. 2017, MNRAS, 467, 3306, doi: 10.1093/mnras/stx245
- Sommariva et al. (2012) Sommariva, V., Mannucci, F., Cresci, G., et al. 2012, A&A, 539, A136, doi: 10.1051/0004-6361/201118134
- Stark et al. (2013) Stark, D. P., Auger, M., Belokurov, V., et al. 2013, MNRAS, 436, 1040, doi: 10.1093/mnras/stt1624
- Stark et al. (2014) Stark, D. P., Richard, J., Siana, B., et al. 2014, MNRAS, 445, 3200, doi: 10.1093/mnras/stu1618
- Steidel et al. (1999) Steidel, C. C., Adelberger, K. L., Giavalisco, M., Dickinson, M., & Pettini, M. 1999, ApJ, 519, 1, doi: 10.1086/307363
- Steidel et al. (2010) Steidel, C. C., Erb, D. K., Shapley, A. E., et al. 2010, ApJ, 717, 289, doi: 10.1088/0004-637X/717/1/289
- Steidel et al. (1996) Steidel, C. C., Giavalisco, M., Pettini, M., Dickinson, M., & Adelberger, K. L. 1996, ApJ, 462, L17, doi: 10.1086/310029
- Steidel et al. (2016) Steidel, C. C., Strom, A. L., Pettini, M., et al. 2016, ApJ, 826, 159, doi: 10.3847/0004-637X/826/2/159
- Steidel et al. (2014) Steidel, C. C., Rudie, G. C., Strom, A. L., et al. 2014, ApJ, 795, 165, doi: 10.1088/0004-637X/795/2/165
- Strom et al. (2018) Strom, A. L., Steidel, C. C., Rudie, G. C., Trainor, R. F., & Pettini, M. 2018, ApJ, 868, 117, doi: 10.3847/1538-4357/aae1a5
- Strom et al. (2017) Strom, A. L., Steidel, C. C., Rudie, G. C., et al. 2017, ApJ, 836, 164, doi: 10.3847/1538-4357/836/2/164
- STScI Development Team (2013) STScI Development Team. 2013, pysynphot: Synthetic photometry software package. http://ascl.net/1303.023
- Swinbank et al. (2009) Swinbank, A. M., Webb, T. M., Richard, J., et al. 2009, MNRAS, 400, 1121, doi: 10.1111/j.1365-2966.2009.15617.x
- Talia et al. (2012) Talia, M., Mignoli, M., Cimatti, A., et al. 2012, A&A, 539, A61, doi: 10.1051/0004-6361/201117683
- Taniguchi et al. (2007) Taniguchi, Y., Scoville, N., Murayama, T., et al. 2007, ApJS, 172, 9, doi: 10.1086/516596
- Theios et al. (2019) Theios, R. L., Steidel, C. C., Strom, A. L., et al. 2019, ApJ, 871, 128, doi: 10.3847/1538-4357/aaf386
- van der Wel et al. (2013) van der Wel, A., van de Ven, G., Maseda, M., et al. 2013, ApJ, 777, L17, doi: 10.1088/2041-8205/777/1/L17
- Vegetti & Koopmans (2009) Vegetti, S., & Koopmans, L. V. E. 2009, MNRAS, 392, 945, doi: 10.1111/j.1365-2966.2008.14005.x
- Veilleux et al. (2005) Veilleux, S., Cecil, G., & Bland-Hawthorn, J. 2005, ARA&A, 43, 769, doi: 10.1146/annurev.astro.43.072103.150610
- Veilleux et al. (2020) Veilleux, S., Maiolino, R., Bolatto, A. D., & Aalto, S. 2020, A&A Rev., 28, 2, doi: 10.1007/s00159-019-0121-9
- Vladilo et al. (2001) Vladilo, G., Centurión, M., Bonifacio, P., & Howk, J. C. 2001, ApJ, 557, 1007, doi: 10.1086/321650
- Wilkins et al. (2012) Wilkins, S. M., Gonzalez-Perez, V., Lacey, C. G., & Baugh, C. M. 2012, MNRAS, 427, 1490, doi: 10.1111/j.1365-2966.2012.22092.x
- Wright et al. (2010) Wright, E. L., Eisenhardt, P. R. M., Mainzer, A. K., et al. 2010, AJ, 140, 1868, doi: 10.1088/0004-6256/140/6/1868
- Zhu et al. (2015) Zhu, G. B., Comparat, J., Kneib, J.-P., et al. 2015, ApJ, 815, 48, doi: 10.1088/0004-637X/815/1/48