Optical coherence between atomic species at the second scale: improved clock comparisons via differential spectroscopy
I Abstract
Comparisons of high-accuracy optical atomic clocks Ludlow et al. (2015) are essential for precision tests of fundamental physics Safronova et al. (2018), relativistic geodesy McGrew et al. (2018); Grotti et al. (2018); Delva et al. (2019), and the anticipated redefinition of the SI second Riehle et al. (2018). The scientific reach of these applications is restricted by the statistical precision of interspecies comparison measurements. The instability of individual clocks is limited by the finite coherence time of the optical local oscillator (OLO), which bounds the maximum atomic interrogation time. In this letter, we experimentally demonstrate differential spectroscopy Hume and Leibrandt (2016), a comparison protocol that enables interrogating beyond the OLO coherence time. By phase-coherently linking a zero-dead-time (ZDT) Schioppo et al. (2017) Yb optical lattice clock with an Al+ single-ion clock via an optical frequency comb and performing synchronised Ramsey spectroscopy, we show an improvement in comparison instability relative to our previous result Network et al. (2020) of nearly an order of magnitude. To our knowledge, this result represents the most stable interspecies clock comparison to date.
II Main
Atomic clocks based on optical transitions in single trapped ions or ensembles of neutral atoms in optical lattices have achieved remarkable fractional systematic uncertainties at the level or below Brewer et al. (2019); McGrew et al. (2018); Bothwell et al. (2019); Huang et al. (2021); Huntemann et al. (2016), establishing them as the most accurate measurement devices of any kind. Beyond their application in timekeeping, this unrivalled accuracy makes optical atomic clocks ideal sensors for a variety of scientific and technological applications. For example, the most stringent constraints on models of ultralight dark matter Network et al. (2020); Lange et al. (2021) are set by frequency ratio measurements of clocks based on different atomic species, with correspondingly different sensitivities to proposed physics beyond the Standard Model Derevianko (2016). In addition to high accuracy, these constraints and other sensing applications are enhanced by high interspecies clock comparison bandwidth and stability.
The fractional frequency instability of a clock based on Ramsey spectroscopy of uncorrelated atoms is fundamentally limited by quantum projection noise (QPN) at
| (1) |
where is the excited-state decay rate of the clock transition, is the unperturbed atomic transition frequency, is the averaging time, and is the Ramsey free-evolution (interrogation) time. The QPN limit is particularly restrictive for single-ion clocks (), as opposed to lattice clocks which routinely operate with atoms. However, singly and multiply ionised Kozlov et al. (2018) atoms and molecules Chou et al. (2020) offer a wider variety of transitions suitable for clock operation, some of which are highly sensitive to proposed effects beyond Standard Model including dark matter couplings Banerjee et al. (2020) and fundamental symmetry violations Lange et al. (2021). Instability due to QPN can be reduced by extending the interrogation time, but for Ramsey spectroscopy OLO noise restricts to less than the coherence time of the laser Leroux et al. (2017). For large , the evolved relative phase between the atoms and the laser can wander outside the range [], beyond which phase measurements become ambiguous, and it is no longer possible to lock the frequency of the OLO to the atomic transition.
This limit to the stability of independent clocks has motivated the development of several novel clock comparison techniques in which the two clocks use phase-synchronised OLOs to enable interrogation durations beyond the laser coherence time. As was first proposed and demonstrated by Bize et al. (2000) in fountain clocks, by synchronising the interrogations of the two clocks and using the same OLO, it is possible to suppress common-mode OLO noise, though the total interrogation time remains limited by OLO decoherence Takamoto et al. (2015); Schioppo et al. (2017). Using a protocol called correlation spectroscopy Chwalla et al. (2007), it is possible to interrogate beyond the OLO coherence limit for differential measurements, as was demonstrated in a recent lifetime-limited comparison of two Al+ clocks Clements et al. (2020). Correlation spectroscopy is effective only for clocks similar in frequency, but other protocols are usable for more general comparisons. Such protocols can be realised by using one or multiple systems to prestabilise the OLO Borregaard and Sørensen (2013); Schioppo et al. (2017), by making non-destructive measurements to realise a phase lock Kohlhaas et al. (2015); Bowden et al. (2020), or by employing dynamical decoupling Dörscher et al. (2020). Hume and Leibrandt (2016) proposed one such protocol called differential spectroscopy, in which phase measurements from one clock are fed forward to a second clock and used to disambiguate the phase measurements of the second clock, which is operated beyond the laser coherence limit.
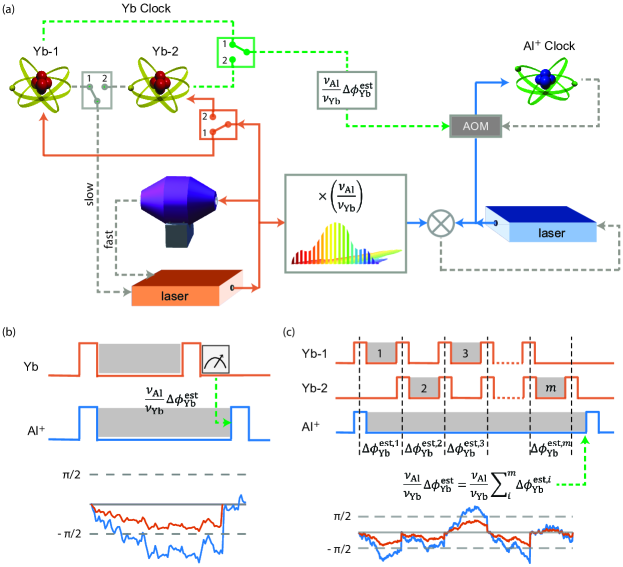
In this work, we demonstrate a comparison between an ytterbium (171Yb) optical lattice clock and a single-ion aluminium (27Al+) quantum-logic clock using differential spectroscopy. Figure 1a shows the experimental setup. The 267 nm Al+ OLO is phase locked to the 578 nm Yb OLO using an Er/Yb-doped glass femtosecond optical frequency comb. Maintaining phase coherence between the two systems via the frequency comb and active fibre noise cancellation at each experiment is critical for differential spectroscopy to be effective. The two clocks initiate Ramsey interrogation with synchronised pulses of 10 ms duration as shown in Fig. 1b. The evolved phase of the Al+ clock during the Ramsey free-evolution time is given by , where is the frequency ratio and is the evolved phase of the Yb clock. The measured Yb phase is used to estimate , which is fed forward to correct the Al+ OLO phase before its final Ramsey /2 pulse. Because , the Yb OLO coherence time is a factor of longer than that of the Al+ coherence time. Assuming that Yb has enough atoms to measure the phase with high signal-to-noise ratio and that the OLO instability is characterised by flicker frequency noise, the Al+ interrogation time may be extended by up to a factor of longer than is possible without feedforward corrections from the Yb clock.
We extend the original differential spectroscopy proposal by operating the Yb clock in ZDT mode Schioppo et al. (2017), in which two independent atomic ensembles are interrogated using Ramsey spectroscopy in an interleaved fashion. Multiple interrogations with times are completed on the Yb clock, with phase feedforward corrections applied to the Al+ clock after each one, during a single Al+ interrogation, as shown in Fig. 1c. Further details about the experimental setup and protocol can be found in the Methods. Using ZDT differential spectroscopy, the Al+ clock interrogation time may be extended yet further, potentially approaching the 20.6 s Al+ excited state lifetime.
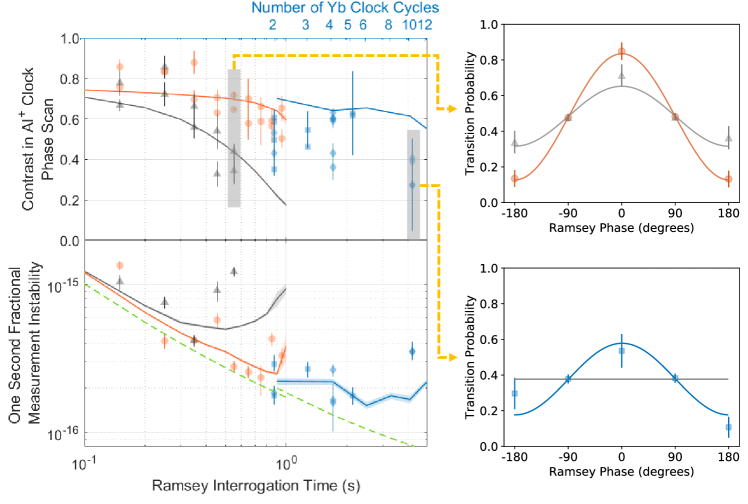
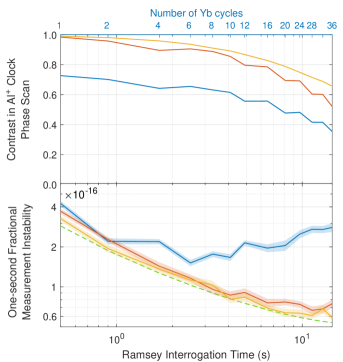
The results of both single Yb ensemble and ZDT experiments are shown in Fig. 2. The single Yb ensemble experiments are carried out for various values of . We use ms to allow time for the Yb clock to perform the second -pulse, population measurement, and phase feedforward. The ZDT experiments have a fixed s, which was chosen for safely interrogating the Yb ensembles without a fringe hop, and the number of the Yb clock interrogations is incremented. Also shown for comparison are the results of conventional Ramsey spectroscopy without phase feedforward. Each inset on the right of Fig. 2 shows the Ramsey phase scans of the Al+ clock at a specific value, one with feedforward corrections from the Yb clock (orange and blue curves) and one without (grey curve), which are fit to determine the contrast. The power spectral density of the measured frequency ratio noise is fit to determine the long-averaging-time asymptotic Allan deviation (see Methods), which is shown in the bottom left panel of Fig. 2. The improvement in the atom-laser phase coherence with corrections is shown by the increase in Ramsey contrast in both plots. As increases, the interrogation time comes to exceed the coherence limit of the Al+ OLO, and the Ramsey fringe without phase feedforward drops to zero contrast indicating that phase feedforward is required to run the Al+ clock at these interrogation times.
The results of numerical simulations - which model comparisons between the two clocks with realistic noise generated to match the laboratory conditions - are also plotted for the single Yb ensemble and ZDT cases and shown as solid lines in Fig. 2. With increasing , we expect the instability to improve, as can be seen by the QPN limit (green curve) plotted in the lower plot in Fig. 2, reaching a minimal value of at an interrogation time corresponding to the lifetime of the Al+ clock’s excited state. Instead, contrast in the Ramsey phase scan starts to diminish with the increase in , and the one-second instability reaches a minimum value approximately a factor of 3 above the fundamental limit of the Al+ clock lifetime. Further simulation results indicate (see Methods) that technical noise sources in the system, such as the fibre links and local fluctuations in the magnetic field, compromise instability as increases. The reasonable level of agreement between simulation results and empirical data suggests that, with further suppression of such sources of technical noise, it will be possible to obtain a comparison instability that approaches the lifetime limit of the Al+ clock.
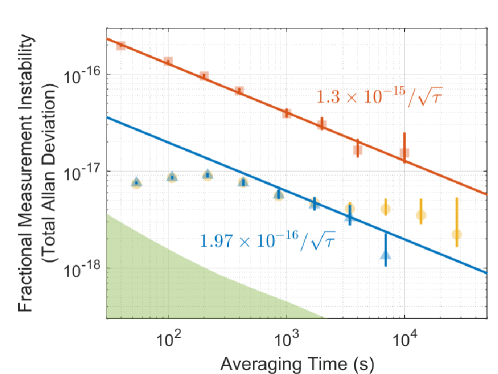
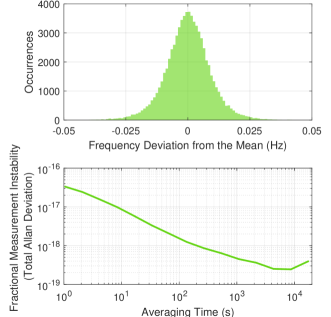
Figure 3 (yellow circles) shows the Allan deviation of a 36-hour-long continuous ZDT differential spectroscopy comparison, with a duty cycle of 68 and a total uptime of 88.8, using four Yb interrogations ( s) for each Al+ interrogation ( s). A drifting systematic frequency shift leads to an apparent flicker noise floor at averaging times greater than 30,000 s for differential spectroscopy. The source of this long-term noise has not yet been identified. For these measurements, we note that neither clock was operated in a configuration with a low systematic uncertainty (see Methods). However, an eight hour subset (blue triangles) shows that the data average as white frequency noise over this time scale, approaching the level. Furthermore, We anticipate that the apparent noise floor can be suppressed in future work by operating the clocks in low-uncertainty mode. The asymptotic instability of ZDT differential spectroscopy is (blue line), which is improved by nearly an order of magnitude over our previous result of using conventional techniques Network et al. (2020) (red line).
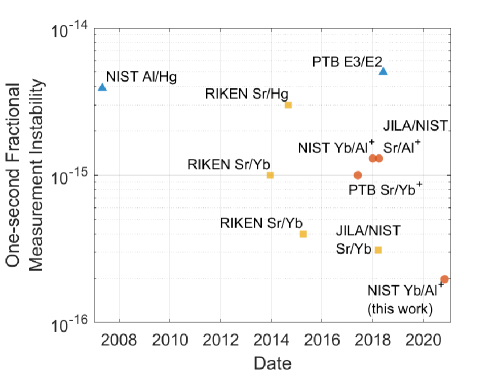
For context, we plot the asymptotic instability of various interspecies comparisons in Fig. 4 versus the date on which the comparison was performed. Due to the large number of atoms participating in each interrogation, optical lattice clocks generally have lower instability, and the most stable lattice-lattice comparisons (yellow squares) perform with lower instability than the most stable lattice-ion (orange circles) and ion-ion (blue triangles) comparisons. Nevertheless, due to our ability to push the duration of the Ramsey interrogation of the ion clock beyond the laser coherence time, our asymptotic instability is lower than even the best previous interspecies lattice-lattice clock comparisons.
Differential spectroscopy improves the instability of clock comparison measurements by using a low-QPN clock to measure laser phase noise and perform feedforward corrections to a second clock’s laser. This allows the second clock to operate with a longer interrogation time, beyond the coherence time of its laser, when the frequency ratio between the two clocks is greater than unity. Furthermore, by running the first clock in ZDT mode, the duration of interrogation of the second clock can be extended yet further, potentially approaching the excited-state lifetime limit. Though we demonstrate the technique for an interspecies comparison with a large frequency ratio, we note that ZDT differential spectroscopy can be utilised to improve other clock comparisons, even if the two clocks have the same transition frequency. This scheme can be understood as fusing the two clocks into a single, compound optical clock, capable of realising an instability that could be below that of either system taken independently. Lastly, the differential spectroscopy algorithm is also applicable for a second clock based on multiple entangled atoms or ions, which would allow clock comparison measurements at the Heisenberg instability limit.
We thank Roger C. Brown and Chin-wen Chou for their careful reading and feedback on this manuscript. We also acknowledge contributions from Philip Rich, in carrying out a characterisation of the magnetic field noise of the Yb system. This work was supported by the National Institute of Standards and Technology, the Defense Advanced Research Projects Agency (Atomic-Photonic Integration Program), the National Science Foundation Q-SEnSE Quantum Leap Challenge Institute (Grant Number 2016244), and the Office of Naval Research (Grant Numbers N00014-18-1-2634 and N00014-20-1-2431). M.E.K. was supported by an appointment to the Intelligence Community Postdoctoral Research Fellowship Program at NIST administered by ORISE through an interagency agreement between the DOE and ODNI. H.L. was supported by the Department of Defense (DoD) through the National Defense Science & Engineering Graduate (NDSEG) Fellowship Program. The views, opinions, and/or findings expressed are those of the authors and should not be interpreted as representing the official views or policies of the Department of Defense or the U.S. Government.
All authors contributed to the design of the experiment, collection of data, and revision of the manuscript. During the measurements, Al+ clock operation was conducted by E.R.C., D.B.H., M.E.K., D.R.L., and J.V.; Yb clock operation was conducted by W.F.M., Y.S.H., X.Z., and A.D.L.; comb metrology laboratory operation was conducted by T.M.F., H.L., and N.V.N. Data analysis and preparation of the manuscript were performed by M.E.K., D.R.L., W.F.M., and N.V.N.
III Methods
III.1 Experimental setup
The two ytterbium optical lattice systems make use of one-dimensional optical lattices, operated near the magic wavelength, to confine the atoms in the Lamb-Dicke regime and perform spectroscopy of the ultranarrow clock transition, . An amplified external cavity diode laser (ECDL) at 1156 nm is frequency doubled to reach the 578 nm clock transition. Both systems operate with approximately 10,000 atoms. The systems have been described in detail in McGrew et al. (2018). A previous analysis of the instability for a zero-dead-time clock found that a one-second instability well below was accessible for these systems Schioppo et al. (2017).
The Al+ optical atomic clock used in this experiment has been described previously in Clements et al. (2020). Spectroscopy is performed on the clock transition of a single Al+ ion. Sympathetic cooling and readout are achieved by co-trapping a single 40Ca+ ion and using the motional coupling between the two ions Schmidt et al. (2005). A fibre laser at 1068 nm is frequency doubled twice to deliver 267 nm light to the aluminium ion. The AOM in the path of this light is utilised for the feedback corrections from the aluminium ion and another for the feedforward operation in differential spectroscopy, which is discussed at length in Sec. III.2.
Phase-coherent transfer from the Yb clock OLO at 1156 nm to the Al+ clock OLO at 1068 nm is enabled by an optical frequency comb (OFC) shown in Fig. 5. We use a self-referenced OFC based on an Er/Yb-doped glass gain medium that is pumped with 980 nm light and emits at 1550 nm, situated in a free-space cavity with 500 MHz free-spectral range. A semiconductor saturable absorption mirror (SESAM), which preferentially passes high-intensity light and absorbs low-intensity light, acts to mode-lock the laser and provides stable pulse formation. The mode-locked laser is laid out as a folded linear cavity with an asymmetry such that the beam is focused in the gain crystal as well as onto the SESAM end mirror. This ensures that the intra-cavity intensity is sufficient to minimize SESAM losses at the saturation and to maximize nonlinear self-phase modulation in the gain medium. The very low loss of the cavity (around 2 %) yields a very narrow intrinsic free-running laser linewidth of less than 5 kHz. This is imperative for the low-noise phase transfer between clocks.
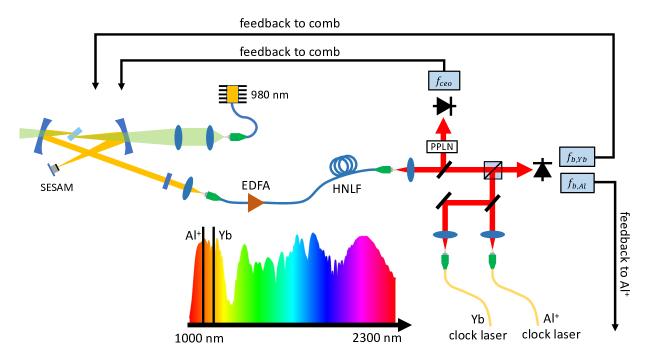
Pulses output from the laser cavity are amplified by an Er-doped fibre amplifier from about 70 mW to 300 mW and subsequently sent through a highly-nonlinear fibre (HNLF) for access to the carrier-envelope offset frequency, which requires spectral power on the two ends of an octave. We use a hybrid nonlinear fibre, comprising two stages: the first section (10 cm with dispersion 5.6 ps/(km nm)) creates a dispersive wave around 1000 nm, and the second section (50 cm with dispersion 2 ps/(km nm)) extends the spectrum to around 2100 nm. Careful dispersion management before the HNLF and tuning of the input optical pulse power allows us to put enough spectral power at 1068 nm and 1156 nm for detection of optical beats with the Al+ and Yb OLOs, respectively. A periodically-poled Lithium Niobate (PPLN) waveguide doubles light at 2070 nm and the resultant 1035 nm light is beat against the 1035 nm part of the spectrum for detection of the carrier-envelope offset frequency. The single-branch OFC design Leopardi et al. (2017) ensures that no out-of-loop fibre paths add instability to the comb.
The OFC is locked to the Yb clock OLO by comparing the beat between the OLO and comb light to a 10 MHz H-maser reference and feeding back to the mode-locked laser cavity length via a fast piezo-electric transducer. The actuator is glued between the SESAM, which is very light, and a heavy lead-filled copper mount designed specifically to suppress resonances below several hundred kHz Briles et al. (2010). This affords comb noise suppression with a bandwidth of almost 200 kHz. A beatnote between a comb mode and light from the Al+ clock OLO is fed back to the Al+ clock lab to lock the OLO to the comb. To minimize instability due to out-of-loop optical free-space paths, the light from both OLOs was combined on a dichroic mirror, then interfered with the comb light on a single beam splitter and detected on a single photodiode. In this setup, there is only 20 cm of uncompensated optical free-space paths.
The Al+ clock OLO is stabilised to a high-finesse optical cavity with high-bandwidth (around 300 kHz) feedback. When running differential spectroscopy, we use the phase of the beatnote between the comb mode and the Al+ clock OLO as the error signal for low-bandwidth (around 100 Hz) feedback to lock the cavity-stabilised OLO to the comb.
III.2 Differential spectroscopy feedforward corrections
For differential spectroscopy, the 10-ms-duration of the first Ramsey /2-pulse are synchronised in the clocks at the several s level. The synchronisation is achieved by triggering the Ramsey pulse sequence on the Al+ clock with a TTL signal sent from the Yb clock experimental control system.
The second Ramsey /2-pulse is applied on the Yb clock before the Al+ clock to allow time for the Yb clock to measure the phase wander of the shared OLO and feed it forward to the Al+ clock. The total interrogation time of the atoms, , is set to be a fraction of the coherence time of the OLO at the Yb transition frequency. To optimise in Eq. 1, the duration of the interrogation is maximised while ensuring that the relative phase between the OLO and the atoms, given by Hume and Leibrandt (2016)
| (2) |
does not exceed the range (the so called invertible region) for Ramsey spectroscopy, where is the Yb atomic transition frequency, is the time-dependent Yb OLO frequency, and is the mean frequency of the Yb OLO during the clock interrogation.
After the second Ramsey /2-pulse on the Yb clock, the ground state and excited state atom numbers are read out by destructive fluorescence detection using the strong transition at 399 nm. The frequency of the Yb clock is locked to the centre of the resonance, but it is dithered between the half-maximum points on either side of the resonance centre, leading to an 50% chance of excitation. Following this, the excitation ratio is determined, and the estimated optical phase of the OLO is calculated as
| (3) |
where and are the empirically determined half-maximum ratio and contrast of the Ramsey fringe, respectively. The Yb OLO is frequency-locked to the Yb atoms using the estimated deviation of the laser frequency as the error signal.
The Al+ OLO, which is phase-locked to the Yb OLO, interrogates the Al+ ion for a duration for a single Yb ensemble experiment and for a ZDT experiment - where is the time required for the Yb clock to make a measurement of its atom-laser phase and send the feedforward signal to the Al+ clock, and is a positive integer. The final /2-pulse of the Yb clock, atom detection, phase calculation, and phase correction are accomplished in several tens of milliseconds, but we choose to extend the free-evolution-time of the Al+ clock by ms to ensure that the phase correction has been applied before the second /2-pulse of the Al+ clock. For ZDT mode, phase corrections are sent after each Yb clock interrogation. The second /2-pulse of the Al+ clock is supplied 50 ms after the second /2-pulse of the final ZDT cycle of the Yb clock.
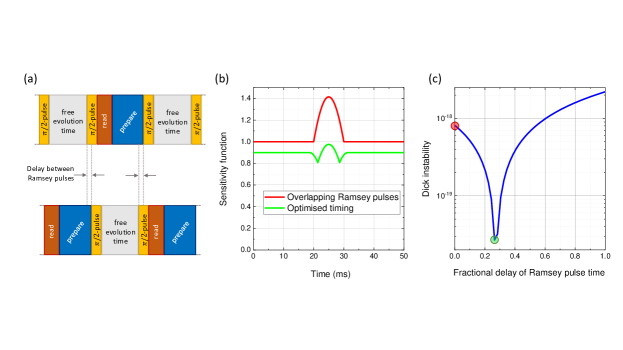
In Ref. Schioppo et al. (2017), we utilised a ZDT sequence in which the /2 pulses of the two systems overlapped with each other. Here, we use a slightly modified sequence: by adding a delay between the second -pulse of one of the systems and the first -pulse of the other, it is possible to further decrease the time-dependence of the ZDT clock’s sensitivity function, and thus decrease the Dick effect as well Dick et al. (1990). Fig. 6(a) displays the sensitivity functions of a ZDT clock with simultaneous -pulses and a ZDT clock with a delay of 27.73% of the -pulse time. Fig. 6(b) displays the calculated Dick effect as a function of delay time between the -pulses. In this work, we elect to operate our ZDT system with a delay of 2.773 ms, at which the calculated Dick effect is minimised.
The Yb clock feeds forward the accumulated atom-laser phase after the termination of each of its interrogations weighted by the ratio of the two clock frequencies, . The phase correction is sent via a serial connection to a 10 MHz direct digital synthesizer (DDS) in the Yb lab which can be programmed with a 14-bit phase tuning word, implying a 0.4 mrad phase resolution for the corrections. The 10 MHz DDS serves as the external reference for a 160 MHz synthesizer in the Al+ lab driving an AOM that frequency and phase shifts the Al+ OLO just before it is delivered to the ion. Due to the difference of transition frequency between the clocks, the phase estimate must be multiplied by the frequency ratio such that . Because the phase correction signal is multiplied by (160 MHz)/(10 MHz) = 16, the phase correction sent to the DDS must be further reduced by a factor of 16, .
Feeding forward the accumulated atom-laser phase after every Yb interrogation is equivalent to feeding forward the estimated total atom-laser phase accumulated during the Al+ clock interrogation time, . For the Al+ clock, the relative phase between the OLO and atoms is given by
| (4) |
where the second term is the feedforward correction from the Yb clock, is the Al+ atomic transition frequency, and is the mean frequency of the Al+ OLO during the clock interrogation. For traditional operation of the Al+ clock, the atom-laser phase is given simply by the first term, and must be restricted such that . However, for differential spectroscopy, the factor allows the interrogation time to be increased by the same factor; and in the case of ZDT differential spectroscopy, the constraint on is lifted such that excursions of the atom-laser phase far beyond the invertible region can be tolerated. This leads to a reduction in instability by , as can be seen from Eq. 1.
After the second Ramsey /2-pulse on the Al+ clock, the state of the Al+ ion is read out using quantum-logic spectroscopy and the atom-laser phase estimate is computed. The Al+ clock OLO is frequency-locked to the Al+ ion by shifting the drive frequency of the same AOM used for feedforward phase corrections, , using the frequency estimate as the error signal, with a feedback update rate of . The measured frequency ratio of the two clocks is thus
| (5) |
where is a known constant set by the mode numbers and frequencies of the comb beat notes and the frequencies of the other AOMs that shift the OLOs of both clocks between the comb and the atomic ensembles.
The raw frequency shift data from the two clocks are collected separately on each of the control computers. The Meinberg Network Time Protocol (NTP) programs loaded on the computers enable the aluminium clock control computer’s onboard clock to synchronise to that of the ytterbium computer, such that the timestamps on the clock data collected on the two computers agree to within a few milliseconds. This enables us to look for noise that is correlated in both systems.
III.3 Sources of noise in differential spectroscopy
III.3.1 Noise of the OLO
Because the Al+ clock laser is phase locked to the OLO of the Yb clock, the noise characteristics of the Yb clock OLO determine the durations of both clock interrogations. We measure its noise characteristics by measuring the performance of its optical cavity reference, and also by referencing the atoms. The former determines the spectrum of relatively high frequency noise, whereas the latter allows low frequency noise to be determined. Combining the results from these two spectra, we find that the Yb clock OLO has a flicker noise limited fractional frequency noise of approximately from 0.6 s to 1000 s. Below 0.6 s, the spectrum is approximately white frequency noise, and above 1000 s, the spectrum is approximately random walk/run. The performance of the OLO supports s; but for ZDT mode differential spectroscopy, we use a conservative value of s.
III.3.2 Magnetic field noise
Along with the phase noise fluctuations of the OLO, any environmental factors that can vary and induce uncertainty of the atomic transitions must be evaluated. One important source of differential instability is uncorrelated fluctuations of the magnetic field sampled by the clocks. Each clock accounts for the magnetic field fluctuations in its local environment by alternately probing the atoms on opposite Zeeman transitions: the Yb atoms are interrogated on the or transitions and the Al+ ion is interrogated on the or transitions. The latter is a departure from the traditional way of operating the Al+ clock using the stretch states ( or ) which minimises the sensitivity to magnetic field noise and extends the atomic dephasing time beyond the interrogation durations used in this work. The measured frequency difference between the opposite Zeeman transitions is used to determine the strength of the magnetic field for each system and is then fed back to the programmed difference between the interrogation frequencies used for opposite lines.
In the Yb clock, the atomic signal is used to servo the OLO laser frequency between the Zeeman sublevels. Due to the relatively long 1/e servo time constant of 44 s, we use a fluxgate magnetometer to measure the magnetic field fluctuations at shorter times. With the combination of these two data sets, we determine that the rms value of the noise in the Yb clock is G.
In the Al+ clock, the magnetic field is actively stabilised by feeding forward fluxgate magnetometer measurements to the three orthogonal pairs of Helmholtz coils that surround the science chamber. The measurement details are discussed in Clements et al. (2020). The rms value of the magnetic field noise in the Al+ clock is G.
III.3.3 Fibre link noise
One source of noise that is important in differential spectroscopy is the frequency transfer uncertainty arising from imperfect phase-noise-cancellation (PNC) of the clock light distribution among the participating laboratories. The determination of the atom-laser phase in the Yb clock is critical to the success of differential spectroscopy. However, if the frequency transfer system introduces dephasing by some , then the estimated atom-laser phase will no longer be a good estimate of .
To mitigate this noise source, we use a path-length stabilisation technique Ma et al. (1994) for each fibre link between the Yb clock to the Al+ clock. At the receiving end of each fibre, a flat facet reflects a portion of the laser power back through a bidirectional acousto-optic modulator (AOM) to the sending end. The beatnote between the reference arm and the returned light is stabilised by feeding back to the drive rf of the AOM.
Additive uncertainty in the optical network is determined with a loopback measurement. Light from the Yb clock and the Al+ clock OLOs is sent over phase-stabilised links to the Er/Yb:glass frequency comb, which locks the Al+ clock OLO to the Yb clock OLO. Both OLOs also send light over stabilised fibre links to an independent Ti:Sapphire Fortier et al. (2006) frequency comb to measure the instability shown in Figure 7. We measure a total network instability of at 1 second, which is approximately twice the instability experienced by the path from the Yb clock to the Al+ clock. The optical frequency combs add negligible instability around at 1 second, limited by uncompensated free-space optical paths Leopardi et al. (2017).
III.3.4 Other sources of noise
The Yb clock systems were operated in a similar mode to that described in McGrew et al. (2018), with two main alterations. Firstly, a relatively high Rabi frequency of ms) was used, facilitating differential spectroscopy, but impacting the level of systematic effects from probe Stark shift, line pulling, and AOM phase chirp. Second, some windows for the blackbody radiation shield of Yb-2 (described in Beloy et al. (2014)) were not in place; we estimate that this could potentially result in drifts in the blackbody radiation shift at the level. With these alterations, the systematic uncertainty reported in McGrew et al. (2018) was not valid for these runs, and further investigation would be required to ensure long-term stability at that level. Our ZDT algorithm allows us to measure the fractional frequency difference between the two atomic systems during a run, and we note that no drift was observed at the level between Yb-1 and Yb-2 during the run reported in Fig. 3. In any case, these sources of systematic uncertainty can be reduced. Fundamentally, differential spectroscopy scheme should be compatible with uncertainty budgets at the level or below.
The systematic uncertainties of the Al+ clock have not been fully evaluated, but it has been built to mitigate the leading cause of uncertainty in trapped-ion clocks, which is Doppler shift due to excess micromotion Brewer et al. (2019), among other improvements over the previous generation Al+ clock. One of the possible sources of uncertainty in this clock is the first-order Doppler shift due to slow drift of the ion position. This can be caused by, for example, charging of dielectric surfaces near the ion by photoelectrons generated by scattered laser light. The first order Doppler shift was suppressed in the previous Al+ clock by operating with two counterpropagating clock beams: one of which interrogated the ion while the other was detuned by 100 kHz. The beam on resonance and the detuned beam were alternated every cycle. In this work, only one interrogation direction was used, and thus there may be an uncompensated first-order Doppler shift. Another potential source of noise that has not yet been evaluated is a phase chirp of the AOM being used to supply the feedforward corrections to the Al+ clock.
III.4 Clock comparison instability limit
ZDT differential spectroscopy has the potential to extend the interrogation time of the second clock (Al+ in this work) to the fundamental limit set by the excited clock state lifetime of the atoms (20.6 s for the Al+ clock), providing a corresponding improvement in instability. This is due to the fact that the first clock’s interrogation time is always within the coherence time of the laser, and the atom-laser phase is continuously measured and fed forward to the second clock. As the second clock’s interrogation time increases, the number of ZDT interrogation cycles of the first clock for each interrogation of the second clock also increases. However, the results of our experiment in which we scan the number of Yb clock cycles do not show an improvement in instability after s (see Fig. 2). Here, we present numerical simulations of the comparisons in which we vary three different sources of noise - the OLO noise, the magnetic field noise, and the fibre link noise - revealing that they all contribute to the comparison instability.
For the numerical simulations, OLO noise, magnetic field noise, and fibre link noise are numerically generated to match the experimentally measured noise spectra. White, flicker, and random walk noise models are used to generate the OLO noise with a fractional frequency noise floor of . The white noise is below 0.6 s and random walk and random run are beyond 1000 s. The Yb and Al+ clocks are subject to the same OLO noise with the Al+ clock seeing noise amplitude increased by a factor of . The simulations treat the two Yb clocks separately such that they experience different magnetic field noise. The magnetic field noise is mostly flicker, and the rms value of the Yb clock is G (with a linear Zeeman shift of 199.516 Hz/G), and the rms value of the Al+ clock is G (with a linear Zeeman shift of about 280 Hz/G). Besides the magnetic field noise and the OLO noise, the Al+ clock is subject to the fibre link noise, which imprints additional noise on the estimated atom-laser phase. The fibre link noise is mostly flicker in nature with both phase and frequency components and adds maximum instability of at 1 second.
Both clocks probe the points of maximum slope on the central Ramsey fringe for highest sensitivity, on each side of the opposite Zeeman lines, such that a total of four interrogations is required for full knowledge of the magnetic field and OLO phase. In addition to these four interrogation frequencies, for every tenth interrogation of the Al+ clock we interrogate a randomly choosen extrema (the maximum or one of the two minima on either side) of the central Ramsey fringe. This allows us to determine the Ramsey contrast in real time to evaluate how well the feedforward is working.
In simulations, we generate atom-laser phase estimates made by the Yb clock in the presence of noise after each interrogation. In the ZDT case, the Yb clocks make measurements of the phase, and the total phase is fed forward to the Al+ clock. The Al+ clock, subject to its own set of noise sources, makes an estimate of the atom-laser phase, ideally within the invertible region with the assistance of the feedforward signal. The simulation results are compared to the experimental data, as can be seen in Fig. 2.
In order to explore the impact of the different noise sources on the clock comparison instability, we study three cases: when only the OLO noise is present, when the OLO noise is present along with the magnetic field noise, and when these two sources are present as well as the noise from the fibre link. Figure 8 shows the contrast in the Al+ clock’s phase scan (top plot) and the fractional frequency instability (bottom plot) in the clock comparison for each of these three cases. The simulations incorporate the noise profiles of the OLO, fibre link, and the magnetic field in each system. The one second fractional measurement instability is extracted from each clock simulation run under various noise conditions. The statistical error associated with running 25 simulations for each Ramsey interrogation time is reflected in the shaded area. However, the error associated with extracting the one second instability is not reflected in Fig. 8. This is responsible for the fact that the simulations curve falls below the QPN limit in Fig. 2, which is not possible.
When the only source of noise present in the system is from the OLO, the instability continues to improve as is increased out to several seconds, following the QPN limit. This indicates that without additional sources of noise, it would be possible to continue improving the clock comparison instability beyond 10 s. In our case, the limit on the Ramsey interrogation time - and hence the lowest achievable instability - is the excited state lifetime of the Al+ clock transition, which is 20.6 s. If the lifetime of the excited state were infinite for the ion clock, the instability would be limited by the QPN limit of the Yb clock. This would be reached when the number of clock cycles on Yb clock is such that the phase noise accumulated reaches one radian, such that it is no longer contained in the invertible region of the phase space. A fringe hop would then be unavoidable, leading to higher instability. Due to the large number of atoms in the Yb clock, many number of Yb clock cycles will be necessary to lead to a fringe hop if no other noise source were an issue.
When the magnetic field noise is present along with the OLO noise, the contrast in the Al+ clock is somewhat reduced, and the instability increases slightly. The magnetic field is servoed in the Al+ clock system and its RMS noise level is about G, and the least magnetically sensitive transitions are used for the Ramsey interrogation. This allows the magnetic field noise to be suppressed in the clock comparison, even at Ramsey interrogation time above 10 s. A larger source of noise in the clock comparison arises from the fibre link between the various systems. when the fibre link noise is also present along with the OLO noise and the magnetic field noise, the clock comparison instability does not improve beyond in fractional frequency, which is reached for at about 2 s to 4 s.
It is possible to improve the various sources of noise in our system to reach the quantum projection noise limit (Fig. 8), which continues to improve beyond s. Research is already underway to build a cryogenic optical cavity as a reference for the OLO to reduce its noise; and the Al+ clock could be magnetically shielded to passively reduce the impact of the magnetic field noise from the environment. Improving the fibre link noise will allow the Ramsey interrogation time to increase, allowing us to achieve a lower instability.
III.5 Instability data analysis
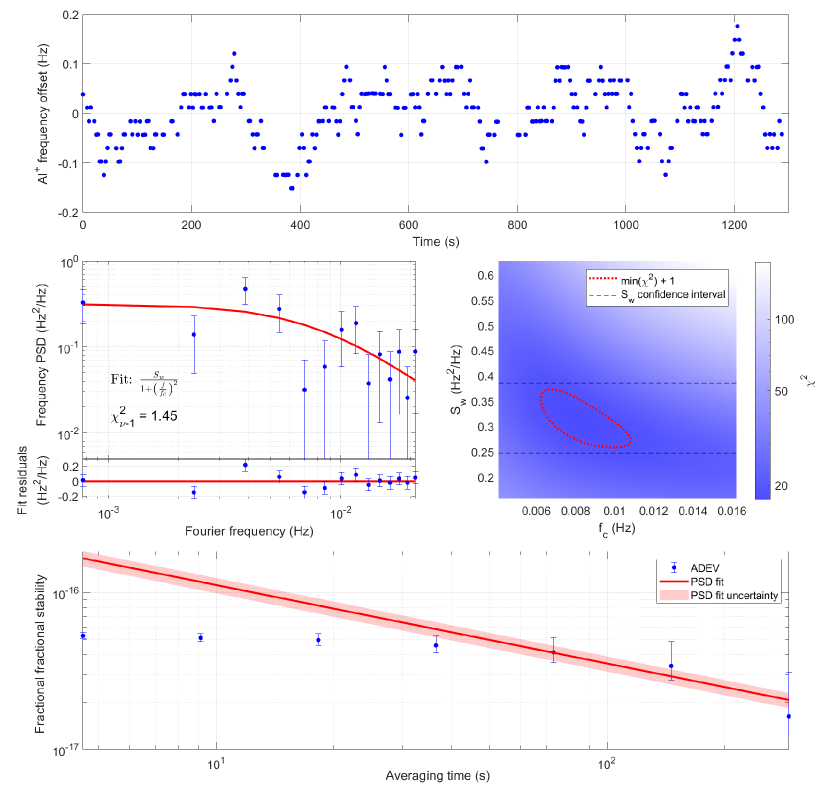
For each data set, the instability at long averaging times is determined by fitting the power spectral density of the measured frequency noise, an example of which is shown in the middle left panel of Fig. 9. The fit function,
| (6) |
corresponds to white frequency noise of magnitude that has been low-pass filtered with a corner frequency of . This is physically motivated because the OLO is stabilised to the quantum-projection-noise limited Yb clock and the Al+ clock’s frequency measurement is also quantum-projection-noise limited, resulting in a white frequency noise spectrum. However, the frequency measurement bandwidth is limited by the frequency lock of the Al+ clock to the OLO. Because the Al+ frequency lock uses a single frequency integrator, the expected measurement frequency noise PSD is low-passed white noise. The white frequency noise fit parameter is converted into the long-averaging-time asymptotic Allan deviation using .
Notably, the two fit parameters and are correlated, as shown by the non-circular contour of in the middle right panel of Fig. 9. The reduced of the fit in this example . The upper and lower uncertainties of the fit parameter are determined as
| (7) |
and
| (8) |
For long data sets, this data analysis procedure gives results that are consistent with direct fits of the Allan deviation at long averaging times, which are typically reported. However, for short data sets, it is often difficult to determine what range of averaging times should be included in such a fit, and the fit results depend strongly on this subjective choice. Furthermore, the Allan deviation values at different averaging times are correlated with each other, making it difficult to determine the uncertainty of direct fits of the Allan deviation. The procedure described here avoids these problems.
References
- Ludlow et al. (2015) A. D. Ludlow, M. M. Boyd, J. Ye, E. Peik, and P. O. Schmidt, Reviews of Modern Physics 87, 637 (2015).
- Safronova et al. (2018) M. S. Safronova, D. Budker, D. Demille, D. F. Kimball, A. Derevianko, and C. W. Clark, Reviews of Modern Physics 90, 025008 (2018), ISSN 15390756, eprint 1710.01833, URL https://doi.org/10.1103/RevModPhys.90.025008.
- McGrew et al. (2018) W. F. McGrew, X. Zhang, R. J. Fasano, S. A. Schäffer, K. Beloy, D. Nicolodi, R. C. Brown, N. Hinkley, G. Milani, M. Schioppo, et al., Nature 564, 87 (2018), ISSN 14764687, URL http://dx.doi.org/10.1038/s41586-018-0738-2.
- Grotti et al. (2018) J. Grotti, S. Koller, S. Vogt, S. Häfner, U. Sterr, C. Lisdat, H. Denker, C. Voigt, L. Timmen, A. Rolland, et al., Nature Physics 14, 437 (2018), ISSN 17452481, eprint 1705.04089, URL http://dx.doi.org/10.1038/s41567-017-0042-3.
- Delva et al. (2019) P. Delva, H. Denker, and G. Lion, in Relativistic Geodesy: Foundations and Applications, edited by D. Puetzfeld and C. Lammerzahl (Springer, Cham, Switzerland, 2019), pp. 25–86, ISBN 9783030114992, URL http://link.springer.com/10.1007/978-3-030-11500-5.
- Riehle et al. (2018) F. Riehle, P. Gill, F. Arias, and L. Robertsson, Metrologia 55, 188 (2018), ISSN 16817575.
- Hume and Leibrandt (2016) D. B. Hume and D. R. Leibrandt, Physical Review A 93, 032135 (2016), ISSN 24699934, eprint 1508.05129.
- Schioppo et al. (2017) M. Schioppo, R. C. Brown, W. F. McGrew, N. Hinkley, R. J. Fasano, K. Beloy, T. H. Yoon, G. Milani, D. Nicolodi, J. A. Sherman, et al., Nature Photonics 11, 48 (2017), ISSN 17494893, eprint 1607.06867.
- Network et al. (2020) B. A. C. O. Network, K. Beloy, M. I. Bodine, T. Bothwell, S. M. Brewer, S. L. Bromley, J.-S. Chen, J.-D. Deschênes, S. A. Diddams, R. J. Fasano, et al., arXiv preprint arXiv:2005.14694 (2020).
- Brewer et al. (2019) S. M. Brewer, J. S. Chen, A. M. Hankin, E. R. Clements, C. W. Chou, D. J. Wineland, D. B. Hume, and D. R. Leibrandt, Physical Review Letters 123, 033201 (2019), ISSN 10797114, URL https://doi.org/10.1103/PhysRevLett.123.033201.
- Bothwell et al. (2019) T. Bothwell, D. Kedar, E. Oelker, J. M. Robinson, S. L. Bromley, W. L. Tew, J. Ye, and C. J. Kennedy, Metrologia 56, 065004 (2019).
- Huang et al. (2021) Y. Huang, B. Zhang, M. Zeng, Y. Hao, H. Zhang, H. Guan, Z. Chen, M. Wang, and K. Gao (2021).
- Huntemann et al. (2016) N. Huntemann, C. Sanner, B. Lipphardt, C. Tamm, and E. Peik, Phys. Rev. Lett. 116, 063001 (2016).
- Lange et al. (2021) R. Lange, N. Huntemann, J. M. Rahm, C. Sanner, H. Shao, B. Lipphardt, C. Tamm, S. Weyers, and E. Peik, Physical Review Letters 126, 011102 (2021), ISSN 10797114, eprint 2010.06620, URL https://doi.org/10.1103/PhysRevLett.126.011102.
- Derevianko (2016) A. Derevianko, J. Phys.: Conf. Ser. 723, 012043 (2016).
- Kozlov et al. (2018) M. G. Kozlov, M. S. Safronova, J. R. Crespo López-Urrutia, and P. O. Schmidt, Rev. Mod. Phys 90, 045005 (2018).
- Chou et al. (2020) C. W. Chou, A. L. Collopy, C. Kurz, Y. Lin, M. E. Harding, P. N. Plessow, T. Fortier, S. Diddams, D. Leibfried, and D. R. Leibrandt, Science 367, 1458 (2020).
- Banerjee et al. (2020) A. Banerjee, H. Kim, O. Matsedonskyi, G. Perez, and M. S. Safronova, J. High Energy Phys. 2020, 153 (2020).
- Leroux et al. (2017) I. D. Leroux, N. Scharnhorst, S. Hannig, J. Kramer, L. Pelzer, M. Stepanova, and P. O. Schmidt, Metrologia 54, 307 (2017).
- Bize et al. (2000) S. Bize, Y. Sortais, P. Lemonde, S. Zhang, P. Laurent, G. Santarelli, C. Salomon, and A. Clairon, IEEE transactions on ultrasonics, ferroelectrics, and frequency control 47, 1253 (2000).
- Takamoto et al. (2015) M. Takamoto, I. Ushijima, M. Das, N. Nemitz, T. Ohkubo, K. Yamanaka, N. Ohmae, T. Takano, T. Akatsuka, A. Yamaguchi, et al., Comptes Rendus Physique 16, 489 (2015), ISSN 16310705, URL http://dx.doi.org/10.1016/j.crhy.2015.04.003.
- Chwalla et al. (2007) M. Chwalla, K. Kim, T. Monz, P. Schindler, M. Riebe, C. F. Roos, and R. Blatt, App. Phys. B 89, 483 (2007).
- Clements et al. (2020) E. R. Clements, M. E. Kim, K. Cui, A. M. Hankin, S. M. Brewer, J. Valencia, J.-S. Chen, C.-W. Chou, D. R. Leibrandt, and D. B. Hume, Physical Review Letters 125, 243602 (2020), ISSN 00319007.
- Borregaard and Sørensen (2013) J. Borregaard and A. S. Sørensen, Physical Review Letters 111, 090802 (2013), ISSN 00319007.
- Kohlhaas et al. (2015) R. Kohlhaas, A. Bertoldi, E. Cantin, A. Aspect, A. Landragin, and P. Bouyer, Physical Review X 5, 021011 (2015), ISSN 21603308, eprint 1501.03709.
- Bowden et al. (2020) W. Bowden, A. Vianello, I. R. Hill, M. Schioppo, and R. Hobson, Physical Review X 10, 041052 (2020), ISSN 21603308, eprint 2010.10419, URL https://doi.org/10.1103/PhysRevX.10.041052.
- Dörscher et al. (2020) S. Dörscher, A. Al-Masoudi, M. Bober, R. Schwarz, R. Hobson, U. Sterr, and C. Lisdat, Communications Physics 3, 185 (2020), ISSN 23993650, URL http://dx.doi.org/10.1038/s42005-020-00452-9.
- Rosenband et al. (2008) T. Rosenband, D. B. Hume, P. O. Schmidt, C. W. Chou, A. Brusch, L. Lorini, W. H. Oskay, R. E. Drullinger, T. M. Fortier, J. E. Stalnaker, et al., Science 319, 1808 (2008).
- Nemitz et al. (2016) N. Nemitz, T. Ohkubo, M. Takamoto, I. Ushijima, M. Das, N. Ohmae, and H. Katori, Nature Photonics 10, 258 (2016), ISSN 17494893.
- Dörscher et al. (2021) S. Dörscher, N. Huntemann, R. Schwarz, R. Lange, E. Benkler, B. Lipphardt, U. Sterr, E. Peik, and C. Lisdat, Metrologia 58, 015005 (2021), ISSN 16817575.
- (31) N. Huntemann, personal communication.
- Schmidt et al. (2005) P. O. Schmidt, R. Rosenband, C. Langer, W. M. Itano, J. C. Bergquist, and D. J. Wineland, Science 309, 749 (2005).
- Leopardi et al. (2017) H. Leopardi, J. Davila-Rodriguez, F. Quinlan, J. Olson, J. A. Sherman, S. A. Diddams, and T. M. Fortier, Optica 4, 879 (2017), URL http://www.osapublishing.org/optica/abstract.cfm?URI=optica-4-8-879.
- Briles et al. (2010) T. C. Briles, D. C. Yost, A. Cingöz, J. Ye, and T. R. Schibli, Opt. Express 18, 9739 (2010), URL http://www.opticsexpress.org/abstract.cfm?URI=oe-18-10-9739.
- Dick et al. (1990) G. J. Dick, J. D. Prestage, C. A. Greenhall, and L. Maleki, in Proceedings of the 22nd Annual Precise Time and Time Interval Systems and Applications Meeting (1990), pp. 487–508.
- Ma et al. (1994) L.-S. Ma, P. Jungner, J. Ye, and J. L. Hall, Opt. Lett. 19, 1777 (1994), URL http://ol.osa.org/abstract.cfm?URI=ol-19-21-1777.
- Fortier et al. (2006) T. M. Fortier, A. Bartels, and S. A. Diddams, Opt. Lett. 31, 1011 (2006), URL http://ol.osa.org/abstract.cfm?URI=ol-31-7-1011.
- Beloy et al. (2014) K. Beloy, N. Hinkley, N. B. Phillips, J. A. Sherman, M. Schioppo, J. Lehman, A. Feldman, L. M. Hanssen, C. W. Oates, and A. D. Ludlow, Physical Review Letters 113, 260801 (2014), ISSN 10797114.