Primary Tumor and Inter-Organ Augmentations for Supervised Lymph Node Colon Adenocarcinoma Metastasis Detection
Supplementary material
This document supports the main paper by providing the full set of results from the experiments and information around their implementation.
1 Colon, breast and skin datasets
The colon adenocarcinoma dataset, used for the conducted experiments consists of hematoxylin and eosin (H&E) whole slide images (WSIs), from which contain tumor annotations. The data come from two medical centers in Sweden (Linköping and Gävle) and correspond to anonymized individual cases. The dataset contains primary tumor samples as well as lymph node tumor and non-tumor tissue. The WSIs were sampled using a random uniform grid with microns between the sample points. This corresponds to pixels when sampling at a resolution of microns (i.e., approximately times magnification). We set the patch size to 256256, meaning that the patches were sampled side-by-side without overlapping. In total, patches from non-tumor, primary tumor, and lymph node tumor tissue were extracted. Each patch was assigned the label based on the annotation of the center pixel in the patch. Number of patches per tissue label and medical center can be found in Table 2.
The breast dataset consists of H&E WSIs of sentinel lymph node tissue, out of which contain tumor annotations. These are coming from five different medical centers in The Netherlands, where each center contributes WSIs. The dataset corresponds to individual cases, and it was sampled following the same strategy as in the colon dataset resulting in extracted patches.
The skin dataset used for the described experiments consists of H&E WSIs, where of them contain tumor annotations identified as basal cell carcinoma, squamous cell carcinoma, and squamous cell carcinoma in situ. These data correspond to individual cases. The non-tumor patches were extracted in the same way as the colon and breast data, while for the tumor patches the sampling was performed using a random uniform grid with microns between the sample points. This corresponds to pixels when sampling at a resolution of microns. The patch size is also set to , which means that the patches were sampled side-by-side with a overlap (64 pixels). In total, they were extracted tumor and non-tumor patches.
We performed a train/val/test split for all datasets. The train/test split was conducted on a number-of-patients basis keeping a similar ratio of , , and patients for colon, breast, and skin respectively. The train/val split was done over the training sets on a ratio. For reference, we provide in Table 1 the datasets sizes.
| TRAIN | TEST | |||
|---|---|---|---|---|
| Tumor | Non-tumor | Tumor | Non-tumor | |
| Colon | 101,909 | 132,612 | 17,565 | 16,968 |
| Breast | 62,805 | 110,011 | 12,935 | 15,019 |
| Skin | 28,285 | 211,582 | 5,622 | 31,704 |
2 Sub-division of the colon dataset in groups
To explore scenarios with limited training data and to cross-validate the results of our experiments, we created four sub-sets out of the colon cancer dataset, based on a patient-level split. Each group consists of eight patients, that each one of them contributes to one or more tissue types and classes (primary tumor tissue, lymph node tumor/non-tumor). The split size was decided to give an extreme minimum of few thousand images per group, compared to the images per class of the colon dataset.
The primary tumor tissue is represented less frequently in the colon dataset. Therefore, and for the low-cost annotation scenario to be satisfied for all groups with an adequate amount of data, the main criterion for the patients split was for each group to have approximately the same amount of primary tumor patch images. We also made sure that each group and baseline experiment included the same number of patients from the two different medical centers (Gävle and Linköping), as well as that patients with a high number of images did not over-dominate the experiment.
tumor / non-tumor Linköping / Gävle GROUP tumor non-tumor lymph primary pre-bal. post-bal. pre-bal. post-bal. pre-bal. post-bal. pre-bal. post-bal. HIGH 0 19,077 / 24,772 19,077 / 19,080 20 / 19,057 – 20,466 / 4,306 14,774 / 4,306 1 10,585 / 45,303 10,585 / 10,585 2,851 / 7,734 – 34,991 / 10,312 4,234 / 6,351 2 22,941 / 28,005 22,941 / 22,913 1,722 / 21,219 – 17,797 / 10,208 12,916 / 9,997 3 26,342 / 34,532 26,342 / 26,346 10,171 / 16,171 – 21,063 / 13,469 16,632 / 9,714 MEDIUM 0 16,313 / 10,346 7,184 / 7,184 20 / 11,504 20 / 2,375 0 / 4,789 20,466 / 4,306 3,045 / 4,139 1 11,173 / 38,230 8,771 / 8,772 2,851 / 2,475 1,462 / 1,462 878 / 4,969 34,991 / 10,312 4,386 / 4,386 2 9,525 / 19,778 8,512 / 8,503 1,559 / 2,292 1,419 / 1,419 537 / 5,137 17,797 / 10,208 3,723 / 4,789 3 26,511 / 25,735 9,982 / 9,982 10,129 / 9,728 1,664 / 1,664 4,578 / 2,076 21,063 / 13,469 4,991 / 4,991 LOW 0 4,789 / 24,772 4,789 / 4,789 – 0 / 4,789 20,466 / 4,306 650 / 4,139 1 5,847 / 45,303 5,847 / 5,848 – 878 / 4,969 34,991 / 10,312 2,924 / 2,924 2 5,674 / 28,005 5,674 / 5,668 – 537 / 5,137 17,797 / 10,208 2,837 / 2,837 3 6,654 / 34,532 6,654 / 6,654 – 4,578 / 2,076 21,063 / 13,469 3,327 / 3,327 TRAIN 101,909 / 132,612 101,909 / 101,909 14,764 / 64,181 5,993 / 16,971 94,317 / 38,295 63,614/38,295 TEST 17,565 / 16,968 13,167 / 16,968 980 / 12,187 0 / 4,398 0 / 0 6,410 / 10,558
In the high-cost annotation case, each group utilizes all the available lymph node tumor tissue (coming from at least six patients per group), along with the same amount of non-tumor lymph node tissue. The latter do not necessarily come from the same patients that provide the lymph node tumor samples. Medium cost case leverages all the per group available primary tumor patches (coming from at least four patients) along with lymph node tumor tissue equal to half of the size of primary tumor samples (coming from only two patients). In this case, the two patients that provide the lymph tumor samples, also supply the non-tumor lymph node class. Finally, for the low-cost scenario, only the primary tumor is used (with no representation of the target tumor domain), while the non-tumor lymph node class is formed by two patients per group. For all three annotation cost experiments, the non-tumor balancing to the size of the tumor class was conducted as random patches selection from either all or the specified patients.
Table 2 presents the colon dataset split per group and annotation cost baseline experiment. The number of patches is given in the total per case tumor/non-tumor ratio, as well as in a medical site and per tissue type detailed view pre- and post- class balancing.
3 Results
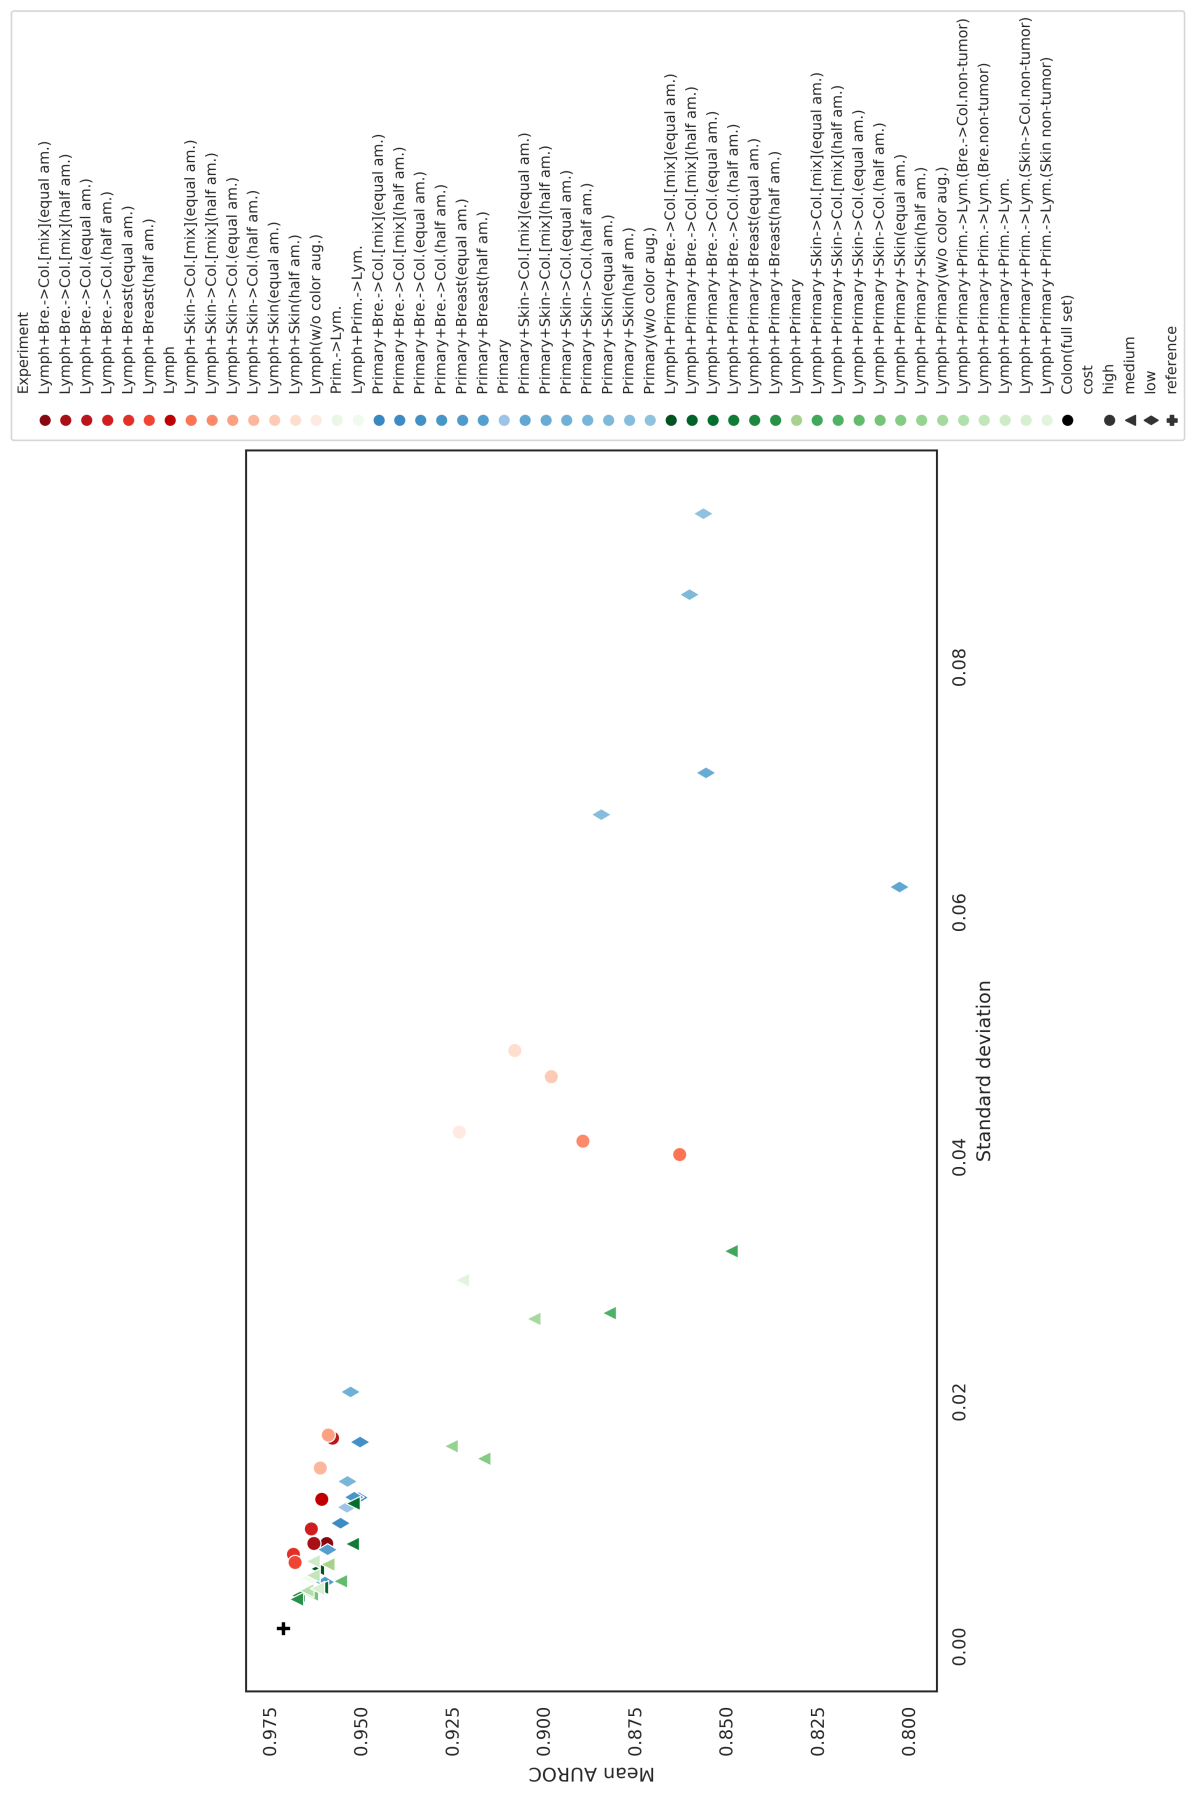
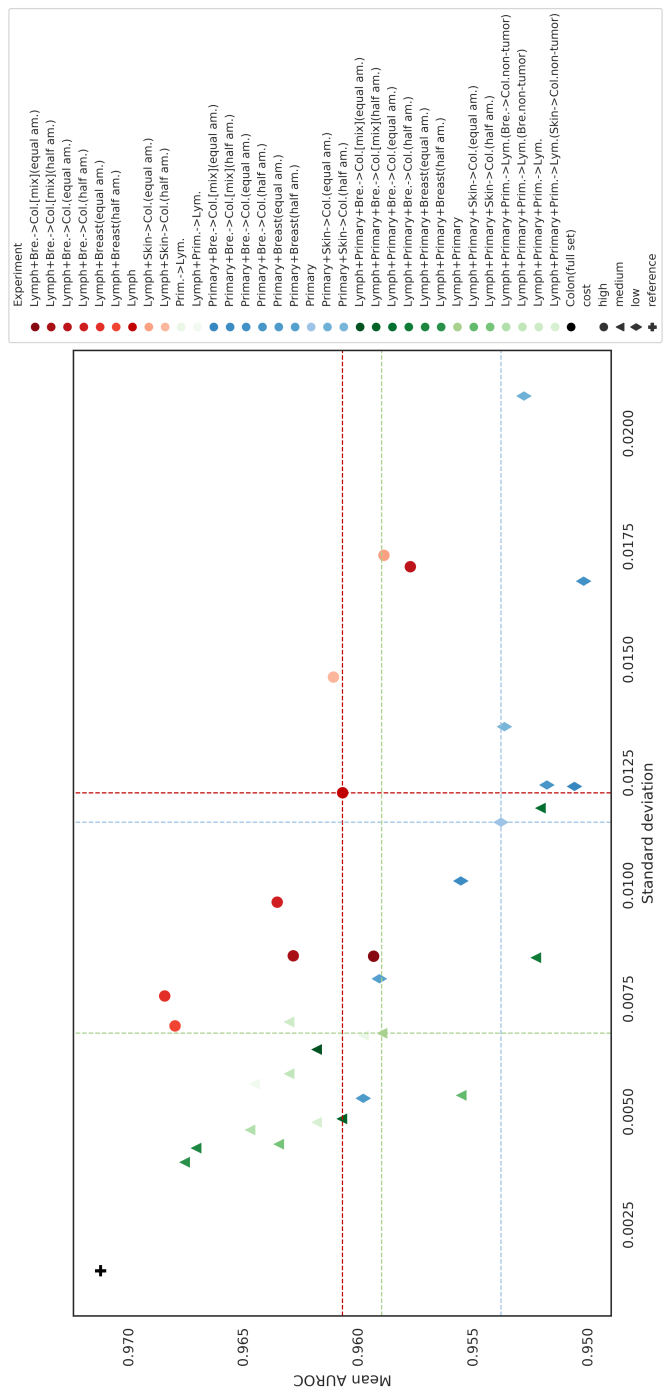
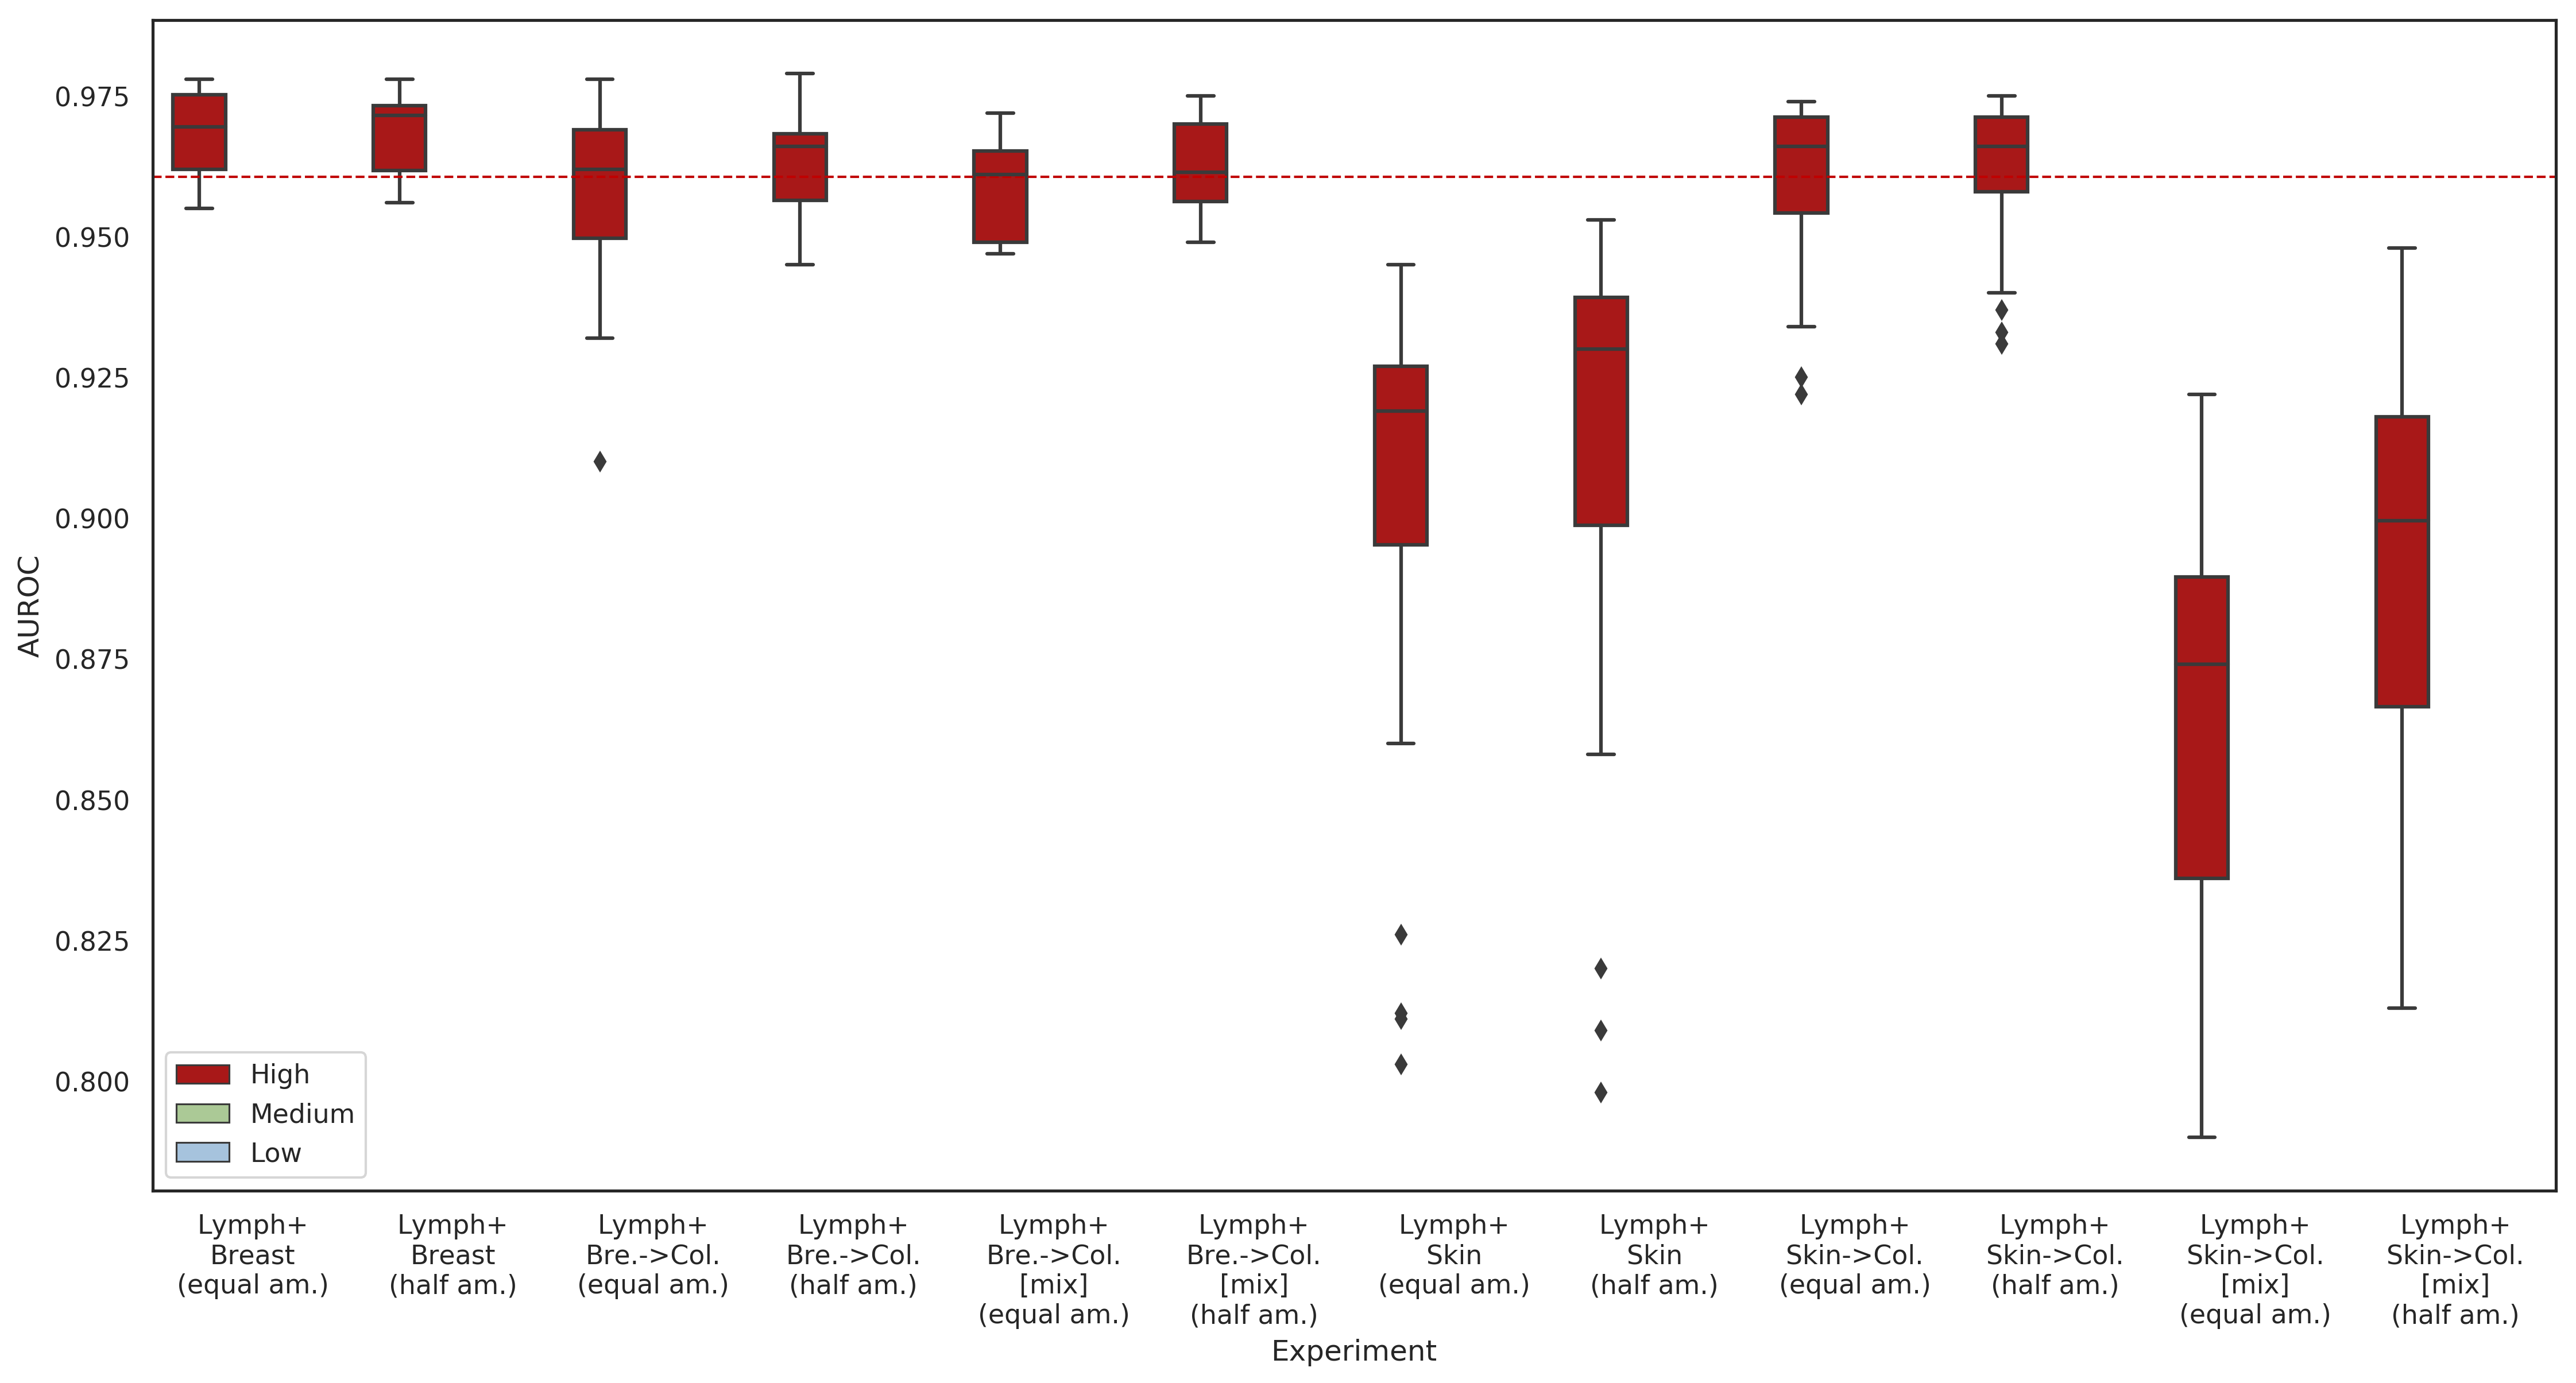
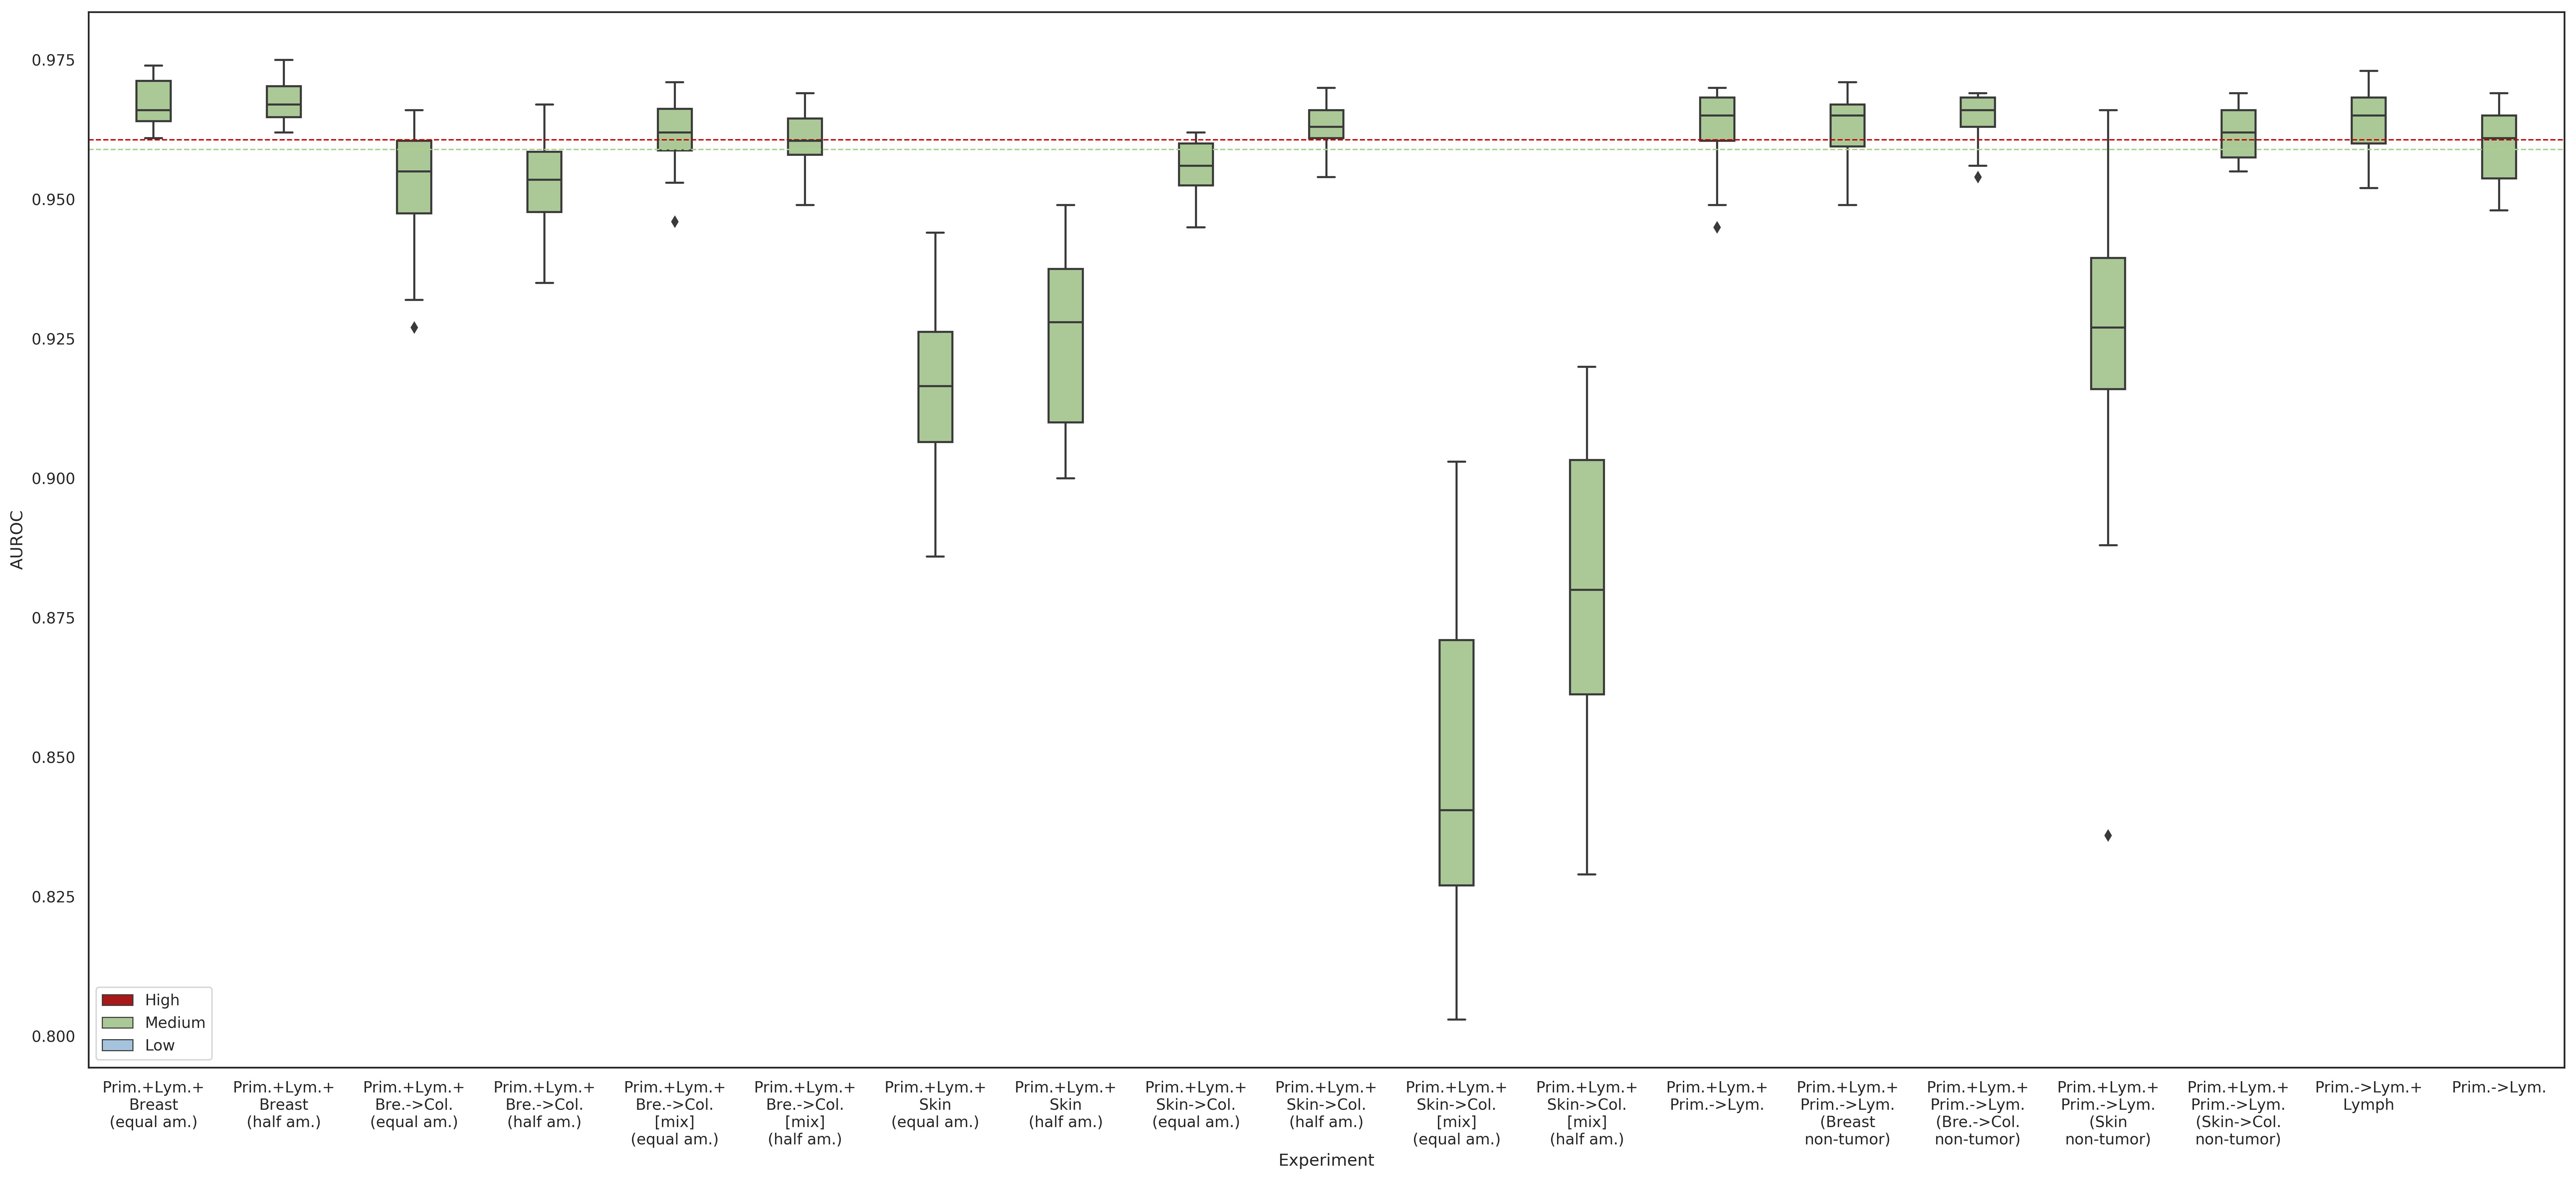
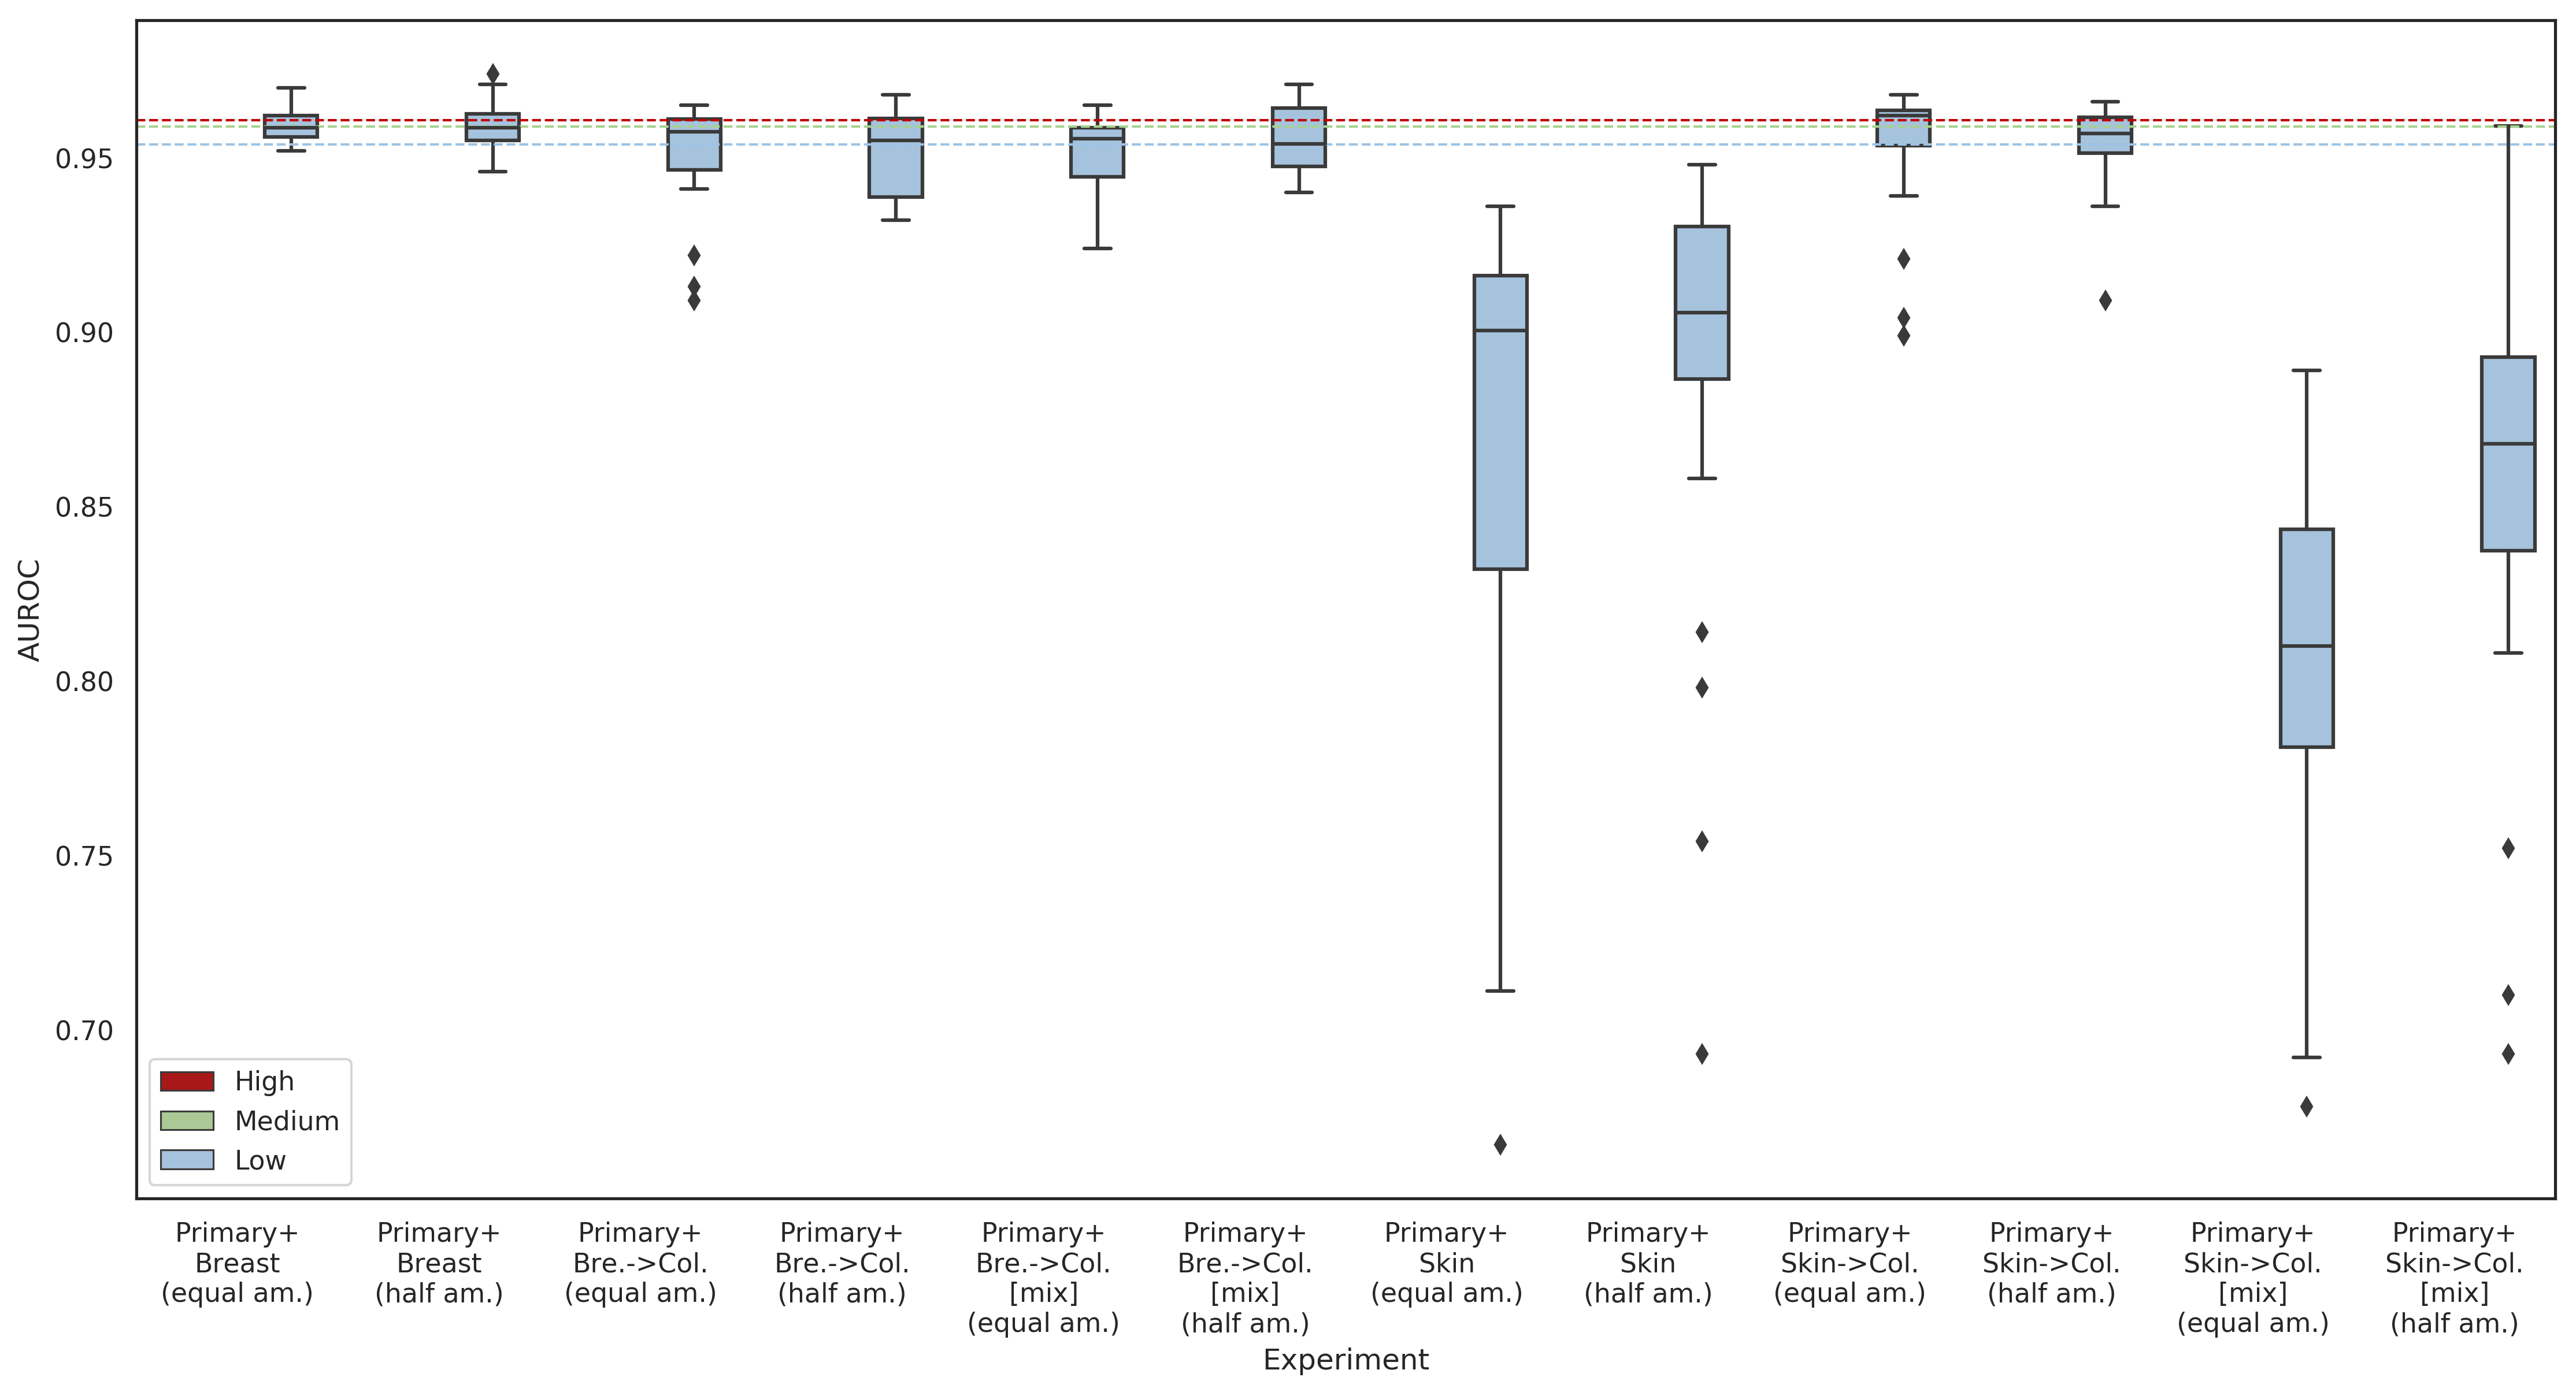
Here we complement the most central results presented in the main paper with an account for the full set of experiments conducted in the study and additional plots describing the performance in the different scenarios and for different augmentations. Table 3 shows the AUROC (Area Under the ROC curve) for all experiments. This is also shown in the plot in Figure 1 where the mean AUROC is plotted against the standard deviation computed over the four sub-sets’ performance for five trainings per sub-set. The zoom in in Figure 2 shows a selection of the best performing scenarios and the corresponding baselines. From top to bottom, the box plots in Figure 3 show the AUROC for high, medium and low cost scenarios against the mean performance for the baseline annotation effort scenarios, i.e., with no augmentations (dashed line), for the different data/augmentation combinations.The boxes show the quartiles of the perfomance results per experiment, while the whiskers extend to show the rest of the distribution, except for the outliers (diamond markers).
In the experiments presented in Table 3 and Figures 1, 2 and 3 left to right arrow () denote data domain adaptation. The suffix [mix] stands for Cycle-GAN transformations in a class-agnostic fashion. For example, Bre.Col.[mix] means that the breast tissue data were transformed to the target domain without performing per-class adaptations, while Bre.Col. means that tumor and non-tumor breast tissue data were transformed by separate Cycle-GANs to tumor and non-tumor colon tissue data respectively. Moreover, we include to the notation the augmented set’s size in relation to the baseline training set number of patches; (equal am.) stands for equal amount of added images to the baseline train set, while (half am.) for half the amount.
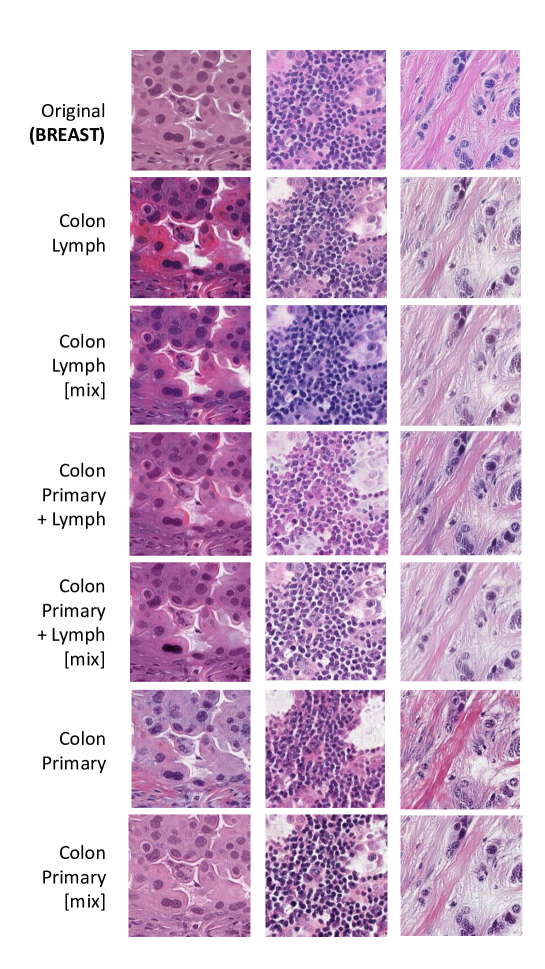
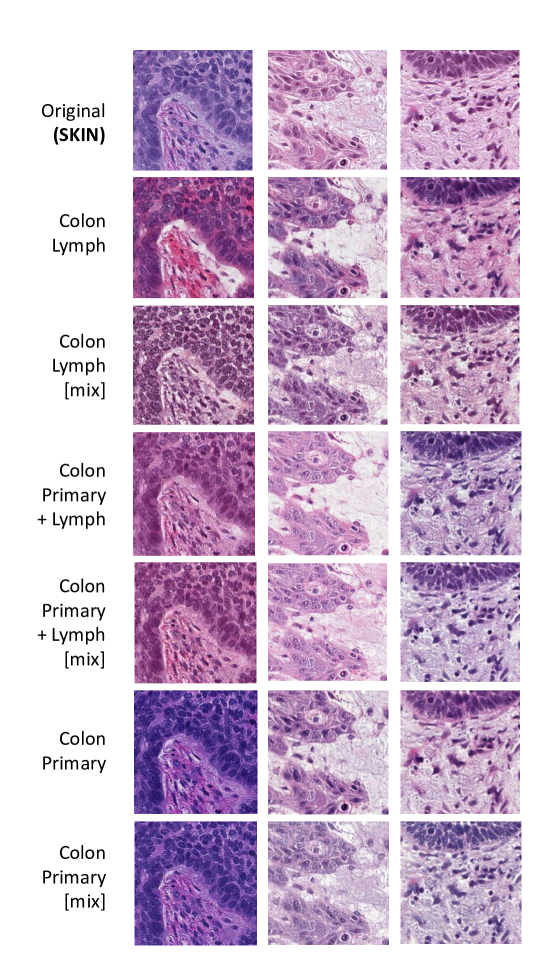
Finally, Figures 4 and 5 provide examples of data domain adaptation for breast and skin tumor tissue respectively for visual inspection. The image-to-image translation differs for the various colon data available for the Cycle-GANs training, as well as the training approach. We test both training separate Cycle-GANs for each of the tumor and non-tumor classes, and train one joint network for both classes.
Mean Accuracystddev Experiment lymph tumor non-tumor total Mean AUROCstddev Lymph(w/o color aug.) 0.87330.0974 0.97270.0183 0.92930.0327 0.92300.0421 Lymph + Primary(w/o color aug.) 0.85880.0787 0.94630.04220 0.90810.0144 0.90260.0268 Primary(w/o color aug.) 0.74640.1834 0.96570.0272 0.86990.0853 0.85620.0926 Lymph 0.95410.0231 0.96710.0176 0.96140.0114 0.96070.0121 Lymph + Primary 0.96730.0126 0.95070.0253 0.95800.0091 0.95900.0067 Primary 0.95010.0139 0.95730.0228 0.95420.0114 0.95380.0114 Lymph + Breast (equal am.) 0.96010.0148 0.97680.0097 0.96950.0074 0.96840.0076 Lymph + Breast (half am.) 0.95580.0149 0.98010.0083 0.96950.0065 0.96800.0069 Lymph + Bre.Col. (equal am.) 0.94020.0244 0.97520.0175 0.95990.0154 0.95770.0171 Lymph + Bre.Col. (half am.) 0.95090.0136 0.97610.0141 0.96510.0097 0.96350.0096 Lymph + Bre.Col.[mix] (equal am.) 0.93820.0106 0.98030.0077 0.96190.0068 0.95930.0084 Lymph + Bre.Col.[mix] (half am.) 0.94550.0138 0.98020.0096 0.96500.0073 0.96280.0085 Lymph + Skin (equal am.) 0.82350.0947 0.97190.0082 0.90710.0447 0.89780.0466 Lymph + Skin (half am.) 0.83640.1014 0.97910.0051 0.91670.04455 0.90780.0487 Lymph + SkinCol. (equal am.) 0.94730.0332 0.97060.0090 0.96040.0174 0.95890.0173 Lymph + SkinCol. (half am.) 0.94810.0286 0.97390.0095 0.96260.0145 0.96110.0146 Lymph + SkinCol.[mix] (equal am.) 0.75730.0822 0.96810.0150 0.87600.0354 0.86270.0402 Lymph + SkinCol.[mix] (half am.) 0.80500.0861 0.97320.0117 0.89970.0396 0.88920.0413 Lymph + Primary + Breast (equal am.) 0.96650.0103 0.96760.0101 0.96710.0042 0.96710.0042 Lymph + Primary + Breast (half am.) 0.96690.0128 0.96810.0145 0.96760.0044 0.96760.0039 Lymph + Primary + Bre.Col. (equal am.) 0.96750.0158 0.93670.0327 0.95010.0123 0.95210.0117 Lymph + Primary + Bre.Col. (half am.) 0.96670.0213 0.93770.0297 0.95030.0096 0.95230.0084 Lymph + Primary + Bre.Col.[mix] (equal am.) 0.96910.0125 0.95450.0159 0.96090.0048 0.96180.0064 Lymph + Primary + Bre.Col.[mix] (half am.) 0.95110.0155 0.97040.0125 0.96200.0032 0.96070.0048 Lymph + Primary + Skin (equal am.) 0.86490.0083 0.96770.0099 0.92280.0075 0.91630.0154 Lymph + Primary + Skin (half am.) 0.87620.0193 0.97430.0083 0.93140.0087 0.92520.0164 Lymph + Primary + SkinCol. (equal am.) 0.95430.0194 0.95670.0213 0.95570.0058 0.95550.0054 Lymph + Primary + SkinCol. (half am.) 0.96100.0162 0.96610.0132 0.96380.0038 0.96350.0043 Lymph + Primary + SkinCol.[mix] (equal am.) 0.72900.0503 0.96820.0084 0.86370.0264 0.84860.0323 Lymph + Primary + SkinCol.[mix] (half am.) 0.79340.0113 0.97050.0157 0.89310.0104 0.88190.0273 Prim.Lym. 0.94860.0222 0.97090.0166 0.96110.0058 0.95980.0067 Lymph + Prim.Lym. 0.95560.0144 0.97330.0117 0.96560.0046 0.96450.0056 Lymph + Primary + Prim.Lym. 0.95350.0154 0.97250.0119 0.96420.0064 0.96300.0070 Lymph + Primary + Prim.Lym. + Breast non-tumor 0.9600.0143 0.96560.0199 0.96310.0055 0.96300.0058 Lymph + Primary + Prim.Lym. + Bre.Col. non-tumor 0.95700.0090 0.97230.0120 0.96560.0052 0.96470.0046 Lymph + Primary + Prim.Lym. + Skin non-tumor 0.87190.0354 0.97410.0165 0.92950.0168 0.92210.030 Lymph + Primary + Prim.Lym. + SkinCol. non-tumor 0.95760.0185 0.96680.0177 0.96280.0031 0.96180.0048 Primary + Breast (equal am.) 0.95140.0150 0.96810.0146 0.96080.0053 0.95980.0053 Primary + Breast (half am.) 0.94980.0176 0.96830.0133 0.96030.0068 0.95910.0079 Primary + Bre.Col. (equal am.) 0.93670.0193 0.96370.0166 0.95190.0157 0.95020.0167 Primary + Bre.Col. (half am.) 0.94320.0210 0.96030.0212 0.95280.0129 0.95180.0122 Primary + Bre.Col.[mix] (equal am.) 0.92850.0189 0.97260.0130 0.95340.0112 0.95060.0122 Primary + Bre.Col.[mix] (half am.) 0.94090.0261 0.97020.0141 0.95740.0087 0.95550.0101 Primary + Skin (equal am.) 0.75340.1691 0.96650.0207 0.87340.0843 0.86000.0860 Primary + Skin (half am.) 0.79670.1258 0.97150.0158 0.89510.0614 0.88410.0680 Primary + SkinCol. (equal am.) 0.93410.0372 0.97140.0086 0.95510.0187 0.95280.0208 Primary + SkinCol. (half am.) 0.93990.0201 0.96710.0140 0.95520.0117 0.95360.0135 Primary + SkinCol.[mix] (equal am.) 0.63450.1147 0.97050.0107 0.82370.0545 0.80250.0621 Primary + SkinCol.[mix] (half am.) 0.73860.0992 0.97220.0104 0.87010.0488 0.85550.0714 Colon full set(w/o color aug.) 0.96080.0075 0.98140.0063 0.97240.0014 0.97120.0015