AI Accelerator Survey and Trends
††thanks: This material is based upon work supported by the Assistant Secretary of Defense for Research and Engineering under Air Force Contract No. FA8702-15-D-0001. Any opinions, findings, conclusions or recommendations expressed in this material are those of the author(s) and do not necessarily reflect the views of the Assistant Secretary of Defense for Research and Engineering.
Abstract
Over the past several years, new machine learning accelerators were being announced and released every month for a variety of applications from speech recognition, video object detection, assisted driving, and many data center applications. This paper updates the survey of AI accelerators and processors from past two years. This paper collects and summarizes the current commercial accelerators that have been publicly announced with peak performance and power consumption numbers. The performance and power values are plotted on a scatter graph, and a number of dimensions and observations from the trends on this plot are again discussed and analyzed. This year, we also compile a list of benchmarking performance results and compute the computational efficiency with respect to peak performance.
Index Terms:
Machine learning, GPU, TPU, dataflow, accelerator, embedded inference, computational performanceI Introduction
Over the past several years, startups and established technology companies have been announcing, releasing, and deploying a wide variety of artificial intelligence (AI) and machine learning (ML) accelerators. The focus of these accelerators has been on accelerating deep neural network (DNN) models, and the application space spans from very low power embedded voice recognition to data center scale training. The announcements of new accelerators has slowed in the past year, but the competition for defining markets and application areas continues. This drive to developing and deploying accelerators has been part of a much larger industrial and technology shift in modern computing.
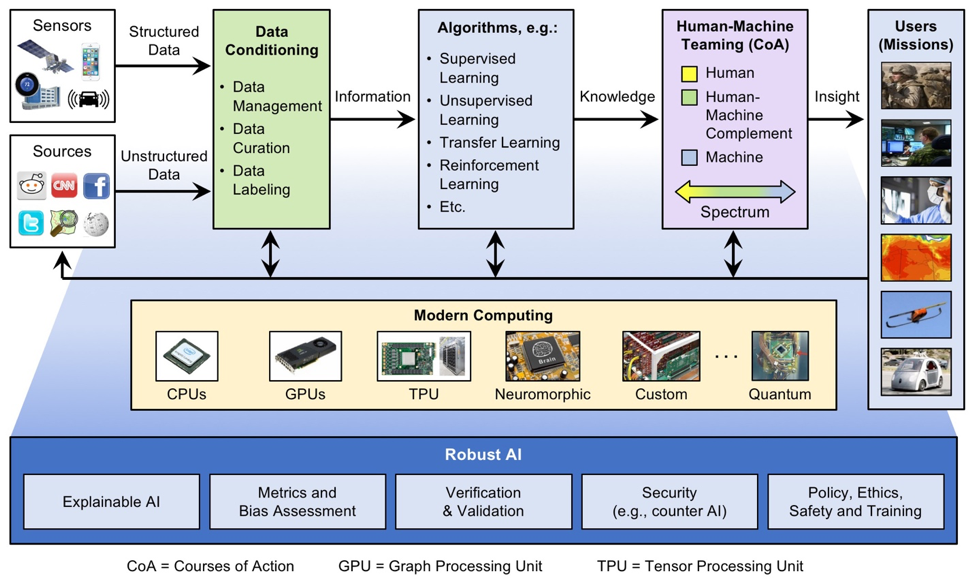
AI ecosystems bring together a components from embedded computing (edge computing), traditional high performance computing (HPC), and high performance data analysis (HPDA) that must work together to effectively provide capabilities for use by decision makers, warfighters, and analysts [1]. Figure 1 captures an architectural overview of such end-to-end AI solutions and their components. On the left side of Figure 1, structured and unstructured data sources provide different views of entities and/or phenomenology. These raw data products are fed into a data conditioning step in which they are fused, aggregated, structured, accumulated, and converted into information. The information generated by the data conditioning step feeds into a host of supervised and unsupervised algorithms such as neural networks, which extract patterns, predict new events, fill in missing data, or look for similarities across datasets, thereby converting the input information to actionable knowledge. This actionable knowledge is then passed to human beings for decision-making processes in the human-machine teaming phase. The phase of human-machine teaming provides the users with useful and relevant insight turning knowledge into actionable intelligence or insight.
Underpinning this system are modern computing systems. Moore’s law trends have ended [2], as have a number of related laws and trends including Denard’s scaling (power density), clock frequency, core counts, instructions per clock cycle, and instructions per Joule (Koomey’s law) [3]. Taking a page from the system-on-chip (SoC) trends first seen in automotive and smartphones, advancements and innovations are still progressing by developing and integrating accelerators for often-used operational kernels, methods, or functions. These accelerators are designed with a different balance between performance and functional flexibility. This includes an explosion of innovation in deep machine learning processors and accelerators [4, 5, 6, 7, 8]. Understanding the relative benefits of these technologies is of particular importance to applying AI to domains under significant constraints such as size, weight, and power, both in embedded applications and in data centers.
This paper is an update to IEEE-HPEC papers from the past two years [9, 10]. As in past years, we will review a few topics pertinent to understanding the capabilities of the accelerators. We must discuss the types of neural networks for which these ML accelerators are being designed; the distinction between neural network training and inference; the numerical precision with which the neural networks are being used for training and inference, and how neuromorphic and optical accelerators fit into the mix:
-
•
Types of Neural Networks – While AI and machine learning encompass a wide set of statistics-based technologies [1], this paper continues with last year’s focus on accelerators and processors that are geared toward deep neural networks (DNNs) and convolutional neural networks (CNNs) as they are quite computationally intense [11].
-
•
Neural Network Training versus Inference – As was explained in the previous two survey, the survey focuses on accelerators and processors for inference for a variety of reasons including that defense and national security AI/ML edge applications rely heavily on inference.
-
•
Numerical Precision – We will consider all of the numerical precision types that an accelerator supports, but for most of them, their best inference performance is in int8 or fp16/bf16 (IEEE 16-bit floating point or Google’s 16-bit brain float). But as can be seen in Figure 2, peak performance has been reported for many different numerical formats.
-
•
Neuromorphic Computing and Photonic Computing – For this year’s survey, we are going to take a pause on most of the neuromorphic computing and photonic computing accelerators. Several new accelerators have been released, but none of these companies have released peak performance and peak power numbers for them. There have been some relative comparisons of neuromorphic processors to conventional accelerators (e.g., [12]), but there have been no hard numbers. Perhaps next year we will start seeing actual performance numbers that we can incorporate in this survey.
There are many surveys [13, 14, 15, 16, 17, 18, 19, 20, 21, 22] and other papers that cover various aspects of AI accelerators; this multi-year survey effort and this paper focus on gathering a comprehensive list of AI accelerators with their computational capability, power efficiency, and ultimately the computational effectiveness of utilizing accelerators in embedded and data center applications. Along with this focus, this paper mainly compares neural network accelerators that are useful for government and industrial sensor and data processing applications.
II Survey of Processors
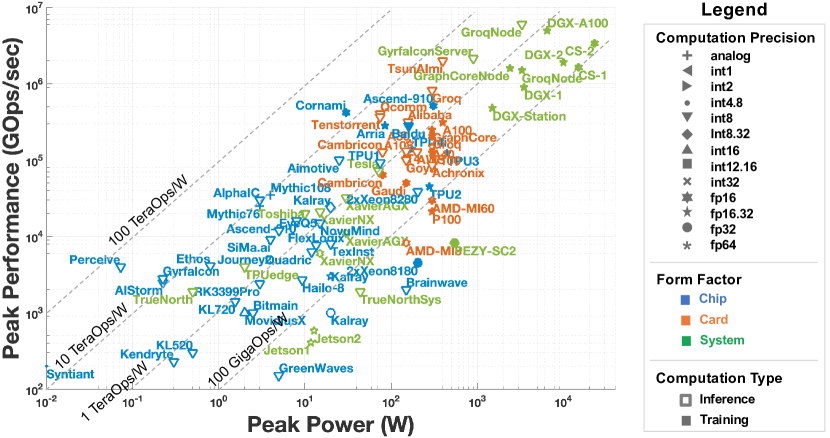
Many recent advances in AI can be at least partly credited to advances in computing hardware [23, 24], enabling computationally heavy machine-learning algorithms and in particular DNNs. This survey gathers performance and power information from publicly available materials including research papers, technical trade press, company benchmarks, etc. While there are ways to access information from companies and startups (including those in their silent period), this information is intentionally left out of this survey; such data will be included in this survey when it becomes publicly available. The key metrics of this public data are plotted in Figure 2, which graphs recent processor capabilities (as of July 2021) mapping peak performance vs. power consumption.
The x-axis indicates peak power, and the y-axis indicate peak giga-operations per second (GOps/s), both on a logarithmic scale. Note the legend on the right, which indicates various parameters used to differentiate computing precisions, form factors, and inference/training. The computational precision of the processing capability is depicted by the geometric shape used; the computational precision spans from analog and single-bit int1 to four-byte int32 and two-byte fp16 to eight-byte fp64. The precisions that show two types denotes the precision of the multiplication operations on the left and the precision of the accumulate/addition operations on the right (for example, fp16.32 corresponds to fp16 for multiplication and fp32 for accumulate/add). The form factor is depicted by color; this is important for showing how much power is consumed, but also how much computation can be packed onto a single chip, a single PCI card, and a full system. Blue corresponds to a single chip; orange corresponds to a card (note that they all are in the 200-400 Watt zone); and green corresponds to entire systems (single node desktop and server systems). This survey is limited to single motherboard, single memory-space systems. Finally, the hollow geometric objects are peak performance for inference-only accelerators, while the solid geometric figures are performance for accelerators that are designed to perform both training and inference.
The survey begins with the same scatter plot that we have compiled for the past two years [9, 10]. To save space, we have summarized some of the important metadata of the accelerators, cards, and systems in Table I, including the label used in Figure 2 for each of the points on the graph; many of the points were brought forward from last year’s plot, and some details of those entries are in [9]. There are several additions which we will cover below. In Table I, most of the columns and entries are self explanatory. However, there are two Technology entries that may not be: dataflow and PIM. Dataflow processors are custom-designed processors for neural network inference and training. Since neural network training and inference computations can be entirely deterministically laid out, they are amenable to dataflow processing in which computations, memory accesses, and inter-ALU communications actions are explicitly programmed or “placed-and-routed” onto the computational hardware. Processor in memory (PIM) is an analog computing technology that augments flash memory circuits with in-place analog multiply-add capabilities. Please refer to the references for the Mythic and Gyrfalcon accelerators for more details on this innovative technology.
| Company | Product | Label | Technology | Form Factor | References |
| Achronix | VectorPath S7t-VG6 | Achronix | dataflow | Card | [25] |
| Aimotive | aiWare3 | Aimotive | dataflow | Chip | [26] |
| AIStorm | AIStorm | AIStorm | dataflow | Chip | [27] |
| Alibaba | Alibaba | Alibaba | dataflow | Card | [28] |
| AlphaIC | RAP-E | AlphaIC | dataflow | Chip | [29] |
| Amazon | Inferentia | AWS | dataflow | Card | [30, 31] |
| AMD | Radeon Instinct MI6 | AMD-MI8 | GPU | Card | [32] |
| AMD | Radeon Instinct MI60 | AMD-MI60 | GPU | Card | [33] |
| ARM | Ethos N77 | Ethos | dataflow | Chip | [34] |
| Baidu | Baidu Kunlun 818-300 | Baidu | dataflow | Chip | [35, 36, 37] |
| Bitmain | BM1880 | Bitmain | dataflow | Chip | [38] |
| Blaize | El Cano | Blaize | dataflow | Card | [39] |
| Cambricon | MLU100 | Cambricon | dataflow | Card | [40, 41] |
| Canaan | Kendrite K210 | Kendryte | CPU | Chip | [42] |
| Cerebras | CS-1 | CS-1 | dataflow | System | [43] |
| Cerebras | CS-2 | CS-2 | dataflow | System | [44] |
| Cornami | Cornami | Cornami | dataflow | Chip | [45] |
| Enflame | Cloudblazer T10 | Enflame | CPU | Card | [46] |
| Flex Logix | InferX X1 | FlexLogix | dataflow | Chip | [47] |
| TPU Edge | TPUedge | dataflow | System | [48] | |
| TPU1 | TPU1 | dataflow | Chip | [49, 50] | |
| TPU2 | TPU2 | dataflow | Chip | [49, 50] | |
| TPU3 | TPU3 | dataflow | Chip | [51, 49, 50] | |
| TPU4i | TPU4i | dataflow | Chip | [51] | |
| GraphCore | C2 | GraphCore | dataflow | Card | [52, 53] |
| GraphCore | C2 | GraphCoreNode | dataflow | System | [54] |
| GreenWaves | GAP9 | GreenWaves | dataflow | Chip | [55, 56] |
| Groq | Groq Node | GroqNode | dataflow | System | [57] |
| Groq | Tensor Streaming Processor | Groq | dataflow | Card | [52, 58] |
| Gyrfalcon | Gyrfalcon | Gyrfalcon | PIM | Chip | [59] |
| Gyrfalcon | Gyrfalcon | GyrfalconServer | PIM | System | [60] |
| Habana | Gaudi | Gaudi | dataflow | Card | [61, 62] |
| Habana | Goya HL-1000 | Goya | dataflow | Card | [63, 62] |
| Hailo | Hailo | Hailo-8 | dataflow | Chip | [64] |
| Horizon Robotics | Journey2 | Journey2 | dataflow | Chip | [65] |
| Huawei HiSilicon | Ascend 310 | Ascend-310 | dataflow | Chip | [66] |
| Huawei HiSilicon | Ascend 910 | Ascend-910 | dataflow | Chip | [67] |
| IBM | TrueNorth | TrueNorth | neuromorphic | System | [68, 69, 70] |
| IBM | TrueNorth | TrueNorthSys | neuromorphic | System | [68, 69, 70] |
| Intel | Arria 10 1150 | Arria | FPGA | Chip | [71, 72] |
| Intel | Mobileye EyeQ5 | EyeQ5 | dataflow | Chip | [39] |
| Intel | Movidius Myriad X | MovidiusX | manycore | Chip | [73] |
| Intel | Xeon Platinum 8180 | 2xXeon8180 | multicore | Chip | [74, 75] |
| Intel | Xeon Platinum 8280 | 2xXeon8280 | multicore | Chip | [74, 76] |
| Kalray | Coolidge | Kalray | manycore | Chip | [77, 78] |
| Kneron | KL520 Neural Processing Unit | KL520 | dataflow | Chip | [79] |
| Kneron | KL720 | KL720 | dataflow | Chip | [80] |
| Microsoft | Brainwave | Brainwave | dataflow | Chip | [81] |
| Mythic | M1076 | Mythic76 | PIM | Chip | [82, 83, 84] |
| Mythic | M1108 | Mythic108 | PIM | Chip | [82, 83, 84] |
| NovuMind | NovuTensor | NovuMind | dataflow | Chip | [85, 86] |
| NVIDIA | Ampere A100 | A100 | GPU | Card | [87] |
| NVIDIA | Ampere A40 | A40 | GPU | Card | [88] |
| NVIDIA | Ampere A30 | A30 | GPU | Card | [88] |
| NVIDIA | Ampere A10 | A10 | GPU | Card | [88] |
| NVIDIA | Pascal P100 | P100 | GPU | Card | [89, 90] |
| NVIDIA | T4 | T4 | GPU | Card | [91] |
| NVIDIA | Volta V100 | V100 | GPU | Card | [92, 90] |
| NVIDIA | DGX Station | DGX-Station | GPU | System | [93] |
| NVIDIA | DGX-1 | DGX-1 | GPU | System | [93, 94] |
| NVIDIA | DGX-2 | DGX-2 | GPU | System | [94] |
| NVIDIA | DGX-A100 | DGX-A100 | GPU | System | [95] |
| NVIDIA | Jetson TX1 | Jetson1 | GPU | System | [96] |
| NVIDIA | Jetson TX2 | Jetson2 | GPU | System | [96] |
| NVIDIA | Jetson Xavier NX | XavierNX | GPU | System | [97] |
| NVIDIA | Jetson AGX Xavier | XavierAGX | GPU | System | [97] |
| Perceive | Ergo | Perceive | dataflow | Chip | [98] |
| PEZY Computing | PEZY-SC2 | PEZY-SC2 | manycore | System | [99] |
| Preferred Networks | MN-3 | Preferred-MN-3 | manycore | Card | [100, 101] |
| Quadric | q1-64 | Quadric | dataflow | Chip | [102] |
| Qualcomm | Cloud AI 100 | Qcomm | dataflow | Card | [103, 104] |
| Rockchip | RK3399Pro | RK3399Pro | dataflow | Chip | [105] |
| SiMa.ai | SiMa.ai | SiMa.ai | dataflow | Chip | [106] |
| Syntiant | NDP101 | Syntiant | PIM | Chip | [107, 108] |
| Tenstorrent | Tenstorrent | Tenstorrent | manycore | Card | [109] |
| Tesla | Tesla Full Self-Driving Computer | Tesla | dataflow | System | [110, 111] |
| Texas Instruments | TDA4VM | TexInst | dataflow | Chip | [112, 113, 114] |
| Toshiba | 2015 | Toshiba | multicore | System | [115] |
| Untether | TsunAImi | TsunAImi | PIM | Card | [116] |
| XMOS | xcore.ai | xcore.ai | dataflow | Chip | [117] |
Finally, a reasonable categorization of accelerators follows their intended application, and the five categories are shown as ellipses on the graph, which roughly correspond to performance and power consumption: Very Low Power for speech processing, very small sensors, etc.; Embedded for cameras, small UAVs and robots, etc.; Autonomous for driver assist services, autonomous driving, and autonomous robots; Data Center Chips and Cards; and Data Center Systems.
We can make some general observations from Figure 2. First, a few new accelerator chips, cards, and systems have been announced and released in the past year. The density has clearly increased in the autonomous ellipse and data center cards and chips ellipse. Further, several cards and chips have been released that are focused on inference that exceed a peak power of 100W, e.g., Intel Habana Goya, NVIDIA Ampere A10 and A40, Alibaba, and Groq. This is a deviation from the last few years. This suggests that the power budget for autonomous vehicles and drones has crept past 100W, and that these accelerators are aimed at both the autonomous vehicle and data center inference markets. When it comes to precision, int8 has become the default numerical precision for embedded, autonomous and data center inference applications. Along with int8 for inference, a number of accelerators are also featuring fp16 and/or bf16 for inference. Finally, the competition for high-end training nodes shown in the data center systems ellipse is intensifying. NVIDIA and Cerebras have very high performing nodes, while Graphcore and Groq also have strong entries. Google TPUs and SambaNova also are competing in this space, but they have only been reporting multinode benchmark results, rather than single system peak capabilities.
II-A New Accelerators
For most of the accelerators, their descriptions and commentaries have not changed since last year so please refer to last year’s paper for descriptions and commentaries. There are, however, several new releases that were not covered by last year’s paper that are covered here. In the following listings, the angle-bracketed string is the label of the item on the scatter plot, and the square bracket after the angle bracket is the literature reference from which the performance and power values came.
-
•
Blaize has emerged from stealth mode and announced its Graph Streaming Processor (GSP) [39], but they have not provided any details beyond a high level component diagram of their chip.
-
•
Enflame Technology, backed by Tencent, started shipping its CloudBlazer T10 data center training accelerator PCIe card [118, 46], which will support a broad range of datatypes including fp32, fp16, bf16, int32, int16, and int8. The T10 accelerator is focused on data center DNN training applications.
-
•
Untether announced their TsunAImi card, which features four RunAI200 chips, during the Fall of 2020. Their at-memory design places 250,000 processing elements within a standard SRAM array. They are targeting the inference market and expect to ship cards in the first half of 2021.
-
•
The Texas Instruments TDA4VM chip TexInst is a feature-rich automotive/autonomous system on a chip (SoC). It not only includes a 8 TOPS (int8) deep learning matrix multiply accelerator (MMA) with 4,096 computational units, but also eight ARM cores, two C7x vector DSPs, two C66x DSPs, 8 MB of L3 RAM, and several other audio, video, and security accelerators. [112, 113, 114]
- •
-
•
The updated Mythic Intelligent Processing Unit accelerator Mythic76 [84, 83] combines a RISC-V control processor, router, and flash memory that uses variable resistors (i.e., analog circuitry) to compute matrix multiplies. The accelerators are aiming for embedded, vision, and data center applications. It is a smaller, lower-power 76 sq.mm. version of the 108 sq.mm., which is labeled Mythic108.
-
•
Qualcomm has announced their Cloud AI 100 accelerator QComm [104], and with their experience in developing communications and smartphone technologies, they have the potential for releasing a chip that delivers high performance with low power draws.
-
•
Several new NVIDIA Ampere data center GPU cards have been released in the past year. The Ampere A40 A40 and A10 A10 are follow-on GPUs for data center inference to the Turing T4 card, while the Ampere A30 A30 is a lower-performance, lower-power, more affordable version of the Ampere A100 training and HPC card [88].
-
•
In June 2021, Google shared details about their fourth generation inference-only TPU4i accelerator TPU4i [51]. It features four 16k-element systolic matrix multiply units and was first deployed in early 2020. As with previous TPU variants, TPU4i is available through the Google Compute Cloud and for internal operations.
-
•
Cerebras partnered with the TSMC chip fabrication foundry to scale its tiled wafer scale engine (WSE) from 16-nm feature size to 7-nm. The result is the Cerebras CS-2 CS-2 [44], which has 850,000 simple arithmetic units. On-board memory scales commensurately along with local memory bandwidth and internal bandwidth. The CS-2 chassis is the same 15-U rack mount system and 12 100-GigE network uplinks, and the system draws up to 23 KW of power.
Finally, we must mention three accelerators that do not appear on Figure 2 yet. Each has been released with some benchmark results but either no peak performance numbers or no peak power numbers.
-
•
Graphcore has announced its second generation accelerator chip, the CG200, which they are offering in their M2000 IPU Machine computer node. The M2000 incorporates four CG200 accelerators and Graphcore reports that the M2000 is capable of over a petaflop/s of performance [120, 121]. While Graphcore has released some training results for the MLPerf benchmark [122], they have not disclosed any peak power or peak performance values.
-
•
SambaNova has released some impressive benchmark results for their reconfigurable AI accelerator technology, but they still have not provided any details from which we can estimate peak performance or power consumption of their solutions [123].
-
•
The Centaur Technology CNS processor [124, 125] includes eight x86 cores along with an integrated AI accelerator realized as a 4,096 byte-wide SIMD unit. The Centaur AI coprocessor (CT-AIC) will delivers peak performance of 20 TOPS with INT8 precision at 2.5 GHz and can also operate at FP16 and INT16 precisions, though at lower performance. Centaur has not published any power numbers, though [125] predicts peak power to be less than 85 Watts.
Much in the same way we no longer showed most FPGA-based solutions in last year’s survey, we are leaving out the research oriented chips that have not found their way to commercial production this year. Research chips including Eyeriss [126, 127, 16], EIE [128], Tetris [129], Tianjic [130], the DianNao family [131], Adapteva [132, 133], and NeuFlow [134] have been important in showing various computational performance, energy efficiency, and computational accuracy gains that could be achieved with specialized accelerator architectures and circuitry.
III Computational Efficiency Analysis
In recent years, a number of companies have been reporting actual performance numbers for their chips, cards, and systems. They have been doing so in the context of various benchmarks including MLPerf [135]. Most of the benchmark results have been for inference, where the metrics are images/items per second for throughput and latency to result. There have also been some training benchmark results, where the metric is time to train a particular DNN model [122]. Since fielded defense and national security applications rely heavily on inference, we will focus on inference this year. Further, we will focus on images per second throughput over latency because in our experience, current defense and national security applications often prioritize throughput rate because the images/items from the sensor platform are collected in a consistent stream. Also DNN inference is more straightforward to characterize from a computational and data motion perspective.
Fortunately, the DNN models that are specified in these benchmarks are well defined; that is, computing an inference output for any image (or other input item), the models are consistent and deterministic in the computations and data motion. The most accessible analysis of a wide set of DNN/CNN models is the online document maintained by Dr. Samuel Albanie [136]. His table reports the number of fused-multiply-add (FMA) operations that dominate the inference (forward pass) computation. However, because it only reports the FMA operations, we must keep in mind that it is only an approximation of all of the computations and data motions involved. With FMA computation per single batch inference from Dr. Albanie’s table, we can compute an approximation of the number of operations per second from the reported number of images processed per second. This is captured in Table II.
Table II is sorted by images-per-second (IPS), and the four Google entries at the bottom. In [51], Google reports average computational efficiency results across the eight most utilized models at Google. Almost all of the accelerators are achieving over 20 percent computational efficiency; often it is challenging to achieve 10 percent computational efficiency on dense computational kernels with reasonably high arithmetic intensity [137]. Considering the highly parallel design of these ML accelerators with wide data transfer paths, it is reasonable to expect that further tuning and optimization should bring the utilization of those below 20 percent higher using techniques including strategic data layouts and data transfer latency hiding. Interestingly, there is no correlation between technology type, precision, or application category with computational utilization percentage.
| Company/Org | Accelerator | Tech. | DNN Model | IPS | Perf. (TOPS) | Precision | Utilization Percent | References |
| GreenWaves | GAP9 | dataflow | MobileNetV1 | 83.9 | 0.0489 | int8 | 46% | [56] |
| NovuMind | NovuTensor | dataflow | ResNet-34 | 697 | 2.8 | int8 | 19% | [86] |
| Mythic | Mythic108 | PIM | ResNet-50 | 900 | 3.6 | analog | 10% | [84] |
| Nvidia | Jetson Xavier NX | GPU | ResNext-50 | 1,165 | 4.7 | int8 | 22% | MLPerf 1.0-98 |
| Nvidia | Jetson AGX Xavier | GPU | ResNext-50 | 2,072 | 8.3 | int8 | 26% | MLPerf 1.0-92 |
| Intel | 2xXeon8280 | manycore | ResNext-50 | 3,248 | 13.0 | int8 | 34% | [74] |
| Nvidia | T4 | GPU | ResNet-50 | 4,292 | 17.2 | int8 | 13% | [138] |
| Kalray | Coolidge | manycore | GoogleNet | 6,000 | 12 | int8.32 | 50% | [77] |
| Qualcomm | Cloud AI 100 | dataflow | ResNext-50 | 7,807 | 31 | int8 | 8% | MLPerf 1.0-101 |
| Nvidia | V100 | GPU | ResNet-50 | 7,907 | 31.6 | int8 | 56% | [52] |
| Achronix | Achronix | dataflow | ResNet-50 | 8,600 | 34.4 | int8 | 40% | [25] |
| Cambricon | MLU100 | dataflow | ResNet-50 | 10,000 | 40 | int8 | 31% | [28] |
| Habana | Goya | dataflow | ResNet-50 | 15,433 | 61.7 | int8 | 62% | [63] |
| Groq | TSP | dataflow | ResNet-50 | 21,700 | 86.8 | int8 | 11% | [139, 52] |
| Tenstorrent | Tenstorrent | manycore | ResNet-50 | 22,431 | 89.7 | int8 | 24% | [109] |
| Nvidia | A100 | GPU | ResNext-50 | 38,010 | 152 | int8 | 24% | MLPerf 1.0-29 |
| TPU1 | dataflow | Google-8 | – | – | int8 | 20% | [51] | |
| TPU2 | dataflow | Google-8 | – | – | fp16 | 51% | [51] | |
| TPU3 | dataflow | Google-8 | – | – | bf16 | 38% | [51] | |
| TPU4i | dataflow | Google-8 | – | – | bf16 | 33% | [51] |
IV Summary
This paper updated the survey of deep neural network accelerators that span from extremely low power through embedded and autonomous applications to data center class accelerators for inference and training. We focused on inference accelerators, and discussed some new additions for the year. The rate of announcements and releases has slowed down some, but we are starting to see second generation accelerators that are significantly improving on the capabilities of the first generation. Actual performance benchmark results are being released more, which gives us the opportunity to evaluate computational efficiency for the first time for accelerators for which we have benchmark results and peak performance numbers. Many of these accelerators achieve over 20 percent computational efficiency.
V Data Availability
The data spreadsheets and references that have been collected for this study and its papers will be posted at https://github.com/areuther/ai-accelerators after they have cleared the release review process.
Acknowledgement
We are thankful to Masahiro Arakawa, Bill Arcand, Bill Bergeron, David Bestor, Bob Bond, Chansup Byun, Nathan Frey, Vitaliy Gleyzer, Jeff Gottschalk, Michael Houle, Matthew Hubbell, Hayden Jananthan, Anna Klein, David Martinez, Joseph McDonald, Lauren Milechin, Sanjeev Mohindra, Paul Monticciolo, Julie Mullen, Andrew Prout, Stephan Rejto, Antonio Rosa, Matthew Weiss, Charles Yee, and Marc Zissman for their support of this work.
References
- [1] V. Gadepally, J. Goodwin, J. Kepner, A. Reuther, H. Reynolds, S. Samsi, J. Su, and D. Martinez, “AI Enabling Technologies,” MIT Lincoln Laboratory, Lexington, MA, Tech. Rep., may 2019. [Online]. Available: https://arxiv.org/abs/1905.03592
- [2] T. N. Theis and H. . P. Wong, “The End of Moore’s Law: A New Beginning for Information Technology,” Computing in Science Engineering, vol. 19, no. 2, pp. 41–50, mar 2017. [Online]. Available: https://doi.org/10.1109/MCSE.2017.29
- [3] M. Horowitz, “Computing’s Energy Problem (and What We Can Do About It),” in 2014 IEEE International Solid-State Circuits Conference Digest of Technical Papers (ISSCC). IEEE, feb 2014, pp. 10–14. [Online]. Available: http://ieeexplore.ieee.org/document/6757323/
- [4] C. E. Leiserson, N. C. Thompson, J. S. Emer, B. C. Kuszmaul, B. W. Lampson, D. Sanchez, and T. B. Schardl, “There’s plenty of room at the Top: What will drive computer performance after Moore’s law?” Science, vol. 368, no. 6495, jun 2020. [Online]. Available: https://science.sciencemag.org/content/368/6495/eaam9744
- [5] N. C. Thompson and S. Spanuth, “The decline of computers as a general purpose technology,” Communications of the ACM, vol. 64, no. 3, pp. 64–72, mar 2021.
- [6] J. L. Hennessy and D. A. Patterson, “A New Golden Age for Computer Architecture,” Communications of the ACM, vol. 62, no. 2, pp. 48–60, jan 2019. [Online]. Available: http://dl.acm.org/citation.cfm?doid=3310134.3282307
- [7] W. J. Dally, Y. Turakhia, and S. Han, “Domain-Specific Hardware Accelerators,” Communications of the ACM, vol. 63, no. 7, pp. 48–57, jun 2020. [Online]. Available: https://dl.acm.org/doi/10.1145/3361682
- [8] Y. LeCun, “Deep Learning Hardware: Past, Present, and Future,” in 2019 IEEE International Solid- State Circuits Conference - (ISSCC), feb 2019, pp. 12–19.
- [9] A. Reuther, P. Michaleas, M. Jones, V. Gadepally, S. Samsi, and J. Kepner, “Survey of Machine Learning Accelerators,” in 2020 IEEE High Performance Extreme Computing Conference (HPEC), 2020, pp. 1–12.
- [10] ——, “Survey and Benchmarking of Machine Learning Accelerators,” in 2019 IEEE High Performance Extreme Computing Conference, HPEC 2019. Institute of Electrical and Electronics Engineers Inc., sep 2019. [Online]. Available: https://doi.org/10.1109/HPEC.2019.8916327
- [11] A. Canziani, A. Paszke, and E. Culurciello, “An Analysis of Deep Neural Network Models for Practical Applications,” arXiv preprint arXiv:1605.07678, 2016. [Online]. Available: http://arxiv.org/abs/1605.07678
- [12] S. Ward-Foxton, “Intel Benchmarks Neuromorphic Chip Against AI Accelerators,” dec 2020. [Online]. Available: https://www.eetimes.com/intel-benchmarks-neuromorphic-chip-against-ai-accelerators/
- [13] C. S. Lindsey and T. Lindblad, “Survey of Neural Network Hardware,” in SPIE 2492, Applications and Science of Artificial Neural Networks, S. K. Rogers and D. W. Ruck, Eds., vol. 2492. International Society for Optics and Photonics, apr 1995, pp. 1194–1205. [Online]. Available: http://proceedings.spiedigitallibrary.org/proceeding.aspx?articleid=1001095
- [14] Y. Liao, “Neural Networks in Hardware: A Survey,” Department of Computer Science, University of California, Tech. Rep., 2001. [Online]. Available: http://citeseerx.ist.psu.edu/viewdoc/summary?doi=10.1.1.460.3235
- [15] J. Misra and I. Saha, “Artificial neural networks in hardware: A survey of two decades of progress,” Neurocomputing, vol. 74, no. 1-3, pp. 239–255, dec 2010. [Online]. Available: https://doi.org/10.1016/j.neucom.2010.03.021
- [16] V. Sze, Y. Chen, T. Yang, and J. S. Emer, “Efficient Processing of Deep Neural Networks: A Tutorial and Survey,” Proceedings of the IEEE, vol. 105, no. 12, pp. 2295–2329, dec 2017. [Online]. Available: https://doi.org/10.1109/JPROC.2017.2761740
- [17] V. Sze, Y.-H. Chen, T.-J. Yang, and J. S. Emer, Efficient Processing of Deep Neural Networks. Morgan and Claypool Publishers, 2020. [Online]. Available: https://doi.org/10.2200/S01004ED1V01Y202004CAC050
- [18] H. F. Langroudi, T. Pandit, M. Indovina, and D. Kudithipudi, “Digital neuromorphic chips for deep learning inference: a comprehensive study,” in Applications of Machine Learning, M. E. Zelinski, T. M. Taha, J. Howe, A. A. Awwal, and K. M. Iftekharuddin, Eds. SPIE, sep 2019, p. 9. [Online]. Available: https://doi.org/10.1117/12.2529407
- [19] Y. Chen, Y. Xie, L. Song, F. Chen, and T. Tang, “A Survey of Accelerator Architectures for Deep Neural Networks,” Engineering, vol. 6, no. 3, pp. 264–274, mar 2020. [Online]. Available: https://doi.org/10.1016/j.eng.2020.01.007
- [20] E. Wang, J. J. Davis, R. Zhao, H.-C. C. Ng, X. Niu, W. Luk, P. Y. K. Cheung, and G. A. Constantinides, “Deep Neural Network Approximation for Custom Hardware,” ACM Computing Surveys, vol. 52, no. 2, pp. 1–39, may 2019. [Online]. Available: https://dl.acm.org/doi/10.1145/3309551
- [21] S. Khan and A. Mann, “AI Chips: What They Are and Why They Matter,” Georgetown Center for Security and Emerging Technology, Tech. Rep., apr 2020. [Online]. Available: https://cset.georgetown.edu/research/ai-chips-what-they-are-and-why-they-matter/
- [22] U. Rueckert, “Digital Neural Network Accelerators,” in NANO-CHIPS 2030: On-Chip AI for an Efficient Data-Driven World, B. Murmann and B. Hoefflinger, Eds. Springer, Cham, 2020, ch. 12, pp. 181–202. [Online]. Available: https://link.springer.com/chapter/10.1007%2F978-3-030-18338-7_12
- [23] A. Krizhevsky, I. Sutskever, and G. E. Hinton, “ImageNet Classification with Deep Convolutional Neural Networks,” Neural Information Processing Systems, vol. 25, 2012.
- [24] N. P. Jouppi, C. Young, N. Patil, and D. Patterson, “A Domain-Specific Architecture for Deep Neural Networks,” Communications of the ACM, vol. 61, no. 9, pp. 50–59, aug 2018. [Online]. Available: http://doi.acm.org/10.1145/3154484
- [25] G. Roos, “FPGA acceleration card delivers on bandwidth, speed, and flexibility,” nov 2019. [Online]. Available: https://www.eetimes.com/fpga-acceleration-card-delivers-on-bandwidth-speed-and-flexibility/
- [26] “aiWare3 Hardware IP Helps Drive Autonomous Vehicles To Production,” oct 2018. [Online]. Available: https://aimotive.com/news/content/1223
- [27] R. Merritt, “Startup Accelerates AI at the Sensor,” feb 2019. [Online]. Available: https://www.eetimes.com/startup-accelerates-ai-at-the-sensor/
- [28] T. Peng, “Alibaba’s New AI Chip Can Process Nearly 80K Images Per Second,” 2019. [Online]. Available: https://medium.com/syncedreview/alibabas-new-ai-chip-can-process-nearly-80k-images-per-second-63412dec22a3
- [29] P. Clarke, “Indo-US startup preps agent-based AI processor,” aug 2018. [Online]. Available: https://www.eenewsanalog.com/news/indo-us-startup-preps-agent-based-ai-processor/page/0/1
- [30] J. Hamilton, “AWS Inferentia Machine Learning Processor,” nov 2018. [Online]. Available: https://perspectives.mvdirona.com/2018/11/aws-inferentia-machine-learning-processor/
- [31] C. Evangelist, “Deep dive into Amazon Inferentia: A custom-built chip to enhance ML and AI,” jan 2020. [Online]. Available: https://www.cloudmanagementinsider.com/amazon-inferentia-for-machine-learning-and-artificial-intelligence/
- [32] ExxactCorp, “Taking a Deeper Look at AMD Radeon Instinct GPUs for Deep Learning,” dec 2017. [Online]. Available: https://blog.exxactcorp.com/taking-deeper-look-amd-radeon-instinct-gpus-deep-learning/
- [33] R. Smith, “AMD Announces Radeon Instinct MI60 & MI50 Accelerators Powered By 7nm Vega,” nov 2018. [Online]. Available: https://www.anandtech.com/show/13562/amd-announces-radeon-instinct-mi60-mi50-accelerators-powered-by-7nm-vega
- [34] D. Schor, “Arm Ethos is for Ubiquitous AI At the Edge — WikiChip Fuse,” feb 2020. [Online]. Available: https://fuse.wikichip.org/news/3282/arm-ethos-is-for-ubiquitous-ai-at-the-edge/
- [35] J. Ouyang, X. Du, Y. Ma, and J. Liu, “Kunlun: A 14nm High-Performance AI Processor for Diversified Workloads,” in 2021 IEEE International Solid- State Circuits Conference (ISSCC), vol. 64, feb 2021, pp. 50–51.
- [36] R. Merritt, “Baidu Accelerator Rises in AI,” jul 2018. [Online]. Available: https://www.eetimes.com/baidu-accelerator-rises-in-ai/
- [37] C. Duckett, “Baidu Creates Kunlun Silicon for AI,” jul 2018. [Online]. Available: https://www.zdnet.com/article/baidu-creates-kunlun-silicon-for-ai/
- [38] B. Wheeler, “Bitmain SoC Brings AI to the Edge,” feb 2019. [Online]. Available: https://www.linleygroup.com/newsletters/newsletter_detail.php%3Fnum=5975%26year=2019%26tag=3
- [39] M. Demler, “Blaize Ignites Edge-AI Performance,” The Linley Group, Tech. Rep., sep 2020. [Online]. Available: https://www.blaize.com/wp-content/uploads/2020/09/Blaize-Ignites-Edge-AI-Performance.pdf
- [40] Y. Wu, “Chinese AI Chip Maker Cambricon Unveils New Cloud-Based Smart Chip – China Money Network,” may 2018. [Online]. Available: https://www.chinamoneynetwork.com/2018/05/04/chinese-ai-chip-maker-cambricon-unveils-new-cloud-based-smart-chip
- [41] I. Cutress, “Cambricon, Maker of Hauwei’s Kirin NPU IP, Build a Big AI Chip and PCIe Card,” may 2018. [Online]. Available: https://www.anandtech.com/show/12815/cambricon-makers-of-huaweis-kirin-npu-ip-build-a-big-ai-chip-and-pcie-card
- [42] L. Gwennap, “Kendryte Embeds AI for Surveillance,” mar 2019. [Online]. Available: https://www.linleygroup.com/newsletters/newsletter_detail.php?num=5992
- [43] A. Hock, “Introducing the Cerebras CS-1, the Industry’s Fastest Artificial Intelligence Computer - Cerebras,” nov 2019. [Online]. Available: https://www.cerebras.net/introducing-the-cerebras-cs-1-the-industrys-fastest-artificial-intelligence-computer/
- [44] T. Trader, “Cerebras Doubles AI Performance with Second-Gen 7nm Wafer Scale Engine,” apr 2021. [Online]. Available: https://www.hpcwire.com/2021/04/20/cerebras-doubles-ai-performance-with-second-gen-7nm-wafer-scale-engine/
- [45] “Cornami Achieves Unprecedented Performance at Lowest Power Dissipation for Deep Neural Networks,” oct 2019. [Online]. Available: https://cornami.com/1416-2/
- [46] P. Clarke, “Globalfoundries aids launch of Chinese AI startup,” dec 2019. [Online]. Available: https://www.eenewsanalog.com/news/globalfoundries-aids-launch-chinese-ai-startup
- [47] V. Mehta, “Performance Estimation and Benchmarks for Real-World Edge Inference Applications,” in Linley Spring Processor Conference. Linley Group, 2020.
- [48] “Edge TPU,” 2019. [Online]. Available: https://cloud.google.com/edge-tpu/
- [49] N. P. Jouppi, D. H. Yoon, G. Kurian, S. Li, N. Patil, J. Laudon, C. Young, and D. Patterson, “A Domain-Specific Supercomputer for Training Deep Neural Networks,” Commun. ACM, vol. 63, no. 7, pp. 67–78, jun 2020. [Online]. Available: https://doi.org/10.1145/3360307
- [50] P. Teich, “Tearing Apart Google’s TPU 3.0 AI Coprocessor,” may 2018. [Online]. Available: https://www.nextplatform.com/2018/05/10/tearing-apart-googles-tpu-3-0-ai-coprocessor/
- [51] N. P. Jouppi, D. H. Yoon, M. Ashcraft, M. Gottscho, T. B. Jablin, G. Kurian, J. Laudon, S. Li, P. Ma, X. Ma, T. Norrie, N. Patil, S. Prasad, C. Young, Z. Zhou, D. Patterson, and G. Llc, “Ten Lessons From Three Generations Shaped Google’s TPUv4i,” in Proc. of 2021 ACM/IEEE 48th Annual International Symposium on Computer Architecture (ISCA). IEEE Computer Society, jun 2021, pp. 1–14.
- [52] L. Gwennap, “Groq Rocks Neural Networks,” Microprocessor Report, Tech. Rep., jan 2020. [Online]. Available: http://groq.com/wp-content/uploads/2020/04/Groq-Rocks-NNs-Linley-Group-MPR-2020Jan06.pdf
- [53] D. Lacey, “Preliminary IPU Benchmarks,” oct 2017. [Online]. Available: https://www.graphcore.ai/posts/preliminary-ipu-benchmarks-providing-previously-unseen-performance-for-a-range-of-machine-learning-applications
- [54] “Dell DSS8440 Graphcore IPU Server,” Graphcore, Tech. Rep., feb 2020. [Online]. Available: https://www.graphcore.ai/hubfs/Leadgenassets/DSS8440IPUServerWhitePaper_2020.pdf
- [55] “GAP application processors - GreenWaves Technologies,” 2020. [Online]. Available: https://greenwaves-technologies.com/gap8_gap9/
- [56] J. Turley, “GAP9 for ML at the Edge – EEJournal,” jun 2020. [Online]. Available: https://www.eejournal.com/article/gap9-for-ml-at-the-edge/
- [57] N. Hemsoth, “Groq Shares Recipe for TSP Nodes, Systems,” sep 2020. [Online]. Available: https://www.nextplatform.com/2020/09/29/groq-shares-recipe-for-tsp-nodes-systems/
- [58] D. Abts, J. Ross, J. Sparling, M. Wong-VanHaren, M. Baker, T. Hawkins, A. Bell, J. Thompson, T. Kahsai, G. Kimmell, J. Hwang, R. Leslie-Hurd, M. Bye, E. R. Creswick, M. Boyd, M. Venigalla, E. Laforge, J. Purdy, P. Kamath, D. Maheshwari, M. Beidler, G. Rosseel, O. Ahmad, G. Gagarin, R. Czekalski, A. Rane, S. Parmar, J. Werner, J. Sproch, A. Macias, and B. Kurtz, “Think Fast: A Tensor Streaming Processor (TSP) for Accelerating Deep Learning Workloads,” in 2020 ACM/IEEE 47th Annual International Symposium on Computer Architecture (ISCA), may 2020, pp. 145–158. [Online]. Available: https://doi.org/10.1109/ISCA45697.2020.00023
- [59] S. Ward-Foxton, “Gyrfalcon Unveils Fourth AI Accelerator Chip — EE Times,” nov 2019. [Online]. Available: https://www.eetimes.com/gyrfalcon-unveils-fourth-ai-accelerator-chip/
- [60] “SolidRun, Gyrfalcon Develop Arm-based Edge Optimized AI Inference Server,” feb 2020. [Online]. Available: https://www.hpcwire.com/off-the-wire/solidrun-gyrfalcon-develop-edge-optimized-ai-inference-server/
- [61] L. Gwennap, “Habana Offers Gaudi for AI Training,” Microprocessor Report, Tech. Rep., jun 2019. [Online]. Available: https://habana.ai/wp-content/uploads/2019/06/Habana-Offers-Gaudi-for-AI-Training.pdf
- [62] E. Medina and E. Dagan, “Habana Labs Purpose-Built AI Inference and Training Processor Architectures: Scaling AI Training Systems Using Standard Ethernet With Gaudi Processor,” IEEE Micro, vol. 40, no. 2, pp. 17–24, mar 2020. [Online]. Available: https://doi.org/10.1109/MM.2020.2975185
- [63] L. Gwennap, “Habana Wins Cigar for AI Inference,” feb 2019. [Online]. Available: https://www.linleygroup.com/mpr/article.php?id=12103
- [64] S. Ward-Foxton, “Details of Hailo AI Edge Accelerator Emerge,” aug 2019. [Online]. Available: https://www.eetimes.com/details-of-hailo-ai-edge-accelerator-emerge/
- [65] “Horizon Robotics Journey2 Automotive AI Processor Series,” 2020. [Online]. Available: https://en.horizon.ai/product/journey
- [66] Huawei, “Ascend 310 AI Processor,” 2020. [Online]. Available: https://e.huawei.com/us/products/cloud-computing-dc/atlas/ascend-310
- [67] ——, “Ascend 910 AI Processor,” 2020. [Online]. Available: https://e.huawei.com/us/products/cloud-computing-dc/atlas/ascend-910
- [68] M. Feldman, “IBM Finds Killer App for TrueNorth Neuromorphic Chip,” sep 2016. [Online]. Available: https://www.top500.org/news/ibm-finds-killer-app-for-truenorth-neuromorphic-chip/
- [69] S. K. Esser, P. A. Merolla, J. V. Arthur, A. S. Cassidy, R. Appuswamy, A. Andreopoulos, D. J. Berg, J. L. McKinstry, T. Melano, D. R. Barch, C. di Nolfo, P. Datta, A. Amir, B. Taba, M. D. Flickner, and D. S. Modha, “Convolutional networks for fast, energy-efficient neuromorphic computing.” Proceedings of the National Academy of Sciences of the United States of America, vol. 113, no. 41, pp. 11 441–11 446, oct 2016. [Online]. Available: https://doi.org/10.1073/pnas.1604850113
- [70] F. Akopyan, J. Sawada, A. Cassidy, R. Alvarez-Icaza, J. Arthur, P. Merolla, N. Imam, Y. Nakamura, P. Datta, G. Nam, B. Taba, M. Beakes, B. Brezzo, J. B. Kuang, R. Manohar, W. P. Risk, B. Jackson, and D. S. Modha, “TrueNorth: Design and Tool Flow of a 65 mW 1 Million Neuron Programmable Neurosynaptic Chip,” IEEE Transactions on Computer-Aided Design of Integrated Circuits and Systems, vol. 34, no. 10, pp. 1537–1557, oct 2015. [Online]. Available: https://doi.org/10.1109/TCAD.2015.2474396
- [71] M. S. Abdelfattah, D. Han, A. Bitar, R. DiCecco, S. O’Connell, N. Shanker, J. Chu, I. Prins, J. Fender, A. C. Ling, and G. R. Chiu, “DLA: Compiler and FPGA Overlay for Neural Network Inference Acceleration,” in 2018 28th International Conference on Field Programmable Logic and Applications (FPL), aug 2018, pp. 411–4117. [Online]. Available: https://doi.org/10.1109/FPL.2018.00077
- [72] N. Hemsoth, “Intel FPGA Architecture Focuses on Deep Learning Inference,” jul 2018. [Online]. Available: https://www.nextplatform.com/2018/07/31/intel-fpga-architecture-focuses-on-deep-learning-inference/
- [73] J. Hruska, “New Movidius Myriad X VPU Packs a Custom Neural Compute Engine,” aug 2017. [Online]. Available: https://www.extremetech.com/computing/254772-new-movidius-myriad-x-vpu-packs-custom-neural-compute-engine
- [74] J. De Gelas, “Intel’s Xeon Cascade Lake vs. NVIDIA Turing: An Analysis in AI,” jul 2019. [Online]. Available: https://www.anandtech.com/show/14466/intel-xeon-cascade-lake-vs-nvidia-turing
- [75] “Intel Xeon Platinum 8180,” 2020. [Online]. Available: http://www.cpu-world.com/CPUs/Xeon/Intel-Xeon8180.html
- [76] “Intel Xeon Platinum 8280,” 2020. [Online]. Available: http://www.cpu-world.com/CPUs/Xeon/Intel-Xeon8280.html
- [77] B. Dupont de Dinechin, “Kalray’s MPPA® Manycore Processor: At the Heart of Intelligent Systems,” in 17th IEEE International New Circuits and Systems Conference (NEWCAS). Munich: IEEE, jun 2019. [Online]. Available: https://www.european-processor-initiative.eu/dissemination-material/1259/
- [78] P. Clarke, “NXP, Kalray demo Coolidge parallel processor in ’BlueBox’,” jan 2020. [Online]. Available: https://www.eenewsanalog.com/news/nxp-kalray-demo-coolidge-parallel-processor-bluebox
- [79] S. Ward-Foxton, “Kneron’s Next-Gen Edge AI Chip Gets $40m Boost,” jan 2020. [Online]. Available: https://www.eetasia.com/knerons-next-gen-edge-ai-chip-gets-40m-boost/
- [80] ——, “Kneron Attracts Strategic Investors — EE Times,” jan 2021. [Online]. Available: https://www.eetimes.com/kneron-attracts-strategic-investors/
- [81] T. P. Morgan, “Drilling Into Microsoft’s BrainWave Soft Deep Learning Chip,” aug 2017. [Online]. Available: https://www.nextplatform.com/2017/08/24/drilling-microsofts-brainwave-soft-deep-leaning-chip/
- [82] S. Ward-Foxton, “Mythic Resizes its AI Chip,” jun 2021. [Online]. Available: https://www.eetimes.com/mythic-resizes-its-analog-ai-chip/
- [83] N. Hemsoth, “A Mythic Approach to Deep Learning Inference,” aug 2018. [Online]. Available: https://www.nextplatform.com/2018/08/23/a-mythic-approach-to-deep-learning-inference/
- [84] D. Fick, “Mythic @ Hot Chips 2018 - Mythic - Medium,” aug 2018. [Online]. Available: https://medium.com/mythic-ai/mythic-hot-chips-2018-637dfb9e38b7
- [85] K. Freund, “NovuMind: An Early Entrant in AI Silicon,” Moor Insights & Strategy, Tech. Rep., may 2019. [Online]. Available: https://moorinsightsstrategy.com/wp-content/uploads/2019/05/NovuMind-An-Early-Entrant-in-AI-Silicon-By-Moor-Insights-And-Strategy.pdf
- [86] J. Yoshida, “NovuMind’s AI Chip Sparks Controversy,” oct 2018. [Online]. Available: https://www.eetimes.com/novuminds-ai-chip-sparks-controversy/
- [87] R. Krashinsky, O. Giroux, S. Jones, N. Stam, and S. Ramaswamy, “NVIDIA Ampere Architecture In-Depth,” may 2020. [Online]. Available: https://devblogs.nvidia.com/nvidia-ampere-architecture-in-depth/
- [88] T. P. Morgan, “Nvidia Rounds Out ”Ampere” Lineup With Two New Accelerators,” apr 2021. [Online]. Available: https://www.nextplatform.com/2021/04/15/nvidia-rounds-out-ampere-lineup-with-two-new-accelerators/
- [89] “NVIDIA Tesla P100.” [Online]. Available: https://www.nvidia.com/en-us/data-center/tesla-p100/
- [90] R. Smith, “16GB NVIDIA Tesla V100 Gets Reprieve; Remains in Production,” may 2018. [Online]. Available: https://www.anandtech.com/show/12809/16gb-nvidia-tesla-v100-gets-reprieve-remains-in-production
- [91] E. Kilgariff, H. Moreton, N. Stam, and B. Bell, “NVIDIA Turing Architecture In-Depth,” sep 2018. [Online]. Available: https://developer.nvidia.com/blog/nvidia-turing-architecture-in-depth/
- [92] “NVIDIA Tesla V100 Tensor Core GPU,” 2019. [Online]. Available: https://www.nvidia.com/en-us/data-center/tesla-v100/
- [93] P. Alcorn, “Nvidia Infuses DGX-1 with Volta, Eight V100s in a Single Chassis,” may 2017. [Online]. Available: https://www.tomshardware.com/news/nvidia-volta-v100-dgx-1-hgx-1,34380.html
- [94] I. Cutress, “NVIDIA’s DGX-2: Sixteen Tesla V100s, 30TB of NVMe, Only $400K,” mar 2018. [Online]. Available: https://www.anandtech.com/show/12587/nvidias-dgx2-sixteen-v100-gpus-30-tb-of-nvme-only-400k
- [95] C. Campa, C. Kawalek, H. Vo, and J. Bessoudo, “Defining AI Innovation with NVIDIA DGX A100,” may 2020. [Online]. Available: https://devblogs.nvidia.com/defining-ai-innovation-with-dgx-a100/
- [96] D. Franklin, “NVIDIA Jetson TX2 Delivers Twice the Intelligence to the Edge,” mar 2017. [Online]. Available: https://developer.nvidia.com/blog/jetson-tx2-delivers-twice-intelligence-edge/
- [97] R. Smith, “NVIDIA Gives Jetson AGX Xavier a Trim, Announces Nano-Sized Jetson Xavier NX,” nov 2019. [Online]. Available: https://www.anandtech.com/show/15070/nvidia-gives-jetson-xavier-a-trim-announces-nanosized-jetson-xavier-nx
- [98] J. McGregor, “Perceive Exits Stealth With Super Efficient Machine Learning Chip For Smarter Devices,” apr 2020. [Online]. Available: https://www.forbes.com/sites/tiriasresearch/2020/04/06/perceive-exits-stealth-with-super-efficient-machine-learning-chip-for-smarter-devices/#1b25ab646d9c
- [99] D. Schor, “The 2,048-core PEZY-SC2 sets a Green500 record,” nov 2017. [Online]. Available: https://fuse.wikichip.org/news/191/the-2048-core-pezy-sc2-sets-a-green500-record/
- [100] “MN-Core,” 2020. [Online]. Available: https://projects.preferred.jp/mn-core/en/
- [101] I. Cutress, “Preferred Networks: A 500 W Custom PCIe Card using 3000 mm2 Silicon,” dec 2019. [Online]. Available: https://www.anandtech.com/show/15177/preferred-networks-a-500-w-custom-pcie-card-using-3000-mm2-silicon
- [102] D. Firu, “Quadric Edge Supercomputer,” Quadric, Tech. Rep., apr 2019. [Online]. Available: https://quadric.io/supercomputing.pdf
- [103] S. Ward-Foxton, “Qualcomm Cloud AI 100 Promises Impressive Performance per Watt for Near-Edge AI,” sep 2020. [Online]. Available: https://www.eetimes.com/qualcomm-cloud-ai-100-promises-impressive-performance-per-watt-for-near-edge-ai/
- [104] D. McGrath, “Qualcomm Targets AI Inferencing in the Cloud — EE Times,” apr 2019. [Online]. Available: https://www.eetimes.com/qualcomm-targets-ai-inferencing-in-the-cloud/#
- [105] “Rockchip Released Its First AI Processor RK3399Pro NPU Performance Up to 2.4TOPs,” jan 2018. [Online]. Available: https://www.rock-chips.com/a/en/News/Press_Releases/2018/0108/869.html
- [106] L. Gwennap, “Machine Learning Moves to the Edge,” Microprocessor Report, Tech. Rep., apr 2020. [Online]. Available: https://www.linleygroup.com/uploads/sima-machine-learning-moves-to-the-edge-wp.pdf
- [107] D. McGrath, “Tech Heavyweights Back AI Chip Startup,” oct 2018. [Online]. Available: https://www.eetimes.com/tech-heavyweights-back-ai-chip-startup/
- [108] R. Merritt, “Startup Rolls AI Chips for Audio,” feb 2018. [Online]. Available: https://www.eetimes.com/startup-rolls-ai-chips-for-audio/
- [109] L. Gwennap, “Tenstorrent Scales AI Performance: Architecture Leads in Data-Center Power Efficiency,” Microprocessor Report, Tech. Rep., apr 2020. [Online]. Available: https://www.tenstorrent.com/wp-content/uploads/2020/04/Tenstorrent-Scales-AI-Performance.pdf
- [110] E. Talpes, D. D. Sarma, G. Venkataramanan, P. Bannon, B. McGee, B. Floering, A. Jalote, C. Hsiong, S. Arora, A. Gorti, and G. S. Sachdev, “Compute Solution for Tesla’s Full Self-Driving Computer,” IEEE Micro, vol. 40, no. 2, pp. 25–35, mar 2020. [Online]. Available: https://doi.org/10.1109/MM.2020.2975764
- [111] “FSD Chip - Tesla,” 2020. [Online]. Available: https://en.wikichip.org/wiki/tesla_(car_company)/fsd_chip
- [112] S. Ward-Foxton, “TI’s First Automotive SoC with an AI Accelerator Launches,” feb 2021. [Online]. Available: https://www.eetimes.com/tis-first-automotive-soc-with-an-ai-accelerator-launches/
- [113] “TDA4VM Jacinto Processors for ADAS and Autonomous Vehicles,” Texas Instruments, Tech. Rep., mar 2021. [Online]. Available: https://www.ti.com/lit/gpn/tda4vm
- [114] M. Demler, “TI Jacinto Accelerates Level 3 ADAS,” mar 2020. [Online]. Available: https://www.linleygroup.com/newsletters/newsletter_detail.php?num=6130&year=2020&tag=3
- [115] R. Merritt, “Samsung, Toshiba Detail AI Chips,” feb 2019. [Online]. Available: https://www.eetimes.com/samsung-toshiba-detail-ai-chips/
- [116] L. Gwennap, “Untether Delivers At-Memory AI,” Linley Group, Tech. Rep., nov 2020. [Online]. Available: https://www.linleygroup.com/newsletters/newsletter_detail.php?num=6230
- [117] S. Ward-Foxton, “XMOS adapts Xcore into AIoT ‘crossover processor’ — EE Times,” feb 2020. [Online]. Available: https://www.eetimes.com/xmos-adapts-xcore-into-aiot-crossover-processor/#
- [118] B. Wheeler, “Enflame Stokes AI Acceleration,” feb 2021. [Online]. Available: https://www.linleygroup.com/newsletters/newsletter_detail.php?num=6271
- [119] EETimes, “Mobileye’s New EyeQ5: How Open is Open?” nov 2018. [Online]. Available: https://www.eetimes.com/mobileyes-new-eyeq5-how-open-is-open/
- [120] N. Toon, “Introducing 2nd Generation IPU Systems for AI at Scale,” jul 2020. [Online]. Available: https://www.graphcore.ai/posts/introducing-second-generation-ipu-systems-for-ai-at-scale
- [121] I. Lunden, “Graphcore Unveils New GC200 Chip and the Expandable M2000 IPU Machine That Runs on Them,” jul 2020. [Online]. Available: https://techcrunch.com/2020/07/15/graphcore-second-generation-chip/
- [122] J. Russell, “Latest MLPerf Results,” jun 2021. [Online]. Available: https://www.hpcwire.com/2021/06/30/latest-mlperf-results-nvidia-shines-but-intel-graphcore-google-increase-their-presence/
- [123] S. Ward-Foxton, “SambaNova Emerges From Stealth With Record-Breaking AI System,” dec 2020. [Online]. Available: https://www.eetimes.com/sambanova-emerges-from-stealth-with-record-breaking-ai-system/
- [124] G. Henry, P. Palangpour, M. Thomson, J. S. Gardner, B. Arden, J. Donahue, K. Houck, J. Johnson, K. O’brien, S. Petersen, B. Seroussi, and T. Walker, “High-Performance Deep-Learning Coprocessor Integrated into x86 SoC with Server-Class CPUs Industrial Product,” Proceedings - International Symposium on Computer Architecture, vol. 2020-May, pp. 15–26, may 2020.
- [125] L. Gwennap, “Centaur Adds AI to Server Processor: First x86 SoC to Integrate Deep-Learning Accelerator,” The Linley Group, Tech. Rep., dec 2019. [Online]. Available: https://www.centtech.com/wp-content/uploads/2020/10/MPR_Centaur_CHA_2020_10_12.pdf
- [126] Y. Chen, J. Emer, and V. Sze, “Eyeriss: A Spatial Architecture for Energy-Efficient Dataflow for Convolutional Neural Networks,” IEEE Micro, p. 1, 2018. [Online]. Available: https://doi.org/10.1109/MM.2017.265085944
- [127] Y. Chen, T. Krishna, J. S. Emer, and V. Sze, “Eyeriss: An Energy-Efficient Reconfigurable Accelerator for Deep Convolutional Neural Networks,” IEEE Journal of Solid-State Circuits, vol. 52, no. 1, pp. 127–138, jan 2017. [Online]. Available: https://doi.org/10.1109/JSSC.2016.2616357
- [128] S. Han, X. Liu, H. Mao, J. Pu, A. Pedram, M. A. Horowitz, and W. J. Dally, “EIE: Efficient Inference Engine on Compressed Deep Neural Network,” in 2016 ACM/IEEE 43rd Annual International Symposium on Computer Architecture (ISCA). IEEE, jun 2016, pp. 243–254. [Online]. Available: http://ieeexplore.ieee.org/document/7551397/
- [129] M. Gao, J. Pu, X. Yang, M. Horowitz, and C. Kozyrakis, “TETRIS: Scalable and Efficient Neural Network Acceleration with 3D Memory,” ACM SIGARCH Computer Architecture News, vol. 45, no. 1, pp. 751–764, may 2017. [Online]. Available: https://dl.acm.org/doi/10.1145/3093337.3037702
- [130] J. Pei, L. Deng, S. Song, M. Zhao, Y. Zhang, S. Wu, G. Wang, Z. Zou, Z. Wu, W. He, F. Chen, N. Deng, S. Wu, Y. Wang, Y. Wu, Z. Yang, C. Ma, G. Li, W. Han, H. Li, H. Wu, R. Zhao, Y. Xie, and L. Shi, “Towards artificial general intelligence with hybrid Tianjic chip architecture,” Nature, vol. 572, no. 7767, pp. 106–111, aug 2019. [Online]. Available: http://www.nature.com/articles/s41586-019-1424-8
- [131] Y. Chen, T. Chen, Z. Xu, N. Sun, and O. Temam, “DianNao Family: Energy-Efficient Accelerators For Machine Learning,” Communications of the ACM, vol. 59, no. 11, pp. 105–112, oct 2016. [Online]. Available: http://dl.acm.org/citation.cfm?doid=3013530.2996864
- [132] A. Olofsson, “Epiphany-V: A 1024 processor 64-bit RISC System-On-Chip,” pp. 1–15, oct 2016. [Online]. Available: https://arxiv.org/abs/1610.01832
- [133] A. Olofsson, T. Nordstrom, and Z. Ul-Abdin, “Kickstarting high-performance energy-efficient manycore architectures with Epiphany,” in 2014 48th Asilomar Conference on Signals, Systems and Computers, vol. 2015-April. IEEE, nov 2014, pp. 1719–1726. [Online]. Available: https://doi.org/10.1109/ACSSC.2014.7094761http://ieeexplore.ieee.org/document/7094761/
- [134] C. Farabet, B. Martini, B. Corda, P. Akselrod, E. Culurciello, and Y. Lecun, “NeuFlow: A runtime reconfigurable dataflow processor for vision,” in IEEE Computer Society Conference on Computer Vision and Pattern Recognition Workshops, 2011. [Online]. Available: https://doi.org/10.1109/CVPRW.2011.5981829
- [135] V. J. Reddi, C. Cheng, D. Kanter, P. Mattson, G. Schmuelling, C.-J. Wu, B. Anderson, M. Breughe, M. Charlebois, W. Chou, R. Chukka, C. Coleman, S. Davis, P. Deng, G. Diamos, J. Duke, D. Fick, J. S. Gardner, I. Hubara, S. Idgunji, T. B. Jablin, J. Jiao, T. S. John, P. Kanwar, D. Lee, J. Liao, A. Lokhmotov, F. Massa, P. Meng, P. Micikevicius, C. Osborne, G. Pekhimenko, A. T. R. Rajan, D. Sequeira, A. Sirasao, F. Sun, H. Tang, M. Thomson, F. Wei, E. Wu, L. Xu, K. Yamada, B. Yu, G. Yuan, A. Zhong, P. Zhang, and Y. Zhou, “MLPerf Inference Benchmark,” Proceedings - International Symposium on Computer Architecture, vol. 2020-May, pp. 446–459, nov 2019. [Online]. Available: https://arxiv.org/abs/1911.02549v2
- [136] S. Albanie, “Convnet Burden,” 2019. [Online]. Available: https://github.com/albanie/convnet-burden
- [137] S. Williams, A. Waterman, and D. Patterson, “Roofline: An Insightful Visual Performance Model for Multicore Architectures,” Commun. ACM, vol. 52, no. 4, pp. 65–76, apr 2009. [Online]. Available: http://doi.acm.org/10.1145/1498765.1498785
- [138] W. Harmon, “NVIDIA Tesla T4 AI Inferencing GPU Benchmarks and Review,” oct 2019. [Online]. Available: https://www.servethehome.com/nvidia-tesla-t4-ai-inferencing-gpu-review/4/
- [139] K. Krewell, “Virtual Conference Delivers Real Chips,” apr 2020. [Online]. Available: https://www.eetimes.com/virtual-conference-delivers-real-chips/