Panspermia in a Milky Way-like Galaxy
Abstract
We study the process of panspermia in Milky Way-like galaxies by modeling the probability of successful travel of organic compounds between stars harboring potentially habitable planets. To this end, we apply the modified habitability recipe of Gobat & Hong (2016) to a model galaxy from the MUGS suite of zoom-in cosmological simulations. We find that, unlike habitability, which only occupies narrow dynamic range over the entire galaxy, the panspermia probability can vary be orders of magnitude between the inner () and outer disk. However, only a small fraction of star particles have very large values of panspermia probability and, consequently, the fraction of star particles where the panspermia process is more effective than prebiotic evolution is much lower than from naïve expectations based on the ratio between panspermia probability and natural habitability.
1 Introduction
The notion that living organisms could travel between celestial bodies is almost as old as the concept of habitable worlds (e.g., Lucian’s Vera Historia, Kepler’s Somnium, or Voltaire’s Micromégas). Already present in embryonic form in some ancient mythologies, it was first formally named panspermia 25 centuries ago by the philosopher Anaxagoras. The development of microbiology in the 19 century opened up the possibility that such passage, rather than being directed, could take the form of the accidental propagation of simple seeds of life (e.g., Arrhenius & Borns, 1908). This idea eventually spread through popular culture and became a minor staple of early 20 century speculative fiction, often playing on fears of invasion and contamination.
In the modern era of astrophysics, the concept of panspermia was famously embraced and developed by F. Hoyle and C. Wickramasinghe after the discovery of organic compounds in the interstellar medium (e.g., Hoyle & Wickramasinghe, 1977, 1978; Hoyle et al., 1983, 1986). Although never gaining widespread acceptance, likely due to a combination of practical and ideological factors (i.e., long odds and a perceived non-necessity in explaining our world), panspermia has been the subject of a steady number of studies since then. It has experienced a resurgence lately with the discovery of multiple, possibly habitable exoplanetary systems (Gillon et al., 2016; Zechmeister et al., 2019) and the recent crossing through the solar system of hyperbolic trajectory comets of probable interstellar origin (Meech et al., 2017; Higuchi & Kokubo, 2019), starkly illustrating the possibility of matter exchanges between unbound star systems.
Modern studies involving panspermia broadly fall into three categories. The first concerns practical evaluations of the survivability of micro-organisms to the various potentially lethal events that panspermia involves. Namely, their ejection from and re-entry onto planetary surfaces (e.g., Melosh, 1988; Burchell et al., 2001; Mastrapa et al., 2001; Stöffler et al., 2007; Burchell, 2007; Price et al., 2013; Pasini & Price, 2015) and transit through the harsh radiation environment of interplanetary and interstellar space (e.g., Weber & Greenberg, 1985; Horneck et al., 1994; Secker et al., 1996; Horneck et al., 2001; Wickramasinghe & Wickramasinghe, 2003; Yamagishi et al., 2018). These show that bacterial spores can survive hypervelocity impacts, as well as prolonged exposure to a combination of hard vacuum, low temperatures, and ionizing radiation. Although experiments were understandably not carried out over the timescales expected for interstellar panspermia, they nevertheless suggest that a small but non-insignificant fraction of spores could survive the kilo- or mega-years of transit, especially when embedded in even a thin mantle of carbonaceous material.
The second type of study tries to estimate the timescale and types of mass transfer between planets orbiting a common host star, typically by the exchange of meteoroids (also called litho-panspermia; Wells et al., 2003; Gladman et al., 2005; Krijt et al., 2017; Lingam & Loeb, 2017), or between stellar systems (e.g., Melosh, 2003; Lingam & Loeb, 2018), with the radiation pressure on small grains (also called radio-panspermia; Wallis & Wickramasinghe, 2004; Napier, 2004; Wesson, 2010; Lingam & Loeb, 2021). To these, we can also include speculations on the intentional seeding of other stellar systems via technological means (or directed panspermia; e.g., Crick & Orgel, 1973).
The last category concerns statistical investigations of panspermic propagation through stellar systems or galaxies using analytical or simple numerical models (Adams & Spergel, 2005; Lin & Loeb, 2015; Lingam, 2016; Ginsburg et al., 2018; Đošović et al., 2019; Carroll-Nellenback et al., 2019), or of the effect of a spatially variable probability of habitable planets (habitability; e.g., Gonzalez et al., 2001; Lineweaver et al., 2004; Gowanlock et al., 2011) on the viability of panspermia.
Here we couple the products of a hydrodynamical simulation of a Milky Way-like galaxy (Stinson et al., 2010; Nickerson et al., 2013) with a modified galactic habitability model (Gobat & Hong, 2016, hereafter GH16) to investigate how the probability and efficiency of panspermia vary with galactic environment. This paper is structured as follows: Sect. 2 and 3 describe, respectively, the numerical simulation and habitability model that constitute the base of this study, while Sect. 4 presents the mathematical formalism we use for computing the probability of panspermia. We describe and discuss our results in Sect. 5 and summarize our conclusions in Sect. 6.
2 Simulation Data
The McMaster Unbiased Galaxy Simulations (MUGS) is a set of 16 simulated galaxies carried out by Stinson et al. (2010) and Nickerson et al. (2013). These simulations made use of the cosmological zoom method, which seeks to focus computational effort into a region of interest, while maintaining enough of the surrounding large-scale structure to produce a realistic assembly history. To accomplish this, the simulation was first carried out at low resolution using N-body physics only. Dark matter halos were then identified, and a sample of interesting objects selected. The particles making up, and surrounding, these halos were then traced back to their origin, and the simulation carried out again with the region of interest simulated at higher resolution. The sample of galaxies was selected to have a minimal selection bias on the merging history or spin parameter. To be eligible for re-simulation halos had to have a mass between and , and be isolated for any object with a mass greater than by 2.7 Mpc. MUGS is therefore able to reproduce realistic infall and merging histories. Furthermore, they are able to reproduce the metallicity gradients seen in observed galaxies (e.g., Pilkington et al., 2012; Snaith et al., 2016), as well as features such as discs, halos and bulges.
The MUGS galaxies were simulated in the context of a CDM cosmology in concordance with the Wilkinson Microwave Anisotropy Probe (WMAP) 3-year result (Spergel et al., 2007), with . The simulations were carried out down to using the GASOLINE (Wadsley et al., 2004) smoothed-particle hydrodynamics code (SPH).
In the high-resolution region a gravitational softening length of 310 pc was used, with a hydrodynamical smoothing length of 0.01 times the softening length. The masses of the dark matter, gas and stellar particles were , , and respectively. In order to reproduce the baryonic properties of observed galaxies the simulations made use of ultraviolet (UV) background radiation, and metal-based cooling at low temperatures (Shen et al., 2010). These are based on results from CLOUDY (Ferland et al., 1998). To govern star formation, the simulations used a Schmidt-Kennicutt relation to relate the gas density to the star formation rate (SFR; Kennicutt, 1998). This is further influenced by feedback processes from supernovae, which release energy and metals into the interstellar medium (ISM; see Stinson et al. 2006 for details). A Kroupa Initial Mass Function (IMF; Kroupa et al., 1993, hereafter KTG93) was used to calculate the stellar yields produced by each star particle111It is important to remember that each star particle is an ensemble of stars with a range of masses but the same metallicity. This is a consequence of the resolution limits of simulations, which cannot follow individual stars through time.. The slope of the IMF controls the ratio of high mass to low mass stars in a given simple stellar population (SSP), and each star particle is essentially an SSP. The effect of the fraction of high mass stars is that it directly effects the ratio of Oxygen to Iron, because Oxygen is produced by core-collapse supernovae, while Iron is predominantly produced by SNIa. Thus, the IMF affects the stellar yields from star particles222Pilkington et al. (2012) found that the metallicity, , is calculated as , meaning that it is 1.8 times lower then expected. This may have a small impact on the cooling rate of gas, etc.. Metals are allowed to diffuse between gas particles, using the method outlined in Wadsley et al. (2008), in order to improve mixing.
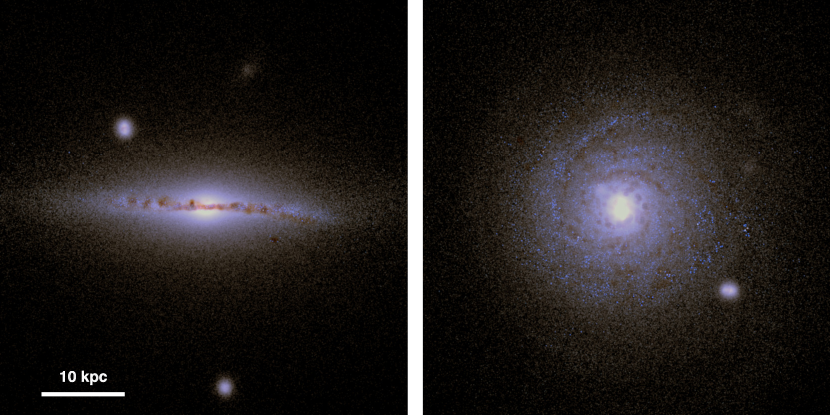
We select one galaxy from MUGS for this study, g15784, which is characterized by a quiescent merger history. The galaxy has a total and stellar mass of and , respectively, and is therefore slightly larger than the Milky Way (Licquia & Newman, 2015). g15784 has not experienced a merger with an object more massive than a 1:3 ratio since , similar to our own Galaxy (e.g., Stewart et al., 2008; Kruijssen et al., 2019; Naidu et al., 2021). Several spheroidal galaxies can be seen to orbit g15784 within of the galactic center (see Fig. 1)333For more details see https://mugs.mcmaster.ca/g15784.html. For an overview of the detailed chemical properties of this galaxy, see Gibson et al. (2013) and Snaith et al. (2016), among other works.
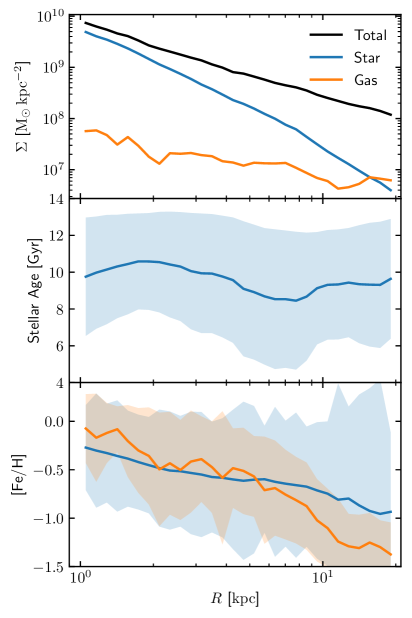
Fig. 2 shows the face-on radial profiles of the surface density, stellar age, and the metallicity of g15784. By taking the mean value of [Fe/H] in a series of radial bins between and we find this galaxy has a metallicity gradient of . Outside of around the stars have a mean formation time of , rising from a formation time of at a . The SFR at is approximately . One important caveat is that the bulge-to-disc light ratio () for this galaxy is larger than expected for the Milky Way, reaching a value of for g15784 (Brook et al., 2012), compared to for the Milky Way (McMillan, 2011). This is a known difference between the Milky Way and MUGS galaxies (Stinson et al., 2010; Allen et al., 2006). This is the effect of insufficient feedback and resolution to capture all the physical processes required to produce a realistic simulated galaxy.
From now on, we only consider the star particles located between from the mass-weighted center of the g15784. We ignore the inner 1 since it is not well resolved. We find a massive knot of particles in the inner few softening lengths, and the high stellar and gas density of this region might thus be an artifact of the simulation (Stinson et al., 2010). The volume we consider contains 977,304 star particles, which we separate into three distinct regions: (1) the CentralDisk, located in galactocentric radius with a thickness of 1 kpc along the galactic plane; (2) the DiskHalo, which corresponds to both the inner disk ( with larger thickness than CentralDisk), outer disk (), and galactic halo outside the disk; and (3) the Spheroids that include two orbiting spheroids.
3 Levels of Habitability
For each star particle, we compute a measure of habitability, that is, the fraction of main-sequence low-mass stars with terrestrial planets within their habitable zones (HZs). We mostly follow the model described in GH16 and refer to that paper for more details on its various components. A quick summary of its formalism is as follows. The habitability fraction of a given star particle at the time is defined as
| (1) |
with
| (2) |
| (3) |
| (4) |
where is the Heaviside step function, and are the minimum and maximum mass of a star, respectively. is the star particle’s star formation history (SFH)444Since star particles are created just once due to the construction of the numerical simulation, this simply corresponds to a delta burst, to which we assign a duration of ., is its IMF, and is its (time-dependent) volume fraction irradiated by SN. is the main-sequence lifetime of a star with mass and metallicity , and and are the inner and outer radii of its HZ, respectively. are the orbital periods of planets orbiting that star, whose distribution follows a simple power-law (e.g., Cumming et al., 2008; Petigura et al., 2013; Burke et al., 2015). is the fraction of stars with terrestrial planets (Case 2 of the metallicity dependence in GH16, ), and is the fraction of solar-metallicity stars with short-period gas giants (or, hot Jupiters), with being a metallicity threshold below which we assume that terrestrial planets cannot form. We do not consider the contribution of the active nucleus in the galactic core, since the distance at which its additional radiative input significantly alters HZs is somewhat smaller (GH16) than the radius of the simulation volume we ignore. The number of (potentially) habitable stellar systems in each star particle is therefore given as .
The values of each parameter we used in this paper are the same as in GH16: , with the following exceptions. First, , the time after which a planet is considered able to host life, is decreased from to in the natural case (see below). Also, we set (similar to Zackrisson et al., 2016) to reconcile the predictions of the model with Kepler constraints (He et al., 2019), which previously differed by a factor of (GH16). Finally, we modify the inner radius of the HZ (Eq. (3) in Kopparapu et al., 2013), to account for increased flare activity in low-mass stars. In essence, we increase the luminosity of every star by the energy-integrated cumulative distribution of flare frequency (which we approximate as a power-law with an index of ), limited by its mass-dependent maximum flare energy, from Davenport (2016). Since we are only concerned with average quantities, we simply weigh this additional luminosity by the fraction of flaring stars to derive the fractional increase per stellar mass. This has the effect of slightly reducing the habitability weight of sub-solar mass stars. However, the effect is mild enough that it does not modify our results. 555In a similar way, atmospheric erosion by intense stellar winds might also push the inner edge of the HZ outwards without impacting its outer radius (e.g., see Dong et al., 2018), effectively narrowing it further around M-dwarfs as they age.
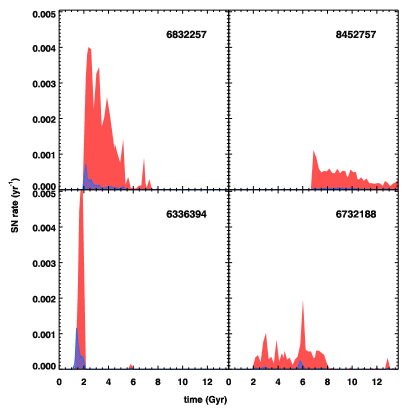
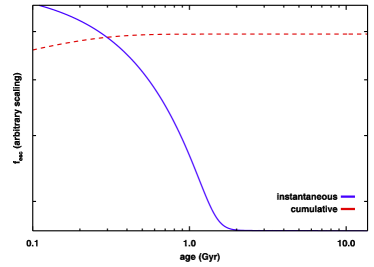
We compute supernova rates (SNR) for each star particle based on its SFH and neighboring particles at each time step, using simulation snapshots from to , spaced by 200 Myr. We consider Type Ia and II supernovae, with
| (5) | ||||
| (6) |
where is the white dwarf (WD) conversion rate (Pritchet et al., 2008), , and is the average delay time between stellar death and the detonation of the WD (Raskin et al., 2009). An example of SNRs for selected star particles in g15784 is given in Fig. 3. The volume irradiated by supernovae within star particle is then
| (7) |
where are the lethal radii of Type Ia and II supernovae, respectively (GH16). is the fractional volume where the two particles overlap (with ), computed assuming that each corresponds to a spherical volume of radius , set by the gravitational softening length, homogeneously filled with stars. As in GH16, the recovery time is set to an arbitrarily large value so that is always positive.
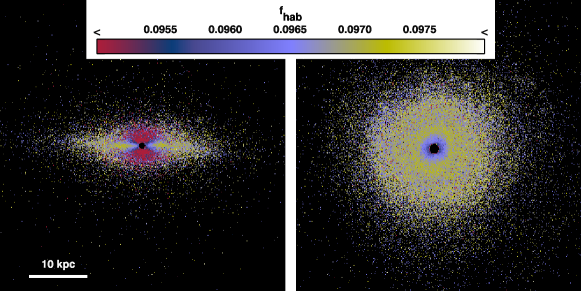
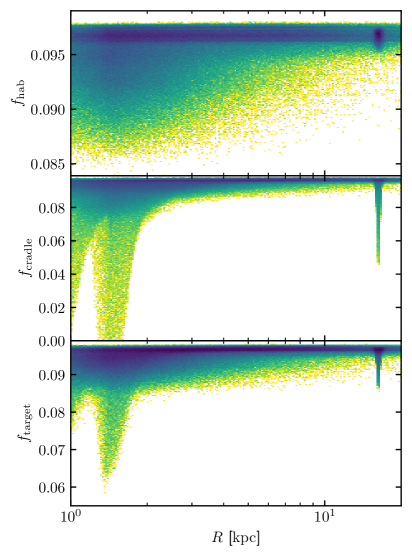
In a majority of cases, most of the SNR felt by individual star particles is contributed by neighboring particles, whose volumes overlap each other. This, together with their higher metallicity (to which is anti-correlated), reduces the habitability of star particles within the crowded galactic bulge, as shown in Fig. 4. On the other hand, the higher density and SNRs found in spiral arms have little effect, although a smattering of low-habitability particles exists in these regions. The average of the disk reaches a (weak) maximum at from the center (Fig. 5), decreasing smoothly further out due to an increased fraction of very low metallicity star particles. This behavior is somewhat similar to the model of Lineweaver et al. (2004) but in contrast with the radially monotonous trend from Gowanlock et al. (2011). The galactic halo similarly contains a mix of lower and higher-habitability star particles, with a significant fraction of non-habitable star particles and a slightly lower average than the disk.
Overall, we find that the range of positive is somewhat narrow at , with most particles having values within of each other, which is similar to Prantzos (2008). This is not entirely surprising since the probability of terrestrial planets is, in this model, only weakly correlated with metallicity and the effect of supernovae on habitability is not strong (GH16). However, the variation increases by order of magnitude at , due to a significantly higher number of star particles below the threshold (especially at large galactocentric radii) and a much higher SNR (especially in the core).
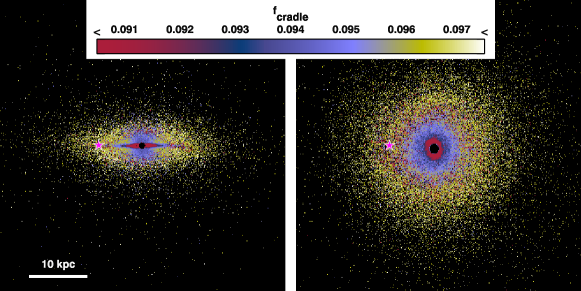
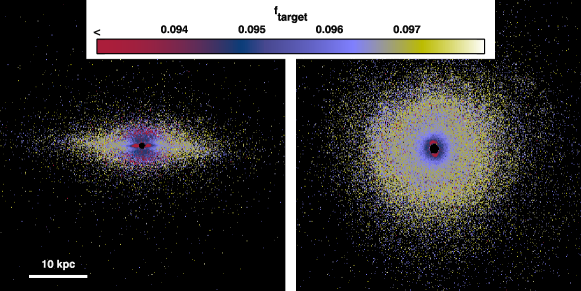
Finally, we consider two other levels of habitability in addition to the natural criterion described above, where a planet is deemed habitable quickly and SN effects are small. These are intended to describe better the fraction of planets where life could arise or take hold (see Sect. 4.1), as opposed to the larger population with just benign surface conditions. The first habitability level is meant to mirror the present state of the Earth, where we set and require that no SNs happened within of planets in the last . We regard this habitability level, , as describing the cradles of potential civilizations, that is, the origin point of directed panspermia. Also, we consider a less restrictive case, with and , to describe the potential targets of such directed panspermia (). The requirement for a small but non-zero also allows us to sidestep the issue of transit of organisms through the radiation environment of supernova remnants. Contrarily to the natural case, here the low-habitability star particles are concentrated within the CentralDisk , up to as shown in Figs. 4 and 5 , due to the higher SN efficiency at suppressing habitability. The outer galactic disk also has lower averages of and , due to the higher prevalence of recently-formed star particles, and the distributions of cradles and targets are similar.
4 Modelling The Probability Of Panspermia
The probability that seeds of life departed from star particle at position at time (hereafter, ) to be successfully transplanted to star particle at can be written as
| (8) |
where the definitions of , , , , and are given progressively in the following sections. We note that, while we here apply Eq. (8) to what are effectively groupings of millions of stars, it can also be used to describe panspermia between two individual stars. Then the total amount transplanted to star particle at is proportional to
| (9) |
We hereafter call and the panspermia contribution and panspermia probability, respectively.666The actual probability that the panspermia process is successful may not be simply additive as assumed in Eq. (9), but this is beyond the scope of this paper. While should always be greater than , and can be the same since a single star particle in our analysis contains millions of stars.
4.1 Probability of Hosting Life
First, is the probability that the star particle has planets bearing living organisms, or their complex organic precursors, at . For a star particle having these seeds, it should be habitable for a period sufficient for successful prebiotic evolution. This can be written as
| (10) |
where is the typical timescale for prebiotic evolution (Mojzsis et al., 1996; van Zuilen et al., 2002; Dodd et al., 2017), and is a certain time-domain kernel between and , respectively. In practice, as is unknown and is much smaller than timescales used in this paper (e.g., timescales for star formation, local SN rates, and delay time for ). Therefore, for simplicity, we assume that the probability of hosting life is similar to the fraction of possible cradles of life, that is, .
4.2 Escape Fraction
is a weight proportional to the escape fraction of life spores, from habitable planets in the star particle to the ISM by natural processes. In order to estimate in the case of natural panspermia, we assume that material carrying spores can be ejected from the surface of habitable terrestrial planets by surface impacts. The velocity of ejecta is (Housen & Holsapple, 2011)
| (11) |
at a distance from the impact center, with , where is the radius of the impact crater, and the impactor’s velocity, which we assume to be equal to the average orbital velocity within the star’s habitable zone.777The typical velocity of impactors may actually be closer to half of the planet’s orbital velocity (e.g., see Collins et al., 2005), which would naturally decrease the number of fragments reaching escape velocity. However, this would not change the “normalized” value of the escape weight which we use here. For Eq. (11), we use parameter values for low-porosity rock given in Housen & Holsapple (2011), namely, , , , , , , , and . The radius of the crater is related to the impactor’s energy through
| (12) |
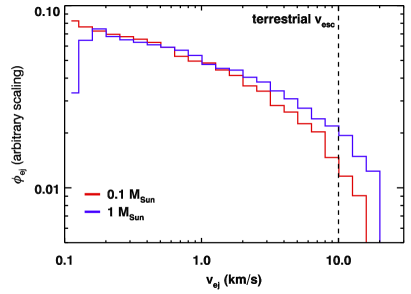
(Hughes, 2003), where , with being the mass of the impactor. Assuming that the latter follows a distribution of the type (Simon et al., 2017), we can then compute a velocity distribution of ejecta (see Fig. 14).
Only a small fraction of the ejected material will have enough velocity to escape the planet and thus only an infinitesimal quantity of this material can ever reach stellar escape velocity in the simulation. On the other hand, we can expect that a fraction of material ejected into circumstellar orbit can be accelerated above stellar escape velocity by either gravitational interactions (in the case of macroscopic fragments, which corresponds to lithopanspermia; Melosh, 1988) or radiation pressure (in the case of microscopic fragments; Arrhenius & Borns, 1908). Under the assumption that the host star mass does not determine the magnitude and frequency of these boosts, is only a function of orbital and stellar escape velocities within the HZ:
| (13) |
where is the quantity of ejected material as a function of velocity (see Fig. 14)and is a normalizing constant. Following this scheme, would be higher for higher-mass stars (Fig. 14), as the radius of the HZ increases with (that is, with ). The same applies to lower-metallicity stars, which are brighter for the same mass. Since the magnitude and frequency of the boosts are unknown, a quantitative estimate for is however not possible. Instead, we compute relative quantities, rescaled to an arbitrary range of for our star particles at . Integrating this over the age-truncated KTG93 IMF then yields a weight
| (14) |
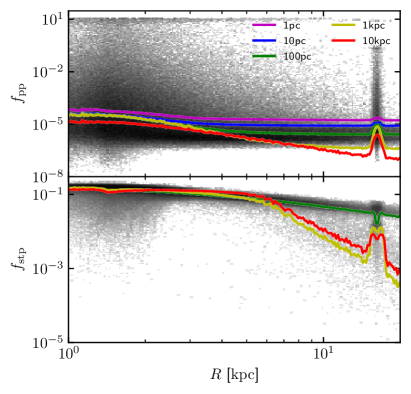
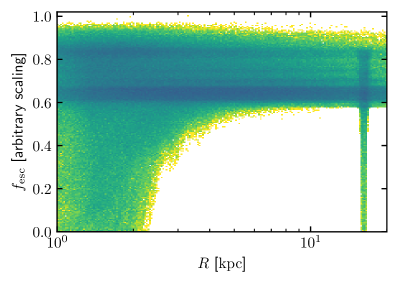
for each star particle. Here we assume for simplicity that does not vary with the age of the stellar particle. However, we note that the frequency of impacts on Earth has decreased exponentially since the formation of the Solar System, which would result in a time-varying . Since depends on the position of the HZ, the spatial distribution of within g15784 is similar to (Figs. 4 & 5), being low within the CentralDisk, reaching a maximum at , and monotonously decreasing at larger galactocentric radii. For a more detailed description, see Appendix A.
4.3 The Capture Fraction
is the capture fraction of interstellar spores by target planets in the star particle by gravity. Here, we assume that stars are evenly distributed in each star particle, and that each star is separated from the others by a distance much greater than the size of its planetary system.
The probability of interstellar objects captured by solar systems can be sensitive to the structure of planetary systems (e.g., Ginsburg et al., 2018). However, this fine structure lays considerably beyond the resolution of the simulation used here. Consequently, and for convenience, we assume to be simply constant on average.
4.4 Traveling Seeds
The last term of Eq. (8) corresponds to the probability that spores originating from a habitable planet within the star particle () at reach a target planet within the star particle () at . Mathematically, it is calculated as the double volume integral of , the survival probability of spores in an interstellar object that starts at and arrives (hereafter, the damage weight), where . To compute this numerically, one needs to understand the spatial distribution of stars in each star particle, as well as consider the traveling distance (), which is a function of the survival timescale of spores in the ISM (), and how depends on .
As mentioned in Sect. 2, each star particle in g15784 is an ensemble of millions of stars whose total mass is about . While the volume of such an ensemble can be approximated by the cell from the Voronoi tessellation888Voronoi tessellation partitions a volume into multiple regions, based on a set of positions . The Voronoi volume of a particle is then defined as an ensemble of points whose closest particle is , that is, . of star particles, the actual distribution of stars within the volume is unknown. Here we assume that the stars in a star particle are uniformly distributed in its Voronoi volume by adopting such numerical limitation. Furthermore, for a fast calculation of the panspermia probability, we simplify the geometry of the star particle to a sphere with center at and radius , where is its Voronoi volume. Such assumptions will work well for small-volume star particles at a relatively dense region of g15784 because the stellar density gradient within the volume will be low, and the shape of the Voronoi cell will be close to the sphere due to numerous nearby cells. On the other hand, our assumptions may poorly work for star particles at the outskirts of g15784. However, these typically do not contribute much to our main results because of their low habitability and panspermia probability.
The survival time of microorganism spores under the pressures, temperatures, and radiation flux expected for panspermia is uncertain. All in-situ experiments so far have been done in Earth orbit (e.g., Horneck et al., 2001; Onofri et al., 2012; Kawaguchi et al., 2013) and their conclusions are typically extrapolated to the requirements for in-system panspermia (e.g., between the Earth and Mars). On the other hand, they do not reflect the likely conditions of interstellar panspermia; in particular, the survival of spores under hard radiation has been found to increase at low temperatures (Weber & Greenberg, 1985; Sarantopoulou et al., 2011). Only a few biological studies concerning an interstellar transit have been carried out (Weber & Greenberg, 1985; Koike et al., 1992; Secker et al., 1994), which suggest that shielding by a rock or carbonaceous material would be required to ensure the survival of a sufficient number of spores. With no clear constraints on the survival timescale, we assume a conservative choice of . For simplicity, we also assume that is negligible compared to the evolution timescale of the Milky Way so that we can use the characteristics of star particles from the snapshot data at for both and .
The survival timescale can be rewritten in terms of the travel distance scale , where is the mean velocity of the spores. As already discussed in Sect. 4.3, the distance between different solar systems is much larger than the typical size of a solar system. Therefore, we assume that, although not exactly zero, the probability that interstellar objects would significantly change their trajectories or speed due to the gravity from a single solar system when they are in the middle of the ISM is low. Here we adopt the velocity of comet ‘Oumuamua ( km/s; Mamajek, 2017) as typical of for rocky objects crossing the ISM. While the speed of interstellar objects may depend on their distance from the galactic center, we do not consider it here for simplicity. Combining and yields a typical scale of a few parsecs, which matches well with the estimation of in Grimaldi et al. (2021). In the following section, we use a range of to explore the parameter space and account for simple cases of directed panspermia (e.g., in case of ; see also Stapleton, 1930; Haldane, 1954; Crick & Orgel, 1973), while keeping in mind that is likely more appropriate to the natural case.
As the dependency of the damage weight to the travel distance () is not precisely known, we consider three different models for : (1) a sudden damage model (sudden hereafter), where spores stay alive at and suddenly die afterward; (2) a linear damage model (lin hereafter), in which the population linearly decreases over time until it becomes zero at ; and (3) an exponential damage model (exp hereafter), where the population of viable spores exponentially decreases over time, assuming that the survival rate over a fixed time period is constant:
| (15) |
Finally, we also consider a fourth damage model, noEsc, which is identical to sudden where for all star particles, in order to understand the dependency of the panspermia probability on . We also note that, unlike sudden and lin, 37% of the spores are still alive at in exp. Therefore, one should be careful when comparing the dependency of the panspermia probability on between exp and others.
4.5 Numerical Formalism
Summarizing the above subsections, one can rewrite Eqs. (8-9) as follows:
| (16) |
where
| (17) |
Since all timescales in Eqs. (8-9) are smaller than the dynamic timescale of the Galaxy, we neglect time-dependent terms in the original equations. Here, is the distance between the centers of two star particles, considered as volumes homogeneously filled with stars. Also, and are the minimum and maximum values of during the integration, respectively. A truncation rate is defined as the minimum value that satisfies , whose value is 1 for sudden and lin. For exp, we manually set for a fast calculation.
is the probability of having given , , and , and assuming that the timescale for panspermia is much less than the evolution timescale of the galaxy:
| (18) |
where
| (22) |
is the fraction of a spherical surface with radius that belongs to the volume of another sphere of radius at distance .
From Eq. (16), one can also estimate a probability that seeds spreading from a given star particle are successfully transplanted in another (hereafter, the successful transplantation probability):
| (23) |
Since several factors in Eqs. (8) & (9) remain unknown, Eqs. (16) & (23) thus only yield relative, rather than absolute, values of the panspermia probability. However, since our main focus is a relative comparison between habitability and panspermia probability, we hereafter normalize and so that their sum over g15784 is same to the sum of the habitability, that is,
| (24) |
5 Results
5.1 Panspermia Probability & Successful Transplantation Probability
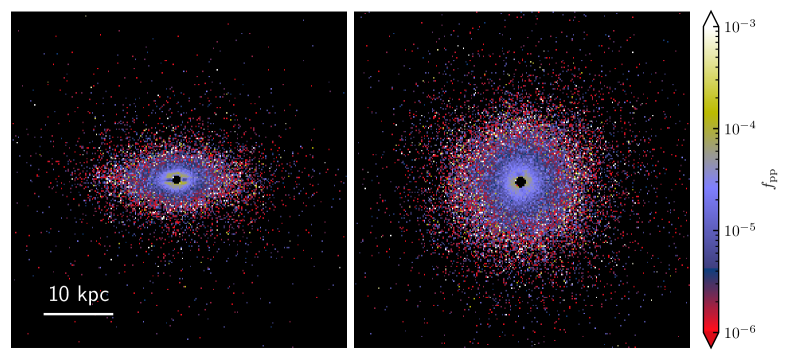
Figs. 6–8 show the spatial and probability distributions of the panspermia probability and successful transplantation probability in g15784 at , normalized following Eq. (24). Similarly to the three habitability levels, star particles in the CentralDisk have very low and . In the DiskHalo region, both and tend to have higher values at lower galactocentric radius () and tangential distance from the galactic plane (). However, while covers a wide range of 7 orders of magnitude and shows a somewhat mixed distribution at , the successful transplantation probability shows a narrower range (3 orders of magnitude) and stronger dependency on both and , in the case. For larger values of , however, tends to show a stronger negative slope on a -direction (upper panel of Fig. 7). Such a negative slope at high- might happen because of the difference, between low- (high-) and at high- (low-), in the number of sources that a given star particle can receive.
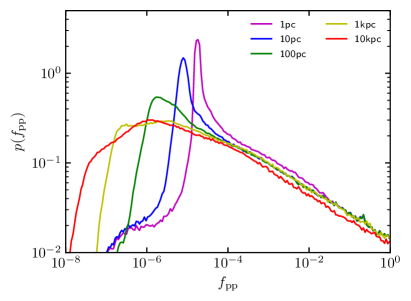
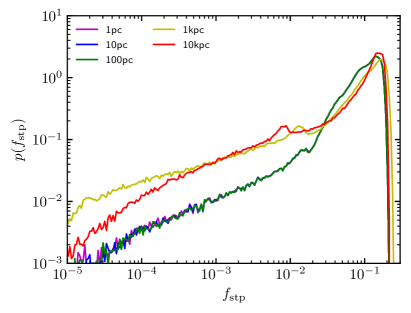
The probability distribution of peaks around times the typical value of the habitabilities. As the travel distance increases, the peak of shifts towards lower values, decreases, and widens. This is because a large allows seeds to reach distant star particles, which naturally increases the total amount of successfully transplanted seeds in a given galaxy. However, since we normalize so that its sum over the galaxy is constant, the importance of each successfully transplanted seed decreases. On the other hand, the peak position of the probability distribution of normalized successful transplantation probability () remains similar regardless of the value of . Instead, the probability distribution spreads toward lower as the travel distance scale increases, especially when .
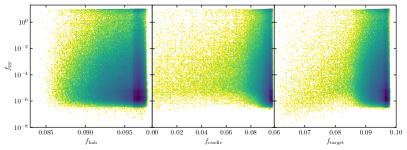
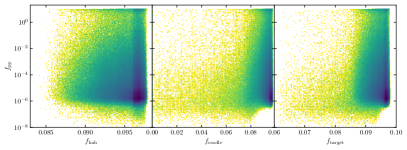
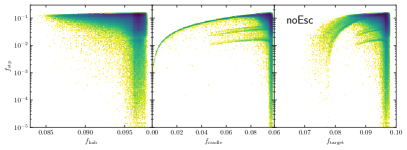
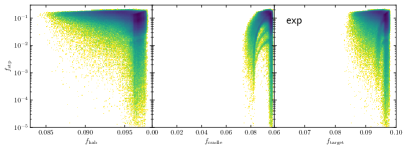
Fig. 9 shows and in g15784 at as a function of the three habitability levels, for various damage models and . From Eqs. (16-17), the panspermia probability is
| (25) |
where
| (26) |
with depending only on the geometry (volumes and relative position) of the source-target star particle pair. Consequently, while may vary from particle to particle, is mostly determined by the local stellar density around the target star particle. Accordingly, while is sensitive to both geometry and the baryonic properties of the target star particle, it can be approximated by a function of only in cases where does not vary much across all relevant source star particles. In other words, if the range of in g15784 is significantly larger than that of , then . On the other hand, if the range of is similar or narrower than that of , the above approximation cannot be used. As shown in Figs. 5 & 17, while , even in the noEsc with . Consequently, does not correlate clearly with habitability (upper panels of Fig. 9). On the other hand, the successful transplantation probability can be written as
| (27) |
and, in a similar way, we can assume that is mostly determined by . Since the range of is significantly larger than that of , we can expect . Indeed, Fig. 9 (bottom panels) shows strong correlations between and , for different values . Most of the DiskHalo population has high values of both and (), while values for CentralDisk, on the other hand, are more widely spread, with a linear correlation (upper diagonal strip at the bottom panels of Fig. 9). Finally, the lower diagonal strips in the bottom panel of Fig. 9 correspond to the Spheroids. Interestingly, there appears to be two distinct populations in the - plane, with and , respectively. They disappear when , suggesting that they originate from successful panspermia between Spheroids and the main galaxy at low . The strength of correlation between and other two types of habitabilities depends on the correlation between those habitabilities and —as () shows a mild(no apparent) correlation with , so does it with (see Fig. 5, for example).
At a fixed value of , we find that neither the probability and joint distributions of and strongly depend on the damage model (sudden, lin, or exp). While the three damage models have different , and therefore, different , the normalization of described above weakens the difference between them. That numerous star particles can affect both and further lessens it. On the other hand, there is significant difference between those three damage models and noEsc, mostly due to differences in escape weight .
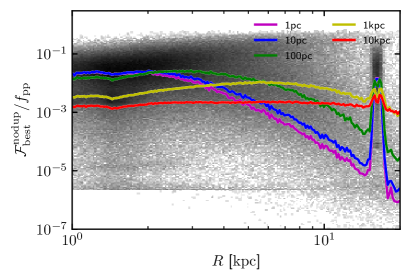
5.2 Panspermia Contributions
By definition, both the and of a given star particle are affected by numerous source and target particles. This means that star particles with the same values of or may however have a completely different panspermia history. For example, some star particles might have received similar amounts of seeds from numerous particles, while others might have received most of their seeds from only one or a few dominant sources. As an attempt to quantify the panspermia history of individual particles, we define the greatest panspermia contribution as the highest single or contribution to the sum:999Ideally, all for the entire -pairs of possible routes should be considered. However, the large number of makes it impractical at the moment. We consider the full list of panspermia contributions and their network in a future work.
| (28) | ||||
| (29) |
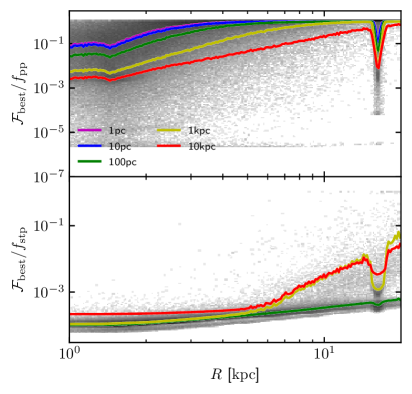
Both occupy a narrow range of values and are nearly constant with galactocentric distance. On the other hand, as shown in Fig. 10, their ratios to and show a clear radial trend: tends to be high in the DiskHalo, increasing with radius up to values of 1, and low in both the CentralDisk and Spheroids. This implies that, while in the outer galactic disk and the halo the panspermia probability of a star particle is on average dominated by a single other particle (i.e., a one-to-one transmission), closer to the bulge and in the satellites the of star particles is a sum of contributions from multiple sources. In this case, the high local density more than offsets the lower habitability of particles in these regions. Likewise, decreases monotonically with increasing , as the larger travel distance allows more source particles to contribute. On the other hand, is somewhat insensitive to the travel distance until , when other routes to target particles in the DiskHalo and Spheroids become possible.
5.3 Self Panspermia in g15784
So far we considered all star particles in our calculation of and , including cases where source and target particles are the same. This possibility of “self panspermia” accounts for the limited spatial and mass resolutions of MUGS, where each star particle () contains millions of stars. In this Section, we investigate the contribution of self panspermia to the panspermia probability.
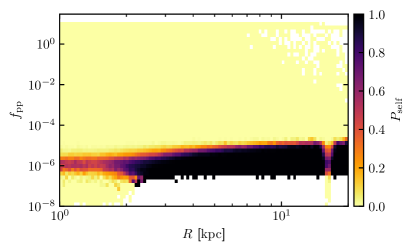
We consider that a given star particle undergoes self panspermia if the panspermia contribution from/to the same star particle is greater than the sum of the contributions from/to the all other star particles, i.e., star particle undergoes self panspermia when . Fig. 11 shows the distribution of self panspermia in g15784 at as a function of galactocentric radius and , assuming exp with . Self panspermia starts to dominate at , where most of the DiskHalo population exists, and for particles with panspermia probabilities at or below the median value (here ). This threshold decreases by two orders of magnitude when increases from to . Conversely, no self panspermia occurs in star particles with values of times greater than the median. On the other hand, star particles at lower galactocentric radii, both in CentralDisk and DiskHalo, tend to undergo less self panspermia because the high stellar densities near the galactic center may prevent the panspermia process from being governed by a single route. Finally, we find almost no cases of self panspermia for the successful transplantation probability (), except in except in the outer, underdense region of the DiskHalo.
Having estimated self panspermia, we subtract it from :
| (30) | ||||
| (31) |
with Fig. 12 showing the behavior of . Contrary to the full case (Fig. 10), is strongly suppressed at , in agreement with Fig. 11. This implies that, in the DiskHalo, most of is self panspermia, but also that the number of sources contributing to non-self panspermia increases with galactocentric radius. On the other hand, the latter (i.e.,panspermia from other source particles) dominates the CentralDisk and Spheroids. We also note that, while the fraction of star particles dominated by self panspermia is large, these tend to have lower values of , as discussed above and therefore contribute less to galactic panspermia.
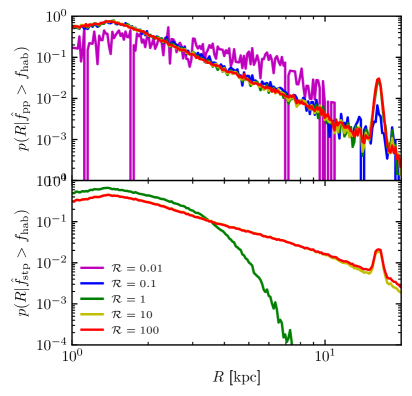
5.4 Panspermia vs. Prebiotic Evolution
In this work we have eschewed a key question that implicitly motivates it, namely: which could be the dominant source of life on habitable planets in the galaxy, in-situ evolution or panspermia ? Within the methodology used in this paper, assuming that does not depend on, e.g., metallicity and that the timescales of prebiotic evolution and transmission are short compared to the age difference between particles, this could be parameterized proportionally to the ratio between the sums of panspermia probability and of natural habitability. Under these conditions, then, panspermia would take precedence when the habitability of a given particle is lower than the sum of habitabilities of neighboring particles weighted by escape fraction and distance.
In practice, however, since have to be arbitrarily scaled due to the presence of undetermined parameters, this question cannot be answered quantitatively. The actual, unnormalized panspermia probability can be defined as , with the true value of being unknown. Varying for the probability of and , we find that matching the naïve expectation that would require and , respectively (for more detail, see Appendix B). Fig. 13 shows the radial distribution of star particles with for various values of which, for , follows a similar slope to - in Fig. 2. This confirms that dense regions, such as the CentralDisk and inner part of the DiskHalo, have a higher chance of being seeded through panspermia.
6 Conclusions
In this paper, we have modeled the probability of panspermia (i.e., of successful material transfer between star systems) and its distribution in Milky Way-like galaxies, using a simulated object from the McMaster Unbiased Galaxy Simulations (MUGS). To compute panspermia probabilities, we have expanded on the formalism presented in GH16, adding models for the ejection of spores from planets, their escape, transit, and in-transit damage. Our conclusions are summarized as follows:
-
1.
While the median habitability of increases with galactocentric radius, the probability for panspermia behaves inversely, being likelier in the central regions of the bulge (), as in the compact dwarf spheroids orbiting the simulated main galaxy. This is mostly due to higher stellar densities, which counterbalances their lower habitability. On the other hand, the panspermia probability is low in the central disk, owing to a lower escape fraction due to metallicity and higher supernova rates. In dense regions, many source particles can contribute to panspermia, whereas in the outer disk and halo the panspermia probability is typically dominated by one or, at most, a few source star particles. Unlike natural habitability, whose value varies by only throughout the galaxy, the panspermia probability has a wide dynamic range of several orders of magnitudes.
-
2.
There is no clear correlation between the panspermia probability and the habitability of the receiving particle, mainly because the former, especially at high values, is affected by numerous source star particles. On the other hand, it is strongly correlated with the habitability of the source particle, with several distinct stellar populations standing out, corresponding to those in the central disk, outside of the central disk, and in the satellites.
-
3.
Finally, although this cannot be precisely quantified at the moment, we expect the process of panspermia to be significantly less efficient at seeding planets than in-situ prebiotic evolution. For example, even in a saturated case where the total panspermia probability is of the order of the total habitability in the galaxy, it would only dominate in 3% of all star particles.
Several caveats remain in our model: first, it includes several factors that we have regarded as unknown constants (e.g., the capture fraction of spores by target planets, the relation between habitability and the presence of life, the typical speed of interstellar objects, and the absolute value of escape fraction of the interstellar organic compounds from source planets). Our results are therefore naturally more qualitative than quantitative. Second, our calculation was done on a single simulation snapshot. That is, it assumes the spatial distribution to be static, while the actual Milky Way rotates and evolves. As such, these results only apply if the typical timescale for panspermia is much shorter than the dynamical timescale of a galaxy. Third, although we have used one of the best mock Milky-Way proxies available, some differences exist between the actual Milky Way and g15784, which may lead to differences in panspermia probability. For example, our mock galaxy has a larger value of bulge-to-disc light ratio than the actual Milky Way (Brook et al., 2012), and the galactic bulge has been suggested to be well-suited for panspermia (e.g., Chen et al., 2018; Balbi et al., 2020). Finally, higher-resolution galaxy simulations with proper implementation of large-scale effects may provide a more realistic estimation of panspermia probability by, among other things, not having to account for self panspermia (e.g., Schaye et al., 2015; Crain et al., 2015; Lee et al., 2021).
References
- Adams & Spergel (2005) Adams, F. C., & Spergel, D. N. 2005, Astrobiology, 5, 497, doi: 10.1089/ast.2005.5.497
- Allen et al. (2006) Allen, P. D., Driver, S. P., Graham, A. W., et al. 2006, MNRAS, 371, 2, doi: 10.1111/j.1365-2966.2006.10586.x
- Anders & Fritze-v. Alvensleben (2003) Anders, P., & Fritze-v. Alvensleben, U. 2003, A&A, 401, 1063, doi: 10.1051/0004-6361:20030151
- Arrhenius & Borns (1908) Arrhenius, S., & Borns, H. 1908, Worlds in the making; the evolution of the universe
- Balbi et al. (2020) Balbi, A., Hami, M., & Kovac̆ević, A. 2020, Life, 10, doi: 10.3390/life10080132
- Brook et al. (2012) Brook, C. B., Stinson, G. S., Gibson, B. K., et al. 2012, MNRAS, 426, 690, doi: 10.1111/j.1365-2966.2012.21738.x
- Bruzual & Charlot (2003) Bruzual, G., & Charlot, S. 2003, MNRAS, 344, 1000, doi: 10.1046/j.1365-8711.2003.06897.x
- Burchell (2007) Burchell, M. 2007, Society of Photo-Optical Instrumentation Engineers (SPIE) Conference Series, Vol. 6694, Survival of microbial life under shock compression: implications for Panspermia, 669416
- Burchell et al. (2001) Burchell, M. J., Shrine, N. R. G., Mann, J., et al. 2001, Advances in Space Research, 28, 707, doi: 10.1016/S0273-1177(01)00319-2
- Burke et al. (2015) Burke, C. J., Christiansen, J. L., Mullally, F., et al. 2015, ApJ, 809, 8, doi: 10.1088/0004-637X/809/1/8
- Carroll-Nellenback et al. (2019) Carroll-Nellenback, J., Frank, A., Wright, J., & Scharf, C. 2019, AJ, 158, 117, doi: 10.3847/1538-3881/ab31a3
- Chen et al. (2018) Chen, H., Forbes, J. C., & Loeb, A. 2018, ApJ, 855, L1, doi: 10.3847/2041-8213/aaab46
- Collins et al. (2005) Collins, G. S., Melosh, H. J., & Marcus, R. A. 2005, \maps, 40, 817, doi: 10.1111/j.1945-5100.2005.tb00157.x
- Crain et al. (2015) Crain, R. A., Schaye, J., Bower, R. G., et al. 2015, MNRAS, 450, 1937, doi: 10.1093/mnras/stv725
- Crick & Orgel (1973) Crick, F. H. C., & Orgel, L. E. 1973, Icarus, 19, 341, doi: 10.1016/0019-1035(73)90110-3
- Cumming et al. (2008) Cumming, A., Butler, R. P., Marcy, G. W., et al. 2008, PASP, 120, 531, doi: 10.1086/588487
- Davenport (2016) Davenport, J. R. A. 2016, ApJ, 829, 23, doi: 10.3847/0004-637X/829/1/23
- Đošović et al. (2019) Đošović, V., Vukotić, B., & Ćirković, M. M. 2019, A&A, 625, A98, doi: 10.1051/0004-6361/201834588
- Dodd et al. (2017) Dodd, M. S., Papineau, D., Grenne, T., et al. 2017, Nature, 543, 60, doi: 10.1038/nature21377
- Dong et al. (2018) Dong, C., Jin, M., Lingam, M., et al. 2018, Proceedings of the National Academy of Science, 115, 260, doi: 10.1073/pnas.1708010115
- Ferland et al. (1998) Ferland, G. J., Korista, K. T., Verner, D. A., et al. 1998, PASP, 110, 761, doi: 10.1086/316190
- Gibson et al. (2013) Gibson, B. K., Pilkington, K., Brook, C. B., Stinson, G. S., & Bailin, J. 2013, A&A, 554, A47, doi: 10.1051/0004-6361/201321239
- Gillon et al. (2016) Gillon, M., Jehin, E., Lederer, S. M., et al. 2016, Nature, 533, 221, doi: 10.1038/nature17448
- Ginsburg et al. (2018) Ginsburg, I., Lingam, M., & Loeb, A. 2018, ApJ, 868, L12, doi: 10.3847/2041-8213/aaef2d
- Gladman et al. (2005) Gladman, B., Dones, L., Levison, H. F., & Burns, J. A. 2005, Astrobiology, 5, 483, doi: 10.1089/ast.2005.5.483
- Gobat & Hong (2016) Gobat, R., & Hong, S. E. 2016, A&A, 592, A96, doi: 10.1051/0004-6361/201628834
- Gonzalez et al. (2001) Gonzalez, G., Brownlee, D., & Ward, P. 2001, Icarus, 152, 185, doi: 10.1006/icar.2001.6617
- Gowanlock et al. (2011) Gowanlock, M. G., Patton, D. R., & McConnell, S. M. 2011, Astrobiology, 11, 855, doi: 10.1089/ast.2010.0555
- Grimaldi et al. (2021) Grimaldi, C., Lingam, M., & Balbi, A. 2021, AJ, 162, 23, doi: 10.3847/1538-3881/abfe61
- Haldane (1954) Haldane, J. B. S. 1954, in New Biology 16, ed. M. L. Johnson, M. Abercrombie, & G. E. Fogg (Harmondsworth: Penguin), 12
- He et al. (2019) He, M. Y., Ford, E. B., & Ragozzine, D. 2019, MNRAS, 490, 4575, doi: 10.1093/mnras/stz2869
- Higuchi & Kokubo (2019) Higuchi, A., & Kokubo, E. 2019, MNRAS, 2747, doi: 10.1093/mnras/stz3153
- Horneck et al. (1994) Horneck, G., Bücker, H., & Reitz, G. 1994, Advances in Space Research, 14, 41, doi: 10.1016/0273-1177(94)90448-0
- Horneck et al. (2001) Horneck, G., Rettberg, P., Reitz, G., et al. 2001, Origins of Life and Evolution of the Biosphere, 31, 527
- Housen & Holsapple (2011) Housen, K. R., & Holsapple, K. A. 2011, Icarus, 211, 856, doi: 10.1016/j.icarus.2010.09.017
- Hoyle & Wickramasinghe (1978) Hoyle, F., & Wickramasinghe, C. 1978, Lifecloud. The origin of life in the universe
- Hoyle & Wickramasinghe (1977) Hoyle, F., & Wickramasinghe, N. C. 1977, Nature, 266, 241, doi: 10.1038/266241b0
- Hoyle et al. (1986) Hoyle, F., Wickramasinghe, N. C., & Al-Mufti, S. 1986, Earth Moon and Planets, 35, 79, doi: 10.1007/BF00054136
- Hoyle et al. (1983) Hoyle, F., Wickramasinghe, N. C., Jansz, E. R., & Jayatissa, P. M. 1983, Ap&SS, 95, 227, doi: 10.1007/BF00661179
- Hughes (2003) Hughes, D. W. 2003, MNRAS, 338, 999, doi: 10.1046/j.1365-8711.2003.06157.x
- Hunter (2007) Hunter, J. D. 2007, Computing in Science & Engineering, 9, 90, doi: 10.1109/MCSE.2007.55
- Kawaguchi et al. (2013) Kawaguchi, Y., Yang, Y., Kawashiri, N., et al. 2013, Origins of Life and Evolution of the Biosphere, 43, 411, doi: 10.1007/s11084-013-9346-1
- Kennicutt (1998) Kennicutt, Robert C., J. 1998, ApJ, 498, 541, doi: 10.1086/305588
- Koike et al. (1992) Koike, J., Oshima, T., Koike, K. A., et al. 1992, Advances in Space Research, 12, 271, doi: 10.1016/0273-1177(92)90182-W
- Kopparapu et al. (2013) Kopparapu, R. K., Ramirez, R., Kasting, J. F., et al. 2013, ApJ, 765, 131, doi: 10.1088/0004-637X/765/2/131
- Krijt et al. (2017) Krijt, S., Bowling, T. J., Lyons, R. J., & Ciesla, F. J. 2017, ApJ, 839, L21, doi: 10.3847/2041-8213/aa6b9f
- Kroupa et al. (1993) Kroupa, P., Tout, C. A., & Gilmore, G. 1993, MNRAS, 262, 545, doi: 10.1093/mnras/262.3.545
- Kruijssen et al. (2019) Kruijssen, J. M. D., Pfeffer, J. L., Reina-Campos, M., Crain, R. A., & Bastian, N. 2019, MNRAS, 486, 3180, doi: 10.1093/mnras/sty1609
- Lee et al. (2021) Lee, J., Shin, J., Snaith, O. N., et al. 2021, ApJ, 908, 11, doi: 10.3847/1538-4357/abd08b
- Li & Draine (2001) Li, A., & Draine, B. T. 2001, ApJ, 554, 778, doi: 10.1086/323147
- Licquia & Newman (2015) Licquia, T. C., & Newman, J. A. 2015, ApJ, 806, 96, doi: 10.1088/0004-637X/806/1/96
- Lin & Loeb (2015) Lin, H. W., & Loeb, A. 2015, ApJ, 810, L3, doi: 10.1088/2041-8205/810/1/L3
- Lineweaver et al. (2004) Lineweaver, C. H., Fenner, Y., & Gibson, B. K. 2004, Science, 303, 59, doi: 10.1126/science.1092322
- Lingam (2016) Lingam, M. 2016, MNRAS, 455, 2792, doi: 10.1093/mnras/stv2533
- Lingam & Loeb (2017) Lingam, M., & Loeb, A. 2017, Proceedings of the National Academy of Science, 114, 6689, doi: 10.1073/pnas.1703517114
- Lingam & Loeb (2018) —. 2018, AJ, 156, 193, doi: 10.3847/1538-3881/aae09a
- Lingam & Loeb (2021) Lingam, M., & Loeb, A. 2021, Life in the Cosmos: From Biosignatures to Technosignatures (Harvard University Press)
- Mamajek (2017) Mamajek, E. 2017, Research Notes of the American Astronomical Society, 1, doi: 10.3847/2515-5172/aa9bdc
- Mastrapa et al. (2001) Mastrapa, R. M. E., Glanzberg, H., Head, J. N., Melosh, H. J., & Nicholson, W. L. 2001, Earth and Planetary Science Letters, 189, 1, doi: 10.1016/S0012-821X(01)00342-9
- McKinney (2010) McKinney, W. 2010, in Proceedings of the 9th Python in Science Conference, ed. S. van der Walt & J. Millman, 51 – 56
- McMillan (2011) McMillan, P. J. 2011, MNRAS, 414, 2446, doi: 10.1111/j.1365-2966.2011.18564.x
- Meech et al. (2017) Meech, K. J., Weryk, R., Micheli, M., et al. 2017, Nature, 552, 378, doi: 10.1038/nature25020
- Melosh (1988) Melosh, H. J. 1988, Nature, 332, 687, doi: 10.1038/332687a0
- Melosh (2003) —. 2003, Astrobiology, 3, 207, doi: 10.1089/153110703321632525
- Mojzsis et al. (1996) Mojzsis, S. J., Arrhenius, G., McKeegan, K. D., et al. 1996, Nature, 384, 55, doi: 10.1038/384055a0
- Naidu et al. (2021) Naidu, R. P., Conroy, C., Bonaca, A., et al. 2021, arXiv e-prints, arXiv:2103.03251. https://arxiv.org/abs/2103.03251
- Napier (2004) Napier, W. M. 2004, MNRAS, 348, 46, doi: 10.1111/j.1365-2966.2004.07287.x
- Neukum & Ivanov (1994) Neukum, G., & Ivanov, B. A. 1994, in Hazards Due to Comets and Asteroids, ed. T. Gehrels, M. S. Matthews, & A. M. Schumann, 359
- Nickerson et al. (2013) Nickerson, S., Stinson, G., Couchman, H. M. P., Bailin, J., & Wadsley, J. 2013, MNRAS, 429, 452, doi: 10.1093/mnras/sts348
- Onofri et al. (2012) Onofri, S., de la Torre, R., de Vera, J.-P., et al. 2012, Astrobiology, 12, 508, doi: 10.1089/ast.2011.0736
- Osterbrock & Ferland (2006) Osterbrock, D. E., & Ferland, G. J. 2006, Astrophysics of gaseous nebulae and active galactic nuclei
- Pasini & Price (2015) Pasini, J. L. S., & Price, M. C. 2015, in Lunar and Planetary Science Conference, Lunar and Planetary Science Conference, 2725
- Petigura et al. (2013) Petigura, E. A., Marcy, G. W., & Howard, A. W. 2013, ApJ, 770, 69, doi: 10.1088/0004-637X/770/1/69
- Pilkington et al. (2012) Pilkington, K., Few, C. G., Gibson, B. K., et al. 2012, A&A, 540, A56, doi: 10.1051/0004-6361/201117466
- Prantzos (2008) Prantzos, N. 2008, Space Sci. Rev., 135, 313, doi: 10.1007/s11214-007-9236-9
- Price et al. (2013) Price, M. C., Solscheid, C., Burchell, M. J., et al. 2013, Icarus, 222, 263, doi: 10.1016/j.icarus.2012.10.035
- Pritchet et al. (2008) Pritchet, C. J., Howell, D. A., & Sullivan, M. 2008, ApJ, 683, L25, doi: 10.1086/591314
- Raskin et al. (2009) Raskin, C., Scannapieco, E., Rhoads, J., & Della Valle, M. 2009, ApJ, 707, 74, doi: 10.1088/0004-637X/707/1/74
- Sarantopoulou et al. (2011) Sarantopoulou, E., Gomoiu, I., Kollia, Z., & Cefalas, A. C. 2011, Planet. Space Sci., 59, 63, doi: 10.1016/j.pss.2010.11.002
- Schaye et al. (2015) Schaye, J., Crain, R. A., Bower, R. G., et al. 2015, MNRAS, 446, 521, doi: 10.1093/mnras/stu2058
- Secker et al. (1994) Secker, J., Lepock, J., & Wesson, P. 1994, Ap&SS, 219, 1, doi: 10.1007/BF00657856
- Secker et al. (1996) Secker, J., Wesson, P. S., & Lepock, J. R. 1996, JRASC, 90, 184. https://arxiv.org/abs/astro-ph/9607139
- Shen et al. (2010) Shen, S., Wadsley, J., & Stinson, G. 2010, MNRAS, 407, 1581, doi: 10.1111/j.1365-2966.2010.17047.x
- Simon et al. (2017) Simon, J. B., Armitage, P. J., Youdin, A. N., & Li, R. 2017, ApJ, 847, L12, doi: 10.3847/2041-8213/aa8c79
- Snaith et al. (2016) Snaith, O. N., Bailin, J., Gibson, B. K., et al. 2016, MNRAS, 456, 3119, doi: 10.1093/mnras/stv2788
- Spergel et al. (2007) Spergel, D. N., Bean, R., Doré, O., et al. 2007, ApJS, 170, 377, doi: 10.1086/513700
- Stapleton (1930) Stapleton, O. 1930, Last and First Men: A Story of the Near and Far Future, London: Methuen
- Stewart et al. (2008) Stewart, K. R., Bullock, J. S., Wechsler, R. H., Maller, A. H., & Zentner, A. R. 2008, ApJ, 683, 597, doi: 10.1086/588579
- Stinson et al. (2006) Stinson, G., Seth, A., Katz, N., et al. 2006, MNRAS, 373, 1074, doi: 10.1111/j.1365-2966.2006.11097.x
- Stinson et al. (2010) Stinson, G. S., Bailin, J., Couchman, H., et al. 2010, MNRAS, 408, 812, doi: 10.1111/j.1365-2966.2010.17187.x
- Stöffler et al. (2007) Stöffler, D., Horneck, G., Ott, S., et al. 2007, Icarus, 186, 585, doi: 10.1016/j.icarus.2006.11.007
- van Zuilen et al. (2002) van Zuilen, M. A., Lepland, A., & Arrhenius, G. 2002, Nature, 418, 627, doi: 10.1038/nature00934
- Virtanen et al. (2020) Virtanen, P., Gommers, R., Oliphant, T. E., et al. 2020, Nature Methods, 17, 261, doi: https://doi.org/10.1038/s41592-019-0686-2
- Wadsley et al. (2004) Wadsley, J. W., Stadel, J., & Quinn, T. 2004, New A, 9, 137, doi: 10.1016/j.newast.2003.08.004
- Wadsley et al. (2008) Wadsley, J. W., Veeravalli, G., & Couchman, H. M. P. 2008, MNRAS, 387, 427, doi: 10.1111/j.1365-2966.2008.13260.x
- Wallis & Wickramasinghe (2004) Wallis, M. K., & Wickramasinghe, N. C. 2004, MNRAS, 348, 52, doi: 10.1111/j.1365-2966.2004.07355.x
- Weber & Greenberg (1985) Weber, P., & Greenberg, J. M. 1985, Nature, 316, 403, doi: 10.1038/316403a0
- Wells et al. (2003) Wells, L. E., Armstrong, J. C., & Gonzalez, G. 2003, Icarus, 162, 38, doi: 10.1016/S0019-1035(02)00077-5
- Wesson (2010) Wesson, P. S. 2010, Space Sci. Rev., 156, 239, doi: 10.1007/s11214-010-9671-x
- Wickramasinghe & Wickramasinghe (2003) Wickramasinghe, N. C., & Wickramasinghe, J. T. 2003, Ap&SS, 286, 453, doi: 10.1023/A:1026352911978
- Yamagishi et al. (2018) Yamagishi, A., Kawaguchi, Y., Hashimoto, H., et al. 2018, Astrobiology, 18, 1369, doi: 10.1089/ast.2017.1751
- Zackrisson et al. (2016) Zackrisson, E., Calissendorff, P., González, J., et al. 2016, ApJ, 833, 214, doi: 10.3847/1538-4357/833/2/214
- Zechmeister et al. (2019) Zechmeister, M., Dreizler, S., Ribas, I., et al. 2019, A&A, 627, A49, doi: 10.1051/0004-6361/201935460
Appendix A Escape fractions and weights
In the case of natural panspermia, we assume that life first develops on the surface of a planet within its star HZ, and that spores are then ejected from it by high velocity impacts. In general, few fragments reach planetary escape velocity and none stellar escape velocity. For interstellar panspermia to happen, therefore, the fragments must be accelerated by unspecified processes, which we assume only depend on the host mass star through its escape velocity within the HZ. Fig. 14 shows the distribution of fragment velocities after impact and the (arbitrarily-scaled) stellar escape fraction. Fig. 15 shows the evolution of the escape fraction over time, assuming that the frequency of impacts follows the one derived from Lunar cratering (Neukum & Ivanov, 1994):
| (A1) |
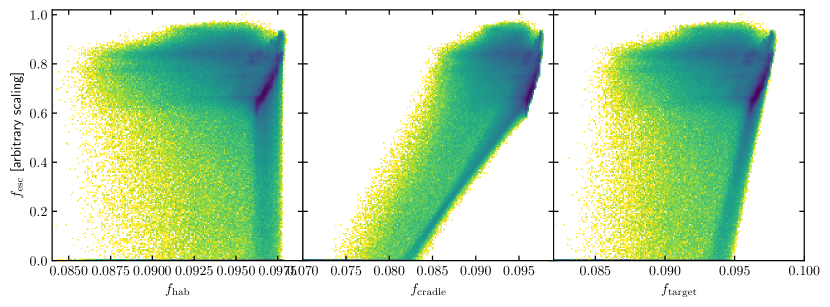
where the current age of the Earth. Finally, Fig. 16 shows the distribution of escape fractions computed for star particles, as a function of their galactocentric distance, and Fig. 17 their correlation with habitability. There exists a strong correlation and habitability within the DiskHalo region, whereas star particles in the CentralDisk tend to have lower due to their higher metallicities. Interestingly, rather sharp linear lower boundaries exist in both - and - parameter spaces, where most of goes to zero at and (Fig. 17). Finally, the Spheroids show a radial distribution of similar to that of the main galaxy, though at smaller scale.

Appendix B Unnormalized panspermia probabilities
Fig. 18 shows the cumulative probabilities of of g15784 at . In both cases, the overall shape of the probability distribution is similar to those of , mainly due to the narrow range of . Specifically, follows a power-law relation of for , falling to (nearly) zero for . On the other hand, is nearly zero for and plateaus at around and for and , respectively. We note that the cumulative probability does not exceed 70% in g15784 because the remaining 30% of star particles have zero habitabilites.
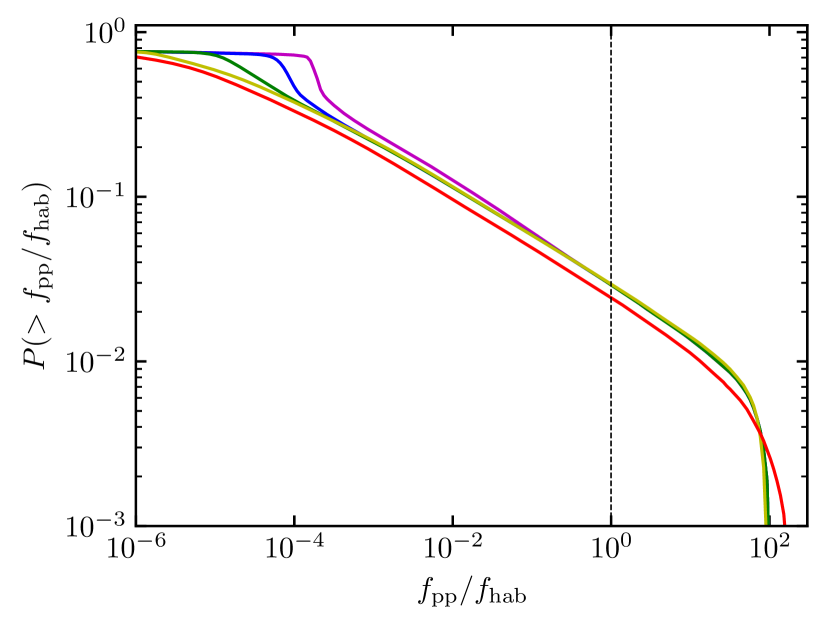
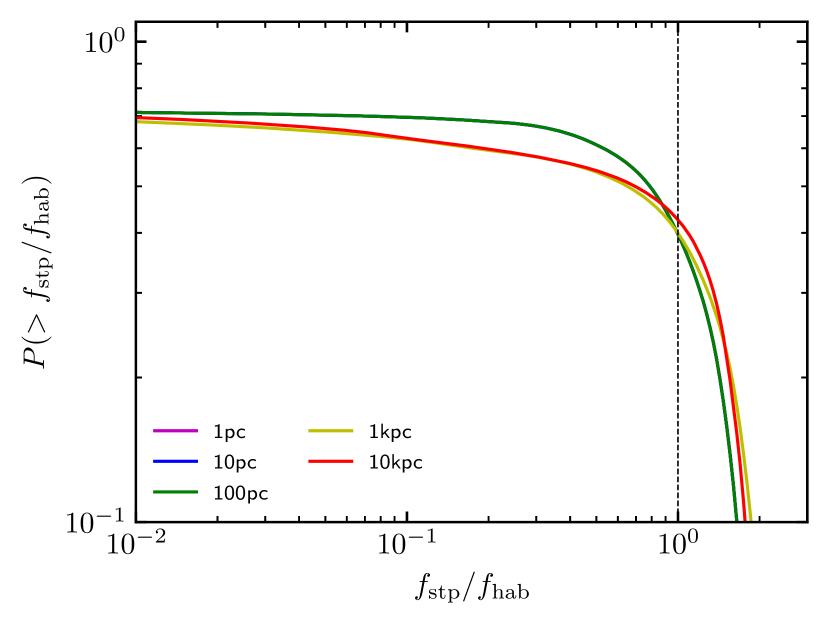
Table 1 shows probabilities of for various values . The probability of star particles with is much lower than the naïve expectation that . For example, when , i.e., the total panspermia probability and total habitability is the same, only 3% of star particles have , rather than half as would be expected. In fact, occurs only at very high values of . This ensures that only a tiny fraction of star particles dominate the panspermia process of the entire galaxy. On the other hand, matches better the naïve expectation for values of .
| 0 | ||
| 1% | 0 | |
| 3% | 40% | |
| 6% | 70% | |
| 10% | 70% | |
| 20% | 70% | |
| 70% | 70% |