Bridge in micron-sized Bi2Sr2CaCu2O8+y sample act as converging lens for vortices
Abstract
We report on direct imaging of vortex matter nucleated in micron-sized Bi2Sr2CaCu2O8+y superconducting samples that incidentally present a bridge structure. We find that when nucleating vortices in a field-cooling condition the deck of the bridge acts as a converging lens for vortices. By means of Bitter decoration images allowing us to quantify the enhancement of vortex-vortex interaction energy per unit length in the deck of the bridge, we are able to estimate that the deck is thinner than m. We show that the structural properties of vortex matter nucleated in micron-sized thin samples are not significantly affected by sample-thickness variations of the order of half a micron, an important information for type-II superconductors-based mesoscopic technological devices.
pacs:
I Introduction
The miniaturization of technological devices have driven the study on how the confinement and surface effects alter the physical properties of systems of interacting objects. Coombes1972 ; Goldstein1992 ; Tolbert1994 ; Guisbiers2009 ; Dolz2019 Nucleating small crystals of vortex matter in micron-sized superconducting samples gives us the possibility of studying this general problem in a playground where the relevant parameters are easily controlled. Indeed, the density of interacting objects can be tuned by applied field, the interaction of vortices with the underlying disorder of the host sample can be altered by changing temperature, and the confinement and surface effects can be tailored by a suitable design of the samples. Moshchalkov1995 ; Geim1997 ; Palacios1998 ; Schweigert1998 ; Wang2001 ; Dolz2015 There is sufficient evidence in the literature that size and surface effects in micron-sized superconducting samples produce dramatic changes on their physical properties. For instance, for type-I superconductors of one-micron or sub-micron size, the boundary conditions imposed by the shape and geometry of the sample to the quantization of angular momentum of the Cooper pair wave function govern the superconducting phase boundary, and stabilizes a complex phase diagram with several confinement-induced transitions. Moshchalkov1995 ; Geim1997 In the case of micron-sized type-II superconductors, changing the applied field induces not only different regimes in the magnetic response of the system, but can also trigger a structural transition in vortex matter from a giant vortex state with multiple flux quanta to a glass state with single-fluxoid vortices. Palacios1998 ; Schweigert1998
On increasing the sample size to tens of microns, and then nucleating crystals with few hundred vortices, some works report on how the thermodynamic, magnetic, and structural properties of vortex matter are significantly different from the bulk case. Dolz2019 ; Wang2001 ; Dolz2015 ; Wang2002 ; Dolz2014b ; Cejas2015 ; Ooi2017 ; Cejas2017 These works warn on a need of better characterizing these properties for potential applications of these systems to miniaturized superconducting devices. Regarding the structural properties, a proliferation of topological defects induced by confinement has been reported for crystals with few hundred vortices in the case of the layered Bi2Sr2CaCu2O8+y system. Cejas2015 ; Cejas2017 For thin micron-sized disks, topological defects in the vortex structure proliferate on decreasing the radius from 50 to 30 m and also present an inhomogeneous spatial distribution. Cejas2017 At the vicinity of the edge, the number of defects amplifies over a characteristic length in which vortex rows tend to bend mimicking the shape of the sample. In contrast, within the center of the samples the positional order of the vortex structure is consistent with the Bragg-glass phase. This healing length at which topological defects are cured towards the center may be a key quantity to model confinement effects in vortex matter nucleated in micron-sized samples. The geometry of samples is also another parameter that affects the structural properties of vortex crystals at the mesoscopic scale. For example, a smaller density of topological defects is nucleated in square than disk thin mesoscopic samples of the same typical size. In addition, in the former case the vortex rows accommodate parallel to the edges without bending. Cejas2015
Previous studies have reported data in samples with a constant thickness, then very little is known about the effect of varying the sample thickness in micron-sized samples. In order to amplify the effect of sample thickness variations, it is desirable to choose a superconducting material with large line energy per unit length, . A material such as Bi2Sr2CaCu2O8+y, with , seems a suitable candidate for studying this issue. Vortex matter in bulk samples of this material presents a rich phase diagram that includes liquid and glassy phases with different magnetic Pastoriza ; Zeldov ; Nelson ; Avraham ; Dolz2014 and structural properties Fasano1999 ; Fasano2005 ; AragonSanchez2019 ; AragonSanchez2020 depending on the type of disorder of the host sample. In this paper we study the structural properties of vortex matter in micron-sized thickness-modulated samples of the extremely-anisotropic pristine Bi2Sr2CaCu2O8+y superconductor. We directly image the -vortices crystal nucleated in a square thin sample of roughly 40 m side and 2 m thickness that incidentally presents a bridge structure. We find that when nucleating vortices in a field-cooling condition the deck of the bridge acts as a converging lens for vortices. Irrespective of the higher vortex density in the bridge than in the base, the structural properties of vortex matter in both regions are not significantly dissimilar. By means of energetic arguments we estimate that the deck of the bridge is m thick or even thinner. This quantitative estimation allows us to measure a top limit on how thin can be the samples in order for the structure of vortex crystals in mesoscopic thin samples not being significantly affected by sample-thickness variations and still behaving as a three-dimensional structure.
II Method
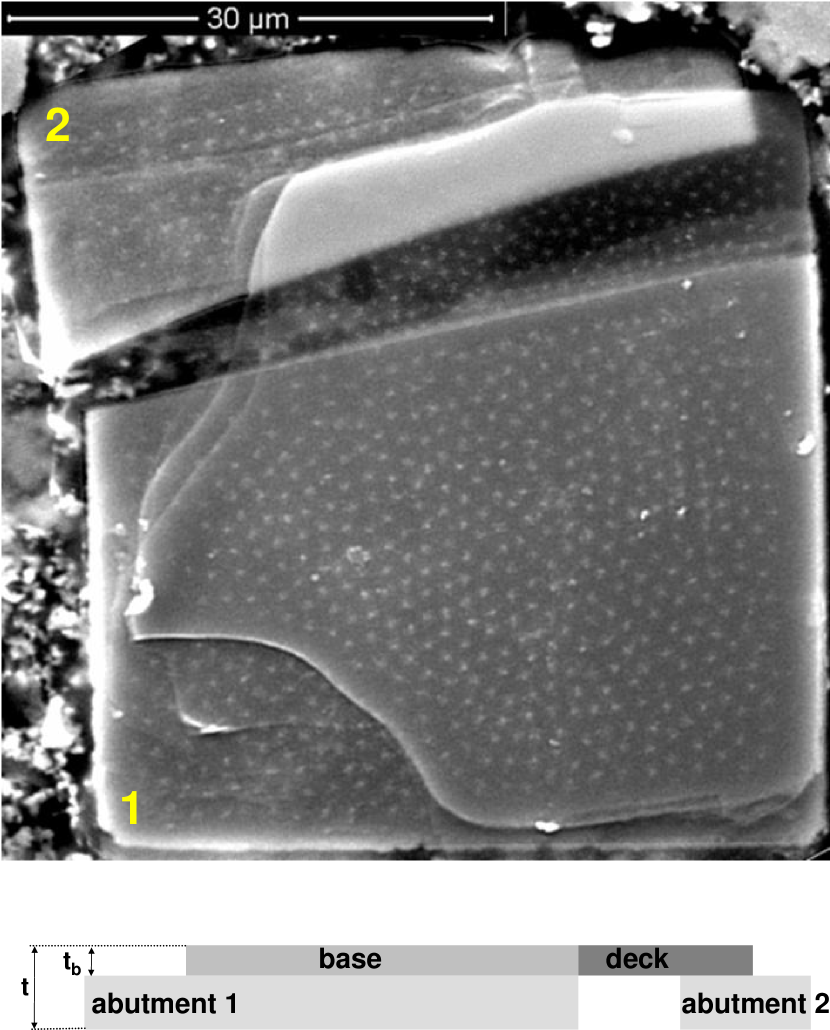
The micron-sized square thin sample with a bridge structure was engineered from a bulk, pristine, and optimally-doped Bi2Sr2CaCu2O8+y crystal with a critical temperature K. The sample was obtained following a top-down procedure that combines optical lithography with physical ion-milling, see Refs. Dolz2015, ; Dolz2019, for further technical details. With the aim of directly imaging the vortex structure nucleated in such samples, we cleave the physically-etched bulk crystal, then manipulate one by one the micron-sized samples and glue them with conducting epoxy onto a scanning electron microscope sample holder. The sample studied in this work belongs to a batch of square thin samples with nominally 40 m side and m thickness. During the gluing process, pressure is applied with a micro-manipulator in order to ensure good thermal and electrical conductivity. Since Bi2Sr2CaCu2O8+y is an easily cleavable and fragile material, many micron-sized samples break or crack during the gluing process. By serendipity, the one that we study in this paper broke, but only in the bottom part. During the gluing process both pieces, labeled as abutments 1 and 2 in Fig. 1, were in-plane split less than 10 m. The top part of the sample remained attached to the larger abutment, number 1. As shown in Fig. 1, this resulted in a sample with a bridge-like structure with a trapezoidal bridge deck of m width and m length. The base of the bridge is the larger region of the sample observed at the middle-bottom of Fig. 1 and presents an irregular and curved step (see bottom-left) that exposes the abutment 1 to which the base remained attached. The deck of the bridge has a thickness and in the base region the sample has the nominal thickness m, see the schematic lateral representation of the sample at the bottom of Fig. 1. The part of the sample where the deck settles on top of abutment 2 is observed as a very bright region in this scanning electron microscopy (SEM) image. The difference in contrast with the rest of the sample might come from this region being charged by the electron beam, namely not being able to discharge the electrons to the sample holder (ground) due to a bad electrical conductivity with the rest of the sample. It is rather ubiquitous to observe this flake-like edges when cleaving layered Bi2Sr2CaCu2O8+y samples.
We image the vortex structure in real space and with single vortex resolution by means of the magnetic decoration technique. Fasano2003 For the case studied here, we nucleated the vortex structure in a field-cooling condition applying a field of 12 Oe in the normal state and cooling down to the decoration temperature of 4.2 K. The vortex decoration consists in evaporating nm size Fe particles in a sealed chamber submerged in a 4He bath. Inside the chamber the Fe particles collide and form clusters of size controlled by the He-exchange gas pressure. The Fe nanoparticles are attracted towards the vortex cores impinging at the sample surface due to the magnetic force generated by the vortex-induced local field gradient. Once the Fe particles decorate the vortex positions, the sample is warmed up and the Fe particles that remain attached to the surface due to van der Waals forces (see white dots in Fig. 1) are observed with a scanning electron microscope at room temperature.
III Results
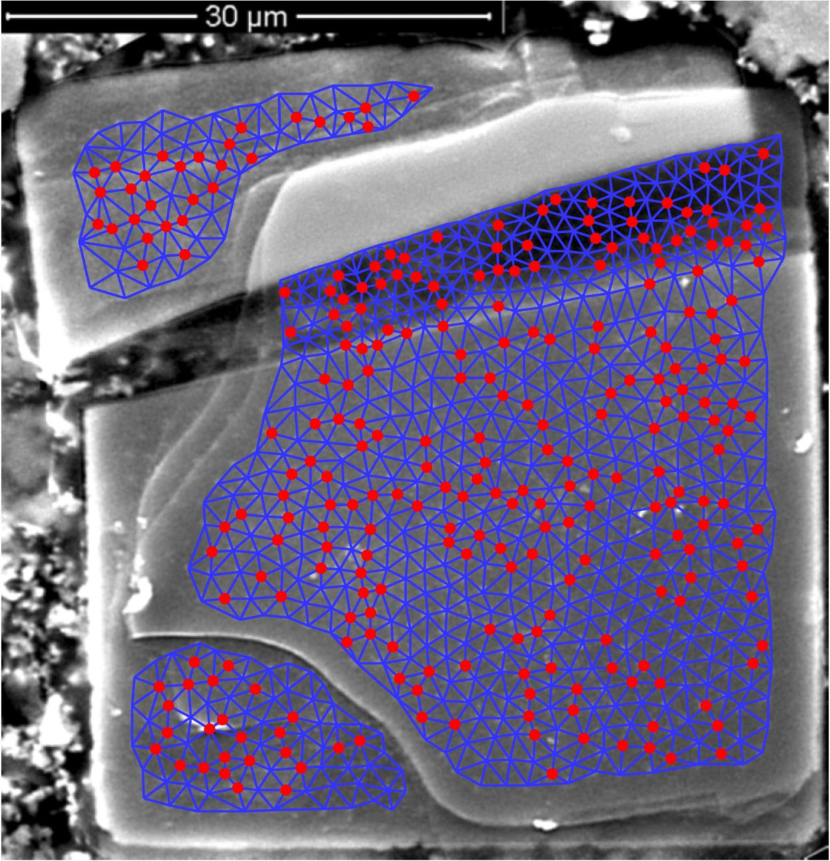
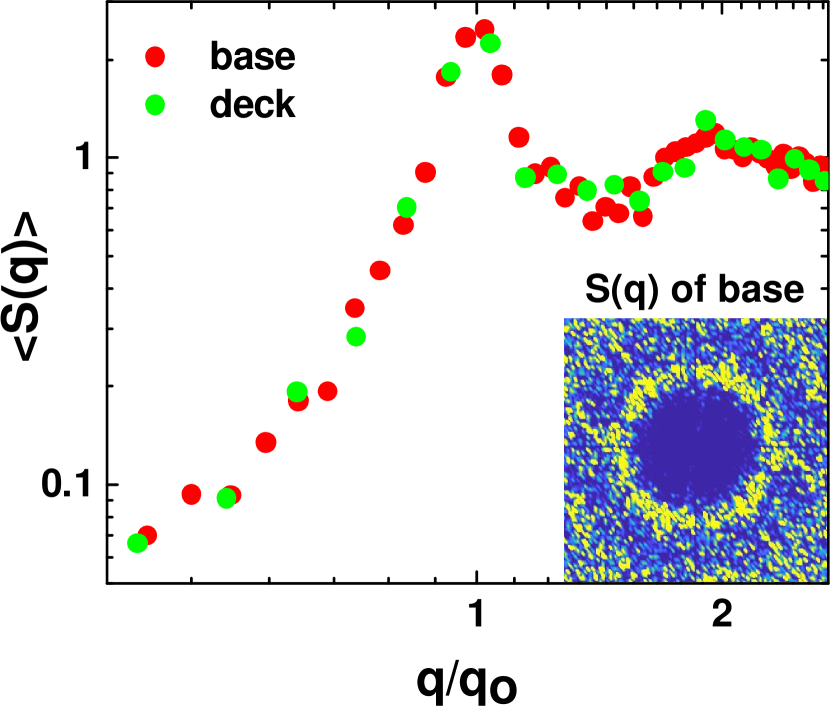
Figure 1 shows a snapshot of the vortex structure nucleated in the micron-sized Bi2Sr2CaCu2O8+y square sample with a bridge structure, following a field-cooling process at an applied field of 12 Oe. The picture is obtained from a magnetic decoration performed at 4.2 K and vortices are observed as white dots in the SEM image of Fig. 1. The most notorious fact of this snapshot is that the bridge structure acts as a converging lens for the vortex structure: The average vortex density in the deck is 15 G whereas in the base is 10 G, and in abutments 1 and 2 is of 10 and 9 G, respectively. The average vortex density in the whole sample is 11 G. The region where the deck settles on top of abutment 2 is observed as a bright region where vortices (white dots) are not resolved from the background. Figure 2 shows that only the vortices located at the very bottom part of this region are resolved. This might be due to the sample getting charged by the electron beam due to poor electrical contact with the below abutment, as mentioned.
Figure 2 shows the same image than in Fig. 1 but with the Delaunay triangulation of the vortex structure superimposed. The triangulation shows each vortex bonded to its first-neighbors with blue lines. Non-sixfold coordinated vortices are highlighted with red circles. This figure makes clear that at the bottom of the deck of the bridge vortices are aligned along it. Nevertheless, this construction also shows that there is not a strong correlation between the nucleation of grain boundaries and variations in the sample thickness, either due to steps as in the bottom-left part, or to the thickness reduction at the deck of the bridge. The vortex structure is polycrystalline in the whole sample with crystallites formed by 10-20 vortices. The density of topological defects, namely the ratio of the non-sixfold coordinated to the total number of vortices, is of % in the deck and % in the base regions of the sample. Most of topological defects form grain boundaries and a few isolated edge dislocations. Then, the focusing effect produced in the deck of the bridge entails a moderate enhancement of topological defects in the deck, probably produced by the combined effect of the density change with a structure aligned along the bottom part of the deck.
It is important to point out that the vortex structure nucleated at 12 Oe in bulk Bi2Sr2CaCu2O8+y samples is also polycrystalline since vortex interaction is weak at such low fields. AragonSanchez2019 ; AragonSanchez2020 Nevertheless, for a vortex structure with larger interaction energy (applied fields of Oe), previous works in bulk Bi2Sr2CaCu2O8+y samples show that steps in the surface act as grain-boundary nucleation centers, Dai1994 in contrast to data in NbSe2. Pardo1997 This difference in vortex structure behavior in both materials has been ascribed to the larger line energy (larger ) of Bi2Sr2CaCu2O8+y than of NbSe2. Pardo1997
Aside from the converging lens effect of the bridge structure and the difference in topological defects, the positional order of vortex matter nucleated in the deck and the base with different thicknesses are alike. We characterize the positional order computing the angularly-averaged structure factor of vortex matter in both regions. This magnitude results from angularly-averaging the two-dimensional structure factor at a given circular region. The latter is obtained by computing , with the Fourier transform of the discrete vortex density detected at the sample surface. An example of is shown in the insert to Fig. 3. The angularly-averaged structure factor for the deck and base regions are alike: Both present a peak at the average first-neighbor distance (traduced in reciprocal space as with and the Bragg wave-vector), and decay algebraically at low -values. These findings are presented in the main panel of Fig. 3 showing the for both regions of the sample.
IV Discussion
The focusing effect occurs probably at the beginning of the field cooling process. Even though the decoration of vortex positions is performed at 4.2 K, in a field-cooling process this technique actually captures a snapshot of the vortex structure frozen at a temperature close to the irreversibility line. Fasano2005 At the irreversibility temperature , weak bulk pinning sets in and then the vortex structure is frozen at lengthscales of the lattice spacing . On further cooling, vortices are able to explore the sample only within distances smaller than the range of the pinning potential, , with the penetration depth and also the spatial resolution of the magnetic decoration technique. On nucleating vortices at high temperatures, in the liquid vortex phase bulk pinning is not relevant and the nucleation of a denser structure in the deck can be understood just by considering vortex-vortex interaction energy arguments exclusively. Since the interaction energy between vortices is equal to the interaction energy per unit length, , times the thickness of the region of the sample, a denser structure with larger can be stabilized in a significantly thinner region of the sample.
The possibility of this focusing effect being marginally produced by a stronger screening in the thicker abutments has to be considered. A sample-thickness variation induced screening effect was long ago observed in field-ramping experiments in superconducting weak links of Al thin films. Dolan1977 Indeed, the flux penetration can be inhomogeneous in thin mesoscopic samples of thickness and width comparable to since the London limit with is no longer applicable for these geometries. Landau1960 In these type of samples, within the London model but taking , the relevant length-scale for magnetic field penetration is the Pearl length . For some particular sample geometries and ratios, numerical solutions to the thickness-dependent current distribution in thin mesoscopic samples have been theoretically obtained. Brandt2001 ; Plourde2001 ; Mawatari2012 ; Via2013 These works consider the case of flux penetration in the Meissner state Mawatari2012 ; Via2013 , or for low fields close to the Meissner-mixed state transition Brandt2001 , and all of them study flux penetration in the non-static case of ramping field. Brandt2001 ; Plourde2001 ; Mawatari2012 ; Via2013 In contrast, the experimental situation reported here correspond to vortices nucleated at fields way larger than the effective at high temperatures, then cooling without changing the vortex density. For the presently studied field-cooling experimental situation, the effect of a thickness-variation-induced inhomogeneous flux penetration due to an enhancement of screening currents in the thicker region of the sample is expected to be significantly reduced. Detailed theoretical work in the mixed state in field-cooling conditions is mandatory to asses if the mentioned effect is suppressed completely, but since that is beyond the aim of our paper we will consider as expected that it is a marginal effect.
The focusing effect entails a local decrease of inter-vortex distance and then an enhancement of vortex-vortex interaction energy per unit length, . For every single i-th vortex, in the case of a large superconductor such as Bi2Sr2CaCu2O8+y, and for low vortex densities as in our case, this magnitude can be computed as
In this expression is the vortex line tension, Gcm2 the magnetic flux quantum, is the lowest-order modified Bessel function, and the separation between vortex and its neighbors . The sum in this expression runs over all the remaining vortices of the structure. In macroscopic samples this sum becomes numerically expensive to compute and since strongly decays with , typically a proper cut-off is considered in the calculation. In the case of our structure of vortices, we considered all the digitalized vortices shown in Fig. 2 to calculate . For this calculation we have considered m. This value is obtained from taking into account the evolution reported in Ref. Kees, for bulk pristine Bi2Sr2CaCu2O8+y samples, and from considering that K for a vortex structure nucleated with an applied field of 12 Oe. Dolz2014
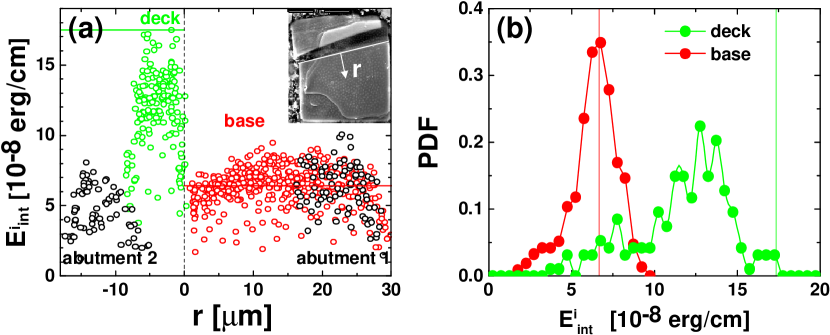
Figure 4 (a) shows the interaction energy per unit length of every vortex sorted as a function of the distance between the vortex and the bottom part of the deck (). The insert to this figure shows a schematic representation on how this distance is computed. As indicated with the legends, red data points correspond to vortices in the base region, green ones to vortices in the deck and black ones to the abutments 1 and 2. Another token of the focusing effect in the deck of the bridge is that is significantly larger for vortices there than in the base and abutments regions. Indeed, the average value of this magnitude is 12.2 in the deck against 6.4 erg/cm in the base (see red line). A similar mean value of 6.4, and a slightly smaller of erg/cm, are found in the abutments 1 and 2 regions, respectively. This implies that the thicknesses of the abutments are quite close to that of the base region. The panel (b) of Fig. 4 shows the probability density function (PDF) of the distribution of for individual vortices in the deck and base regions (green and red points respectively). As already visible in panel (a), the distribution of this magnitude has not only a larger mean value but also a larger standard deviation in the deck (24 %) than in the base (18 %).
Since at the freezing temperature of the vortex structure the volume interaction energy has to be roughly the same in the whole sample, the difference in the interaction energy per unit length in the deck and base regions can be taken into account to estimate the thickness of the deck . Then, the maximum energy observed in the deck times its thickness can not be larger than the volume energy in the base, namely
where we have estimated the volume energy in the base from the average value of the interaction energy per unit length, . Taking into account the maximum and average values shown with green and red lines in Fig. 4, we get m considering the nominal thickness of the sample. It is important to realize that this numerical value for the upper bound of is in addition overestimated: Due to the lack in contrast in the SEM picture we were not able to digitalize all vortices in the brighter region on top of the deck, and then the for vortices in the deck is underestimated since the contribution of half of its neighbors is missing. Nevertheless, since rapidly decays at even two lattice spacings, the contribution from the non-detected vortices would imply only a % enhancement of interaction energy for vortices in the deck. We estimated this percentage by simulating different configurations of artificially-added vortices in the brighter region with a density equal to that of the base region. We would like to point out that similar energetic arguments have been considered by other authors in the case of blind microholes Bezryadin1996 and pillar-like antipinning centers Berdiyorov2008 in Nb samples, but in order to explain the observed vortex arrangements, not to quantify the sample thickness variation as we do here.
Finally, we would like to mention that this estimation neglects any possible effect of vortices bending along the sample, namely they are considered as straight lines. This seems to be a reasonable assumption since small-angle neutron scattering data in bulk Bi2Sr2CaCu2O8+y samples indicate that at low fields the correlation length longitudinal to the direction of vortices is m. AragonSanchez2019 In addition, this calculation does also not consider any difference in the vortex pinning energy that might have the deck and base regions.
V Conclusion
In conclusion, we have found that micron-sized samples of type-II superconductors presenting a bridge-like structure might be effective converging lens devices focusing vortex density in the deck of the sample. Here we reveal this effect in the case of a -vortices structure with a 11 G density nucleated in a mesoscopic thin Bi2Sr2CaCu2O8+y sample with 40 m side, 2 m nominal thickness, and presenting a bridge with a m-thick deck. We find that in this material with large line energy this converging effect is due to the thickness reduction at the deck allowing a larger interaction energy per unit length while conserving the volume interaction energy. We also find that both, in the base and deck regions of the sample, the structural properties of vortex matter present similar orientational (polycrystalline) and positional order. By means of energetic arguments we provide an (over)estimation of the upper bound of the thickness of the deck of the bridge of m. This thickness is also an upper bound for the structure of mesoscopic vortex structures still behaving as three-dimensional and not being dramatically affected by sample-thickness variations. This is an important finding in the vortex physics of micron-sized type-II superconducting devices intended for technological applications: Different ranges of sample thickness and lateral size, applied field, material anisotropy, and temperature, can produce extremely-anisotropic vortices to behave as three or two dimensional entities, the latter being more easy to manipulate.
Acknowledgements.
This work was supported by the Argentinean National Science Foundation (ANPCyT) under Grant PICT 2017-2182; by the Universidad Nacional de Cuyo research grant 06/C566-2019; and by Graduate Research fellowships from IB-CNEA for J. P. and from CONICET for J.P., J. A. S., and N. R. C. B. We thank to I. Artola-Vinciguerra for assistance with SEM images, M. Li for growing the bulk single crystals from which the samples where generated, and to H. Pastoriza for support in the micro-engineering facilities at the CAB clean room.References
- (1) C. J. Coombes, J. Phys. F: Metal Phys. 2, 441 (1972).
- (2) A. N. Goldstein, C.M. Echer, and A. P. Alivisatos, Science 256, 1425 (1992).
- (3) S. H. Tolbert and A. P. Alivisatos, Science 265, 373 (1994).
- (4) G. Guisbiers and L. Buchaillot, Phys. Lett. A 374, 305 (2009).
- (5) M. I. Dolz, N. R. Cejas Bolecek, J. Puig, H. Pastoriza, G. Nieva, J. Guimpel, C. J. van der Beek, M. Konczykowski, and Y. Fasano, Phys. Rev. B 100, 064508 (2019).
- (6) V. V. Moshchalkov, L. Gielen, C. Strunk, R. Jonckheere, X. Qiu, C. Van Haesendonck, and Y. Bruynseraede, Nature (London) 373, 319 (1995).
- (7) A. K. Geim, I. V. Grigorieva, S. V. Dubonos, J. G. S. Lok, J. C. Maan, A. E. Filippov, and F. M. Peeters, Nature (London) 390, 259 (1997).
- (8) J. J. Palacios, Phys. Rev. B 58, R5948 (1998).
- (9) V. A. Schweigert, F. M. Peeters, and P. S. Deo, Phys. Rev. Lett. 81, 2783 (1998).
- (10) Y. M. Wang, M. S. Fuhrer, A. Zettl, S. Ooi, and T. Tamegai, Phys. Rev. Lett. 86, 3626 (2001).
- (11) M. I. Dolz, Y. Fasano, N. R. Cejas Bolecek, H. Pastoriza, V. Mosser, M. Li, and M. Konczykowski, Phys. Rev. Lett. 115, 137003 (2015).
- (12) Y. M. Wang, A. Zettl, S. Ooi, and T. Tamegai, Phys. Rev. B 65, 184506 (2002).
- (13) M. I. Dolz, Y. Fasano, N. R. Cejas Bolecek, H. Pastoriza, M. Konczykowski, and C. J. van der Beek, J. Phys.: Conf. Ser. 568, 022010 (2014).
- (14) N. R. Cejas Bolecek, M. I. Dolz, A. Kolton, H. Pastoriza, C. J. van der Beek, M. Konczykowski, M. Menghini, G. Nieva, and Y. Fasano, J. Low Temp. Phys. 179, 35 (2015).
- (15) S. Ooi, T. Mochiku, M. Tachiki, and K. Hirata, J. Phys.: Conf. Ser. 871, 012019 (2017).
- (16) N. R. Cejas Bolecek, M. I. Dolz, H. Pastoriza, M. Konczykowski, C. J. van der Beek, A. B. Kolton, and Y. Fasano, Phys. Rev. B 96, 024507 (2017).
- (17) H. Pastoriza, M. F. Goffman, A. Arribére, and F. de la Cruz, Phys. Rev. Lett. 72, 2951 (1994).
- (18) E. Zeldov, D. Majer, M. Konczykowski, V. B. Geshkenbein, V. M. Vinokur, and H. Shtrikman, Nature (London) 375, 373 (1995).
- (19) D. R. Nelson, Phys. Rev. Lett. 60, 1973 (1988).
- (20) N. Avraham et al., Nature 411, 451 (2001).
- (21) M. I. Dolz, Y. Fasano, N. R. Cejas Bolecek, H. Pastoriza, V. Mosser, M. Li, and M. Konczykowski, Phys. Rev. Lett. 115, 137003 (2014).
- (22) Y. Fasano, J. Herbsommer, F. de la Cruz, Phys. Stat. Sol. (b) 215, 563 (1999).
- (23) Y. Fasano, M. De Seta, M. Menghini, H. Pastoriza and F. de la Cruz, Proceed. Nat. Acad. Sci. 102, 3898 (2005).
- (24) Aragón Sánchez, J., Cortés Maldonado, R., Cejas Bolecek, N. R., Rumi, G., Pedrazzini, P., Dolz, M. I., Nieva, G., van der Beek, C. J., Konczykowski, M., Dewhurst, Ch. D., Cubbit, R., Kolton, A., Pautrat, A. & Fasano, Y., Unveiling the vortex glass phase in the surface and volume of a type-II superconductor, Comm. Phys. 2, 143 (2019).
- (25) J. Aragón Sánchez, G. Rumi, R. Cortés Maldonado, N. R. Cejas Bolecek, J. Puig, P. Pedrazzini, G. Nieva, M. I. Dolz, M. Konczykowski, C. J. van der Beek, A. B. Kolton, and Y. Fasano, Scientific Reports 10, 19452 (2020).
- (26) Y. Fasano, M. De Seta, M. Menghini, H. Pastoriza, F. De la Cruz, Solid state communications 128 (2-3), 51-56 (2003).
- (27) H. Dai, J. Liu, and C. M. Lieber, Phys. Rev. Lett. 72, 748 (1994).
- (28) F. Pardo et al., Phys. Rev. Lett. 79, 1369 (1997).
- (29) C. J. van der Beek, Thermodynamique des vortex dans les supraconducteurs desordonnes (Südwestdeutscher Verlag für Hochschulschriften, Sarrebruck, 2010).
- (30) G. J. Dolan and J. E. Lukens, IEEE Trans. Magn. 13 581 (1977).
- (31) L. D. Landau and E. M. Lifshitz, Electrodynamics of Continuous Media (Addison-Wesley, Reading, MA), (1960).
- (32) E. H. Brandt, Phys. Rev. B 64, 024505 (2001).
- (33) L. T. Plourde, D. J. Van Harlingen, D. Yu. Vodolazov, R. Besseling, M. B. S. Hesselberth, and P. H. Kes, Phys. Rev. B 64, 014503 (2001).
- (34) Y. Mawatari, C. Navau, and A. Sanchez, Phys. Rev. B 85, 134524 (2012).
- (35) G. Via, C. Navau, and A. Sánchez, Journal of App. Phys. 113, 093905 (2013).
- (36) A. Bezryadin, Y. N. Ovchinnikov, and B. Pannetier, Phys. Rev. B 53, 8553 (1996).
- (37) G. R. Berdiyorov, V. R. Misko, M. V. Miloević, W. Escoffier, I. V. Grigorieva, and F. M. Peeters Phys. Rev. B 77, 024526 (2008).