Nuclear magnetic resonance of ion implanted 8Li in ZnO
Abstract
We report on the stability and magnetic state of ion implanted 8Li in single crystals of the semiconductor ZnO using -detected nuclear magnetic resonance. At ultradilute concentrations, the spectra reveal distinct Li sites from 7.6 to 400 K. Ionized shallow donor interstitial Li is stable across the entire temperature range, confirming its ability to self-compensate the acceptor character of its (Zn) substitutional counterpart. Above 300 K, spin-lattice relaxation indicates the onset of correlated local motion of interacting defects, and the spectra show a site change transition from disordered configurations to substitutional. Like the interstitial, the substitutional shows no resolved hyperfine splitting, indicating it is also fully ionized above 210 K. The electric field gradient at the interstitial 8Li exhibits substantial temperature dependence with a power law typical of non-cubic metals.
I Introduction
For many years the electronic properties of ZnO have held substantial practical appeal. It is a transparent wide bandgap (3.4 eV) semiconductor with a large exciton binding energy (60 meV) enabling potential room temperature optoelectronic applicationsJanotti and G Van de Walle (2009); Look (2001). It can be doped magnetically, either by replacing the nonmagnetic Zn2+ with a magnetic transition metal (or, more subtly, by intrinsic magnetic defectsEsquinazi et al. (2020)) to produce a room temperature dilute magnetic semiconductorSharma et al. (2003) useful in spintronicsBotsch et al. (2019). It also exhibits many interesting surface effects including photocatalysis, adsorbate sensitive photoconductivityGurwitz et al. (2014), and a photogenerated metallic stateGierster et al. (2021). Key to realizing the potential of this remarkable range of properties is understanding and control of the point defects (both intrinsic and extrinsic) of its ideal hexagonal wurtzite structureMcCluskey and Jokela (2009). Particularly, for -type doping this has proven difficultÖzgür et al. (2005), but there are clear indications of progress in the production of LEDsRahman (2019) and even extremely high mobility epitaxial structures exhibiting the quantum Hall effectFalson and Kawasaki (2018).
Consistent and stable hole doping of ZnO is an important challenge that has remained the main barrier to implementation in optoelectronic devices. Substitution of divalent Zn for a monovalent alkali is an approach that has been studied in some detailJanotti and G Van de Walle (2009); McCluskey and Jokela (2009). While substitutional Li is an acceptor that compensates the natural -type doping to some extent, this has not led to a reliable route to -type ZnO. One reason for this is that Li is an amphoteric dopant: when interstitial it is a donor, so it can self-compensate. In addition to carrier doping, the magnetic aspect of Li defects is of interest for spin filteringEsquinazi et al. (2020). In this context, detailed experimental characterization of the structure, stability, and magnetic state of isolated Li defects would be very useful, particularly as a test of theoretical calculations.
To this end, we implanted a low energy (20-25 keV) beam of the shortlived radioisotope 8Li+ into high purity single crystals of ZnO and studied the resulting isolated implant via its nuclear magnetic resonance as reported by its radioactive beta decay (-NMR)MacFarlane (2015). Closely related to muon spin rotation (SR) which has yielded an intricate understanding of isolated hydrogen impurities in ZnO Shimomura et al. (2002); Cox et al. (2001), -NMR enables complementary investigations of other light isotope dopants in II-VI semiconductors Ittermann et al. (2000, 1999). Our purpose is threefold: 1) to elucidate the properties of the Li dopant, 2) as a control for future experiments focusing on thin films and surface effects in pure and intentionally doped ZnO, and 3) as a first step towards studying more complex related materials, such as indium gallium zinc oxide (IGZO) used in thin-film transistors Nomura et al. (2004). In the temperature () range of 7.6 to 400 K, we observe three distinct defects and a broad resonance originating from a distribution of metastable complexes. Density functional theory calculations of the electric field gradient (EFG) tensor, that determines the quadrupolar splitting of the NMR, support the assignment of (diamagnetic) defect configurations for the interstitial (Li) and substitutional (Li). The interstitial is ionized and stable across the entire range as a source of self-compensation, while the substitutional becomes prevalent only above 300 K as a shallow acceptor. We attribute spin-lattice relaxation above 300K to the onset of local defect dynamics. We observe a minor fraction of Li in a third characteristic site and discuss its possible origins. Finally, we report the temperature dependence of the EFG for the interstitial, which exhibits a remarkable similarity to non-cubic metals.
II Experimental
II.1 Implanted Ion -NMR
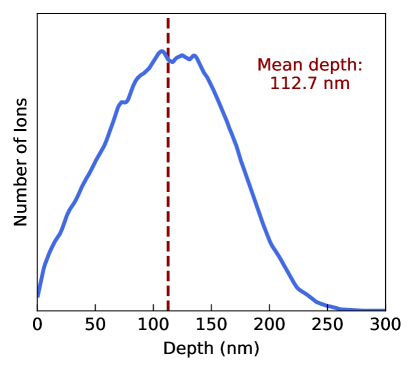
In this form of -NMR, we measure the NMR of a short-lived -radioactive probe implanted into the crystalline host as a low energy ion beam. Detection uses the asymmetric -decay (i.e. the direction of the emitted electron is correlated to the nuclear spin direction at the instance of the decay), similar to SRMacFarlane (2015). The experiments were performed at TRIUMF’s ISAC facility in Vancouver, Canada, where a 20-25 keV beam of spin-polarized with an intensity of ions s-1 was focused into a beamspot mm in diameter centred on the sample. In this energy range, SRIM Monte Carlo simulations Ziegler et al. (2010) predict a mean implantation depth nm (Appendix B). The nuclear spin is polarized in-flight using a collinear optical pumping scheme with circularly polarized lightLevy et al. (2014). The beam is incident upon the sample centred in a high homogeneity superconducting solenoid producing a field = 6.55 T parallel to the beam and defining the direction. The polarization , the expectation value divided by , of the implanted 8Li is monitored through the experimental -decay asymmetry,
| (1) |
where and are the -rates in two opposing scintillation detectors downstream (Forward, ) and upstream (Backward, ) of the sample. is a proportionality constant depending on properties of both the decay and the detectors. The polarization direction is alternated, via the sense of circular polarization of the pumping light, between parallel and antiparallel with the beam ( helicity), and data for each helicity is collected separately to enable accurate baseline determination, reduce systematic error, and to sometimes identify helicity dependent features. has a nuclear spin , gyromagnetic ratio MHz T-1, nuclear electric quadrupole moment of mbVoss et al. (2011), and mean radioactive lifetime s. The short and a typical flux of ions s-1 ensures that the number of 8Li in the sample is never higher than , so the probe is ultradilute, and thus Li-Li interactions are absent. Further details on the measurements and samples are in section II.3.
II.2 8Li NMR
Here we summarize the NMR properties of 8Li that will be important in interpreting the results presented below.
Like its stable isotope counterparts, 8Li is a quadrupolar nucleus with , meaning its nuclear charge distribution is not spherical, and its nuclear spin is thus coupled to the tensor electric field gradient (EFG) that it finds at its site in the crystal. The quadrupolar interaction splits the NMR spectrum into a multiplet of quadrupolar satellites, each corresponding to a specific transition among adjacent nuclear magnetic sublevels indexed by . Because is an integer (rare among stable nuclei, but represented, for example, by the 6Li), there is no “main line” transition at the centre of the quadrupolar multiplet. The scale of the quadrupole splitting is given by the product of the EFG with the nuclear electric quadrupole moment . We quantify it by defining the quadrupole frequency by
| (2) |
where is the (largest) principal component of the EFG. Typical of light nuclei, is not very large, and is typically on the kHz scale in close-packed crystals. One can then treat the quadrupolar interaction accurately as a first order perturbation on the Zeeman Hamiltonian, whereupon the satellites are distributed symmetrically about the NMR frequency with positions given by
| (3) |
where = Vega (2010). and are the polar and azimuthal angles of the field in the principal axis system of the EFG. The asymmetry parameter is a measure of the deviation of the EFG from axial symmetry (). If the site has threefold or higher symmetry, the EFG will be axial. If it is cubic, the EFG (and splitting) are zero.
To measure a resonance spectrum we use a transverse RF field that induces magnetic dipolar transitions of . When the magnetic field of is large enough, we can, in some cases, also observe nonlinear multiquantum transitions (MQ), e.g. with . These resonances interlace the single quantum satellites with positions given by the same formula with . Aside from being very strongly dependent on , the multiquantum satellites are unaffected by a distribution of (quadrupolar broadening) resulting from crystal imperfections, so they are often noticably narrower than their single quantum counterpartsVega et al. (1976). We note that one major source of linewidth in solids, magnetic nuclear dipolar broadening, is nearly absent in ZnO, since the nuclear moments of Zn and O are small and/or low abundance. We thus expect the predominant broadening will be from crystalline disorder.
We will use the quadrupolar splitting as a fingerprint of the specific crystallographic site for the implanted 8Li. Moreover, the EFG can be calculated accurately in density functional theoryBlaha et al. (1985); Schwarz et al. (1990); Blaha et al. (1988); Darriba et al. (2019), and we performed such calculations to aid in determining the sites, see section II.4 below.
Aside from the quadrupolar splitting, the NMR frequency is shifted from the Larmor frequency in the applied field by the magnetic response of the host. We quantify this shift by comparison to a standard reference. With the superconducting magnet in persistence mode, our conventional reference is a single crystal of cubic MgO, where the site is cubic, and the 8Li NMR consists of a single narrow lineMacFarlane et al. (2014a). We define the relative shift in parts per million (ppm) as
| (4) |
The resonance shift has contributions from the macroscopic demagnetization field, local magnetic fields of unpaired spins in the vicinity, and the local screening response, i.e. the chemical (orbital) shift MacFarlane (2015). The latter is well-known from stable Li NMR to exhibit a very small range of a few ppm; while the demagnetization field depends on the shape of the sample, and it is near its largest in our geometry: a thin plate in a perpendicular field.
In addition to the time average local fields that determine the spectral features, fluctuations of these fields at the NMR frequency determine the spin-lattice relaxation (SLR). Like conventional NMR, 8Li relaxation is described by a relaxation function (recovery curve) typically parametrized by the rate . The finite 8Li lifetime limits measurable roughly to the range . Because the spin is polarized in flight, no RF is needed to measure the relaxation, but as a result, there is no spectral resolution to the relaxation which is simply the average of all the 8Li in the sample. The type of fluctuations giving rise to the observed SLR can often be determined by the characteristic temperature dependence of . In a nonmagnetic insulating host, fluctuations may arise from stochastic diffusive motion of interstitial 8Li or from lattice vibrations (phonons). In a semiconductor, mobile or localized carriers, if they are sufficiently abundant, may provide other sources for relaxation Selbach et al. (1979).
II.3 -NMR Measurements
We used two transparent colorless commercial hydrothermally grown ZnO single crystals (Tokyo Denpa Co. Ltd., Tokyo) in the form of thin plates perpendicular to (0001), the hexagonal crystallographic axis Maeda et al. (2005). One sample was used “as-grown” (AG) while the other(n+) was annealed at to remove impurities. Typical AG carrier concentrations around room temperature are - cm-3, while annealing raises it to - cm-3 by eliminating compensating defects (such as Li) residual from the growth process. Annealing was done prior to polishing and the polished surfaces had step-and-terrace structure with a typical step height nm. The same crystals were used for SR experiments which showed a shallow muonium signal, typical of high quality ZnO. For the measurements, the crystals were clamped to the Al sample holder of an ultra-high vacuum cold finger He flow cryostat.
With = 6.55 T parallel to the crystalline -axis, we performed three types of measurement as a function of temperature. A) With a continuous beam, we measured the resonance spectrum by stepping the frequency of a continuous wave transverse RF magnetic field through the Larmor frequency. On-resonance, the RF causes the 8Li spin to precess, decreasing the time integrated asymmetry.
B) A second type of resonance measurement was used in which the RF consisted of a four frequency comb with equal amplitude oscillations at frequencies determined by two parameters: and . Specifically, at and . The center was fixed at the resonance frequency from the normal spectrum described in A above, and the splitting parameter was then stepped through a range of values. The quadrupole satellites in the single mode RF spectrum suffer from small amplitudes, as a single transition is limited to at most 25% of the polarization. As a result, only a few spectra were obtained, which take considerable time to accumulate. In contrast, with the RF comb, when matches the quadrupole splitting, all the single quantum transitions () can be saturated at once, dramatically increasing the amplitude, even revealing otherwise undetectable signals. The RF comb method has been previously applied to 12B and 21Na -NMR in II-VI semiconductors and a more detailed description can be found elsewhere Minamisono et al. (2010); Ittermann et al. (1999); Minamisono et al. (1993).
Both types of resonance measurement differ in an important way from familiar conventional pulsed NMR, because the RF is applied continuously at each step of the scan for a relatively long integration time (1 s). In this mode, the resonance amplitudes are determined by several factors beyond the relative abundance of the corresponding 8Li site. These include the RF amplitude , the resonance linewidth, and, more subtly, slow dynamics of the resonance frequency on the integration timescale which can cause 8Li spins to be double counted, since an individual spin need only be on-resonance for a millisecond or so during the integration time to be fully depolarized. As a result, it is difficult to make quantitative conclusions about site fractions from the amplitudes.
C) Measurements of the spin-lattice relaxation used a pulsed 8Li+ beam and no RF field. The time evolution of the polarization was measured both during and after the 4 second pulse. At its trailing edge, the polarization approaches a dynamic steady state, while after the pulse, it decays to its thermal equilibrium value near zero, giving rise to the characteristic bipartite NMR recovery curve. The helicity was alternated for each pulse every 20 seconds, and this process was repeated for about 30 minutes to accumulate statistics.
II.4 EFG Calculations
To facilitate site assignment for the implanted 8Li, the EFG was calculated for various Li defect configurations using the supercell method. Here, Li is placed at a specific site in a supercell composed of a small number of ZnO unit cells which is then subjected to periodic boundary conditions. The calculation thus represents a fictitious ordered phase LixZnO. While in the calculation is vastly larger than in the experiment, by decreasing to the extent possible, one can approach the dilute limit, particularly for quantities like the EFG that are predominantly sensitive to the immediate environment Lany et al. (2000); Wichert and Lany (2001); Blaha et al. (1988).
Structural calculations of the defects were performed within the density functional theory framework using the plane wave pseudopotential method as implemented in Quantum Espresso Giannozzi et al. (2017). Troullier-Martins norm-conserving pseudopotentials Troullier and Martins (1991) were employed for treatment of core electrons and the generalized gradient approximation PBE was used for the exchange and correlation functional Perdew et al. (1996). A supercell of lattice units was used with a kinetic energy cutoff of 1080 eV and Monkhorst-Pack grid (MPG) Monkhorst and Pack (1976) centred at the point. The supercell had \chLi defects introduced at various sites with a compensating background jellium charge to maintain overall neutrality and avoid divergent Coulomb interactions. The atomic positions were allowed to fully relax under the constraint of fixed experimental lattice parameters Reeber (1970). The total energy was numerically converged to less than 1 meV with respect to a cutoff of 1210 eV and MPG.
For an isolated implanted Li+, the surrounding ZnO lattice will respond with a localized distortion about the defect that leaves the more distant structure unchanged. The EFG has an dependence on distance and is thus very sensitive to the local structure, so a realistic calculation requires both the experimental lattice parameters and an accurate estimate of the local lattice relaxation Blaha et al. (1988).
EFG calculations were performed using the more computationally expensive all-electron augmented plane wave plus local orbitals method (APW+lo) implemented in WIEN2kBlaha et al. (2020) and the relaxed structure from the pseudopotential method. The angular momentum expansion of the lattice harmonics inside the atomic spheres was truncated at and the plane waves outside the atomic spheres expanded with a cutoff of R, the product of the smallest atomic sphere (RMT) with the largest K-vector () of the plane wave expansion.
III Results and Analysis
III.1 Resonance Spectra
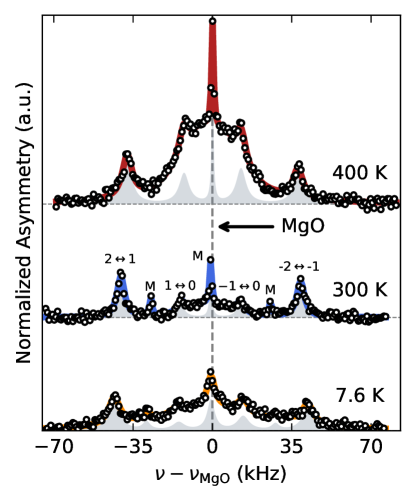
Fig. 1 shows the single tone frequency spectrum in ZnO at three temperatures. At all temperatures, the primary feature is a quadrupolar multiplet pattern spread kHz about its center. At 300 K, the predominant quadrupolar splitting is indexed by the corresponding magnetic sub-level transition. In addition to the indexed single quantum satellites (SQ), there are interlaced multiquantum lines labeled M that are substantially narrower than their SQ counterparts.
The quadrupole splitting is expected, since no site in the wurtzite lattice is cubic. However, its magnitude (e.g. defined by the difference between the outermost satellites) is quite modest, smaller than in perovskite oxidesMacFarlane et al. (2003). The resolved multiplet indicates a well-defined crystalline site, which we label “A”. The A multiplet is conspicuous at all temperatures, but its features evolve, with increased splitting and substantial broadening at low . At the lowest temperature, the multiplet is superimposed on a broad pedestal of intensity with a width comparable to the overall multiplet splitting. In addition to A, at 300 K and above, there is another unresolved line close to the Larmor frequency (see the 400 K spectrum in Fig. 1). The helicity-resolved spectra confirm it to be quadrupolar but with a substantially smaller splitting, such that the individual satellites are not resolved (see Appendix C). We conclude this corresponds to a second 8Li+ site (B), with a much smaller EFG, whose population grows at high temperature.
| Sample | Temperature (K) | (kHz) | (ppm) | (kHz) | (kHz) |
|---|---|---|---|---|---|
| AG | 7.6 | ||||
| AG | 300 | ||||
| AG | 400 | ||||
| n+ | 300 |
To quantify these observations, the data was fit using using a custom python code based on the Minuit2 library James and Roos (1975); Hatlo et al. (2005). At each temperature, the two helicities were fit simultaneously sharing the parameters that determine the satellite positions. Note that for A, , so Eq. (3) provides the satellite positions very accurately. The fit function thus consisted of 7 Lorentzians with satellite positions determined by the single parameter via Eq. (3), assuming the -axis coincides with the principal EFG direction () and axial symmetry (). We discuss the validity of these assumptions below. It was further constrained by assuming all the SQ (MQ) satellites shared the same width () at each temperature. Where necessary, signals corresponding to the low pedestal and the unresolved B site signal were added. A priori we expect the chemical shift at A and B will differ, but any such difference is too small to detect, and to reduce the number of parameters, the broad lines were centred at the same as A. The resulting fits are shown as the lines in Fig. 1, and the shared parameters for A are given in Table 1.
The resulting , determined by the splittings, are quite precise, and the differences in Table 1 are significant as confirmed below by the comb spectra. We include the raw relative shift defined by Eq. (4) in Table 1. From the sample shape, we estimate the dimensionless demagnetization factor is . A literature Mikhail and Agami (1966) value for the volume susceptibility of ZnO leads to an estimated demagnetization shift ppm, comparable to the value in the MgO reference crystal ( ppmMacFarlane et al. (2014a)). From this, we conclude an accurate estimate of the corrected shift is impractical. However, the chemical shifts in MgO and ZnO are evidently small (a few ppm) and similar, consistent with expectations from conventional Li NMR. The reported shift uncertainties in Table 1 are purely statistical. Unlike the splitting, we do not regard the differences in the shift as significant, because it is sensitive to small systematic changes in the field at the sample, due to thermal contraction, weak magnetization of the spectrometer, and reproducibility of the sample position.
The annealed sample was measured briefly at 300 K (not shown). The SQ and MQ satellite linewidths at 300 K in the two samples are similar, while any difference in the quadrupole splitting is much smaller than the MQ linewidths and indistinguishable in a single tone spectrum.
In the AG sample, both the SQ and MQ satellites broaden significantly, and by a similar amount, at low temperature, indicating predominantly magnetic, rather than quadrupolar, broadening. Interestingly, the SQ satellites also broaden at high temperature above 300 K. The MQ satellites were not observed at 400 K, so no comparison of their widths can be made.
Aside from the A multiplet, the broad lines are considerably less well-determined. The low temperature pedestal is very similar in the two helicities, meaning it shows little evidence of a resolved quadrupole splitting - or any such splitting is much less than the width which is on the order of kHz FWHM. Without resolved satellites, it is not possible to reliably extract the quadrupolar splitting of the B site. From the helicity resolved fits, we estimate a splitting of at most a few kHz with satellite linewidths several times larger than this.
III.2 Comb Spectra
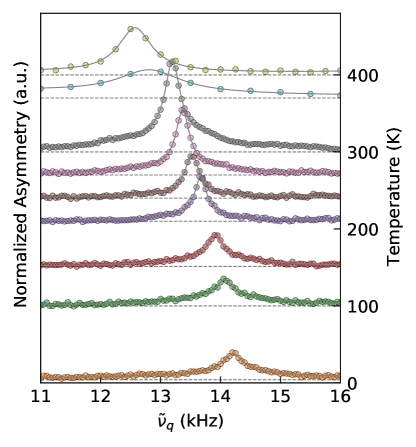
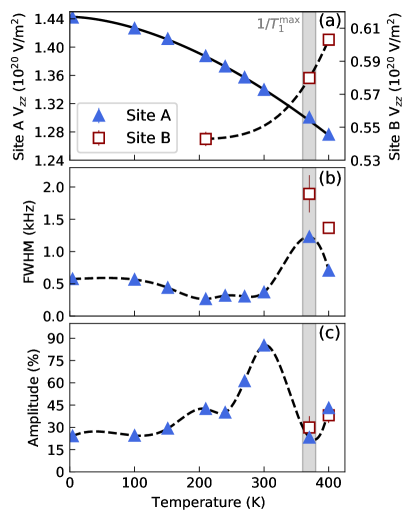
We turn now to the RF comb spectra that reveal more detail than the single frequency spectra above. Recall the central frequency of the comb is set to coincide with the centre of the multiplets in Fig. 1 and then the comb splitting is stepped over a range. When the comb’s splitting parameter matches , we find a single resonance much larger than any of the individual satellites. This is demonstrated for the site multiplet as a function of temperature in Fig. 2. The resonant is entirely consistent with the splitting in Fig. 1. With increasing temperature, the resonance position moves systematically downward, confirming the trend in Table 1 and revealing a thermal reduction in EFG which we discuss below in section IV.4. The spectra could not be fit with a single Lorentzian, but required a bi-Lorentzian (narrow plus broad) sharing the same . The fit parameters, as a function of temperature, are shown as the triangles in Fig. 4. The resonance position provides a very accurate measurement of . The amplitude increases with increasing , reaching a maximum at K, while it is widest at 370 K, consistent with the high temperature broadening of the SQ satellites in Table 1.
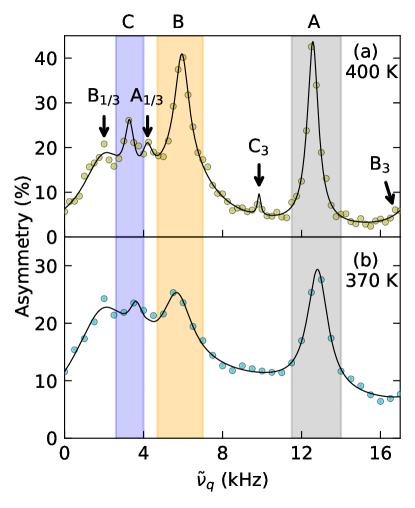
For only a few high temperatures, we extended the scan range down to zero comb splitting. These spectra, shown in Fig. 3, reveal further structure. Distinct well defined quadrupole splittings for resonances are denoted by the vertical colored bands, with the grey band corresponding to the A resonance tracked with in Fig. 2. In scanning over a wider range, it is important to recognize that when the outer(inner) comb frequencies match the inner(outer) SQ satellites of the underlying multiplet, we expect small aliased resonances at (and ). These SQ resonances are denoted at 400 K by subscripts. There may also be aliased MQ resonances at and . Scans of up to 82, 110 kHz at 300 and 400 K (not shown) reveal no further resonances with larger . The features at lower frequency includes a resolved resonance corresponding to the B site (shaded orange), with kHz at 400 K, and fit values as open squares in Fig. 4. This resonance is also identifiable at 210 K (not shown), indicating a small population of site B far below where it becomes evident in the single frequency spectra. The B resonance is also broader than A, and its position shifts higher from 370 to 400 K opposite to the reduction shown by A.
As discussed in section II.3, the resonance amplitudes are determined by several factors, including the long integration time (1 s) of the continuously applied RF field and off-resonance baseline asymmetry. In the presence of slow spectral dynamics up to the integration time, the amplitude may be enhanced as 8Li can be double counted if they only transiently meet the resonance condition for a time as short as the RF precession period, on the order of 1 ms. This results in spectra with resonance amplitudes whose sum may exceed the full off-resonance asymmetry, as is evidently the case in Fig. 3. This is strong confirmation that 8Li is undergoing spectral dynamics in this temperature range.
The comb spectrum also reveals a third site (labelled C) with an even smaller = 3.63(5) kHz at 370 K, about half the value for B, decreasing to 3.28(5) kHz at 400 K. It’s amplitude is small, so it corresponds to only a minor population of implanted 8Li. The combination of the breadth of B and the presence of C explains the absence of resolved structure of the B line in Fig. 1, but note there is substantial intensity in a broad background encompassing B and C with a tail that reaches toward A. The three resolved quadrupole frequencies at 400 K are given in Table 2 and the additional minor peaks are aliases of these resonances. The rich detail in these spectra demonstrates the power of the comb method to strongly amplify quadrupolar split resonances within a narrow band of and reveal structure that is otherwise hidden.
| Site | (kHz) | (V/m2) |
|---|---|---|
| A | ||
| B | ||
| C |
III.3 Spin-Lattice Relaxation
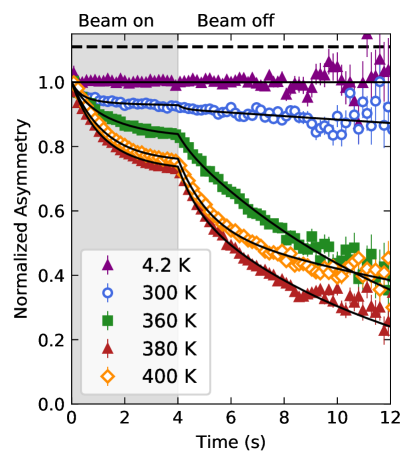
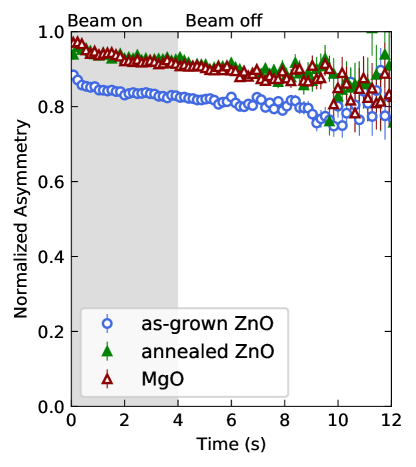
Below 300 K, the spin-lattice relaxation in the AG sample is very slow (), as seen in the recovery curves in Fig. 5, where the time dependent asymmetry has been normalized to its initial value . The corresponding rate is near the limit imposed by the 8Li lifetime. This is typical for a nonmagnetic insulator when 8Li+ is not diffusing. However, above 300 K it increases rapidly, but not monotonically, with a maximum rate at about 370 K (the lowest data in Fig. 6). Careful comparison between 300 K and low temperature shows there is a small much faster relaxing component, corresponding to at most a few % of the signal. In addition, a calibration of the initial asymmetry in MgO is about 10% larger at 300 K, see the dashed horizontal line Fig. 5. Thus, there appears to be a small “missing fraction” corresponding to a population of 8Li that are very rapidly depolarized.
We briefly studied the sample at 300 K and found the SLR rates to be similar. However, was larger, only 3.3(1)% less than MgO (see Fig. 11 in Appendix D), i.e. the missing fraction is substantially reduced by annealing.
To fit the data consistently across the full temperature range, we adopt a biexponential relaxation function: for 8Li arriving at time , the polarization at time follows
| (5) |
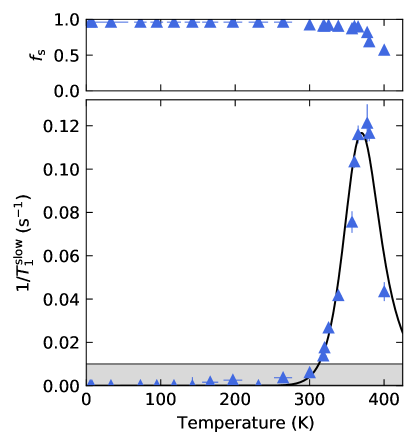
where is the slow fraction and is its rate, while is the fast SLR rate. The data was fit to Eq. (5) convolved with the 4 second beam pulse using the Minuit2 James and Roos (1975); Hatlo et al. (2005) library as implemented in ROOTBrun and Rademakers (1997) with a custom C++ code. To reduce the number of free parameters, below 300 K and were shared temperature independent global parameters, and the global reduced . The data above 300 K was taken after the spectrometer had been modified to increase its maximum temperature. For this data, was allowed to vary with temperature and the shared with . This increase in is due to changes to the F -detector. In both ranges, the values indicate the biexponential tends to overparametrize the data (particularly at low temperature); however, it has the advantage that it isolates the fast component, preventing it from biasing the slow rate. The rate and fraction of the large, slow-relaxing signal are presented in Fig. 6 showing the rapid increase in above 250 K toward a maximum at K. The fast signal is a very small fraction below 300 K, see Appendix A for more details.
III.4 EFG calculations
As the EFG is a ground state property of the charge density which is accessible within all-electron self-consistent energy band calculations Blaha et al. (1985), we attempted to determine the site of 8Li by comparison with the calculated EFG tensor magnitude and symmetry. In semiconductors, defects generally exhibit distinct charge states, and the lowest energy charge state may change with temperature (or doping) by exchanging electrons with band states at the Fermi level. Naturally, different charge states have different local lattice and electronic structuresFreysoldt et al. (2014). This modifies the EFG, allowing, in principle, identification of charge states, particularly for deep level defects characterized by large lattice relaxation at a charge state transition Lany et al. (2000); Wichert and Lany (2001). We indicate the charge state of the calculation with a superscript , where if an electron is added to (removed from) the supercell.
| Site | Principal Axes | ||
|---|---|---|---|
| Li | 1.21 | (0,0,1) | 0 |
| Li | 0.47 | (0.04,0.82,-0.57) | 0.65 |
| Li | 0.16 | (0,0,1) | 0 |
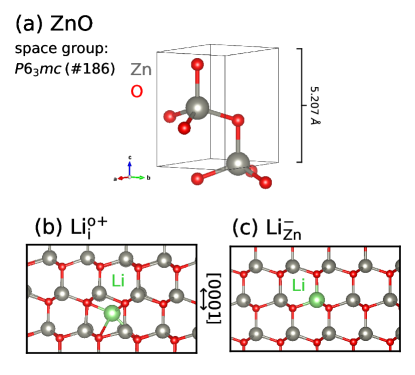
There are only a few reasonable candidate Li sites in ideal ZnO, with structure shown in Fig. 7. We calculate the defect structures for Li+ in the high symmetry tetrahedral LiT (Wykoff ) and octahedral Li (Wykoff ) interstitial sites, where it would act as an electronic donor. We also calculate the zinc substitutional site (LiZn), an established acceptor Orlinskii et al. (2004). Note that neutral LiZn has a polaronic distortion around the localized hole, so it is not certain whether it is a shallow (and potentially useful) -type dopant Carvalho et al. (2009); Vidya et al. (2012). The Li antisite defect (LiO) is not considered, as it is reported to be unstable Vidya et al. (2012).
We find Li is displaced from the symmetric position along (0001) by Å, creating a long and short set of Li-O coordinating bonds. The axially symmetric Li is also found to relax spontaneously to Li, a variant displaced from the 3-fold axis of symmetry. Considering the defects only in their diamagnetic ionized states, the EFG tensors, calculated using the 300 K lattice parameters are given in Table 3. The Li center distorts the local environment, giving rise to an almost symmetric tetrahedral coordination with neighboring oxygens, resulting in a very small Vzz. Li retains axial symmetry (along ), while Li has a principal axis almost orthogonal to , nearly parallel to . The calculated structures of the Li and Li defects are shown in Fig. 7.
IV Discussion
IV.1 Sites for Implanted Li+
When an ion is implanted in a crystal, it loses energy through collisions with host lattice atoms and gradually slows down. In the process, it can knock a host atom out of its normal lattice position into a nearby vacant interstitial site, forming a Frenkel (vacancy-interstitial) pair Rimini (1995). The threshold for this process is typically 10s of eV. So, after generating its final Frenkel pair, the implanted ion continues for some distance before stopping typically at a high symmetry site. The host lattice will then relax around the stopped implant, possibly lowering its site symmetry. Now if we consider the NMR spectrum, such as we measure with -NMR, to the extent that the stopping site is isolated from other defects, it will have a characteristic EFG tensor reflected by a well-resolved quadrupolar splitting. However, it is also possible that the ion stops close enough to the last Frenkel pair that its EFG is modified. As there are many possible configurations of the trio (ion+pair), this results in a distribution of EFGs and is reflected in a quadrupolar broadened resonance usually observed at low temperature. At higher , the Frenkel defects tend to heal rapidly, typically leading to the first stage of annealing. Depending on relative mobilities, the implanted ion may compete for the vacancy with the intrinsic interstitial of the pair. With increasing , the typical behaviour is thus a gradual loss of the broad “perturbed site” resonance together with an increase and sharpening of the well-defined lines corresponding to the isolated site, and potentially (if the implant reaches the vacancy) a change of site to substitutional. As we shall see below, the implanted 8Li+ in ZnO follows this phenomenology quite closely.
The A site multiplet, with a well-resolved quadrupolar splitting, is evident at all temperatures, including the lowest, see Fig. 1, so it should correspond to 8Li+ at the most stable interstitial. The octahedral site is substantially more spacious than the tetrahedral, and theory finds it lower in energy by 0.62 eVCarvalho et al. (2009). Moreover, there is only a small barrier for the tetrahedral to migrate to an adjacent octahedralCarvalho et al. (2009). The Li assignment is unambiguously confirmed by the excellent agreement between the calculated EFG of in Table 3 with the experimental value at room temperature of . The unrelaxed site is symmetrically coordinated by six O2- ions. Axial lattice relaxation brings the interstitial cation closer to three anions, lowering the energy. This off-centre site is also consistent with emission channeling from other alkali radioisotopes in wurtzite crystalsWahl et al. (2016, 2017, 2020). We note the relaxed site is still 3-fold symmetric about the axis, so the EFG remains axial, consistent with Eq. (3) for the satellite splittings. As a corollary, we then attribute the broad low temperature resonance in Fig. 1 that disappears by 300 K to Li in the vicinity of some implantation-related crystalline disorder, also consistent with emission channeling in related materialsWahl et al. (2020).
Next we consider the B site resonance which is well-resolved only in the comb spectra. Though it can be identified as low as 210 K, it only becomes substantial above 300 K, increasing in amplitude towards the highest . This suggests B is the product of a site change transition to a lower energy site, likely the substitutional. This is similar to 24Na implanted into ZnO where emission channeling finds the interstitial twice as probable as the substitutional at room temperature, while by 420 K the interstitial is largely converted to substitutionalWahl et al. (2016). In contrast to the A site, the calculated EFG is substantially smaller than measured. However, Na -NMR also finds two sites at room temperature, with the substitutional site having a factor of 2 smaller EFG than the interstitialMinamisono et al. (2010); Wahl et al. (2016), very similar to 8Li. The evident underprediction of the EFG by DFT (see Table 3) is probably due to its sensitivity to the detailed lattice relaxation around the Li which may not be captured accurately with the GGA functional.
The temperature dependence of the spectra reveals further aspects of the site change. The A site line (most clearly revealed in the comb resonances in Fig. 2) increases in amplitude above 200 K, reaching a maximum near room temperature. Some of this increase is due to narrowing. The bi-Lorentzian lineshape also suggests two A sites sharing the same average EFG, but distinguished by the width of the EFG distribution. The broad component probably corresponds to the A site with some disorder at distances of a few lattice constants, while the narrow component probably represents an A site with ideal local structure. The growth of the narrow component is consistent with annealing of some correlated (small) Frenkel pairs in the vicinity. This agrees with optically detected electron paramagnetic resonance in electron irradiated ZnO that demonstrates low temperature annealing of the zinc (65-170 K) and oxide (160-230 K) sublattices Vlasenko and Watkins (2005). As seen clearly in Fig. 3, above 300 K, the A line first broadens at 370 K, then narrows again by 400 K, maintaining nearly the same integrated area, while B increases substantially. If the site change involved an isolated interstitial becoming substitutional, e.g. by a knock out mechanismKnutsen et al. (2013), then we would expect a decrease in the A amplitude with the simultaneous growth of B, such as in the well-established site change in the FCC metalsMorris et al. (2004). This is not the case, however. While it is possible that dynamic effects on the amplitude are confounding here, a careful inspection of the spectra in Fig. 3 reveals that the increase in B appears to be at the expense of the very broad background intensity that underlies the better resolved resonances. Production of Li in this range then appears to result from a perturbed (disordered) site as a starting point rather than the isolated interstitial directly. This is reasonable for a site change involving a nearby vacancy (which is almost certainly implantation-related, since thermodynamic vacancies are extremely rare). Interstitials nearest to such vacancies will be the first to become substitutional, and they will also experience a significantly perturbed EFG in advance of the site change. In the ideal crystal, the barrier for Zn vacancy migration is quite highJanotti and Van de Walle (2007), so the site change is probably driven by mobility of the interstitial Li. We consider further the mobility of Li below in relation to the spin-lattice relaxation.
Thus far, the 8Li in ZnO follows the scenario typical for light implanted isotopes as outlined above. However, we also find clear evidence for another site (denoted C) with a well-defined EFG in the comb spectrum in Fig. 3(a). This site may correspond to a complex with another point defect, such as an oxygen vacancy, Li, which is Coulombically bound. This would be consistent with the high temperature appearance of the closely related Na complex seen by electron-nuclear double resonance Orlinskii et al. (2004), but the fact that the EFG for C is even smaller than B seems inconsistent with a nearby charged vacancy. Moreover, such a complex would have several orientations relative to the applied field which should yield a more complex spectrum. However, if the complex is dynamic, e.g. with hopping rapidly (on the scale of the quadrupolar splitting of several kHz) among the three equivalent neighbours and axial position of Li, then a single reduced average EFG might result. This suggestion could be tested with more detailed calculations.
Finally, we consider the widths of the well-resolved resonances. Without significant dipolar broadening, we might expect the resonances to be extremely narrow. However, the widths in Table 1 are considerably larger than similarly split satellites in crystals of BiMacFarlane et al. (2014b) or Sr2RuO4Cortie et al. (2015), probably due to local crystalline disorderJanotti and Van de Walle (2007). The primary broadening mechanism is quadrupolar, as confirmed by the substantially narrower MQ resonances. Another potential source of broadening is the inhomogeneous magnetic fields due to a population of dilute paramagnetic centres, which could be intrinsic defectsEsquinazi et al. (2020) or impurities such as Fe. In NMR, this results in a term in the linewidth proportional to the impurity spin polarization that, in the dilute limit, is typically Curie-like (proportional to ). The absence of such a temperature dependent broadening is clear in Fig. 4(b), which shows the width to be quite independent of temperature below 150 K. The slight narrowing above this is probably related to the healing of nearby Frenkel pairs. This is consistent with predominantly quadrupolar broadening down to the lowest temperature. However, the MQ satellites, which are not quadrupole broadened, do exhibit a low broadening (see Table 1), suggesting a Curie term may be emerging at the lowest . At the opposite end of the range, the broadening at 370 K is probably dynamic, and we discuss it below with the spin-lattice relaxation.
IV.2 Magnetic State of Implanted 8Li
In the previous section, we found very little evidence for broadening due to dilute paramagnetic defects. Here we consider paramagnetism in the immediate vicinity of the 8Li. It is widely accepted that Li is an amphoteric dopant in ZnO, where the Lii is a donor and LiZn an acceptor. The question then arises: what is the charge state? In the ionized state, both would be diamagnetic, while un-ionized they would be paramagnetic with an unpaired electron/hole spin localized in the vicinity. This distinction should be dramatic in the data, since the hyperfine interaction provides a strong magnetic perturbation on the NMR. However, we see no evidence for a hyperfine splitting for either site. This appears inconsistent with the EPR of LiZnSchirmer (1968). However, the EPR signal requires cross gap photoexcitation of carriers, meaning it is actually due to a metastable paramagnetic defect. From our data, we conclude that LiZn is fully ionized in the temperature range where we observe it (above 200 K), meaning it is quite a shallow acceptor. Similarly, Lii remains diamagnetic over the entire range down to the lowest (7.6 K). Again this appears inconsistent with the EPR (and ENDOR) of the interstitialOrlinskii et al. (2004), but this signal is observed (without photoexcitation) at 1.6 K, so it may be simply that ionization occurs in the intervening factor of 5 in . However, this signal is also from nanoparticulate ZnO, and there is a strong size effect on the hyperfine coupling, due to confinement of the impurity wavefunction, which decreases strongly with increasing particle size. At 7.6 K, we place an upper bound of a hyperfine splitting at 2 kHz (smaller than 3 Gauss at the 8Li nucleus), corresponding to a fraction of the MQ linewidths in Table 1, confirming that Lii is shallow as a donor in the bulk.
While the carrier concentration in our samples is quite low and far below the metallic limit, here we consider the possibility that the Li defects are un-ionized but rapidly exchanging with a population of free carriers. In this case, the hyperfine splitting is averaged out, but there is a remnant time average shift of the NMR which typically follows the Curie lawMeintjes et al. (2005); Chow et al. (2000). The observed shift values in Table 1 show no evidence for such a contribution, remaining small (in the range of Li chemical shifts) at all temperatures. This provides further confirmation that the observed Li is fully ionized.
Fluctuations of the hyperfine field of an unpaired electron in the vicinity may well cause the 8Li nuclear spin to relax so rapidly that it is not observed. This might account for the small missing fraction in the AG crystal. If this is the case, its reduction in the annealed crystal suggest that the probability of such a paramagnetic environment is reduced by annealing, i.e. it does not appear characteristic of pure ZnO.
IV.3 Spin-Lattice Relaxation and Dynamics
Spin-lattice relaxation is driven by fluctuations of the local fields at the nucleus, specifically, the Fourier component at the NMR frequency (41.27 MHz). For quadrupolar nuclei, the most important contribution is usually EFG fluctuations, since this is the largest term in the nuclear spin Hamiltonian (after the Zeeman interaction with ). This hierarchy of interaction strengths is reflected in the time average spectra above, where the quadrupolar splitting far exceeds the satellite linewidths.
Below 300 K, the relaxation is so slow that it is difficult to measure reliably, due to lifetime of the probe. In this temperature range, thermal phonons could cause SLR by a Raman process, producing a varying approximately as , e.g. in LaAlO3, see Ref. Karner et al., 2018. Such phonon relaxation is evidently too weak to measure.
In contrast, with an onset around 300 K, there is an activated increase in the above room temperature. This could, in principle, be due to thermally excited carriersSelbach et al. (1979), but the peak in in Fig. 6 is not consistent with this. Such a peak is typical of some stochastic motion, either of the probe ion itself or some other species in its vicinity, giving rise to a fluctuating field at the nucleus. In the simplest case of the isolated Li hopping diffusively on the sublattice of octahedral sites, the EFG at each site is equivalent, both in magnitude and direction, so fluctuations would occur only as the ion briefly transits between sites. On the other hand, the fluctuating EFG may be due to another nearby interstitial ion, probably the more mobile ZnI, which is likely part of the nearest Frenkel pair. If the corresponding vacancy remains nearby, then the dynamics of both interstitial cations would be modified by the Coulomb potential well of the negatively charged vacancy. The maximum may then correspond to a Bloembergen Purcell Pound (BPP) peakBloembergen et al. (1948), where a fluctuating field described by a single exponential correlation time with an activated temperature dependence sweeps through the NMR frequency, producing a peak when matches . Fitting the measured to the BPP model produces the curve shown in Fig. 6 with fitted values of eV and 10-16 s. While the fit is not too bad, there are several important features that are inconsistent with a simple BPP interpretation: 1) The fitted “attempt frequency” is several orders of magnitude higher than expected. This value is related to the narrowness of the peak in temperature. 2) The SLR peak coincides with a broadening in the resonances (see Fig. 4). In contrast, the spectrum should be motionally narrowed when exceeds the linewidth (several orders of magnitude smaller than ), i.e. at temperatures well below the SLR peak. 3) Taking the site as the scale of fluctuations, the peak value of is also too low. These inconsistencies suggest a more complicated situation than simple isolated interstitial diffusive motion.
For this reason, we seek an alternate explanation. Consider the line broadening at high temperature. It is not magnetic as the MQ resonances are unaffected. Rather it resembles the broadening expected for an NMR probe fluctuating between different environments at a frequency comparable to the spectral difference of the two. The width is maximized simultaneously for both the A and B lines as well as the broad background in the comb spectra. From this we speculate that some activated local dynamics starts to relax the 8Li spin above 300 K, but before reaching the BPP peak, this relaxation channel is quenched. This might be Li becoming mobile and then finding a vacancy and becoming the immobile Li. On the other hand, it could also be ZnI beginning to hop locally in the attractive potential of the vacancy, and then detrapping and moving away. In either case, the activated dynamics is interrupted and the relaxation diminishes as this timescale becomes short enough to stop the relaxation.
IV.4 Temperature Dependence of the EFG
The electric field gradient at the nucleus is sensitively determined by the site symmetry and the local electronic structure about the implanted ion. It is not surprising then to find that it is temperature dependent. For the A site, it decreases by more than 10% from its low value to 400 K, see Fig. 2. The corresponding values of shown in Fig. 4(c) were fit to
| (6) |
The resulting parameters are reported in Table 4, where a behavior is determined for an unconstrained fit, while fixing produces a slightly worse fit with small deviations below 100 K.
| Fit type | |||
|---|---|---|---|
| Fixed | 1.4507(2) | 1.5 | |
| Free | 1.4428(3) | 1.697(6) |
It is widely recognized that thermal expansion plays only a minor role in determining Raghavan et al. (1976). Instead, population of phonon modes renders the EFG time dependent, and the time average value is reduced as the vibrational amplitude increasesTorumba et al. (2006); Nikolaev et al. (2020), resulting in an average behavior captured by the simple phenomenological form of Eq. (6), in a similar vein to the temperature dependence of the energy gap in semiconductorsO’Donnell and Chen (1991). The exponent is often found to be 3/2 for implanted defects in non-cubic metals and metallic compoundsChristiansen et al. (1976), but, while common, it is by no means universalTorumba et al. (2006). It’s occurrence here demonstrates that it is not particular to metalsNishiyama et al. (1976); Christiansen et al. (1976) or narrow gap semiconductorsAmaral et al. (1984), nor is it characteristic of heavy isotope perturbed angular correlation probes. It would be a strong confirmation of the ab initio models, if lattice dynamic calculationsNikolaev et al. (2020); Torumba et al. (2006) could reproduce the observed .
In contrast, site B exhibits an anomalously increasing EFG, which, while rare, is not unheard ofNikolaev et al. (2020). However, this should be interpreted with some caution, because the dynamic broadening at 370 K may also affect the apparent of the resonances. Confirmation of this behavior must await more detailed future measurements.
V Summary
Using ion-implanted 8Li -NMR we characterized the microscopic dynamics, stability, and magnetic states of Li defects in high purity ZnO single crystals. RF comb measurements, through a strong signal enhancement, enabled identification of three distinct defects between 7.6 and 400 K. Comparison to DFT calculations confirm the stability of ionized shallow donor Li up to 400 K and coexistence with Li confirming the amphoteric character responsible for self-compensation of -type doping. From the absence of a resonance shift or hyperfine splitting, we find no evidence for localized holes near LiZn down to 210 K, indicating it is a shallow acceptor in isolated form. Above 370 K, a third unexpected defect is detected that we tentatively suggest to be a complex with Li. From spin-lattice relaxation measurements, a independent fraction of the initial polarization suggest some 8Li stop near magnetic defects with unpaired electrons that are reduced in concentration by annealing. The spin-lattice relaxation rate peaks at 370 K. We ascribe its temperature dependence to the coupled motional dynamics of Li and other nearby defects.
Our results using ultradilute 8Li reveal the defect properties of Li in ZnO and indicate while -type doping is possible with Li, self-compensation by interstitial Li poses a barrier. Characterization of the local 8Li environment is a first step toward studies on surface properties, intentionally doped crystals, and the structurally related but more complex thin-film transistor material, IGZO. Finally, our measurements of for Lii demonstrating a dependence resembling a non-cubic metal provides a case to validate the ab initio lattice dynamics models for a light interstitial in a semiconductor Nikolaev et al. (2020); Torumba et al. (2006).
Acknowledgements.
We thank K. Foyevtsova and I. Elfimov for assistance with the DFT calculations; S. Daviel and H. Hui of TRIUMF for implementation of the RF comb; M. McLay and S. Chan for the high temperature detector upgrade; Y. Cai for help with measurements; Useful discussions: J. Stähler. This work was supported by NSERC Discovery. D.F., V.L.K., and J.O.T. acknowledge the additional support from their SBQMI QuEST fellowship.Appendix A The Fast Relaxing Component
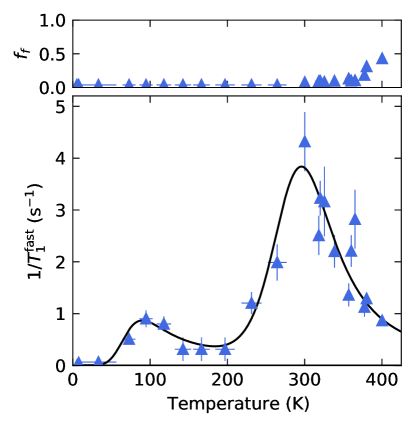
As discussed above, we fit the spin-lattice relaxation data to a biexponential relaxation function. Over much of the temperature range, the fast component () is small, accounting for only a few percent of the signal. As a result, it is much less well-determined than the larger slow relaxing component. For this reason, we did not discuss it in the main text. We include it here for completeness. Fig. 8 shows its rate and fraction.
For a spin-2 nucleus relaxing by slow quadrupolar fluctuations, one expects a biexponential with a fast component of about this amplitudeBecker (1982). However, the observed signal deviates from this model in several significant ways: 1) is substantially faster relative to than predicted; 2) should track , while Fig. 8 shows that the main peak is substantially lower in temperature, and there is a secondary peak around 100 K; 3) When the fluctuations become fast, above the minimum, the fast amplitude should go smoothly to zero. Instead, it grows in this region. For these reasons, the fast component probably has a different origin. Below 350 K, where its amplitude is small, it may correspond to 8Li in some exceptional environment with a significantly higher local relaxation rate, perhaps near the surface, but more measurements are required to make any firm conclusions.
Appendix B Stopping Distribution
The energy of the 8Li+ beam determines its implantation profile. We simulated this for 25 keV and 105 ions normally incident on ZnO with the SRIM Monte Carlo code, calculating a mean depth of 112.7 nm and a straggle (standard deviation) of 50.8 nm. The stopping distribution is shown in Fig. 9, indicating that the vast majority of 8Li+ are well beyond the surface region where the electronic properties are modified ( nm)Deinert et al. (2015). The simulation does not take into account implantation channeling which would result in a tail to the profile towards larger depths due to the channeled fraction.
Appendix C Helicity-Resolved Resonance Spectra
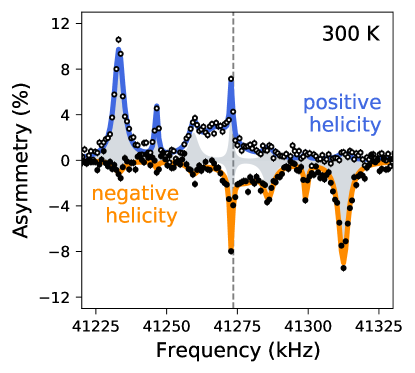
In Figure 10, we present the single tone RF spectrum at 300 K, separately for the two helicities. The occurrence of corresponding satellites on opposite sides of the centre of the pattern in the two helicities is unambiguous confirmation that the splittings are quadrupolar. The corresponding helicity combined spectrum is shown in Fig. 1.
Appendix D Spin-Lattice Relaxation of the Annealed Crystal
In Fig. 11 we present a comparison of the NMR recovery curves at 300 K in annealed ZnO, as-grown ZnO, and the MgO reference. Using Eq. (5) MacFarlane et al. (2014a) to fit the data, the initial asymmetry is extracted for ZnO and MgO. For MgO , while ZnO measured with the standard forward detector yielded .
References
- Janotti and G Van de Walle (2009) A. Janotti and C. G Van de Walle, Rep. Prog. Phys. 72, 126501 (2009).
- Look (2001) D. C. Look, Mater. Sci. Eng., B 80, 383 (2001).
- Esquinazi et al. (2020) P. D. Esquinazi, W. Hergert, M. Stiller, L. Botsch, H. Ohldag, D. Spemann, M. Hoffmann, W. A. Adeagbo, A. Chassé, S. K. Nayak, and H. Ben Hamed, Phys. Status Solidi B 257, 1900623 (2020).
- Sharma et al. (2003) P. Sharma, A. Gupta, K. V. Rao, F. J. Owens, R. Sharma, R. Ahuja, J. M. O. Guillen, B. Johansson, and G. A. Gehring, Nat. Mater. 2, 673 (2003).
- Botsch et al. (2019) L. Botsch, I. Lorite, Y. Kumar, P. D. Esquinazi, J. Zajadacz, and K. Zimmer, ACS Appl. Electron. Mater. 1, 1832 (2019).
- Gurwitz et al. (2014) R. Gurwitz, R. Cohen, and I. Shalish, J. Appl. Phys. 115, 033701 (2014).
- Gierster et al. (2021) L. Gierster, S. Vempati, and J. Stähler, Nat. Commun. 12, 978 (2021).
- McCluskey and Jokela (2009) M. D. McCluskey and S. J. Jokela, J. Appl. Phys. 106, 071101 (2009).
- Özgür et al. (2005) U. Özgür, Y. I. Alivov, C. Liu, A. Teke, M. A. Reshchikov, S. Doğan, V. Avrutin, S. J. Cho, and H. Morkoç, J. Appl. Phys. 98, 041301 (2005).
- Rahman (2019) F. Rahman, Opt. Eng. 58, 010901 (2019).
- Falson and Kawasaki (2018) J. Falson and M. Kawasaki, Rep. Prog. Phys. 81, 056501 (2018).
- MacFarlane (2015) W. A. MacFarlane, Solid State Nucl. Magn. Reson. 68-69, 1 (2015).
- Shimomura et al. (2002) K. Shimomura, K. Nishiyama, and R. Kadono, Phys. Rev. Lett. 89, 255505 (2002).
- Cox et al. (2001) S. F. J. Cox, E. A. Davis, S. P. Cottrell, P. J. C. King, J. S. Lord, J. M. Gil, H. V. Alberto, R. C. Vilão, J. Piroto Duarte, N. Ayres de Campos, A. Weidinger, R. L. Lichti, and S. J. C. Irvine, Phys. Rev. Lett. 86, 2601 (2001).
- Ittermann et al. (2000) B. Ittermann, M. Füllgrabe, M. Heemeier, F. Kroll, F. Mai, K. Marbach, P. Meier, D. Peters, G. Welker, W. Geithner, S. Kappertz, S. Wilbert, R. Neugart, P. Lievens, U. Georg, and M. Keim, Hyperfine Interact. 129, 423 (2000).
- Ittermann et al. (1999) B. Ittermann, G. Welker, F. Kroll, F. Mai, K. Marbach, and D. Peters, Phys. Rev. B 59, 2700 (1999).
- Nomura et al. (2004) K. Nomura, H. Ohta, A. Takagi, T. Kamiya, M. Hirano, and H. Hosono, Nature 432, 488 (2004).
- Ziegler et al. (2010) J. F. Ziegler, M. D. Ziegler, and J. P. Biersack, Nucl. Instrum. Methods Phys. Res., Sect. B 268, 1818 (2010).
- Levy et al. (2014) C. D. P. Levy, M. R. Pearson, R. F. Kiefl, E. Mané, G. D. Morris, and A. Voss, Hyperfine Interact. 225, 165 (2014).
- Voss et al. (2011) A. Voss, M. R. Pearson, J. Billowes, F. Buchinger, K. H. Chow, J. E. Crawford, M. D. Hossein, R. F. Kiefl, C. D. P. Levy, W. A. MacFarlane, E. Mané, G. D. Morris, T. J. Parolin, H. Saadaoui, Z. Salman, et al., J. Phys. G: Nucl. Part. Phys. 38, 075102 (2011).
- Vega (2010) A. J. Vega, “Quadrupolar nuclei in solids,” in eMagRes, edited by R. K. Harris and R. L. Wasylishen (Wiley InterScience, New York, 2010).
- Vega et al. (1976) S. Vega, T. W. Shattuck, and A. Pines, Phys. Rev. Lett. 37, 43 (1976).
- Blaha et al. (1985) P. Blaha, K. Schwarz, and P. Herzig, Phys. Rev. Lett. 54, 1192 (1985).
- Schwarz et al. (1990) K. Schwarz, C. Ambrosch-Draxl, and P. Blaha, Phys. Rev. B 42, 2051 (1990).
- Blaha et al. (1988) P. Blaha, K. Schwarz, and P. H. Dederichs, Phys. Rev. B 37, 2792 (1988).
- Darriba et al. (2019) G. N. Darriba, R. Faccio, and M. Rentería, Phys. Rev. B 99, 195435 (2019).
- MacFarlane et al. (2014a) W. A. MacFarlane, T. J. Parolin, D. L. Cortie, K. H. Chow, M. D. Hossain, R. F. Kiefl, C. D. P. Levy, R. M. L. McFadden, G. D. Morris, M. R. Pearson, H. Saadaoui, Z. Salman, Q. Song, and D. Wang, J. Phys. Conf. Ser. 551, 012033 (2014a).
- Selbach et al. (1979) H. Selbach, O. Kanert, and D. Wolf, Phys. Rev. B 19, 4435 (1979).
- Maeda et al. (2005) K. Maeda, M. Sato, I. Niikura, and T. Fukuda, Semicond. Sci. Technol. 20, S49 (2005).
- Minamisono et al. (2010) K. Minamisono, K. Matsuta, T. Minamisono, C. D. P. Levy, T. Nagatomo, M. Ogura, T. Sumikama, J. A. Behr, K. P. Jackson, M. Mihara, and M. Fukuda, Nucl. Instrum. Methods Phys. Res., Sect. A 616, 45 (2010).
- Minamisono et al. (1993) T. Minamisono, T. Ohtsubo, S. Fukuda, I. Minami, Y. Nakayama, M. Fukuda, K. Matsuta, and Y. Nojiri, Hyperfine Interact. 80, 1315 (1993).
- Lany et al. (2000) S. Lany, P. Blaha, J. Hamann, V. Ostheimer, H. Wolf, and T. Wichert, Phys. Rev. B 62, R2259 (2000).
- Wichert and Lany (2001) T. Wichert and S. Lany, Hyperfine Interact. 136, 453 (2001).
- Giannozzi et al. (2017) P. Giannozzi, O. Andreussi, T. Brumme, O. Bunau, M. B. Nardelli, M. Calandra, R. Car, C. Cavazzoni, D. Ceresoli, M. Cococcioni, N. Colonna, I. Carnimeo, A. D. Corso, S. de Gironcoli, P. Delugas, et al., J. Phys.: Condens. Matter 29, 465901 (2017).
- Troullier and Martins (1991) N. Troullier and J. L. Martins, Phys. Rev. B 43, 1993 (1991).
- Perdew et al. (1996) J. P. Perdew, K. Burke, and M. Ernzerhof, Phys. Rev. Lett. 77, 3865 (1996).
- Monkhorst and Pack (1976) H. J. Monkhorst and J. D. Pack, Phys. Rev. B 13, 5188 (1976).
- Reeber (1970) R. R. Reeber, J. Appl. Phys. 41, 5063 (1970).
- Blaha et al. (2020) P. Blaha, K. Schwarz, F. Tran, R. Laskowski, G. K. H. Madsen, and L. D. Marks, J. Chem. Phys. 152, 074101 (2020).
- MacFarlane et al. (2003) W. A. MacFarlane, G. D. Morris, K. H. Chow, R. A. Baartman, S. Daviel, S. R. Dunsiger, A. Hatakeyama, S. R. Kreitzman, C. D. P. Levy, R. I. Miller, K. M. Nichol, R. Poutissou, E. Dumont, L. H. Greene, and R. F. Kiefl, Physica B 326, 209 (2003).
- James and Roos (1975) F. James and M. Roos, Comput. Phys. Commun. 10, 343 (1975).
- Hatlo et al. (2005) M. Hatlo, F. James, P. Mato, L. Moneta, M. Winkler, and A. Zsenei, IEEE Trans. Nucl. Sci. 52, 2818 (2005).
- Mikhail and Agami (1966) H. Mikhail and F. I. Agami, J. Phys. Chem. Solids 27, 909 (1966).
- Brun and Rademakers (1997) R. Brun and F. Rademakers, Nucl. Instrum. Methods Phys. Res., Sect. A 389, 81 (1997).
- Freysoldt et al. (2014) C. Freysoldt, B. Grabowski, T. Hickel, J. Neugebauer, G. Kresse, A. Janotti, and C. G. Van de Walle, Rev. Mod. Phys. 86, 253 (2014).
- Orlinskii et al. (2004) S. B. Orlinskii, J. Schmidt, P. G. Baranov, D. M. Hofmann, C. de Mello Donegá, and A. Meijerink, Phys. Rev. Lett. 92, 047603 (2004).
- Carvalho et al. (2009) A. Carvalho, A. Alkauskas, A. Pasquarello, A. K. Tagantsev, and N. Setter, Phys. Rev. B 80, 195205 (2009).
- Vidya et al. (2012) R. Vidya, P. Ravindran, and H. Fjellvåg, J. Appl. Phys. 111, 123713 (2012).
- Momma and Izumi (2011) K. Momma and F. Izumi, J. Appl. Crystallogr. 44, 1272 (2011).
- Rimini (1995) E. Rimini, “Radiation damage,” in Ion Implantation: Basics to Device Fabrication (Springer US, Boston, 1995) pp. 131–172.
- Wahl et al. (2016) U. Wahl, J. G. Correia, L. Amorim, S. Decoster, M. R. da Silva, and L. M. C. Pereira, Semicond. Sci. Technol. 31, 095005 (2016).
- Wahl et al. (2017) U. Wahl, L. M. Amorim, V. Augustyns, A. Costa, E. David-Bosne, T. A. L. Lima, G. Lippertz, J. G. Correia, M. R. da Silva, M. J. Kappers, K. Temst, A. Vantomme, and L. M. C. Pereira, Phys. Rev. Lett. 118, 095501 (2017).
- Wahl et al. (2020) U. Wahl, E. David-Bosne, L. M. Amorim, A. R. G. Costa, B. De Vries, J. G. Correia, M. R. da Silva, L. M. C. Pereira, and A. Vantomme, J. Appl. Phys. 128, 045703 (2020).
- Vlasenko and Watkins (2005) L. S. Vlasenko and G. D. Watkins, Phys. Rev. B 72, 035203 (2005).
- Knutsen et al. (2013) K. E. Knutsen, K. M. Johansen, P. T. Neuvonen, B. G. Svensson, and A. Y. Kuznetsov, J. Appl. Phys. 113, 023702 (2013).
- Morris et al. (2004) G. D. Morris, W. A. MacFarlane, K. H. Chow, Z. Salman, D. J. Arseneau, S. Daviel, A. Hatakeyama, S. R. Kreitzman, C. D. P. Levy, R. Poutissou, R. H. Heffner, J. E. Elenewski, L. H. Greene, and R. F. Kiefl, Phys. Rev. Lett. 93, 157601 (2004).
- Janotti and Van de Walle (2007) A. Janotti and C. G. Van de Walle, Phys. Rev. B 76, 165202 (2007).
- MacFarlane et al. (2014b) W. A. MacFarlane, C. B. L. Tschense, T. Buck, K. H. Chow, D. L. Cortie, A. N. Hariwal, R. F. Kiefl, D. Koumoulis, C. D. P. Levy, I. McKenzie, F. H. McGee, G. D. Morris, M. R. Pearson, Q. Song, D. Wang, et al., Phys. Rev. B 90, 214422 (2014b).
- Cortie et al. (2015) D. L. Cortie, T. Buck, M. H. Dehn, R. F. Kiefl, C. D. P. Levy, R. M. L. McFadden, G. D. Morris, M. R. Pearson, Z. Salman, Y. Maeno, and W. A. MacFarlane, Phys. Rev. B 91, 241113 (2015).
- Schirmer (1968) O. Schirmer, J. Phys. Chem. Solids 29, 1407 (1968).
- Meintjes et al. (2005) E. M. Meintjes, J. Danielson, and W. W. Warren, Phys. Rev. B 71, 035114 (2005).
- Chow et al. (2000) K. H. Chow, R. F. Kiefl, B. Hitti, T. L. Estle, and R. L. Lichti, Phys. Rev. Lett. 84, 2251 (2000).
- Karner et al. (2018) V. L. Karner, R. M. L. McFadden, A. Chatzichristos, G. D. Morris, M. R. Pearson, C. D. P. Levy, Z. Salman, D. L. Cortie, R. F. Kiefl, and W. A. MacFarlane, JPS Conf. Proc. 21, 011023 (2018).
- Bloembergen et al. (1948) N. Bloembergen, E. M. Purcell, and R. V. Pound, Phys. Rev. 73, 679 (1948).
- Raghavan et al. (1976) P. Raghavan, E. N. Kaufmann, R. S. Raghavan, E. J. Ansaldo, and R. A. Naumann, Phys. Rev. B 13, 2835 (1976).
- Torumba et al. (2006) D. Torumba, K. Parlinski, M. Rots, and S. Cottenier, Phys. Rev. B 74, 144304 (2006).
- Nikolaev et al. (2020) A. V. Nikolaev, N. M. Chtchelkatchev, D. A. Salamatin, and A. V. Tsvyashchenko, Phys. Rev. B 101, 064310 (2020).
- O’Donnell and Chen (1991) K. P. O’Donnell and X. Chen, Appl. Phys. Lett. 58, 2924 (1991).
- Christiansen et al. (1976) J. Christiansen, P. Heubes, R. Keitel, W. Klinger, W. Loeffler, W. Sandner, and W. Witthuhn, Z. Phys. B 24, 177 (1976).
- Nishiyama et al. (1976) K. Nishiyama, F. Dimmling, T. Kornrumpf, and D. Riegel, Phys. Rev. Lett. 37, 357 (1976).
- Amaral et al. (1984) L. Amaral, M. Behar, A. Maciel, and H. Saitovitch, Phys. Lett. A 102, 45 (1984).
- Becker (1982) K. D. Becker, Z. Naturforsch. A 37, 697 (1982).
- Deinert et al. (2015) J.-C. Deinert, O. T. Hofmann, M. Meyer, P. Rinke, and J. Stähler, Phys. Rev. B 91, 235313 (2015).