The effect of grain size on erosion and entrainment in dry granular flows
Abstract
The entrainment of underlying erodible material by geophysical flows can significantly boost the flowing mass and increase the final deposition extent. The particle size of both the flowing material and the erodible substrate influence the entrainment mechanism and determine the overall flow dynamics. This paper examines these mechanisms experimentally by considering the flow of particles over an erodible bed using different particle size combinations for the incoming flow and the base layer in a laboratory-scale inclined flume. Dynamic X-ray radiography was used to capture the dynamics of the flow-erodible bed interface. The experiments found that the maximum downslope velocity depends on the ratio between the size of the flowing particles and the size of the bed particles, with higher ratios leading to faster velocities. Two techniques were then applied to estimate the evolving erosion depth: an established critical velocity method, and a novel particle-size-based method. Erosion rates were estimated from both of these methods. Interestingly, these two rates express different and contradictory conclusions. In the critical-velocity-based rate estimation, the normalized erosion rate increases with the flow to bed grain size ratio, whereas the erosion rates estimated from the particle-size-based approach find the opposite trend. We rationalise this discrepancy by considering the physical interpretation of both measurement methods, and provide insight into how future modelling can be performed to accommodate both of these complementary measures. This paper highlights how the erosion rate is entirely dependent on the method of estimating the erosion depth and the choice of measurement technique.
JGR: Earth Surface
School of Civil Engineering, The University of Sydney, Sydney, Australia \correspondingauthorBenjy Marksbenjy.marks@sydney.edu.au
The grain size of both the flowing and bed materials significantly influence erosion and entrainment in geophysical granular flows
A new technique for measuring erosion is proposed which uses dynamic X-ray radiography to measure the grain size within the flowing material
The measured erosion rate strongly depends on the measurement technique, with previous techniques giving inconsistent results
Plain Language Summary
[Geophysical granular flows often cause severe destruction in mountainous terrains. The destructive potential of these flows is determined by the material and terrain properties and the dynamic interaction of the flow and the substrate. Erosion and entrainment of the substrate into the flow can cause significant volume expansion and increase the runout distance and the hazard to human safety. Here, we experimentally investigate these mechanisms with a particular interest in the effect of the relative particle size of the flowing and erodible substrate materials. A flow of particles over an erodible base was examined in a laboratory-scale inclined flume with different particle size combinations for the flow and the erodible substrate. The dynamics of the flow-erodible bed interface was captured with X-ray radiography. The evolving erosion depths were estimated from the well-established critical velocity based method and a novel particle size-based method. The erosion rates estimated from the two approaches gave contradictory conclusions. The study reveals that the erosion rate is entirely dependent on the measurement technique and the erosion depth evaluation method.]
1 Introduction
Geophysical granular flows such as landslides, debris flows and avalanches frequently threaten life, property and infrastructure in steep, hilly terrain. The destructive potential, size and flow velocity of these geophysical mass flows are strongly influenced by material rheology, terrain properties and the interaction mechanisms involved in the flow regime [Mangeney (\APACyear2011), R\BPBIM. Iverson \BBA Chaojun (\APACyear2015)]. The flow paths of the geophysical flows are usually covered with heterogeneous weathered geomaterials deposited in different geological events. During the mass movement process, the rapid flow interacts with the underlying surficial deposits and can incorporate these materials into the flowing system.
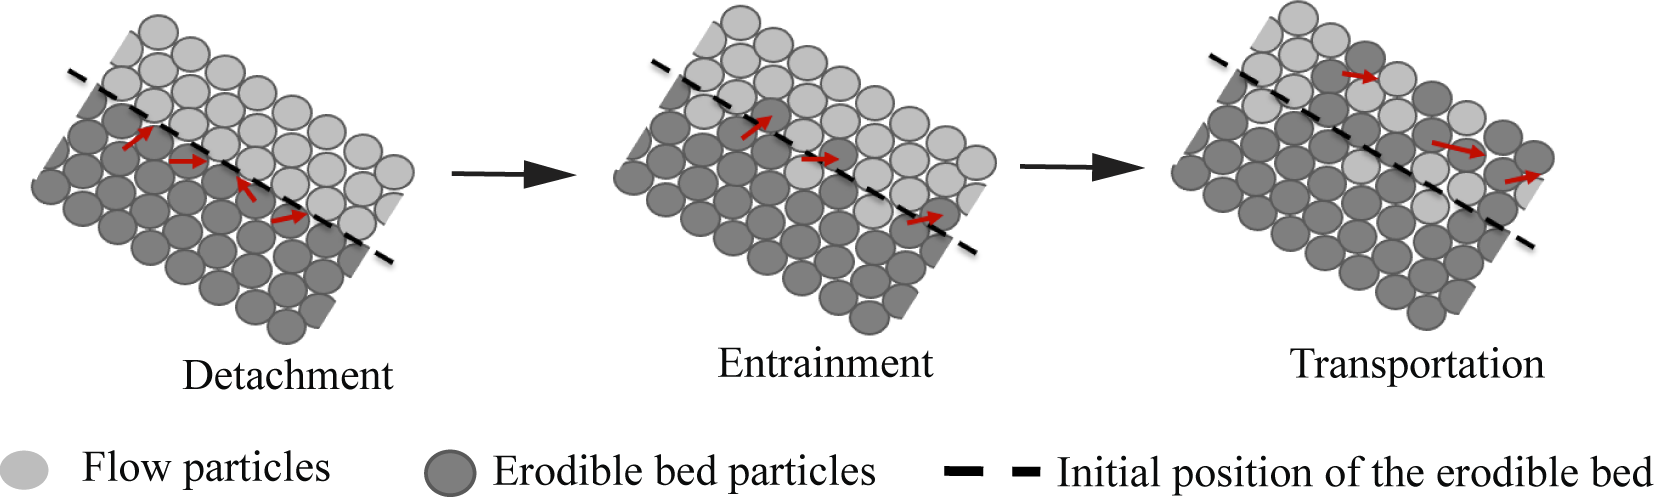
Erosion is an important process in the dynamics of landslides, contributing to an increase in the flow volume and modifying the flow mobility by changing the material characteristics in the basal region of the flow mass [Pirulli \BBA Pastor (\APACyear2012)]. The erosion process has been described as a combination of several successive mechanisms, namely detachment, entrainment and transportation, which are closely interrelated to each other [Bracken \BOthers. (\APACyear2015), van Damme (\APACyear2020)] (see Figure 1). Entrainment is often interpreted as the key mechanism responsible for the erosion of the underlying bed material [Mangeney (\APACyear2011), Moberly (\APACyear2015), R\BPBIM. Iverson \BBA Chaojun (\APACyear2015), Kang \BBA Chan (\APACyear2017)]. According to field observations, the magnitude of the debris flow or the avalanche is rarely determined by its initial volume, as it often enlarges significantly due to the entrainment of materials along its path [Hungr \BOthers. (\APACyear2005), Farin \BOthers. (\APACyear2014)].
The erosion and entrainment mechanisms are interrelated to each other and it is crucial to distinguish the two mechanisms in experimental quantification. The rate of change of the bed elevation is the common measure of the basal erosion rate. \citeAChao:2017 provided a local scale definition for the entrainment rate as the material volume flux per unit area that enters into the flow. In early studies, the entrainment rate was correlated with parameters such as the difference between the angle of inclination and the repose angle of the materials [Tai \BBA Kuo (\APACyear2008)], excess boundary shear stress and basal flow velocity [R\BPBIM. Iverson (\APACyear2012)].
In order to understand the mechanics and conditions, erosion and entrainment experiments have been conducted at different scales using inclined flume configurations. The flow is typically captured with high-speed video cameras by observing the flow through a transparent side wall of the flume. The primary concern of those experiments has been to investigate the effect of different boundary conditions on erosion and to estimate the erosion rate [Egashira \BOthers. (\APACyear2001), Papa \BOthers. (\APACyear2004), Mangeney \BOthers. (\APACyear2010), M\BPBIE. Iverson Richard M.and Reid \BOthers. (\APACyear2011), Farin \BOthers. (\APACyear2014), Moberly (\APACyear2015), Lu \BOthers. (\APACyear2016), Yunyun \BOthers. (\APACyear2019), Ghasemi \BOthers. (\APACyear2019)].
A few studies have been conducted to investigate the impact of the flow and substrate grain size on entrainment. \citeAEgashira:2001 and \citeAPapa:2004 studied the erosion profiles of particle flow over different bed grain sizes. They concluded that the erosion rate monotonically decreases with increase of relative bed particle size. \citeAGhasemi:2019 concluded that bed erosion often increases with increasing the bed particle coarse fraction.
The use of laboratory scale flumes to model geophysical flows introduces several scaling issues [R\BPBIM. Iverson \BOthers. (\APACyear2010)]. In addition, the presence of sidewalls means that the flow is strongly perturbed in these regions [Jop \BOthers. (\APACyear2005)] and that measurements made there are not representative of the bulk flow. To overcome this limitation, many technologies have been applied to investigate the internal micro-mechanics of granular media including Magnetic Resonance Imaging (MRI) [Stannarius (\APACyear2017), Nakagawa \BOthers. (\APACyear1993)], Positron Emission Particle Tracking (PEPT) [Buffler \BOthers. (\APACyear2018), Parker \BOthers. (\APACyear1997)], X-ray computed tomography (X-ray CT) [Andò \BOthers. (\APACyear2012), Karatza \BOthers. (\APACyear2019)] and X-ray radiography [Guillard \BOthers. (\APACyear2017), Baker \BOthers. (\APACyear2018), Dulanjalee \BOthers. (\APACyear2020), Méjean \BOthers. (\APACyear2021)]. Each technique has its own advantages depending on the behavior of the flow regime and the focus of the investigation. Of these, X-ray radiography is a non-destructive investigative tool which has been developed to investigate internal micro-mechanical aspects of materials and multi-phase flows [Heindel (\APACyear2011)]. X-ray radiography is a useful tool in granular flow research that is capable of capturing the internal evolving velocity field, particle size and orientation fields [Guillard \BOthers. (\APACyear2017)] as well as measuring the grain size fractions of evolving bidisperse materials [Dulanjalee \BOthers. (\APACyear2020)]. X-ray radiography captures the bulk flow behavior through the whole depth of the sample. Therefore, it minimises the effect of unrepresentative boundary layers that exist adjacent to the boundaries of experiments which are commonly observed with optical methods.
In a typical laboratory experiment, the only depth-dependent information comes from a high-speed camera which is positioned to observe through a transparent side wall. To approximate the erosion depth with such data, a ‘critical velocity method’ [Moberly (\APACyear2015)] is commonly used to infer the position of the interface between the flowing material and the erodible bed using an arbitrary velocity cutoff in the downslope velocity profile. Alternative methods are available when further information on the grain types is measurable experimentally. In some reported experiments, different coloured particles were used for the flowing and erodible materials, such that the interaction between the materials could be measured using colour on the recorded video as a proxy [Ghasemi \BOthers. (\APACyear2019)]. In this work, we have access to radiographs of the material over time, which can be used to infer the relative concentration of large and small particles in bidisperse granular mixtures directly [Dulanjalee \BOthers. (\APACyear2020)]. This ‘bidisperse calibration method’ is a novel approach that relies on the ability of X-rays to pass through the medium, and characterise the micro-structure. By comparing the spatial length scale of the fluctuations of the density field, and with knowledge of the grain sizes, it is possible to estimate the local concentration of the two materials in a patch of an image.
The purpose of this paper is to experimentally investigate the effect of grain size on the erosion mechanism using small-scale laboratory experiments. Specifically, we focus on different grain size combinations in the flowing and erodible bed materials on the erosion rate, which has not been systematically studied in previous work. In geophysical flows, the flowing material typically is not the same as the eroding material, and their particle sizes can vary widely due to heterogeneity of the in-situ material, as well as particle segregation and crushing during the flow [Johnson \BOthers. (\APACyear2012)]. Additionally, the use of X-ray radiography as an imaging methodology allows us firstly to avoid the limitations in data capturing only near sidewalls, and secondly to enable measurement of the grain size within the flowing material.
2 Materials and methods
The main focus of this paper is the experimental investigation of the effect of grain size on the erosion mechanism during dry granular flow over an erodible bed. To investigate this experimentally, a laboratory-scale inclined flume setup was designed and the evolving flow field and grain size distribution was captured with dynamic X-ray radiography.
2.1 Experimental configuration
The experimental setup (as shown in Figure 2) is made of acrylic sheets and consists of a 1 m long flume with side walls spaced 10 cm apart. The flume is connected to a holding tank at the upstream end via an automated gate which is attached to a linear stage that raises the gate in the direction. The material flow rate released from the tank is controlled by adjusting the final height of the automated gate. The flume bed consists of two sections. After particles exit the holding tank, they pass over a rigid, smooth acrylic base for a distance of 30 cm. For the last 15 cm of this section, sand paper of grit size 180 is glued to the rigid bottom to increase friction. The remaining section is composed of a separate chamber lowered 10 cm down from the initial flume bottom to hold the erodible layer (dimensions are as shown in Figure 2). All of the experiments reported here were conducted at a flume inclination angle of 24∘. We define a coordinate system in Figure 2 with three mutually perpendicular orientations, being in the downslope direction, being normal to the slope and being the cross slope direction. and are the respective internal reference coordinates of the detector panel, parallel to the and directions.
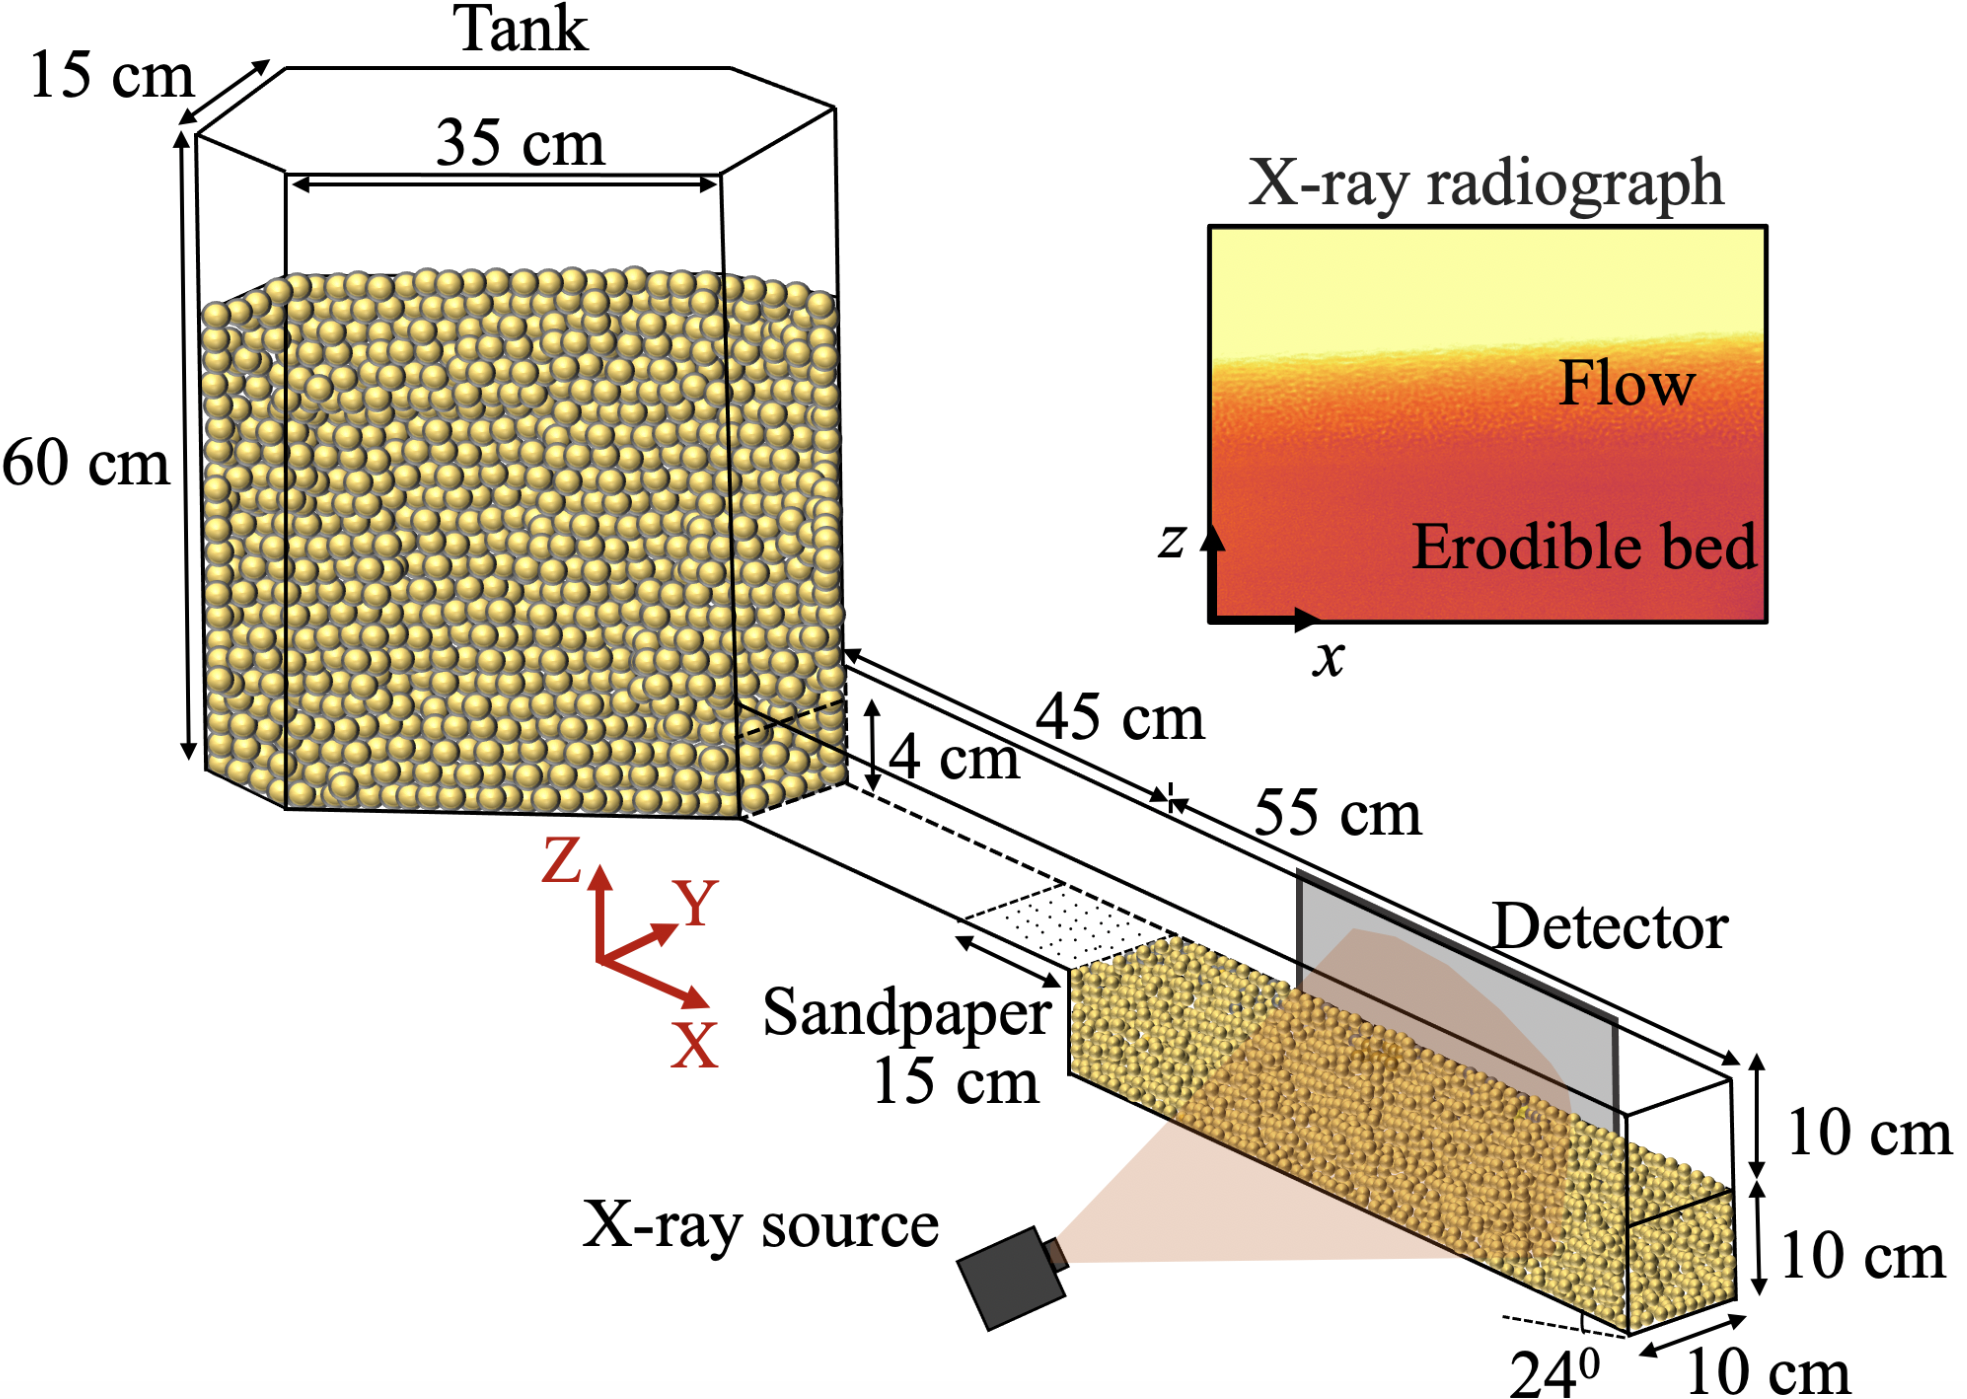
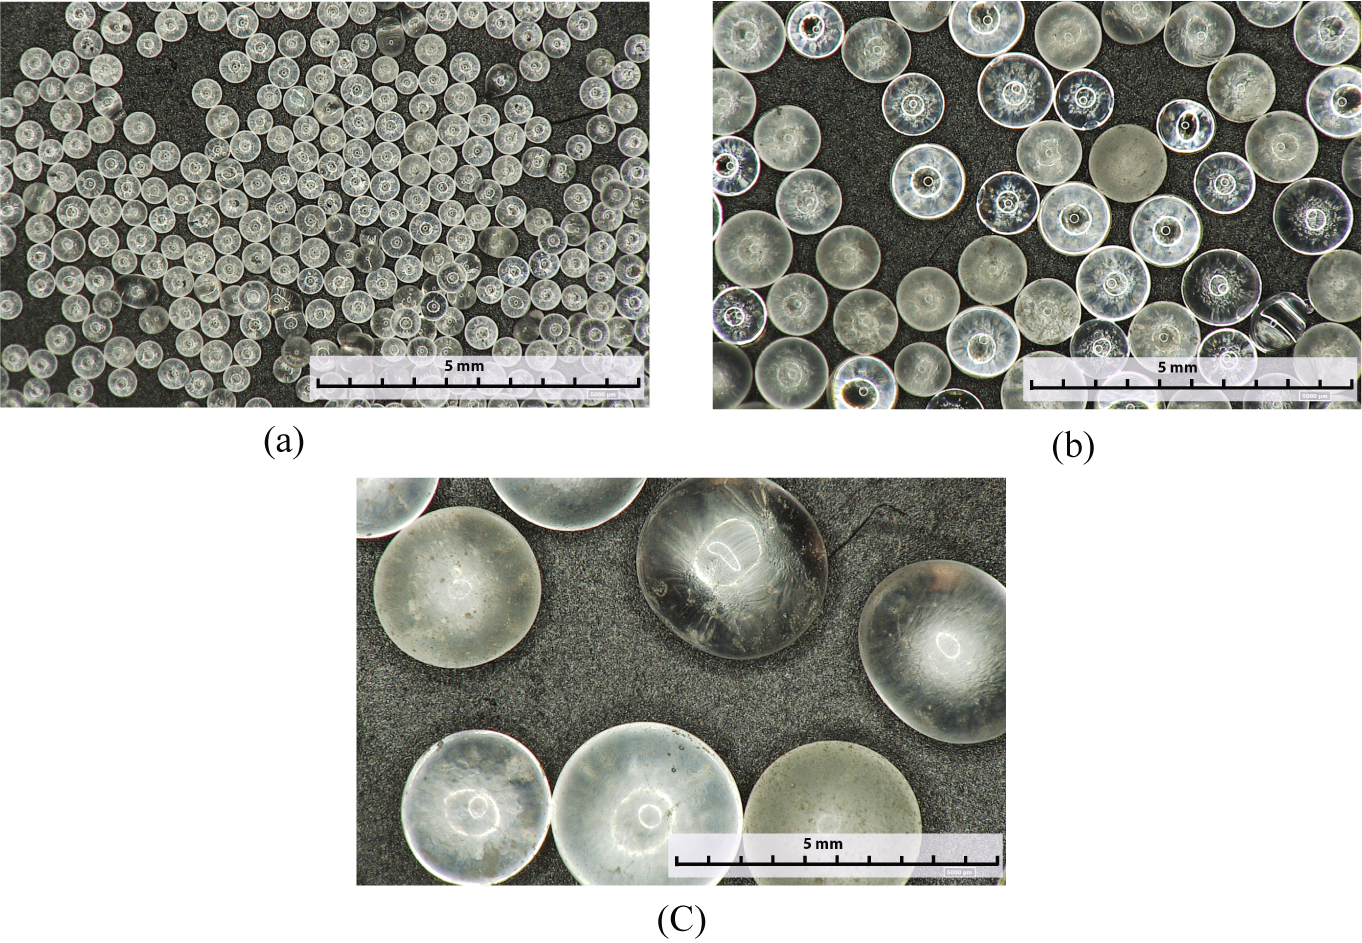
Soda lime glass beads of three sizes; nominally 0.5 mm, 1 mm and 3 mm diameter were chosen as the flowing and the erodible bed materials. The glass bead characteristics are shown in Table 1 and microscope images of their morphology are shown in Figure 3. The typical diameter of the flowing and the bed materials are referred to as and respectively. The static repose angles were estimated using the hollow cylinder method [Liu (\APACyear2011)]. The values of the bulk densities were estimated by measuring the mass of a known volume (glass bead volume of a 500 mL graduated beaker)[Qiu \BOthers. (\APACyear2015)].
As shown in Table 2, eight experiments were conducted with different grain size combinations of the flowing and the erodible bed. Initially, the tank behind the closed gate was filled with the flow material to a height of 50 cm from the bottom of the tank. The erodible bed chamber was filled to the flume level (10 cm thickness) by pouring the bed material with a hand spade under gravity to form a loose bed. The surface of the bed was levelled with a piece of cardboard to maintain an even flow surface and uniform thickness. The experimental procedure attempted to conduct all experiments in similar flow conditions. Therefore, the experiments were conducted with the same gate height and gate opening speed. For all experiments reported here the gate was opened to a height of 40 mm, at an opening speed of 10 mm/s. As the gate opened, the material flow was initiated and the flowing mass was transported along the flume and over the erodible bed area. The materials that left the flume were collected in a bin at the end of the flume.
| Grain size | Repose angle | Bulk density |
| (mm) | ( 10) | (kg/m3) |
| 0.5 | 20 | 1800 12 |
| 1 | 22 | 1712 14 |
| 3 | 24 | 1622 15 |
| 0.5 | 1.0 | 3.0 | |
| 0.5 | - | A | B |
| 1.0 | C | D | E |
| 3.0 | F | G | H |
The motion of the flowing glass beads over the erodible bed was captured with dynamic X-ray radiography. The X-ray source was aligned with the flow to capture the flow field from one side of the flume wall (X-ray beam pointing in the Y direction, and imaging in the XZ plane)(see Figure 2). The X-ray source was aligned to capture the centre of the middle region of the erodible bed chamber. A Varian NDI-225-21 X-ray tube was used to emit radiation at a maximum energy of 180 keV and intensity of 8 mA. This radiation passed through the grains in the flume, and the transmitted radiation was recorded on a PaxScan 2520DX detector panel at a resolution of 768 px 960 px and recording speed of 30 frames per second. The measured intensity of X-rays () at a location on the detector panel can be approximated by the Beer-Lambert law as,
| (1) |
where is the intensity of the source and is the mass attenuation coefficient for the X-ray radiation, at a location along the line of sight between the X-ray source and the pixel of interest. For materials of a single chemical composition, the mass attenuation coefficient is proportional to the density of the material [Hubbell (\APACyear1982)]. Therefore, the radiographs provide a local measurement of the density integrated along the ray path.
2.2 Flow height measurement
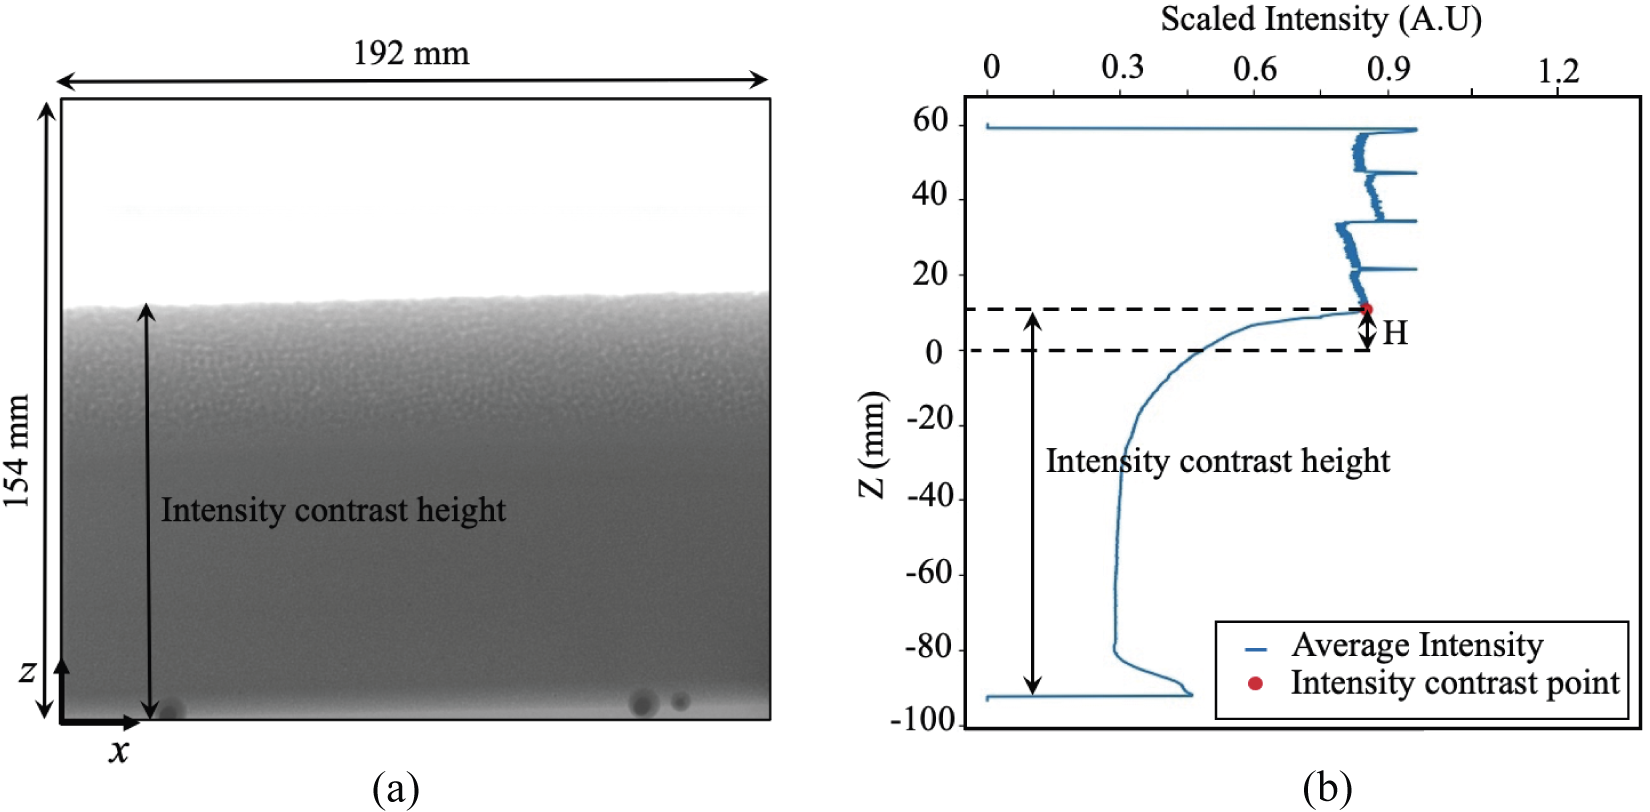
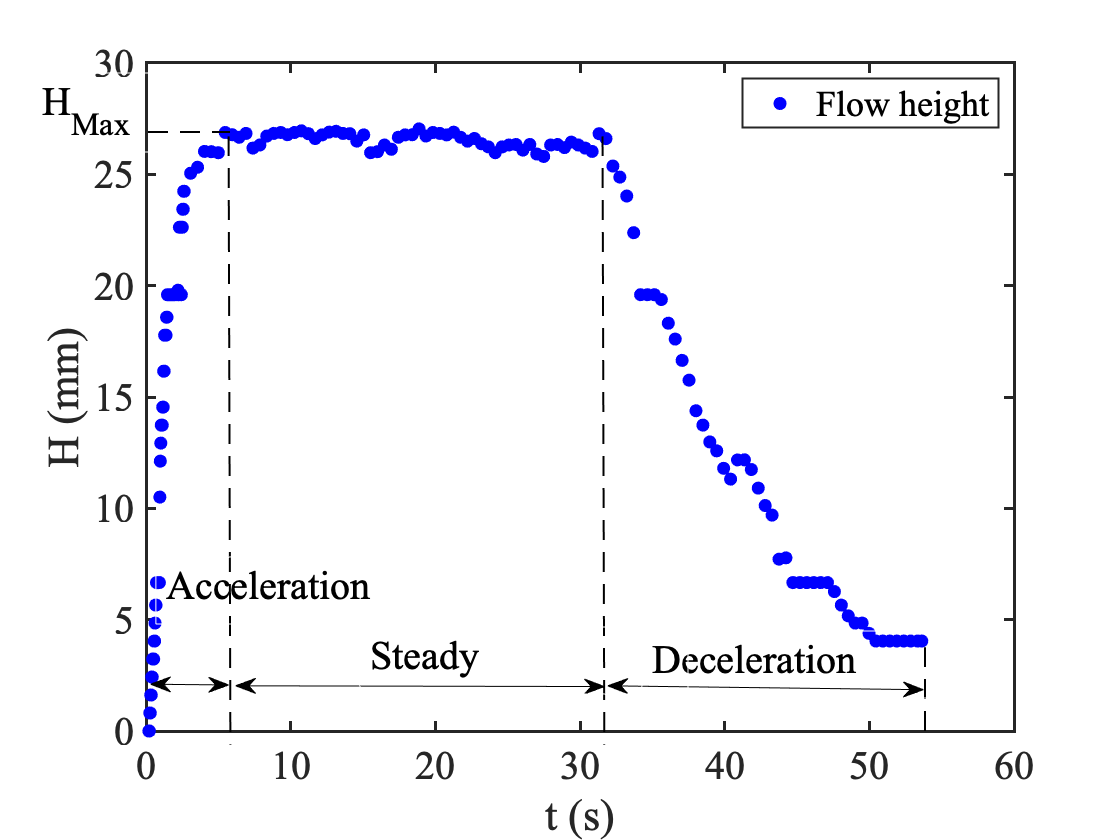
As shown in Figure 4(a) the radiographs exhibit a clear intensity contrast between the granular materials (dark regions on radiographs) and the particle-free zones (white regions). The interface between these two regions corresponds to the flow height at that particular time frame. To detect this interface, we averaged the X-ray intensity along the direction of the radiograph. The intensity of the X-ray beam is significantly lower when passing through the glass beads than through air (see Figure 4(a and b)). The interface between these two regions is delineated by a sharp change in intensity, which was used to identify the intensity contrast height.
When the gate is opened, the flowing material is suddenly released. The generated flow undergoes three distinct phases: acceleration, steady flow and deceleration (Figure 5). During the acceleration phase, the flow height gradually increases as material is released from the gate. At steady state the flow achieves a maximum uniform flow height . The decelerating phase occurs when the material in the tank empties.
2.3 Flow velocity measurement
Since granular materials are inhomogeneous, the radiographs depict the local density fluctuations of the flowing and the bed materials as they evolve in time. These series of evolving images were used to measure displacements over time using particle image velocimetry (PIV). PIV measures the velocity vector field between two consecutive images by applying cross-correlation analysis to deduce the most likely displacement in each selected image patch [Adrian \BBA Westerweel (\APACyear2011)]. Here, the cross-correlation peak represents the modal displacement inside the measurement volume between two frames. This approach gives a measurement of two in-plane velocity components. The velocity estimated from X-ray radiography is more representative (when compared to PIV on more common optical images [Gollin \BOthers. (\APACyear2017)]) of the motion far from boundaries, as it estimates the most probable velocity value along the beam.
The PIV tool PIVlab [Thielicke \BBA Stamhuis (\APACyear2014)] is used to extract the velocity field from the radiographs. PIV analysis typically consists of three steps; image pre-processing, evaluation and post-processing. In pre-processing, contrast limited adaptive histogram equalization (CLAHE) was applied to normalise the images. Patches of 6464 pixels with 50 % overlap were processed (approx 88 mm) to find the typical displacement field. In post-processing, vector validation was performed by manually setting velocity limits to remove unphysical values.
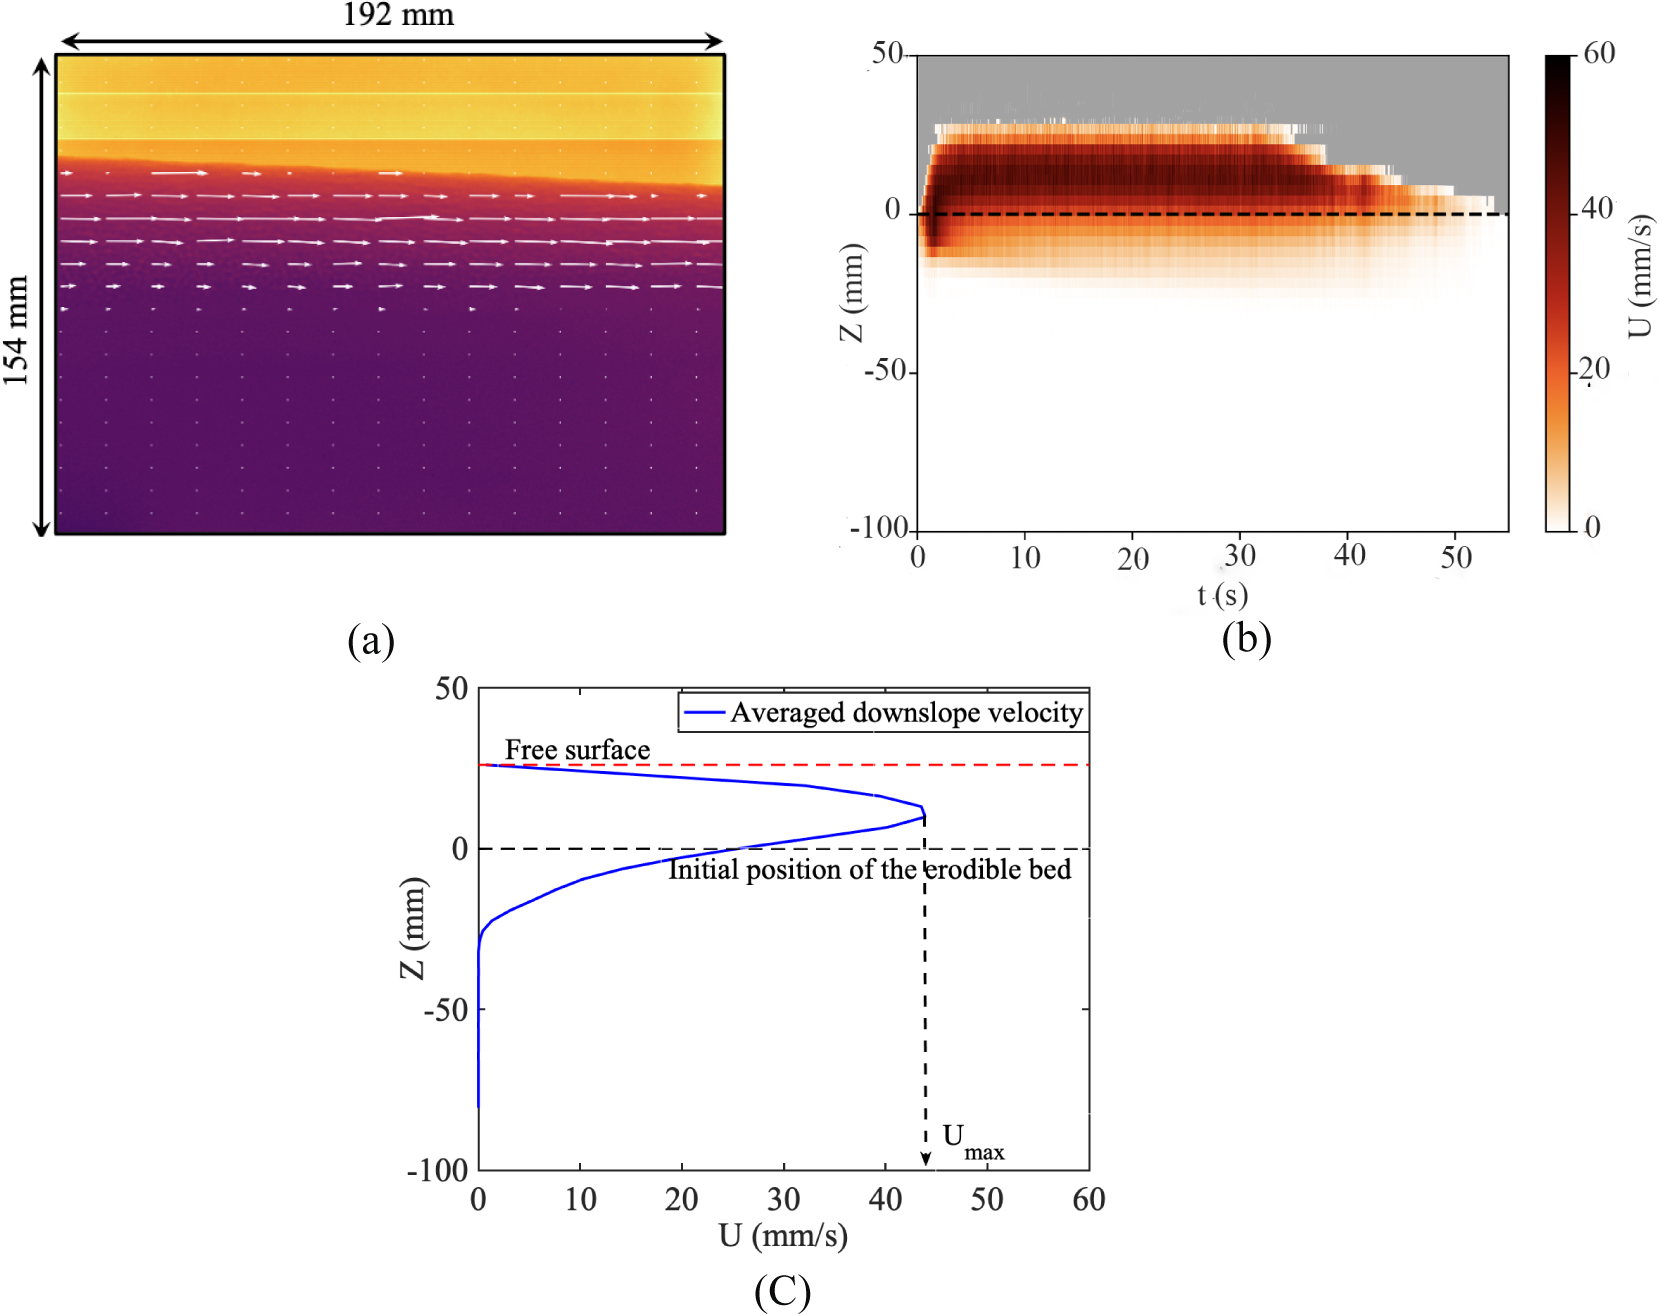
The recovered PIV velocity field superimposed over an radiograph (Figure 6(a)) shows a typical downslope velocity field of the inclined flume. A static bottom layer, a dense flowing layer which extends from the static bottom layer to the maximum velocity level and an agitated fast flowing thin layer on top. The spatio-temporal distribution of the averaged downslope velocity (Figure 6(b)) gradually increases with time until it reaches a maximum velocity. This velocity phase exists for a certain time and velocity gradually decreases as the material in the tank empties. The temporally and spatially averaged downslope velocity at steady flow state (Figure 6(c)) decays exponentially with the distance from the top layer. The free surface level is estimated from the maximum flow height as shown in Figure 5. The velocity field appears to decrease between the maximum velocity and the free surface.This may indicate that the velocity of this thin layer is too fast to trace by PIV or that the flow density decreases to zero in this region, or both.
2.4 Erosion depth and erosion rate determination
2.4.1 Erosion depth
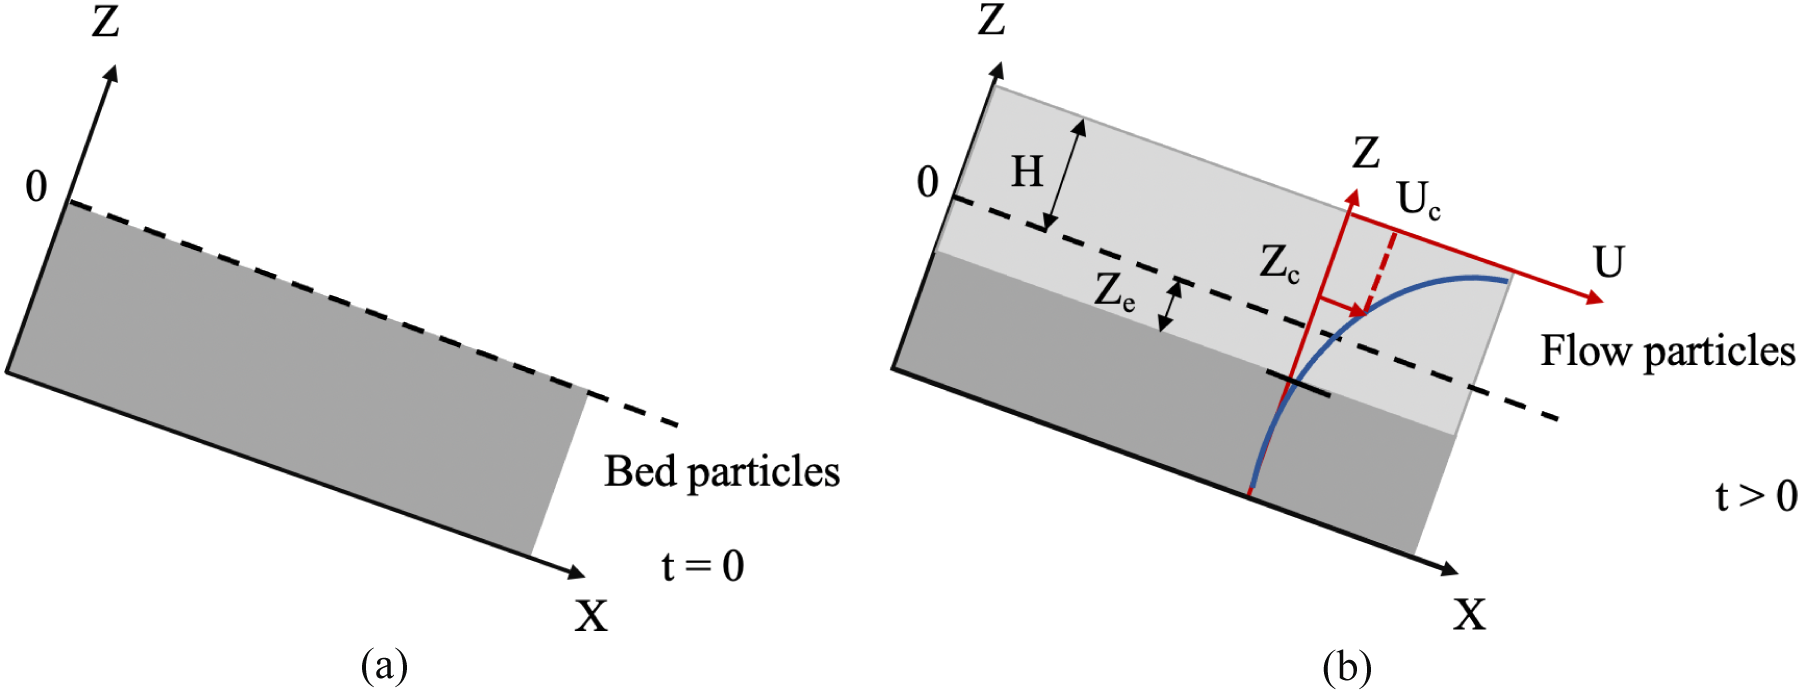
The erosion depth is determined based on the position of the upper level of the erodible bed. The erosion depth () is calculated as the elevation difference between the current and the initial position of the erosion bed (Figure 7). Therefore, a negative signed erosion depth value indicates erosion, and deposition is indicated with a positive sign. Two methods are used below to estimate this erosion depth.
2.4.2 Critical velocity method
As is typical for flows over erodible beds, the downslope velocity decreases exponentially near the flow-erodible bed interface (Figure 6(b)). The depth at which the downslope velocity becomes zero resembles the ‘motion’ and ‘no-motion’ interface (flow-erodible bed interface). In an exponentially decreasing velocity trend it is difficult to estimate the height at which the velocity reaches a value of zero. Therefore, a critical velocity value () of 0.001 ms-1 was assumed as the velocity of the flow-erodible bed interface. This value was chosen arbitrarily, although the final results are not sensitive to small changes in this value.
2.4.3 Bidisperse calibration method
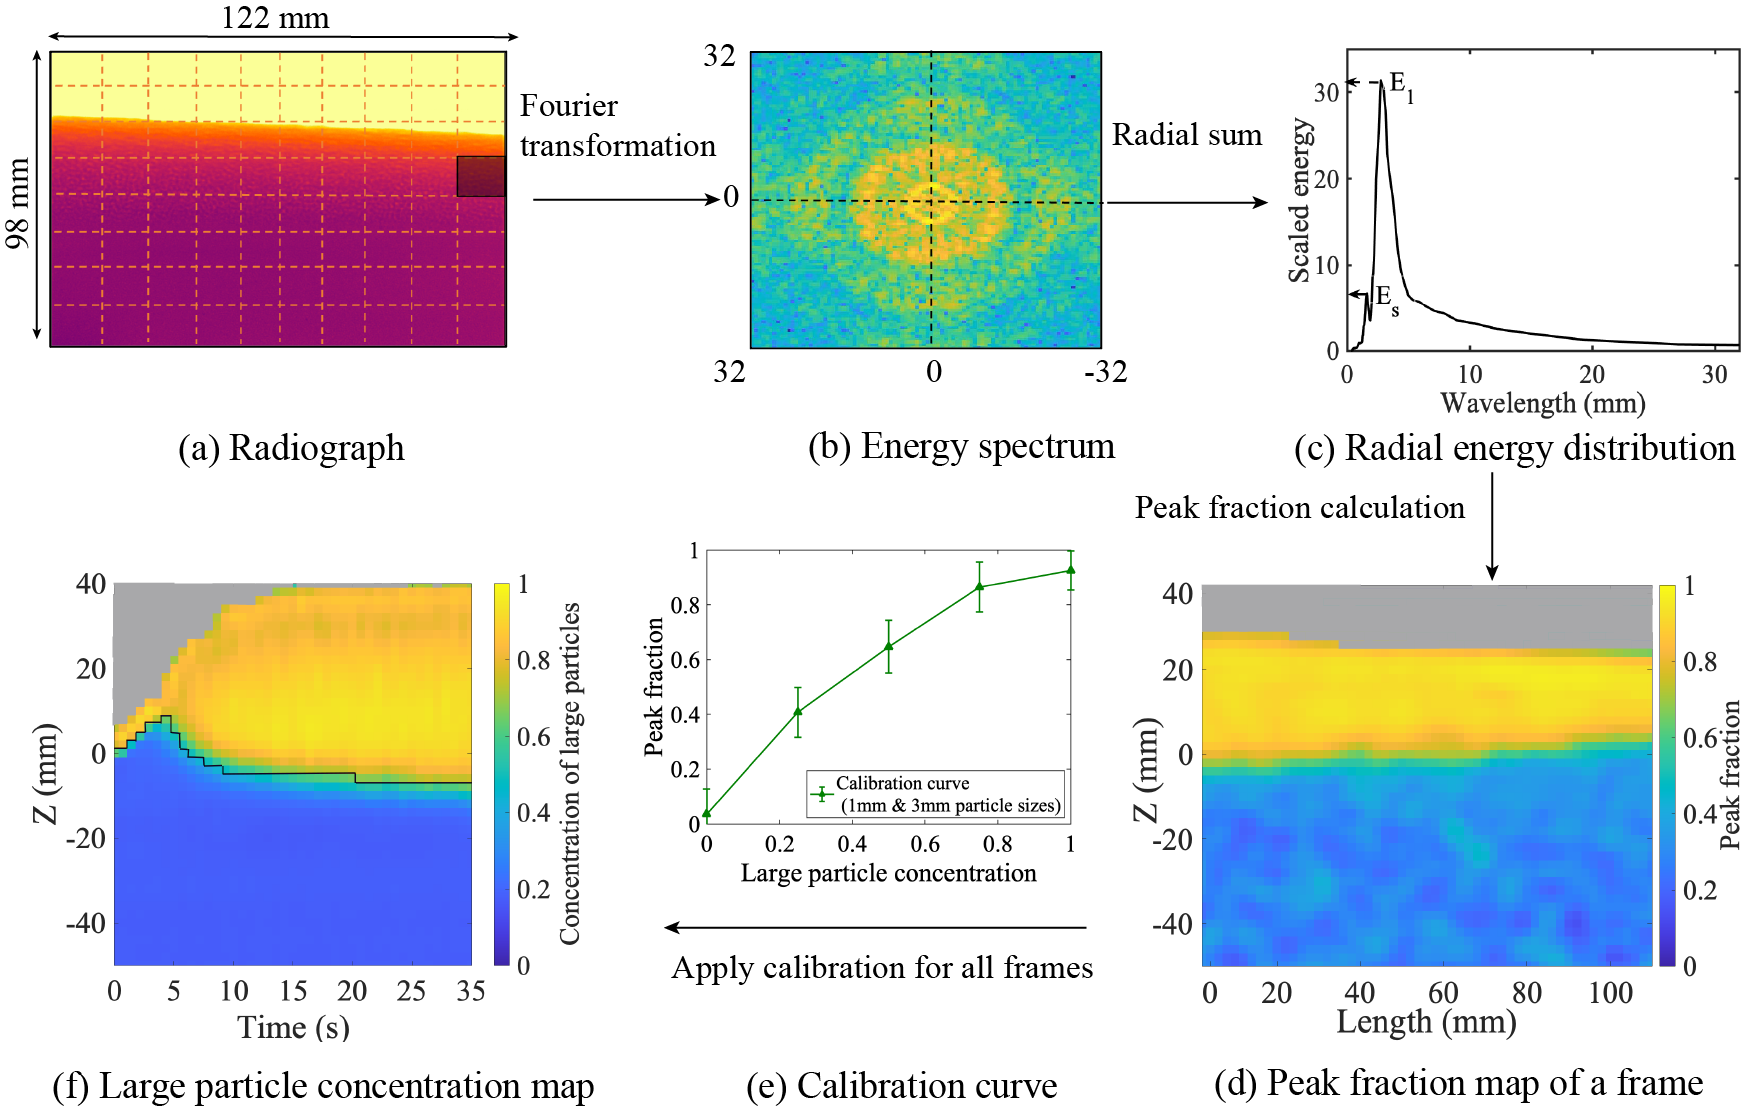
In this work a new measure of the interfacial layer position is proposed and measured. We refer to this as the ‘bidisperse calibration’ method, in contrast with the above ‘critical velocity’ method. This bidisperse calibration technique has previously been developed to determine the relative volume fractions of the grain sizes in evolving bidisperse granular materials [Dulanjalee \BOthers. (\APACyear2020)]. The volume fraction is uniquely defined by the concentration of the large particles of the bidisperse granular system at a certain representative volume in space and time. The bidisperse calibration methodology is based on using Fourier transforms of X-ray radiographs (Figure 8(a)) to extract local measurements which evolve over time and can be related to the particle size distribution (Figure 8(b)). The technique measures the relative concentration of the two distinct species via a heuristic calibration parameter “peak fraction”. This peak fraction is a measure of the relative height of two peaks in the orthoradially summed energy spectrum at the two spatial wavelengths of the particle sizes of the bidisperse mixture (Figure 8(c)). Three sets of calibration curves (one for each of the three bidisperse systems: 1 mm-3 mm combination, 0.5 mm-1 mm combination and 0.5 mm-3 mm combination) were generated using this approach to interpret the relationship of the concentration of the large particles in the bidisperse system and the measured peak fraction. Peak fraction maps were generated from the series of radiographs (Figure 8(d)). The peak fraction maps were converted to a concentration map based on the relevant calibration curve (Figure 8(e)) which was produced using the technique shown in \citeADulanjalee:20. The position of the erodible bed was assumed to exist at a concentration value of of the bed grain size, although the results are largely insensitive to changes of this value as the mixing zone is typically small (Figure 8(f)).
Two sets of erosion profiles were generated from the erosion depth values estimated using both the critical velocity method and the bidisperse calibration method (see Supplementary Information Figure S7 for more information). The two methods lead to distinctly different erosion depth measurements. The critical velocity-based erosion profiles generally follow the flow phases, with a transient phase as the flows start, a steady phase, and deceleration at the end of the flow. Rapid erosion during the flow initiation is a common feature for experiments where the flowing particle size is greater than the bed particle size. The experiments where the flowing particle size is similar or smaller than the bed particle size exhibit rapid erosion and subsequent deposition during the flow initiation. During steady flow, both erosion (Experiments , , and ) and deposition (Experiments , , and ) conditions are observed. The deposition condition can be interpreted in two ways, corresponding either to the deposition of the eroded materials from upstream or a decrease of the flow velocity. Concentration-based erosion profiles exhibit a rapid increase of the bed level at during the flow initiation phase. Immediately after this increase, the erosion depths tend to decrease with time and reach a steady erosion depth during the later stage (deceleration phase) of the flow. The erosion depth profiles show three different trends of erosion namely, initial rapidly eroding profiles (,), shallow eroding profiles (,) and a combination of both (,).
2.4.4 Erosion rate
The erosion rate () is defined as the rate of change of the erosion depth, and can be approximated by
| (2) |
where is the change in erosion depth and is the time step between measurements (for the experiments reported here this is a constant of 1/30 s).
The erosion rates were estimated by fitting an exponential curve to the erosion profiles. In the critical velocity approach, the erosion rate was estimated by fitting an exponential curve to the erosion profile segment during steady flow state, as during changes in flow behaviour (such as near the onset and cessation of flow) this measure is not representative of the erosion depth. For the bidisperse calibration method, an exponential curve was fitted from the maximum tip of the profile onwards (after the first bulbous head of the flow has passed, Figure 9). In both cases, the equation of the exponential curve fit is given by
| (3) |
where is the total erosion depth, the decay time and a constant. Reference erosion rates, which are representative of the whole time dependent behaviour were estimated from the fitted values of the constants as .
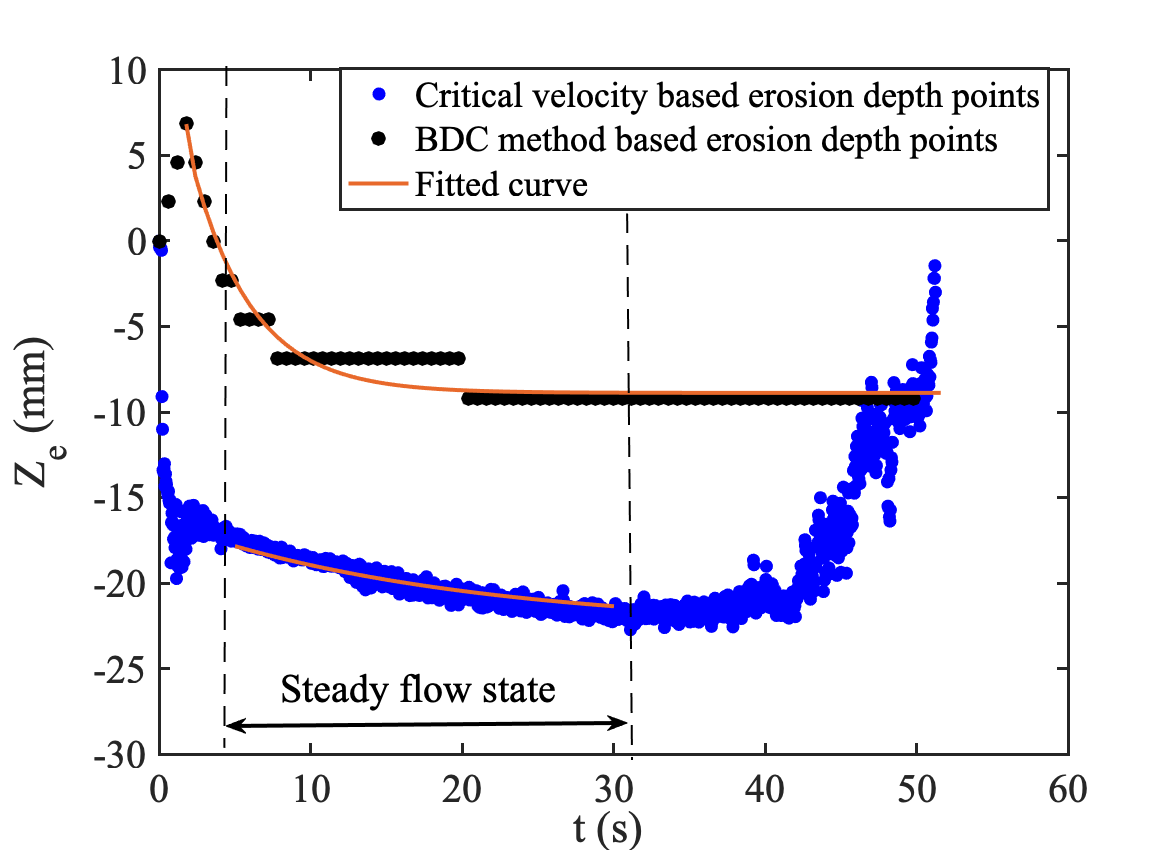
Erosion rates estimated from the exponential curve fitting are shown in Tables 3 and 4. In comparison with the bidisperse calibration method, the critical velocity method captures significantly smaller erosion rates. This discrepancy is linked to the fact that for the bidisperse calibration method the total erosion profile is considered for the rate estimation, whereas for the critical velocity approach only the steady flow state is considered (as shown in Figure 9).
| 0.5 | 1.0 | 3.0 | |
|---|---|---|---|
| 0.5 | - | 0.5 | 0.2 |
| 1.0 | -0.4 | 0.3 | -0.3 |
| 3.0 | -0.5 | -0.4 | 0.1 |
| 0.5 | 1.0 | 3.0 | |
|---|---|---|---|
| 0.5 | - | -8.6 | -12.1 |
| 1.0 | -6.1 | - | -7.7 |
| 3.0 | -3.7 | -1.7 | - |
3 Results and discussion
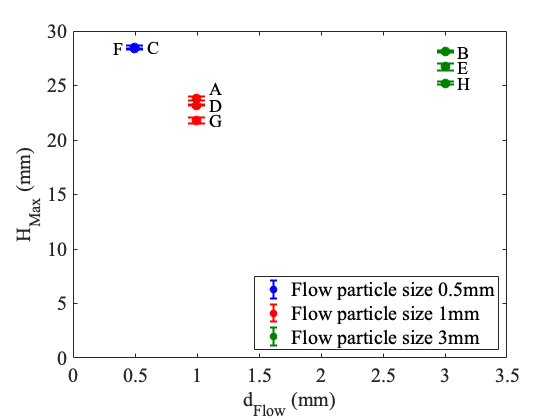
In Figure 10 the average maximum flow height during the steady flow state is shown. It can be seen that experiments with identical flowing grain size have similar flow heights, and can be considered as representing similar flow conditions. Larger basal grain sizes tend to decrease the depth of the flowing layer.
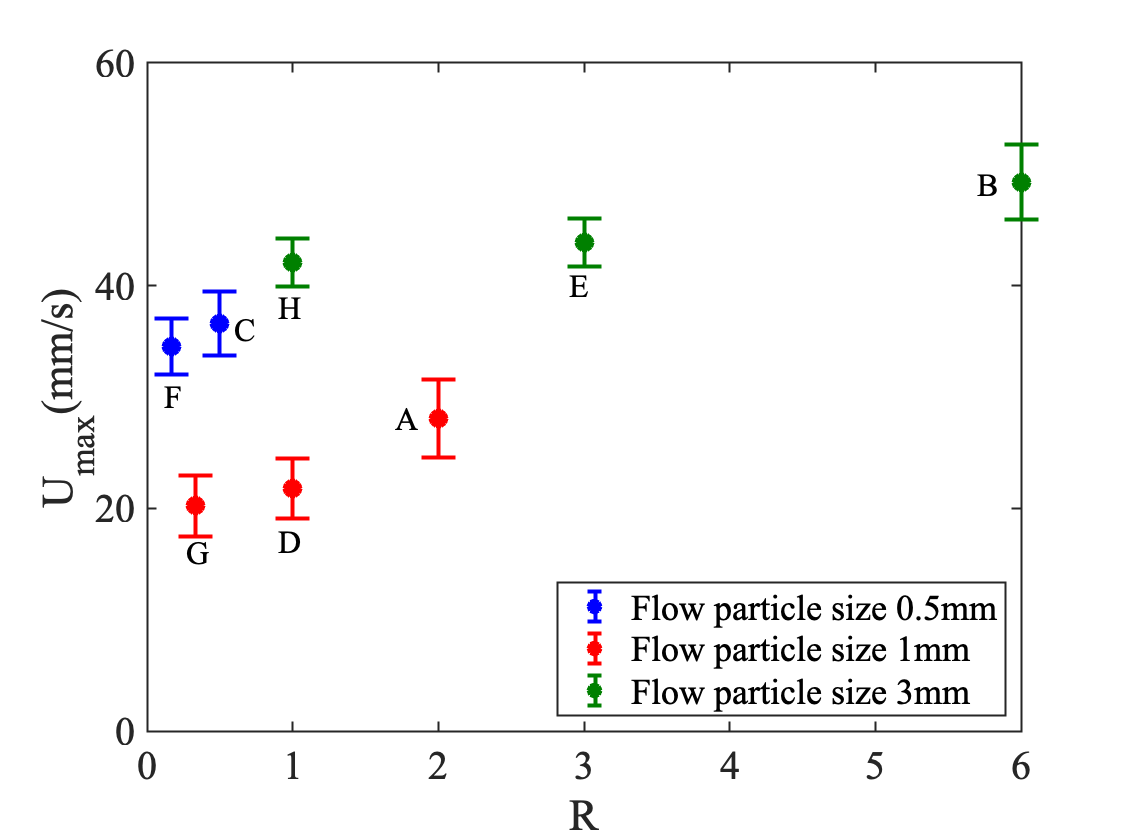
The relationship between the maximum average downslope velocity at the steady flow state and the flow to bed particle size ratio, is shown in Figure 11. Here, and are the diameters of the flow and bed materials respectively. As shown in Figure 11, increases as increases for a given flow particle size.
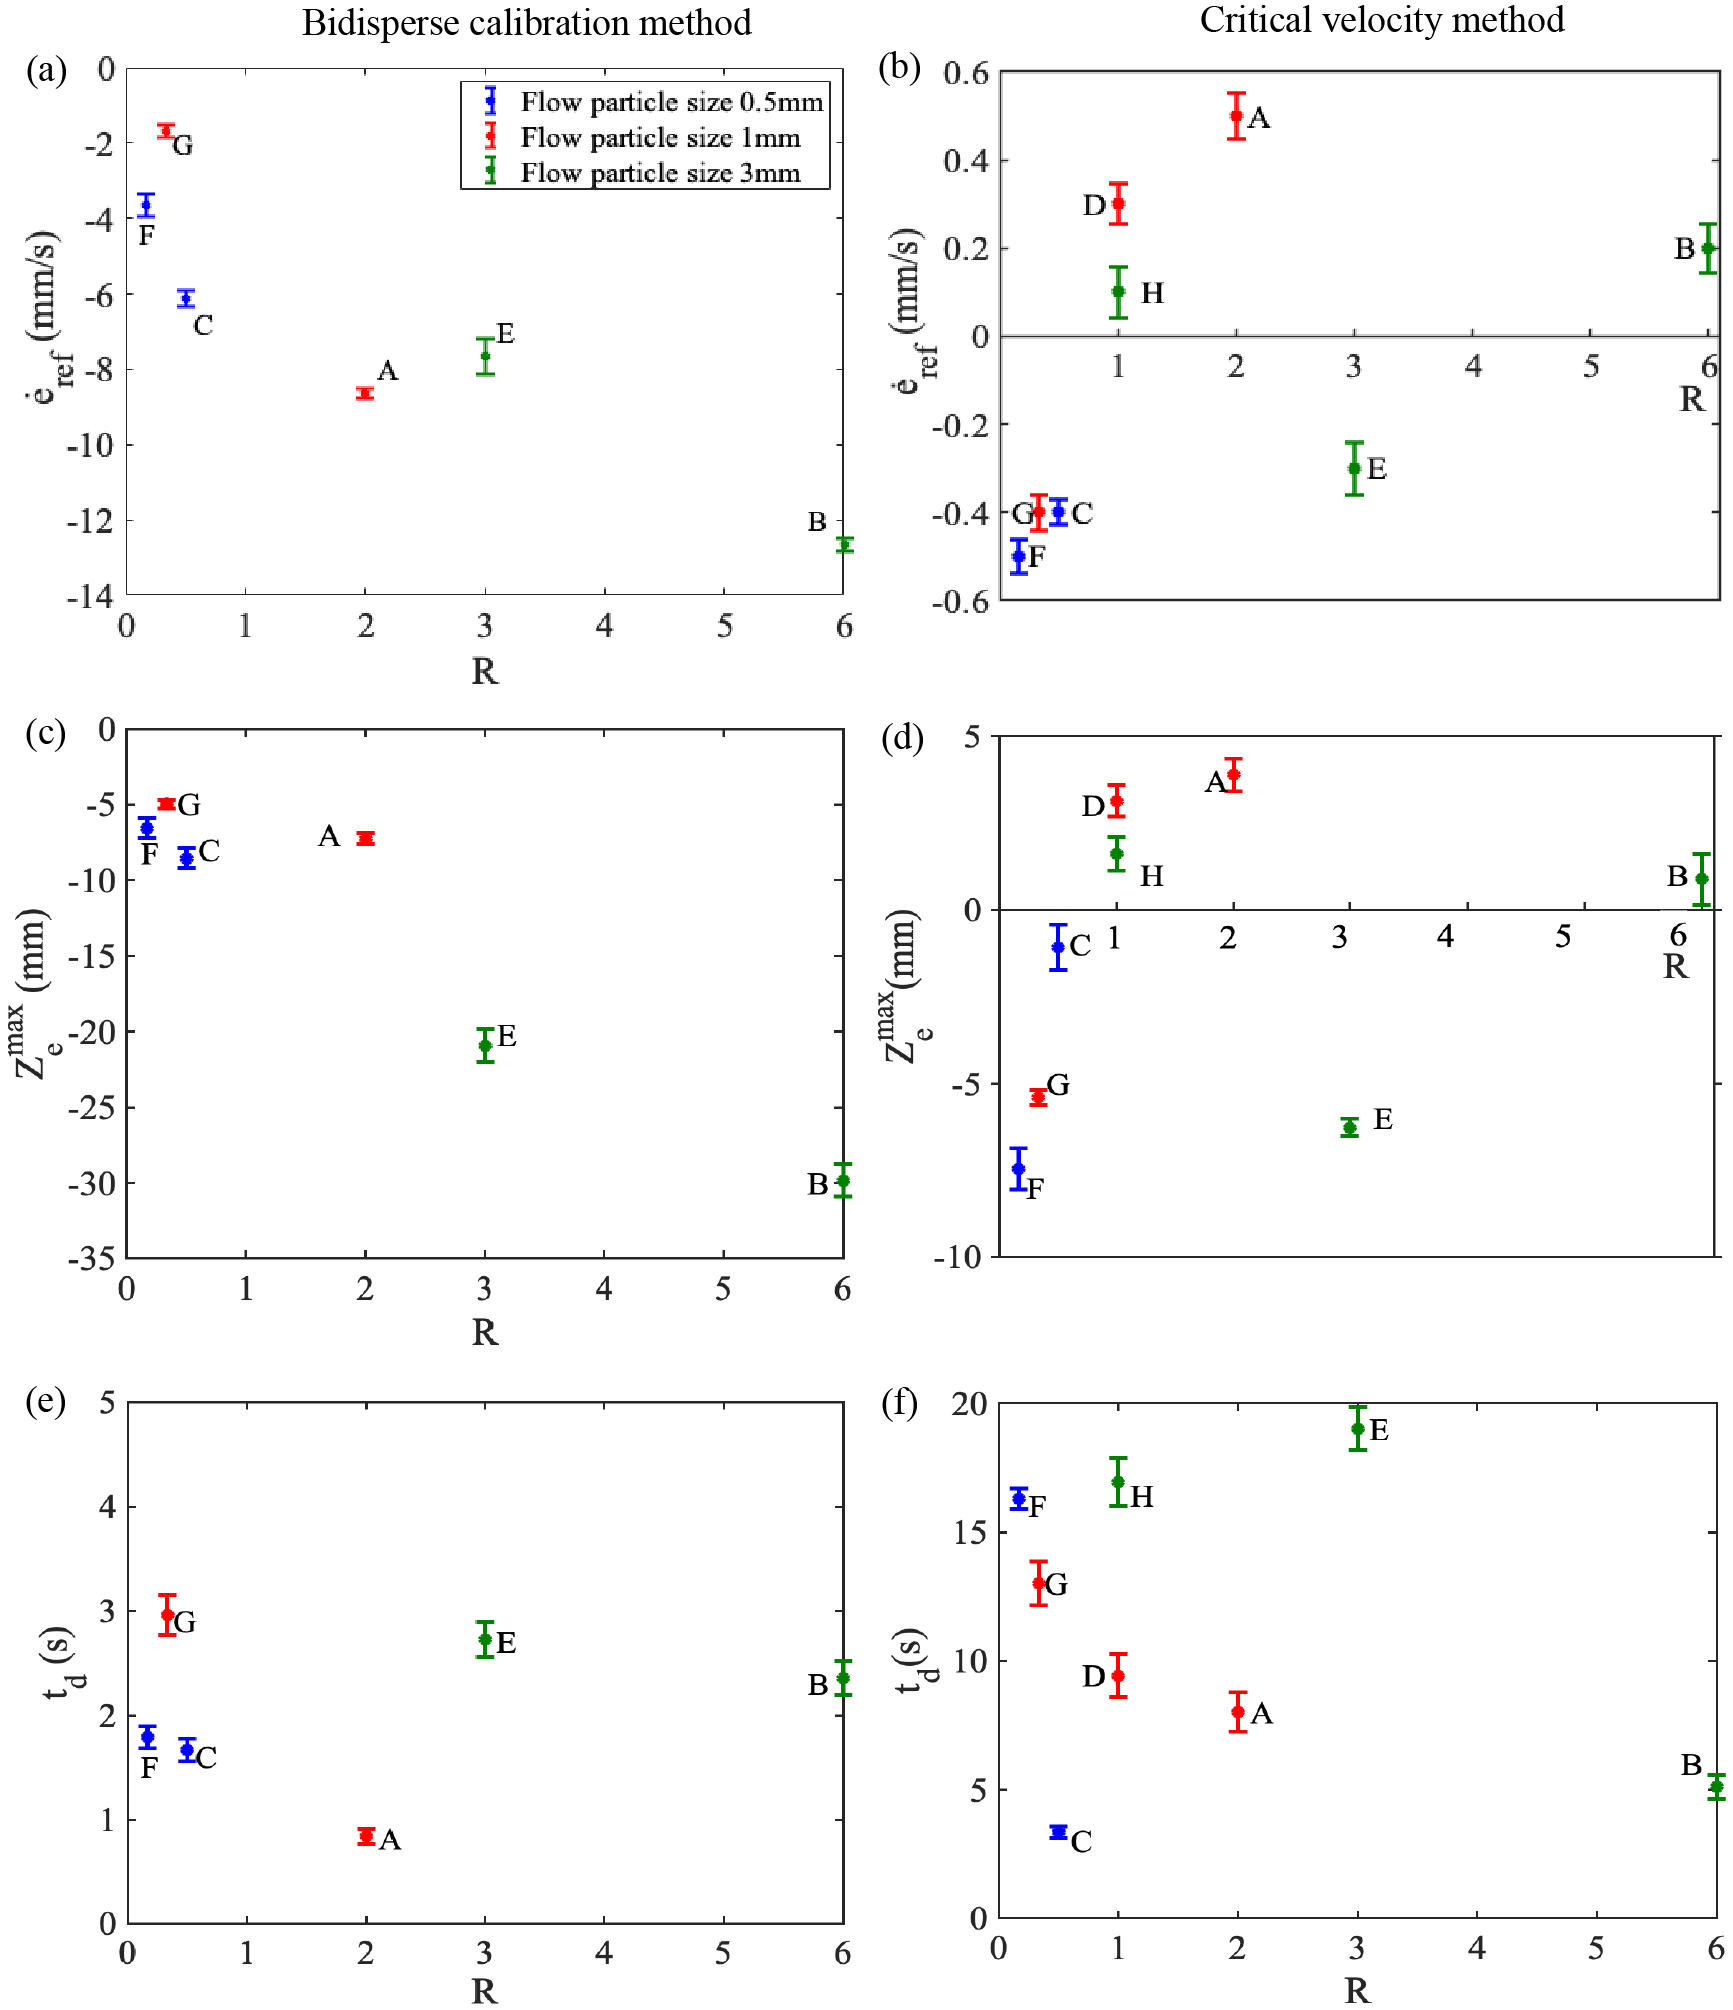
A comparison of the two erosion methods concerning the reference erosion rate, maximum erosion depth, and the decay time is shown in Figure 12. The reference erosion rates estimated from the two methods exhibit opposite trends (see Figure 12(a) and (b)). For a given flow particle size, the erosion rates determined from the bidisperse calibration method increase with the flow to bed particle size ratio. Note that negative values indicate erosion. The reference erosion rate is a function of the maximum erosion depth and the decay time. In both methods the maximum erosion depth variation (Figure 12(c) and (d)) show a correlation with erosion rate. However, the decay time is relatively insensitive to the particle size ratio (Figure 12(e) and (f)). The decay time is the regulating factor of the erosion rate. This can be explained by an example comparison of the cases and . Even though the experimental case has a higher maximum erosion depth than , case exhibits a greater erosion rate. Here, the decay time regulates the erosion rate with greater decay time in .
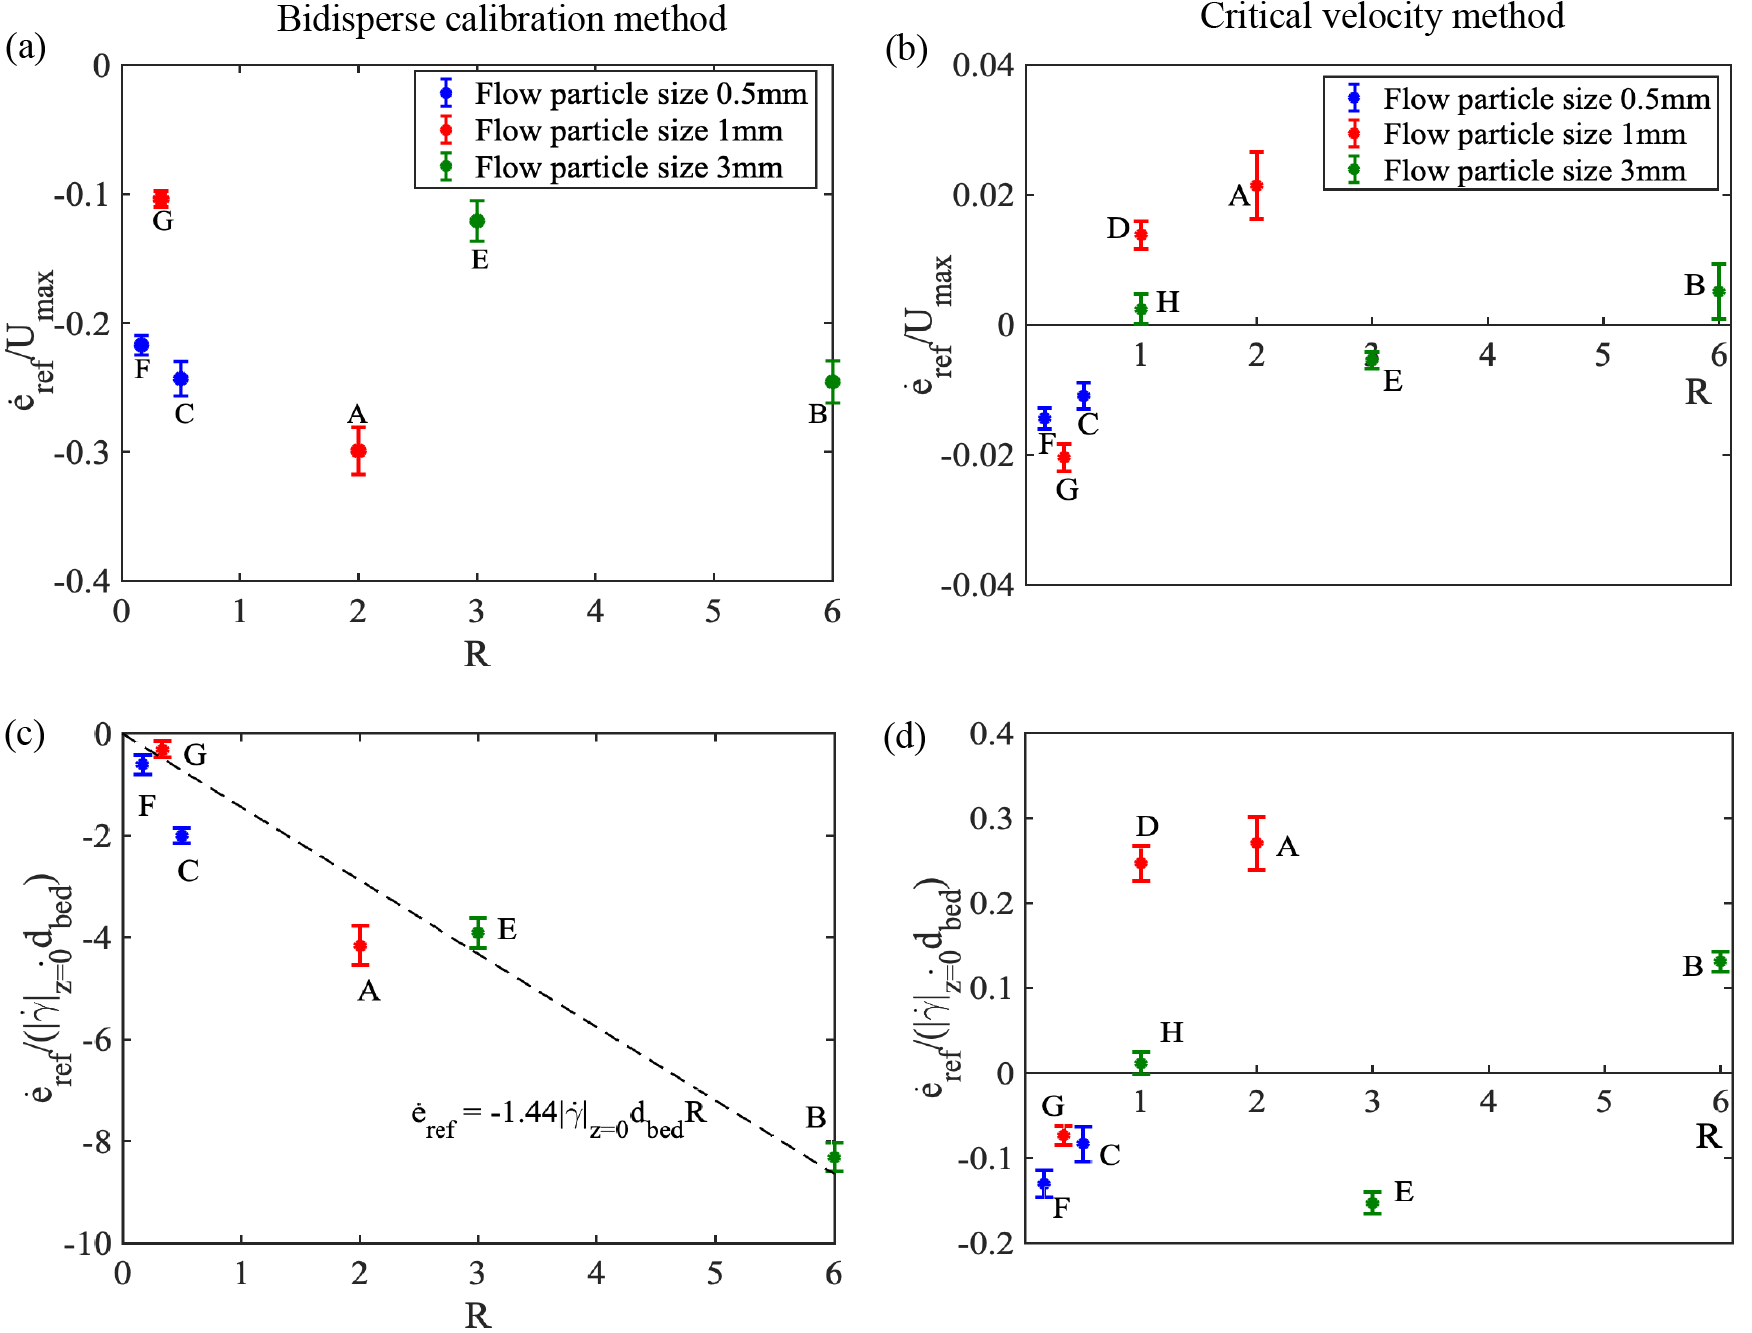
Figure 13 depicts normalization of the erosion rates by the maximum velocity ((a) and (b)) or the shear strain rate at the interface and bed grain size ((c) and (d)). It is difficult to discern a trend for the critical velocity-based results, however for the bidisperse calibration method the following two scalings fit the normalised data reasonably well:
| (4) | ||||
| (5) |
4 Conclusions
The purpose of this paper was to investigate the effect of the particle size of the flowing and erodible bed material on erosion and entrainment. To evaluate the erosion experimentally, a laboratory-scale inclined flume setup was used. Several experiments were conducted with combinations of the flowing and the erodible bed particle sizes. The flow over the erodible bed was captured with dynamic X-ray radiography. Several conclusions were drawn from the results:
-
1.
The maximum downslope velocity increases with the flow to bed particle size ratio for a given flow particle size.
-
2.
The erosion rates estimated from the two techniques express different contradictory conclusions. In the critical-velocity-based erosion rate estimation, the normalized erosion rate increases with the flow to bed grain size ratio. The erosion rates estimated from the bidisperse calibration approach, the normalized erosion rate decreases with increasing flow to bed grain size ratio.
-
3.
The measured erosion rate is entirely dependent on the erosion depth estimation parameter and the measuring technique. Further work is required to correlate these measurements with relevant theoretical expressions.
Data Availability Statement
The raw radiographs that were used to generate the results in this work are available at [Dulanjalee \BOthers. (\APACyear2021)]. The velocity fields were produced using the freely available code PIVlab [Thielicke \BBA Stamhuis (\APACyear2014)]. The bidisperse size measurements can be performed using the open source library PynamiX available at https://pypi.org/project/pynamix/.
Acknowledgements.
The authors wish to acknowledge Prof Itai Einav for his valuable and constructive suggestions during this research work.References
- Adrian \BBA Westerweel (\APACyear2011) \APACinsertmetastarAdrian2011{APACrefauthors}Adrian, R\BPBIJ\BPBIR\BPBIJ.\BCBT \BBA Westerweel, J\BPBIJ. \APACrefYear2011. \APACrefbtitleParticle Image Velocimetry Particle image velocimetry [Book; Book/Illustrated]. \APACaddressPublisherCambridge ; New York : Cambridge University Press. \APACrefnoteFormerly CIP \PrintBackRefs\CurrentBib
- Andò \BOthers. (\APACyear2012) \APACinsertmetastarando2012grain{APACrefauthors}Andò, E., Hall, S\BPBIA., Viggiani, G., Desrues, J.\BCBL \BBA Bésuelle, P. \APACrefYearMonthDay2012. \BBOQ\APACrefatitleGrain-scale experimental investigation of localised deformation in sand: a discrete particle tracking approach Grain-scale experimental investigation of localised deformation in sand: a discrete particle tracking approach.\BBCQ \APACjournalVolNumPagesActa Geotechnica711–13. {APACrefDOI} 10.1007/s11440-011-0151-6 \PrintBackRefs\CurrentBib
- Baker \BOthers. (\APACyear2018) \APACinsertmetastarBaker:2018{APACrefauthors}Baker, J., Guillard, F., Marks, B.\BCBL \BBA Einav, I. \APACrefYearMonthDay2018. \BBOQ\APACrefatitleX-ray rheography uncovers planar granular flows despite non-planar walls X-ray rheography uncovers planar granular flows despite non-planar walls.\BBCQ \APACjournalVolNumPagesNature Communications91. {APACrefDOI} X-ray rheography uncovers planar granular flows despite non-planar walls \PrintBackRefs\CurrentBib
- Bracken \BOthers. (\APACyear2015) \APACinsertmetastarBracken:2015{APACrefauthors}Bracken, L\BPBIJ., Turnbull, L., Wainwright, J.\BCBL \BBA Bogaart, P. \APACrefYearMonthDay2015. \BBOQ\APACrefatitleSediment connectivity: a framework for understanding sediment transfer at multiple scales Sediment connectivity: a framework for understanding sediment transfer at multiple scales.\BBCQ \APACjournalVolNumPagesEarth Surface Processes and Landforms402177-188. {APACrefDOI} https://doi.org/10.1002/esp.3635 \PrintBackRefs\CurrentBib
- Buffler \BOthers. (\APACyear2018) \APACinsertmetastarBuffler:2018{APACrefauthors}Buffler, A., Cole, K., Leadbeater, T.\BCBL \BBA van Heerden, M. \APACrefYearMonthDay2018. \BBOQ\APACrefatitlePositron emission particle tracking: A powerful technique for flow studies Positron emission particle tracking: A powerful technique for flow studies.\BBCQ \APACjournalVolNumPagesInternational Journal of Modern Physics: Conference Series481860113. {APACrefDOI} https://doi.org/10.1142/S2010194518601138 \PrintBackRefs\CurrentBib
- Dulanjalee \BOthers. (\APACyear2020) \APACinsertmetastarDulanjalee:20{APACrefauthors}Dulanjalee, E., Guillard, F., Baker, J., Einav, I.\BCBL \BBA Marks, B. \APACrefYearMonthDay20209. \BBOQ\APACrefatitleMeasuring grain size fractions of bidisperse granular materials using X-ray radiography Measuring grain size fractions of bidisperse granular materials using X-ray radiography.\BBCQ \APACjournalVolNumPagesOpt. Express282029202–29211. {APACrefDOI} https://doi.org/10.1364/OE.401021 \PrintBackRefs\CurrentBib
- Dulanjalee \BOthers. (\APACyear2021) \APACinsertmetastarradiographs{APACrefauthors}Dulanjalee, E., Guillard, F., Baker, J., Einav, I.\BCBL \BBA Marks, B. \APACrefYearMonthDay2021. \APACrefbtitleErosion of bed materials in lab-scale flume experiments of dry glass beads. Erosion of bed materials in lab-scale flume experiments of dry glass beads. \APACaddressPublisherThe University of Sydney. {APACrefURL} https://ses.library.usyd.edu.au/handle/2123/25844 {APACrefDOI} 10.25910/G97Z-0141 \PrintBackRefs\CurrentBib
- Egashira \BOthers. (\APACyear2001) \APACinsertmetastarEgashira:2001{APACrefauthors}Egashira, S., Honda, N.\BCBL \BBA Itoh, T. \APACrefYearMonthDay2001. \BBOQ\APACrefatitleExperimental study on the entrainment of bed material into debris flow Experimental study on the entrainment of bed material into debris flow.\BBCQ \APACjournalVolNumPagesPhysics and Chemistry of the Earth, Part C: Solar, Terrestrial & Planetary Science269645-650. {APACrefDOI} https://doi.org/10.1016/S1464-1917(01)00062-9 \PrintBackRefs\CurrentBib
- Farin \BOthers. (\APACyear2014) \APACinsertmetastarFarin:2014{APACrefauthors}Farin, M., Mangeney, A.\BCBL \BBA Roche, O. \APACrefYearMonthDay2014. \BBOQ\APACrefatitleFundamental changes of granular flow dynamics, deposition, and erosion processes at high slope angles: Insights from laboratory experiments Fundamental changes of granular flow dynamics, deposition, and erosion processes at high slope angles: Insights from laboratory experiments.\BBCQ \APACjournalVolNumPagesJournal of Geophysical Research: Earth Surface1193504-532. {APACrefDOI} https://doi.org/10.1002/2013JF002750 \PrintBackRefs\CurrentBib
- Ghasemi \BOthers. (\APACyear2019) \APACinsertmetastarGhasemi:2019{APACrefauthors}Ghasemi, A., Kaitna, R., Fritton, P.\BCBL \BBA Blankenship, B. \APACrefYearMonthDay2019. \BBOQ\APACrefatitleErosion by experimental debris flows: particle size effects Erosion by experimental debris flows: particle size effects.\BBCQ \BIn \APACrefbtitle7th International Conference on Debris-Flow Hazards Mitigation. 7th international conference on debris-flow hazards mitigation. \PrintBackRefs\CurrentBib
- Gollin \BOthers. (\APACyear2017) \APACinsertmetastargollin2017performance{APACrefauthors}Gollin, D., Brevis, W., Bowman, E\BPBIT.\BCBL \BBA Shepley, P. \APACrefYearMonthDay2017. \BBOQ\APACrefatitlePerformance of PIV and PTV for granular flow measurements Performance of piv and ptv for granular flow measurements.\BBCQ \APACjournalVolNumPagesGranular Matter19342. {APACrefDOI} https://doi.org/10.1007/s10035-017-0730-9 \PrintBackRefs\CurrentBib
- Guillard \BOthers. (\APACyear2017) \APACinsertmetastarGuillard2017{APACrefauthors}Guillard, F., Marks, B.\BCBL \BBA Einav, I. \APACrefYearMonthDay2017. \BBOQ\APACrefatitleDynamic X-ray radiography reveals particle size and shape orientation fields during granular flow Dynamic X-ray radiography reveals particle size and shape orientation fields during granular flow.\BBCQ \APACjournalVolNumPagesScientific Reports7815561-65. {APACrefDOI} https://doi.org/10.1038/s41598-017-08573-y \PrintBackRefs\CurrentBib
- Heindel (\APACyear2011) \APACinsertmetastarHeindel:2011{APACrefauthors}Heindel, T\BPBIJ. \APACrefYearMonthDay2011. \BBOQ\APACrefatitleA Review of X-Ray Flow Visualization With Applications to Multiphase Flows A review of x-ray flow visualization with applications to multiphase flows.\BBCQ \APACjournalVolNumPagesJournal of Fluids Engineering1337. {APACrefDOI} https://doi.org/10.1115/1.4004367 \PrintBackRefs\CurrentBib
- Hubbell (\APACyear1982) \APACinsertmetastarHubbell1982{APACrefauthors}Hubbell, J. \APACrefYearMonthDay1982. \BBOQ\APACrefatitlePhoton mass attenuation and energy-absorption coefficients Photon mass attenuation and energy-absorption coefficients.\BBCQ \APACjournalVolNumPagesThe International Journal of Applied Radiation and Isotopes33111269 - 1290. \PrintBackRefs\CurrentBib
- Hungr \BOthers. (\APACyear2005) \APACinsertmetastarHungr:2005{APACrefauthors}Hungr, O., McDougall, S.\BCBL \BBA Bovis, M. \APACrefYearMonthDay2005. \BBOQ\APACrefatitleEntrainment of material by debris flows Entrainment of material by debris flows.\BBCQ \BIn \APACrefbtitleDebris-flow Hazards and Related Phenomena Debris-flow hazards and related phenomena (\BPGS 135–158). \APACaddressPublisherBerlin, HeidelbergSpringer Berlin Heidelberg. {APACrefDOI} 10.1007/3-540-27129-5_7 \PrintBackRefs\CurrentBib
- M\BPBIE. Iverson Richard M.and Reid \BOthers. (\APACyear2011) \APACinsertmetastarIverson:2011a{APACrefauthors}Iverson, M\BPBIE., Richard M.and Reid, Logan, M., LaHusen, R\BPBIG.\BCBL \BBA Godt, J\BPBIP., Jonathan W.and Griswold. \APACrefYearMonthDay2011. \BBOQ\APACrefatitlePositive feedback and momentum growth during debris-flow entrainment of wet bed sediment Positive feedback and momentum growth during debris-flow entrainment of wet bed sediment.\BBCQ \APACjournalVolNumPagesNature Geoscience4. {APACrefDOI} https://doi.org/10.1038/ngeo1040 \PrintBackRefs\CurrentBib
- R\BPBIM. Iverson (\APACyear2012) \APACinsertmetastarIverson:2012{APACrefauthors}Iverson, R\BPBIM. \APACrefYearMonthDay2012. \BBOQ\APACrefatitleElementary theory of bed-sediment entrainment by debris flows and avalanches Elementary theory of bed-sediment entrainment by debris flows and avalanches.\BBCQ \APACjournalVolNumPagesJournal of Geophysical Research: Earth Surface117F3. {APACrefDOI} https://doi.org/10.1029/2011JF002189 \PrintBackRefs\CurrentBib
- R\BPBIM. Iverson \BBA Chaojun (\APACyear2015) \APACinsertmetastarIverson2015{APACrefauthors}Iverson, R\BPBIM.\BCBT \BBA Chaojun, O. \APACrefYearMonthDay2015. \BBOQ\APACrefatitleEntrainment of bed material by Earth-surface mass flows: review and reformulation of depth-integrated theory Entrainment of bed material by earth-surface mass flows: review and reformulation of depth-integrated theory.\BBCQ \APACjournalVolNumPagesReviews of Geophysics531-32. {APACrefDOI} https://doi.org/10.1002/2013RG000447 \PrintBackRefs\CurrentBib
- R\BPBIM. Iverson \BOthers. (\APACyear2010) \APACinsertmetastarIverson:2010{APACrefauthors}Iverson, R\BPBIM., Logan, M., LaHusen, R\BPBIG.\BCBL \BBA Berti, M. \APACrefYearMonthDay2010. \BBOQ\APACrefatitleThe perfect debris flow? Aggregated results from 28 large-scale experiments The perfect debris flow? aggregated results from 28 large-scale experiments.\BBCQ \APACjournalVolNumPagesJournal of Geophysical Research: Earth Surface115F3. {APACrefDOI} https://doi.org/10.1029/2009JF001514 \PrintBackRefs\CurrentBib
- Johnson \BOthers. (\APACyear2012) \APACinsertmetastarjohnson2012grain{APACrefauthors}Johnson, C., Kokelaar, B., Iverson, R\BPBIM., Logan, M., LaHusen, R.\BCBL \BBA Gray, J. \APACrefYearMonthDay2012. \BBOQ\APACrefatitleGrain-size segregation and levee formation in geophysical mass flows Grain-size segregation and levee formation in geophysical mass flows.\BBCQ \APACjournalVolNumPagesJournal of Geophysical Research: Earth Surface117F1. {APACrefDOI} https://doi.org/10.1029/2011JF002185 \PrintBackRefs\CurrentBib
- Jop \BOthers. (\APACyear2005) \APACinsertmetastarjop2005crucial{APACrefauthors}Jop, P., Forterre, Y.\BCBL \BBA Pouliquen, O. \APACrefYearMonthDay2005. \BBOQ\APACrefatitleCrucial role of sidewalls in granular surface flows: consequences for the rheology Crucial role of sidewalls in granular surface flows: consequences for the rheology.\BBCQ \APACjournalVolNumPagesJournal of Fluid Mechanics541167–192. {APACrefDOI} 10.1017/S0022112005005987 \PrintBackRefs\CurrentBib
- Kang \BBA Chan (\APACyear2017) \APACinsertmetastarChao:2017{APACrefauthors}Kang, C.\BCBT \BBA Chan, D. \APACrefYearMonthDay2017. \BBOQ\APACrefatitleModeling of Entrainment in Debris Flow Analysis for Dry Granular Material Modeling of entrainment in debris flow analysis for dry granular material.\BBCQ \APACjournalVolNumPagesInternational Journal of Geomechanics171004017087. {APACrefDOI} https://doi.org/10.1061/(ASCE)GM.1943-5622.0000981 \PrintBackRefs\CurrentBib
- Karatza \BOthers. (\APACyear2019) \APACinsertmetastarKaratza:2019{APACrefauthors}Karatza, Z., Andò, E., Papanicolopulos, S\BHBIA., Viggiani, G.\BCBL \BBA Ooi, J\BPBIY. \APACrefYearMonthDay2019. \BBOQ\APACrefatitleEffect of particle morphology and contacts on particle breakage in a granular assembly studied using X-ray tomography Effect of particle morphology and contacts on particle breakage in a granular assembly studied using x-ray tomography.\BBCQ \APACjournalVolNumPagesGranular Matter21344. {APACrefDOI} https://doi.org/10.1007/s10035-019-0898-2 \PrintBackRefs\CurrentBib
- Liu (\APACyear2011) \APACinsertmetastarLiu2011{APACrefauthors}Liu, Z. \APACrefYear2011. \APACrefbtitleMeasuring the angle of repose of granular systems using hollow cylinders Measuring the angle of repose of granular systems using hollow cylinders \APACtypeAddressSchool\BUMTh. \APACaddressSchoolUniversity of Pittsburgh ETD. \PrintBackRefs\CurrentBib
- Lu \BOthers. (\APACyear2016) \APACinsertmetastarLu:2016{APACrefauthors}Lu, P\BPBIy., Yang, X\BPBIg., Xu, F\BPBIg., Hou, T\BPBIx.\BCBL \BBA Zhou, J\BPBIw. \APACrefYearMonthDay2016. \BBOQ\APACrefatitleAn analysis of the entrainment effect of dry debris avalanches on loose bed materials An analysis of the entrainment effect of dry debris avalanches on loose bed materials.\BBCQ \APACjournalVolNumPagesSpringerPlus511621. {APACrefDOI} https://doi.org/10.1186/s40064-016-3272-4 \PrintBackRefs\CurrentBib
- Mangeney (\APACyear2011) \APACinsertmetastarMangeney:2011{APACrefauthors}Mangeney, A. \APACrefYearMonthDay2011. \BBOQ\APACrefatitleGeomorphology: Landslides boost from entrainment Geomorphology: Landslides boost from entrainment\BBCQ [Journal Article]. \APACjournalVolNumPagesNature Geo-science4277-78. {APACrefDOI} https://doi.org/10.1038/ngeo1077 \PrintBackRefs\CurrentBib
- Mangeney \BOthers. (\APACyear2010) \APACinsertmetastarMangeney:2010{APACrefauthors}Mangeney, A., Roche, O., Hungr, O., Mangold, N., Faccanoni, G.\BCBL \BBA Lucas, A. \APACrefYearMonthDay2010. \BBOQ\APACrefatitleErosion and mobility in granular collapse over sloping beds Erosion and mobility in granular collapse over sloping beds.\BBCQ \APACjournalVolNumPagesJournal of Geophysical Research: Earth Surface115F3. \PrintBackRefs\CurrentBib
- Méjean \BOthers. (\APACyear2021) \APACinsertmetastarSegolene:2021{APACrefauthors}Méjean, S., Guillard, F., Faug, T.\BCBL \BBA Einav, I. \APACrefYearMonthDay2021. \BBOQ\APACrefatitleMeasuring jumps during granular chute-flows using X-ray radiography Measuring jumps during granular chute-flows using x-ray radiography.\BBCQ \APACjournalVolNumPagesEPJ Web Conf.24903031. {APACrefDOI} 10.1051/epjconf/202124903031 \PrintBackRefs\CurrentBib
- Moberly (\APACyear2015) \APACinsertmetastarMoberly2015{APACrefauthors}Moberly, D. \APACrefYear2015. \APACrefbtitleLaboratory Experiments Investigating Entrainment By Debris Flows Laboratory experiments investigating entrainment by debris flows \APACtypeAddressSchool\BUMTh. \APACaddressSchoolUniversity of Minnesota. \PrintBackRefs\CurrentBib
- Nakagawa \BOthers. (\APACyear1993) \APACinsertmetastarNakagawa:1993{APACrefauthors}Nakagawa, M., Altobelli, S\BPBIA., Caprihan, A., Fukushima, E.\BCBL \BBA Jeong, E\BHBIK. \APACrefYearMonthDay1993. \BBOQ\APACrefatitleNon-invasive measurements of granular flows by magnetic resonance imaging Non-invasive measurements of granular flows by magnetic resonance imaging.\BBCQ \APACjournalVolNumPagesExperiments in Fluids16154–60. {APACrefDOI} https://doi.org/10.1007/BF00188507 \PrintBackRefs\CurrentBib
- Papa \BOthers. (\APACyear2004) \APACinsertmetastarPapa:2004{APACrefauthors}Papa, M., Egashira, S.\BCBL \BBA Itoh, T. \APACrefYearMonthDay2004. \BBOQ\APACrefatitleCritical conditions of bed sediment entrainment due to debris flow Critical conditions of bed sediment entrainment due to debris flow.\BBCQ \APACjournalVolNumPagesNatural Hazards and Earth System Sciences43469–474. {APACrefDOI} 10.5194/nhess-4-469-2004 \PrintBackRefs\CurrentBib
- Parker \BOthers. (\APACyear1997) \APACinsertmetastarParker:1997{APACrefauthors}Parker, D., Dijkstra, A., Martin, T.\BCBL \BBA Seville, J. \APACrefYearMonthDay1997. \BBOQ\APACrefatitlePositron emission particle tracking studies of spherical particle motion in rotating drums Positron emission particle tracking studies of spherical particle motion in rotating drums.\BBCQ \APACjournalVolNumPagesChemical Engineering Science52132011 - 2022. {APACrefDOI} https://doi.org/10.1016/S0009-2509(97)00030-4 \PrintBackRefs\CurrentBib
- Pirulli \BBA Pastor (\APACyear2012) \APACinsertmetastarPirulli:2012{APACrefauthors}Pirulli, M.\BCBT \BBA Pastor, M. \APACrefYearMonthDay2012. \BBOQ\APACrefatitleNumerical study on the entrainment of bed material into rapid landslides Numerical study on the entrainment of bed material into rapid landslides.\BBCQ \APACjournalVolNumPagesGéotechnique6211959-972. {APACrefDOI} https://doi.org/10.1680/geot.10.P.074 \PrintBackRefs\CurrentBib
- Qiu \BOthers. (\APACyear2015) \APACinsertmetastarJun2015{APACrefauthors}Qiu, J., Khalloufi, S., Martynenko, A., Dalen, G\BPBIV., Schutyser, M.\BCBL \BBA Almeida-Rivera, C. \APACrefYearMonthDay2015. \BBOQ\APACrefatitlePorosity, Bulk Density, and Volume Reduction During Drying: Review of Measurement Methods and Coefficient Determinations Porosity, bulk density, and volume reduction during drying: Review of measurement methods and coefficient determinations.\BBCQ \APACjournalVolNumPagesDrying Technology33141681-1699. \PrintBackRefs\CurrentBib
- Stannarius (\APACyear2017) \APACinsertmetastarStannarius:2017{APACrefauthors}Stannarius, R. \APACrefYearMonthDay2017. \BBOQ\APACrefatitleMagnetic resonance imaging of granular materials Magnetic resonance imaging of granular materials.\BBCQ \APACjournalVolNumPagesReview of Scientific Instruments885051806. {APACrefDOI} doi: 10.1063/1.4983135. \PrintBackRefs\CurrentBib
- Tai \BBA Kuo (\APACyear2008) \APACinsertmetastarTai:2008{APACrefauthors}Tai, Y.\BCBT \BBA Kuo, C. \APACrefYearMonthDay2008. \BBOQ\APACrefatitleA new model of granular flows over general topography with erosion and deposition A new model of granular flows over general topography with erosion and deposition.\BBCQ \APACjournalVolNumPagesActa Mechanica1991-471–96. {APACrefDOI} https://doi.org/10.1007/s00707-007-0560-7 \PrintBackRefs\CurrentBib
- Thielicke \BBA Stamhuis (\APACyear2014) \APACinsertmetastarThielicke_2014{APACrefauthors}Thielicke, W.\BCBT \BBA Stamhuis, E\BPBIJ. \APACrefYearMonthDay2014oct. \BBOQ\APACrefatitlePIVlab – Towards User-friendly, Affordable and Accurate Digital Particle Image Velocimetry in MATLAB PIVlab – towards user-friendly, affordable and accurate digital particle image velocimetry in MATLAB.\BBCQ \APACjournalVolNumPagesJournal of Open Research Software2. {APACrefDOI} http://doi.org/10.5334/jors.bl \PrintBackRefs\CurrentBib
- van Damme (\APACyear2020) \APACinsertmetastarDamme:2020{APACrefauthors}van Damme, M. \APACrefYearMonthDay2020. \BBOQ\APACrefatitleDetachment of dilatant soil due to high hydraulic shear stresses explained Detachment of dilatant soil due to high hydraulic shear stresses explained.\BBCQ \APACjournalVolNumPagesJournal of Hydraulic Research001-10. {APACrefDOI} https://doi.org/10.1080/00221686.2020.1714758 \PrintBackRefs\CurrentBib
- Yunyun \BOthers. (\APACyear2019) \APACinsertmetastarYunyun:2019{APACrefauthors}Yunyun, F., Fengyuan, W.\BCBL \BBA Liang, L. \APACrefYearMonthDay2019. \BBOQ\APACrefatitleResearch on the Entrainment of Path Material by the Granular Flow Research on the entrainment of path material by the granular flow.\BBCQ \APACjournalVolNumPagesKSCE Journal of Civil Engineering2312. {APACrefDOI} https://doi.org/10.1007/s12205-019-1105-z \PrintBackRefs\CurrentBib