Transfer Learned Potential Energy Surfaces: Accurate Anharmonic Vibrational Dynamics and Dissociation Energies for the Formic Acid Monomer and Dimer
Abstract
The vibrational dynamics of formic acid monomer (FAM) and dimer (FAD) is investigated from machine-learned potential energy surfaces at the MP2 (PESMP2) and transfer-learned (PESTL) to the CCSD(T) levels of theory. The normal modes and anharmonic frequencies of all modes below 2000 cm-1 agree favourably with experiment whereas the OH-stretch mode is challenging for FAM and FAD from normal mode analyses and finite-temperature MD simulations. VPT2 calculations on PESTL for FAM reproduce the experimental OH frequency to within 22 cm-1. For FAD the VPT2 calculations find the high-frequency OH stretch at 3011 cm-1, compared with an experimentally reported, broad ( cm-1) absorption band with center frequency estimated at cm-1. In agreement with earlier reports, MD simulations at higher temperature shift the position of the OH-stretch in FAM to the red, consistent with improved sampling of the anharmonic regions of the PES. However, for FAD the OH-stretch shifts to the blue and for temperatures higher than 1000 K the dimer partly or fully dissociates using PESTL. Including zero-point energy corrections from diffusion Monte Carlo simulations for FAM and FAD and corrections due to basis set superposition and completeness errors yield a dissociation energy of kcal/mol compared with an experimentally determined value of kcal/mol.
University of Basel]Department of Chemistry, University of Basel, Klingelbergstrasse 80 , CH-4056 Basel, Switzerland. University of Basel]Department of Chemistry, University of Basel, Klingelbergstrasse 80 , CH-4056 Basel, Switzerland.
1 Introduction
Vibrational spectroscopy is a powerful means to relate structure and
dynamics of molecules in the gas phase and in solution. Combined with
state-of-the art simulation techniques, molecular-level information
such as assignments of local reporters, or the thermodynamics in
protein-ligand complexes can be obtained. One of the pertinent
questions is a) whether or not classical molecular dynamics (MD)
simulations can be used for this and b) what level of theory and
accuracy in representing the energies from electronic structure
calculations is required for a meaningful contribution of simulations
to assigning and interpreting experimentally determined
spectra. Electronic structure calculations and their representations
as full-dimensional potential energy surfaces (PESs) have progressed
to a degree that now allows direct comparison with
experiments.1, 2, 3
Generating full-dimensional, reactive PESs even for small molecules is
a challenging task.4, 5 This often
requires datasets consisting of tens of thousands of ab
initio calculations to adequately describe configurational space of
the system of interest. While calculations at the density functional
theory (DFT) or Møller-Plesset perturbation (MP2) levels of theory
are cost-efficient, reaction barriers are less
accurate6. On the other hand, the “gold
standard” coupled cluster with perturbative triples (CCSD(T))
approach scales as (with being the number of basis
functions)7 which becomes quickly computationally
prohibitive for full-dimensional PESs even for moderately sized
molecules (). Recent applications of novel
machine learning (ML) approaches combined with transfer learning
(TL)8, 9, 10 and
related -ML11 in physical/computational
chemistry10, 3, 12, 13, 14, 6
were shown to be data and cost-effective alternatives which will also
be explored in the present work.
Formic acid (HCOOH), the simplest carboxylic acid, is an important
intermediate in chemical synthesis and relevant to atmospheric
chemistry15. It is also a promising fuel and
H2 carrier16, 17 which can be
produced by electrocatalytic CO2 reduction reactions and, thus, may
contribute to decreasing atmospheric CO2
levels.17, 18 Formic acid
monomer (FAM) and its dimer (formic acid dimer, FAD) have been the
subject of several
experimental19, 20, 21, 22, 23, 24, 25, 26
and
theoretical27, 28, 29, 30, 31, 25, 32, 33, 34, 35
studies. In the vapor phase, formic acid exists as hydrogen bonded
dimers36 making it a prototype for complexes
with hydrogen bonds such as enzymes or DNA base
pairs37. The experimental IR spectrum has been
reported for both, FAM and
FAD38, 39, 40, 41, 25, 21, 19, 42, 43.
For FAM a recent study of both, cis- and trans-FAM, analyses a global
PES constructed using regression techniques with energies from
CCSD(T)(F12*)/cc-pVTZ-F12 calculations as the
reference30. Vibrational eigenstates for both conformers
were calculated using vibrational configuration interaction (VCI) and
the fundamentals for trans-FAM were found to be in close agreement
with experiment ( cm-1). Subsequently, a second
full-dimensional CCSD(T)-F12a/aug-cc-pVTZ based PES for the two FAM
conformers was used for multi-configuration time-dependent Hartree
(MCTDH) vibrational calculations44. The
trans fundamental transitions were found to agree to within
5 cm-1 with experiment. The two
PESs30, 44 are further analyzed in
detail in Ref. 45 and are used for comparison with
experiments for FAM and deuterated isotopologues of both
isomers. Vibrational eigenstates were obtained from high order
canonical Van Vleck perturbation theory (CVPT). Such high level
anharmonic treatments of vibrations on high quality PESs are crucial
for understanding and potentially (re)assigning experimental spectra
as was found for
trans-FAM30, 44, 45:
assignment of the O-H in plane bend which is in resonance with
the O-H torsional overtone has been ambiguous for a long
time. Based on the high-level calculations the fundamental was
assigned to 1306 cm-1 and the overtone to a spectroscopic feature
at 1220 cm-1. This assignment was subsequently supported by Raman
jet experiment40. Interestingly, this
reassignment was recently supported from second order vibrational
perturbation theory (VPT2) calculations using a neural network-(NN)
based PES.14
For FAD a considerable amount of computational work has been done on
its dynamics46, 47, infrared (IR)
spectroscopy25 and calculations of tunneling
splittings.32, 31 A recent PES based on
13475 CCSD(T)-F12a/haTZ energies was fit to permutationally invariant
polynomials31 which reported a barrier for double proton
transfer of 2853 cm-1 (8.16 kcal/mol). This was used for
computing the zero-point energy (ZPE) based on diffusion Monte Carlo
(DMC) calculations, for vibrational self consistent field (VSCF)/VCI
calculations of fundamentals and to determine ground-state tunneling
splittings in a reduced-dimensional approach. The tunneling splitting
obtained was 0.037 cm-1 which is larger than the experimentally
reported value48, 49 of
0.016 cm-1. Subsequently,32 the same PES
was used for computing tunneling splittings without reducing the
dimensionality of the problem using the ring-polymer instanton
approach.50 The value of 0.014 cm-1 was
considerably closer to experiment and a more recent measurement based
on IR techniques reported a tunneling splitting of
0.011 cm-1.51
More recently the CCSD(T)-F12a PES was extended with a new dipole
moment surface (DMS) based on the MP2/haTZ level of theory and used
for the analysis of the FAD IR spectrum.33 Both, VSCF
and VCI calculations were performed and compared with results from
classical and ”semi-classically“ prepared quasiclassical MD
simulations and experiment.34 Classical MD
corresponds to NVE simulations run at 300 K whereas the
harmonic ZPE is added in the “semi-classically” prepared approach.
For both approaches, the X-H stretch frequencies remain at higher
frequencies compared to experiment. This effect is ascribed to the
inability of MD simulations to correctly sample anharmonicities. The
high-quality PES and DMS33 were recently employed to
assess the fingerprint region of FAD using variational vibrational
computations and curvilinear kinetic energy operator
representation.52
Experimentally, the dissociation energy of FAD into two FAMs has been
determined from spectroscopy and statistical thermodynamics to be kJ/mol ( kcal/mol).24 For the
double proton transfer barrier, the most recent value from microwave
spectroscopy (measured tunneling splitting of 331.2 MHz) is 2559
cm-1 (30.6 kJ/mol or 7.3 kcal/mol) from analysis of a 3D
model.53 This is consistent with a best value of 7.2
kcal/mol from a morphed MP2 surface that was determined from atomistic
simulations and compared with IR experiments of the proton transfer
band.25 Earlier experiments reported a larger
splitting of 0.0158 cm-1 (corresponding to 473.7 MHz) which
yields a somewhat higher barrier for double proton
transfer.48 Yet more recent work in the infrared
found 0.011367 cm-1 (340.8 MHz) which is closer to the most
recent microwave data.51
In order to assess the expected magnitude of error cancellation due to
shortcomings in the electronic structure method used and that fact
that MD-based spectroscopy only samples the bottom of the potential
well at ambient conditions, extensive higher-level calculations at the
MP2 and CCSD(T) levels of theory were carried out together with the
aug-cc-pVTZ basis set. This reference data was then represented as a
neural network (NN) based on the PhysNet
architecture.54 Additionally, TL
10, 8, 9 to the
the CCSD(T)/aug-cc-pVTZ level of theory was used to further improve
the quality of the PES. Using these PESs for formic acid monomer and
dimer, the harmonic and anharmonic vibrations, and the IR spectrum
from finite-temperature MD simulations are determined. From this the
complexation-induced red shifts can be determined and compared with
experiment. Furthermore, DMC simulations are run to obtain an estimate
for the ZPE of both molecules. The DMC calculations are a meaningful
probe for the robustness of the PES and the resulting ZPEs are used
for the determination of the binding energy of the dimer.
First, the methods are presented and discussed. Next, the accuracy of
the NN-based PESs is assessed and the vibrational spectra for FAM and
FAD are determined and compared with experiment. Then, the results
from DMC simulations are presented and, finally, the results are
discussed and conclusions are drawn.
2 Computational Details
2.1 Electronic Structure Calculations and PhysNet Representation
The PESs for FAM and FAD are represented by a NN of the PhysNet
architecture54, which has been used for different
chemical systems recently
55, 56, 57, 58, 3, 12.
PhysNet is a high-dimensional NN59 of the
“message-passing” type60. It constructs a
feature vector for each atom in a molecule describing the atom’s local
chemical environment. These feature vectors (descriptors) are
iteratively refined (learned) and used to predict atomic contributions
to the total energy and partial charges . The forces
needed to run MD simulations are obtained from reverse-mode
automatic differentiation61 and the molecular
dipole moment is calculated from the partial charges following
. Details of the PhysNet approach are
described elsewhere54. The parameters of PhysNet
are fitted to ab initio energies, forces and dipole moments
calculated at the
MP262/aug-cc-pVTZ63 level
of theory using Molpro64.
A dataset of reference structures is required for training PhysNet. An
ensemble of 20000 FAM (5000) and FAD (15000) geometries are generated
from Langevin dynamics at 2000 K using the atomic simulation
environment (ASE)65 at the PM7 level of
theory66, 67. For FAD, the
transition state (TS) region is sampled by harmonically biasing the
geometry toward the TS structure, similar to the umbrella sampling
approach 68. This dataset is extended with
geometries of fragments of the FAM molecule (H2, CH4, H2O,
CO, H3COH, H2CO) following the amons
approach69. For the amons, 1000 geometries each
are generated using Langevin dynamics at 1000 K. Based on initial
PhysNet representations of the PES, the dataset was extended with one
round of adaptive
sampling70, 71. The
final MP2 dataset contains 26000 reference structures and was split
according to 20800/2600/2600 for
training/validation/testing. Henceforth, this PES is referred to as
PESMP2.
To further improve the quality of the PES,
TL10, 8, 9 from
the MP2 to the CCSD(T) level of theory was performed. The data set for
TL contained 866 geometries: 425 for FAM and 441 for FAD. For FAM,
they were generated from normal mode sampling72 at
different temperatures (between 10 and 2000 K) and geometries for FAD
were those along the minimum energy path (MEP), along particular
normal modes and geometries obtained from normal mode
sampling. Ab initio energies, forces and dipole moments for
the 866 geometries were determined at the
CCSD(T)/aug-cc-pVTZ73, 74, 63
level of theory using MOLPRO64. Then, the PhysNet model was
retrained on the TL-data set by initializing the NN with the
parameters from the trained NN at the MP2 level as a good initial
guess. The data set was split randomly according to 85/10/5 % into
training/validation/test set and the learning rate was reduced to
compared with when learning a model from scratch.
The final TL PES is referred to as PESTL.
2.2 Vibrational Calculations
Harmonic and anharmonic frequencies can be determined using PESMP2 and PESTL. First, harmonic frequencies are computed
from diagonalization of the mass-weighted Hessian matrix. Next,
anharmonic frequencies are obtained (i) from finite-temperature IR
spectra calculated from the dipole-dipole autocorrelation
function75, 76, 77
of MD simulations and (ii) from VPT2 as implemented in the Gaussian
software78 using PESMP2 and
PESTL as external potentials.
2.3 Diffusion Monte Carlo
DMC calculations are used to determine ZPEs (i.e. the quantum ground state energy) for FAM and FAD, and to examine PESTL for holes. Here, the unbiased DMC algorithm was used79, 80, 6. A set of thousands to tens of thousands of random walkers is initialized and subsequently the atoms in each walker are displaced randomly at every timestep. The ensemble of walkers represents the nuclear wavefunction of the molecule. Based on a walker’s potential energy with respect to a reference energy, , they remain alive and can give birth to new walkers, or can be killed. The walkers die and replicate according to the following probabilities6:
| (1) | |||
| (2) |
Here, is the step size in imaginary time. Following each time step, the dead walkers are removed and is updated according to
| (3) |
In Eq. 3 is the averaged
potential energy over the alive walkers, is the magnitude of
fluctuations in the number of walkers and is a parameter, and
and are the number of alive walkers at times 0 and ,
respectively. The ZPE is then approximated as the average of
over all imaginary times.
Following Ref. 6, the DMC calculations were
performed in Cartesian coordinates and in full dimensionality. For
both, FAM and FAD, ten independent DMC simulations were performed. To
obtain an estimate of the ZPEs 30000 walkers were advanced for 50000
time steps following an equilibration period of 5000 time steps. A
step size of au was used. For converging the DMC
simulations outlined above and to obtain statistically meaningful
results more than energy evaluations were required in total. The
computational efficiency of a PES is crucial for DMC simulations which
requires a large number of energy evaluations. The Tensorflow
library81, in which PhysNet is implemented,
allows training and evaluation of the NN on graphics processing units
(GPUs). The use of GPUs for the evaluation of PhysNet speeds up the
calculations as they can be performed in a highly parallel
manner82. Here, all DMC calculations were performed
on a GeForce RTX 2080Ti GPU with 12 Gb of RAM. Each DMC simulation
for FAM (FAD) takes 8.7 (23.7) h on average.
3 Results
3.1 Quality of the PhysNet PESMP2 and PESTL
First, the quality of the NN-learned energy functions is
considered. To assess the reproducibility of the PhysNet models, two
independent models are trained for the MP2 reference data. Both are
evaluated on a test set containing 2600 randomly chosen structures of
the dataset which were not used during training. The model yielding
lower mean absolute and root mean squared errors (MAE and RMSE) on the
test set is then used for the simulations and for TL. The out of
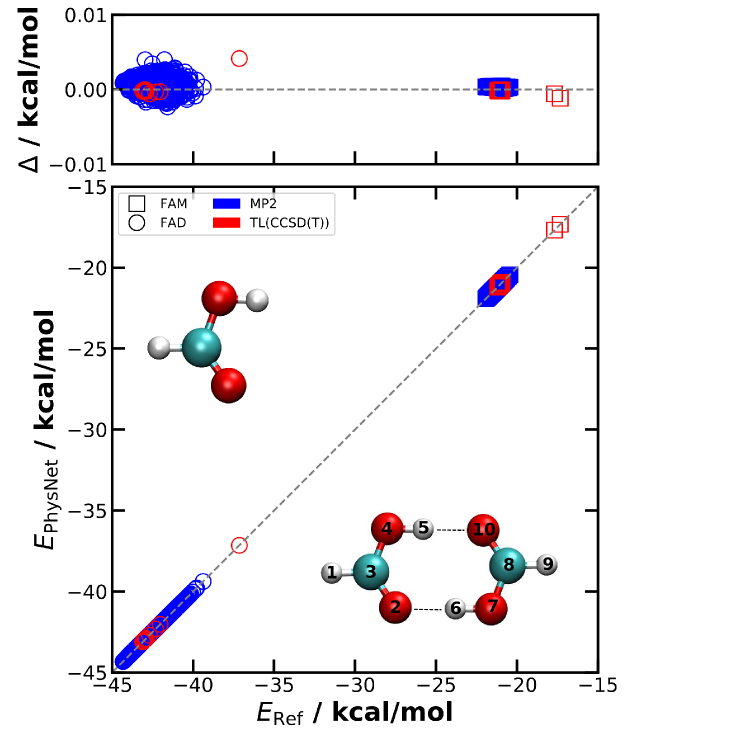
sample performances of both PESMP2 and PESTL are
summarized in Table 1 and
Figure 1.
| PES1MP2 | PES2MP2 | PESTL | |
|---|---|---|---|
| MAE() | 0.012 | 0.014 | 0.007 |
| RMSE() | 0.019 | 0.028 | 0.016 |
| MAE() | 0.026 | 0.029 | 0.076 |
| RMSE() | 0.195 | 0.411 | 0.580 |
| MAE() | 0.001 | 0.001 | 0.002 |
| RMSE() | 0.002 | 0.002 | 0.008 |
| 1-() | 3.7E-9 | 8.5E-9 | 4.1E-9 |
The better of the two PESMP2 is characterized by
MAE kcal/mol, RMSE kcal/mol,
MAE kcal/mol/Å and
RMSE kcal/mol/Å. Accuracies similar to PESMP2
are achieved for PESTL, although the test set (44 geometries)
is smaller than for learning at the MP2 level: the performance is
MAE kcal/mol, RMSE kcal/mol,
MAE kcal/mol/Å, and RMSE kcal/mol/Å, see
Table 1 which also reports results for the dipole
moments.
The quality of PESMP2 can also be assessed in terms of
molecular geometries and the energy barrier for double proton
transfer. The MP2/AVTZ optimized geometries of FAM, FAD and the proton
transfer TS (see Tables S1-S3)
are reproduced by PESMP2 with RMSEs smaller than 0.003 Å.
The energy barrier for PESMP2 is 6.69 kcal/mol compared with
6.71 kcal/mol from ab initio calculations, i.e. a difference
of 0.02 kcal/mol. The proton transfer barrier, which is underestimated
at the MP2 level of theory, is one of the essential features of the
FAD PESTL. Earlier studies at the coupled cluster level of
theory yielded barrier heights of 7.95, 8.16 and 8.30 kcal/mol using
the CCSD(T)-F12a/haDZ, CCSD(T)-F12a/haTZ//CCSD(T)-F12a/haDZ and
CCSD(T)/aV5Z//MP2/aV5Z level of theory,
respectively.31, 28. The barrier for DPT at
the CCSD(T)/aug-cc-pVTZ level was found to be
7.9 kcal/mol25. This agrees favourably with a barrier
of 7.92 kcal/mol from the present PESTL. The experimental
barrier height is estimated to be 7.3 kcal/mol using a 3D-model to
reproduce the tunneling splitting of 331.2 MHz53. A
somewhat lower barrier for DPT (7.2 kcal/mol) was also found from
morphing an MP2-based full-dimensional PES to reproduce the
experimentally observed, broad IR absorption from finite-temperature
MD simulations.25
The dissociation energy on the PESTL for FAD into two
FAMs is –16.79 kcal/mol which is identical to that from explicit
ab initio calculations at the CCSD(T)/AVTZ level of
theory29. Because the training set for the
full-dimensional PES contains structures of FAM and FAD, dissociation
along the reaction path connects the minimum energy structures of the
two asymptotic states (2 separate FAMs and FAD, respectively).
3.2 Harmonic Frequencies
The FAM harmonic frequencies calculated from the two PhysNet PESs are
compared to their respective MP2 and CCSD(T) reference values in
Figure 2 (squares) and Table S4
reports all frequencies. The harmonic frequencies on PESMP2
reproduce their reference frequencies with a MAE of 0.2 cm-1. It
is noteworthy that PESTL is able to reproduce the
CCSD(T) harmonic frequencies of FAM with a MAE of 0.2 cm-1 with
only 425 FAM geometries used in the TL.
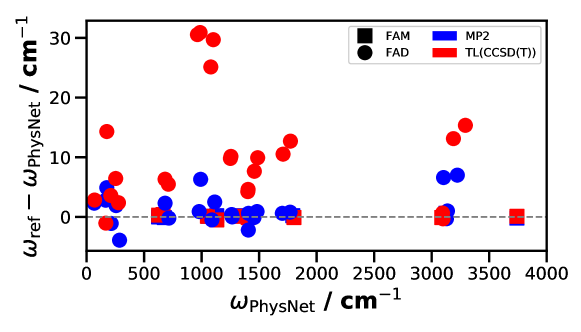
Similarly for FAD, the PhysNet harmonic frequencies are compared with
those from direct ab initio calculations in
Figure 2 (circles) and
Table S5. Frequencies from PESMP2 match the
ab initio harmonic frequencies with a MAE of 2.1 cm-1 and a
maximum unsigned deviation of 7 cm-1 for mode 24. For FAD the
harmonic frequencies on PESTL show a somewhat larger MAE than
frequencies from PESMP2. The reference CCSD(T)/aug-cc-pVTZ
harmonic frequencies were those from
Ref. 27. It is possible that slightly
different convergence criteria were used in these calculations than
the ones used here. But because such calculations are very time
consuming it was decided not to repeat them here. The MAE between
reference frequencies and those from PESTL is 10.7 cm-1
and deviations up to cm-1 for single frequencies
occur.
3.3 VPT2 Calculations
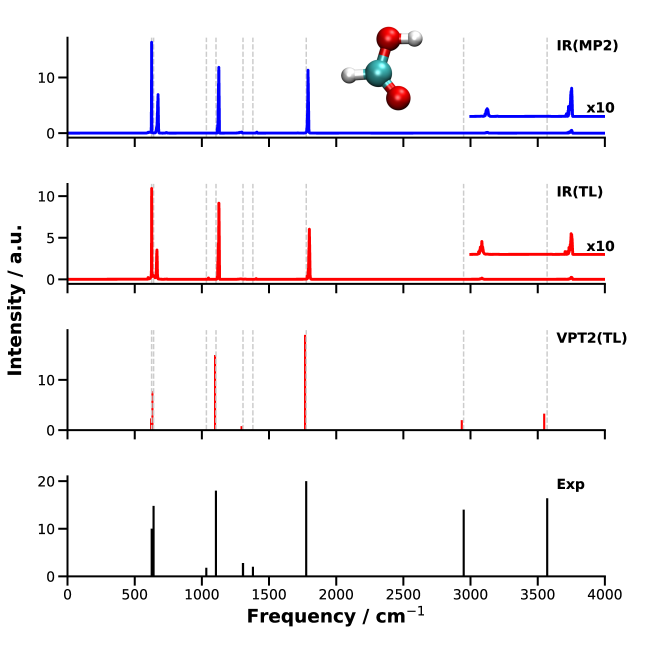
VPT2 calculations are carried out for FAM and FAD using PESMP2 and PESTL as a complement to finite- spectra, see
Figures 3 and 4 and
Table 2. The VPT2 frequencies for FAM obtained from
PESTL agree well with experiment (MAE of 8.4 cm-1) for
which the largest deviation is found for the highest frequency mode,
i.e. a difference of 22.2 cm-1. The corresponding intensities
capture the general trend of the experiment and, converse to the
finite- spectra (see below), even the intensities of the two lowest
modes agree with experiment (see Figure 3). For FAD,
the MAE of the VPT2 frequencies is 19.3 cm-1 compared with
experiment whereas the intensities agree favourably (see
Figure 4). For FAD the MAEs of the VPT2 calculations on
the two NN-learned PESs with respect to MP2 reference and experiment
are 6.4 cm-1 (PESMP2) and 19.3 cm-1 (PESTL), respectively. For PESTL the deviations are largest
for the low (modes 1 to 6, MAE of 30.2 cm-1) and high frequency
vibrations (modes 22 to 24), see Table 2.
One interesting observation concerns the correct
assignment45 of the fundamental (mode 5 in
Table 2) and (first overtone of mode 2 in
Table 2) modes in FAM. VPT2 calculations using PESTL find at 1296.0 cm-1 and cm-1 which is consistent with recent Raman data measured
in a jet reporting a frequency of 1306 cm-1 and
1220 cm-1 for the fundamental and the overtone,
respectively40. VPT2 calculations at the MP2
level using PESMP2, on the other hand, find = 1220.6
and cm-1, i.e. the opposite assignment compared
with experiment and calculations at the higher level of theory.
| FAM | FAD | |||||||
| PESMP2 | MP2 | PESTL | Expa | PESMP2 | MP2 | PESTL | Exp | |
| 1 | 619.9 | 619.5 | 621.6 | 626.17 | 78.0 | 70.2 | 91.6 | 69.2 b |
| 2 | 643 | 641.8 | 632.2 | 640.73 | 178.5 | 160.4 | 164.4 | 161.0 c |
| 3 | 1036.7 | 1036.4 | 1029.1 | 1033.47 | 185.0 | 171.0 | 200.9 | 168.5 b |
| 4 | 1097.2 | 1098.2 | 1098.6 | 1104.85 | 206.2 | 197.3 | 229.4 | 194.0 c |
| 5 | 1222.2 | 1220.6 | 1296.0 | 1306.2 | 255.8 | 246.0 | 265.8 | 242.0 c |
| 6 | 1380.7 | 1381.0 | 1374.9 | 1379.05 | 281.1 | 271.9 | 327.6 | 264.0 d |
| 7 | 1761.3 | 1760.5 | 1768.2 | 1776.83 | 686.4 | 678.5 | 679.6 | 682.0 c |
| 8 | 2975.4 | 2967.8 | 2935.3 | 2942.06 | 713.4 | 707.6 | 707.4 | 698.0 b |
| 9 | 3549.8 | 3554.9 | 3548.3 | 3570.5 | 945.2 | 936.0 | 925.6 | 911.0 e |
| 10 | 971.6 | 966.1 | 958.1 | 942 f | ||||
| 11 | 1065.2∗ | 1062.6 | 1075.4 | 1050 g | ||||
| 12 | 1083.9∗ | 1076.6 | 1084.6 | 1060 h | ||||
| 13 | 1237.1 | 1233 | 1238.2 | 1214 h | ||||
| 14 | 1238.4 | 1240.6 | 1240.1 | 1233.9 i | ||||
| 15 | 1370.4 | 1369.2 | 1371.2 | 1371.78 j | ||||
| 16 | 1376.7 | 1373.2 | 1374.4 | 1375 h | ||||
| 17 | 1403∗ | 1407.6 | 1406.6 | 1415 g | ||||
| 18 | 1426.7∗ | 1430.7 | 1435 | 1454 b | ||||
| 19 | 1662.6 | 1659.1 | 1661.6 | 1666 k | ||||
| 20 | 1732.9 | 1732.9 | 1734.5 | 1741 k | ||||
| 21 | 2763∗ | 2763.5 | 2875 | 2900 d | ||||
| 22 | 2945.4∗ | 2961.7 | 2912.3 | 2939.7 l | ||||
| 23 | 2961.8 | 2962.9 | 2920.1 | 2949 h | ||||
| 24 | 2968.5 | 2963.4 | 3011.2 | 3050 b | ||||
| MAE | 2.0 | 8.4 | 6.4 | 19.3 | ||||
For the errors of the VPT2 calculation of FAD there are several
potential reasons. First, PESTL is less accurate in
reproducing harmonic frequencies at the CCSD(T) level. Secondly, the
low frequency harmonic modes 1 to 6 agree well with experiment (see
Table S5). However, VPT2 determines anharmonic
corrections to be added to or subtracted from the harmonic
frequencies. Hence, if the harmonic frequencies agree well with
experiment, the VPT2 frequencies potentially differ from experimental
values and the disagreement is larger for larger anharmonic
corrections as is often the case for low frequency
vibrations. Thirdly, VPT2 calculations also may incur larger errors,
in particular for proton-bound dimers with large amplitude
motions.88 Finally, the above errors can also
accumulate which then leads to worse agreement between experimentally
observed and computed anharmonic frequencies despite the high quality
of PESTL. It should be noted that VPT2 calculations at the
CCSD(T) level using conventional electronic structure codes for FAM is
computationally demanding and for FAD it is unfeasible.
3.4 Finite- Infrared Spectra
Formic Acid Monomer: The IR spectra for FAM obtained from MD
simulations on PESMP2 and PESTL are shown in
Figure 3 together with the experimental
frequencies30, 20. Both computed spectra
are averages over 1000 independent MD simulations run at 300 K
for 200 ps each. The low frequency modes faithfully describe those
measured experimentally. On the other hand, the computed high
frequency X-H modes are consistently shifted to the blue by 150 to 200
cm-1 relative to experiment. It is known that specifically for
high-frequency modes the anharmonic regions of the PES are not
sufficiently sampled in finite- MD
simulations.35, 34, 89 This usually
leads to overestimation of computed frequencies when compared with
experiments as is also found here. The OH stretch frequency for FAM
using PESMP2 and PESTL is centered around the same
frequency of cm-1 which compares with an experimental
value of 3571 cm-1.20 Counter to the
expectation that on a higher-level PES agreement between computation
and experiment improves, PESMP2 and PESTL find the
OH stretch mode at essentially the same frequency. Hence, the inferior
performance of MD for the high-frequency XH stretch modes is not
primarily related to the quality of the PES but rather due to
shortcomings of finite-temperature MD simulations to realistically
sample the anharmonicity of the PES.
Formic Acid Dimer: The averaged IR spectrum from 1000
independent trajectories, each 200 ps in length using PESMP2
and PESTL at 300 K for FAD is shown in
Figure 4. For the modes below 2000 cm-1 the
position and the relative intensities from the computations compare
favourably with experiments.27, 24 Even
finer details, such as the low intensities of the peaks at 942 and
1233.9 cm-1 are surprisingly well captured by simulations with
the two PESs. It is also of interest to note that for some modes the
computed harmonic, anharmonic and experimentally observed frequencies
agree rather well. For example, for the lowest frequency mode of FAD
, , and
cm-121. Larger
differences between the predicted frequencies and experiment are,
however, again found in the high frequency range. Based on the normal
modes, an OH stretch frequency of 3273 and of 3338 cm-1 is found
in the IR of the FAD on PESMP2 and PESTL,
respectively. The agreement between experiment and simulations is
similar to that found from 12 ps simulations on the PIP-based PES
although there the 1741 cm-1 band appears to be shifted somewhat
to the blue.35
The experimental Fourier Transform transmittance spectrum of FAD
recorded in a jet reported21 a broad band with
superimposed sharp features extending from below 2600 cm-1 up to
at least 3300 cm-1. The sharp features arise mostly from
combination bands and make it difficult to assign one specific
absorption feature to the OH stretch vibration. However, it is
reasonable to assume that it is located to the blue side of the
CH-stretch band rather than to the red side of it. Interestingly, the
width of the jet-cooled spectrum is comparable to that recorded at
room temperature. Hence, cooling only leads to sharpening of certain
features but not to a simpler spectrum. This is consistent with other
studies on formic and acetic acid.22, 90 A
potential assignment of the OH stretch vibration in FAD was
made21 to a signature at 3084 cm-1 by
comparing with earlier calculations (SCF with double zeta basis
set).91 Similarly, earlier Raman spectra of
(DCOOH)2 reported a broad absorption around and above 3000
cm-1 and assigned features between 2565 cm-1 and 3427
cm-1 to the dimer OH stretching band.92 Finally,
a broad absorption was also found from lower resolution, room
temperature IR spectroscopy25 for which spectral
subtraction techniques were used to obtain the IR spectrum of FAD. The
transition assigned to the OH-stretch was the region between 2600 and
3400 cm-1 with a maximum at
cm-1.25 Hence, assignment of the OH-stretch
frequency is not straightforward. Here, a position of
cm-1 was used to compare with. However, it needs to be stressed
that considerable uncertainty about both, the position and the width
of this band exist.

The failure of finite- MD simulations to even qualitatively capture
the spectroscopy of high-frequency modes is primarily related to the
fact that at K, at which most MD studies are carried out,
the anharmonicities of X–H vibrations are not sampled
adequately. Because constraining the correct amount of ZPE in the
modes of polyatomic molecules is as of now an unsolved
problem34, an alternative that has been considered
is to run MD simulations at higher
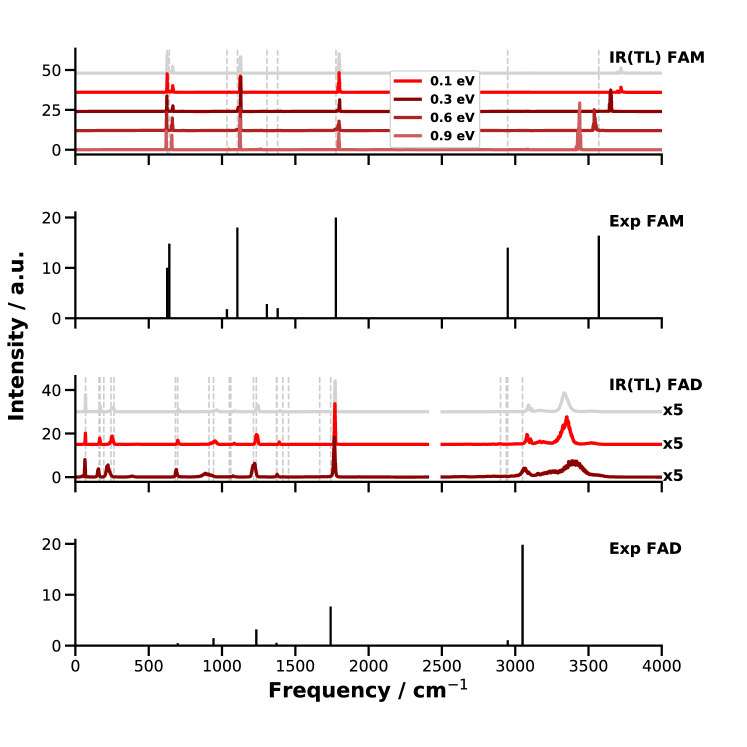
temperature34, 89. Here, simulations with
increasing amount of energy in the OH stretch of FAM and FAD have been
carried out using PESTL. The simulations are run with
excess energies of 0.1, 0.3, 0.6, and 0.9 eV for FAM and of 0.1 and
0.3 eV for FAD in each of the OH stretch modes. For comparison, the
(harmonic) ZPE of FAM in this mode is 1647 cm-1 (equivalent to
0.2 eV). This energy is initially placed into the OH stretch(es) as
kinetic energy. The -dependent IR spectra
(Figure 5) correspond to an ensemble of 45
trajectories run for 200 ps each. For FAM it was found that with
increasing energy content in the OH stretch the associated band shifts
progressively towards the red as expected. With an excess of 0.5 eV
the computed OH stretch aligns with that reported from
experiment.
Even though the energy redistribution to the lower frequency modes
does occur on the time scale of the simulations the spectroscopic
features below 2000 cm-1 do not respond strongly to the increased
temperature. To assess the redistribution of vibrational energy a
supplemental trajectory is run for FAM with an excess of 0.5 eV in the
OH stretch mode. The energy remains in this mode for at least 150 ps
after which it slowly redistributes into other degrees of freedom, see
Figure S1.
For FAD running the simulations at higher temperature apparently does
not solve the problem of overestimating the location of the XH
bands. As one additional complication, the binding energy,
i.e. , of the dimer is only
kcal/mol ( eV). Hence, excitation of the two OH
stretch vibrations with more than kcal/mol ( eV)
leads to dissociation of the dimer and the spectroscopy of the
H-bonded OHO motifs can not be probed. For the simulations
with 0.1 eV of excess the OHO hydrogen bond (distance between
O10 and H5 or O2 and H6, see
Figure 1) extends up to 2.3 Å compared with an
equilibrium separation of 1.68 Å. With an excess of 0.3 eV the two
OHO “bonds” elongate up to 3.3 Å. This indicates
considerable destabilization of the dimer due to partial breaking of
the OH bonds and the two FAMs in the dimer start to behave more like
monomers without fully dissociating FAD. Loosening the OHO
contact affects, however, the vibrational frequency of the OH
stretch. Visual inspection also shows that an out of plane bending
motion of the two monomers is excited due to vibrational energy
redistribution which further weakens the OHO hydrogen
bond. For the simulations of FAD with 0.3 eV excess the OH stretch
shifts to the blue by cm-1 whereas the CH stretch
shifts to the red as expected for simulations at higher temperature.
3.5 Diffusion Monte Carlo and Binding Energy
The ML PESs can also be used to determine the dissociation energy
of FAD from computations. For this, a high-quality estimate for
the total ZPE for FAM and FAD is required which can be obtained from
DMC simulations. The average ZPE from 10 independent DMC simulations
for FAM using the PESTL is kcal/mol
( cm-1). Similarly for FAD a ZPE of kcal/mol ( cm-1) was found. The average
DMC energies and standard deviations are determined from block
averaging96. These ZPEs (accounting for
anharmonicity) compare also favourably with 20.900 and
43.885 kcal/mol, respectively, for the monomer and the dimer from the
VPT2 calculations using the same PES (PESTL). Similarly, the
result for FAD also agrees well with a recent study using a PES based
on permutationally invariant polynomials at the CCSD(T)-F12a/haTZ
level of theory and DMC calculations which reported a ZPE of cm-1 ( kcal/mol).31
Based on these ZPEs the FAD dissociation energy can be determined. Here,
is the corrected (see below) binding energy (“from the bottom
of the potential”) and and are the ZPEs of FAM and FAD, respectively. The dissociation
energy needs to be corrected a) to account for basis set
superposition error (BSSE) and b) to include effects due to
finite-size basis set effects by extrapolation to the complete basis
set (CBS) limit. These corrections were determined in previous
work29 and will be used here. This is
possible because kcal/mol from the present work for
dissociation of FAD into two FAMs each at their respective equilibrium
structure, is identical to the value reported from the earlier
CCSD(T)/aug-cc-pVTZ calculations.29
Including corrections for BSSE at the CBS limit yields kcal/mol.29 Together with the ZPEs
of FAM and FAD determined above this yields a best estimate of kcal/mol where the error is that of the ZPEs from the
DMC calculations. This value is consistent, within error bars, with
the experimentally reported value of kcal/mol24 and compares with
kcal/mol from computations with ZPEs obtained from a hybrid VPT2
approach (harmonic frequencies from CCSD(T)/AVQZ and correcting for
anharmonic effects using MP2/AVDZ).29
4 Discussion and Conclusion
In this work the harmonic and anharmonic vibrational spectra for FAM
and FAD in the gas phase have been determined based on correctly
dissociating machine-learned PESs at the MP2 level of theory and
transfer-learned to the CCSD(T) level of theory with the aug-cc-pVTZ
basis set. Harmonic frequencies on PESMP2 and PESTL
from diagonalizing the Hessian are in good agreement with those
determined from conventional ab initio calculations. Accounting
for anharmonicity in the vibrations through VPT2 calculations yields
spectra in good agreement with those observed experimentally. The
finite-temperature MD simulations find good agreement with
experimental spectra for all modes below 2000 cm-1 but disagree
by several 100 cm-1 for the high-frequency XH stretch
vibrations. This confirms earlier findings and is related to the fact
that MD simulations at 300 K do not sample the mechanical
anharmonicity of XH stretch or any other strongly anharmonic modes
sufficiently to give reliable frequencies from such an
approach. Contrary to that, a 24-mode VSCF/VCI calculation on a PES
calculated at the CCSD(T)-F12a/haTZ level of theory and fit to
permutationally invariant polynomials31 correctly
describes the spectroscopy and increased width of the OH-stretch
band.34
| [cm-1] | (MP2) | (CCSD(T)) | (MP2) | (TL) | VPT2(TL) | Exp |
| OH (FAM) | 3741 | 3742 | 3750 | 3750 | 3548 | 3571a |
| OH (FAD) | 3230 | 330927 / 3306 29 | 3273 | 3338 | 3011 | |
| –511 | –433 | –477 | –412 | –537 | – |
The present work also allows to make contact with a recent
assessment26 of various sources of errors in the
spectroscopy and thermodynamics of FAD which reported that “More
often than not, the overestimation of harmonic downshifts in DFT is
qualitatively compensated by the inability of classical dynamics to
sample the anharmonic region probed by the quantum nature of the
hydrogen atom. This frequently provides right answers for the wrong
reasons whenever high-frequency XH stretching spectra are simulated,
because in this case, temperatures of several 1000 K would be needed
to sample the relevant fundamental vibrational displacements.”
While some of these statements are supported by the present
results, others require amendments.
In agreement with this assessment the present work finds that energies
up to 0.5 eV ( K) are required for the OH stretch vibration
in FAM to agree with experiment. This is consistent with the
temperature required to reproduce the
stretching fundamental of a simple Morse oscillator with harmonic
wavenumber .97 On the other hand,
the CCSD(T)-level quality of PESTL allows to probe whether or
not accidental agreement with experiment is found for the complexation
induced red shifts and . For the harmonic
frequencies, the red shifts are cm-1 and
cm-1 from normal mode calculations at the
MP2 and CCSD(T) levels of theory, compared with and
cm-1 from normal modes on the respective NN-learned PESMP2 and PESTL, see Tables S4 and
S5. MD simulations with PESMP2 at 300 K
find cm-1 compared with cm-1 estimated from experiments21, see
Table 3. With PESTL the red shift is cm-1 and the VPT2 calculations yield a shift of –537
cm-1. It should be noted that VPT2 calculations are known to have
limitations for proton bound dimers.88 This is also
consistent with the present finding that the ZPEs of FAD from DMC
simulations and VPT2 calculations using PESTL differ by 0.14
kcal/mol (50 cm-1) whereas that for FAM is virtually identical.
The shifts from finite- MD simulations still suffer from the
limitation that the anharmonicity of the OH stretch is not
sufficiently sampled, irrespective of the level of theory at which the
PES was determined. However, it is likely that the magnitude and the
direction of the error in the anharmonic OH stretch frequencies differ
for FAM compared with FAD. This can be seen most clearly in Figure
5 where the OH stretch in FAM/FAD shifts to the
red/blue with increasing internal energy, respectively. The
complexation induced red shift from simulations on PESMP2 is
within 44 cm-1 of the experimentally observed value whereas that
on (higher-level) PESTL is lower by 109 cm-1. Given the
close agreement for the anharmonic OH-stretch for FAM from simulations
on the two PESs it is expected that PESTL for FAD is of
similar quality as for FAM and only minor improvement is expected by
adding additional reference points in the transfer learning. This is
supported by the finding that for the OH stretch from
MP2 calculations differs from that on PESMP2 by 7 cm-1
whereas for CCSD(T) and PESTL the difference is 16
cm-1. Likewise, using a larger basis set, such as aug-cc-pVQZ, is
unlikely to change and of the OH stretch appreciably
because the harmonic frequencies from CCSD(T)/aug-cc-pVTZ and
CCSD(T)/aug-cc-pVQZ differ only by 3 cm-1, see Table
3. Thus, the apparent “agreement” between
experiment and spectra computed from the present MD simulations on
PESMP2 is due to differential undersampling the anharmonicity
of the OH coordinate at 300 K for FAM and FAD and also due to the
uncertainty in assigning the OH-stretch in FAD more definitively.
This changes as soon as DPT occurs, because then the full
anharmonicity of the energy function along the XH coordinate must be
sampled. From simulations with multiple forward and backward crossings
in the MD simulations it is expected that the anharmonicity is
comprehensively sampled which should provide more realistic IR
spectra. Previous work on FAD accomplished this by using the MMPT PES
for which trajectories 250 ns in length were carried out which sampled
25 DPT events.25 Such long simulation times become
accessible because these energy functions can be evaluated at the
speed of a conventional empirical force field. Furthermore, the MMPT
function used did not allow FAD to dissociate into two monomers.
In summary, the present work uses machine-learned, full dimensional
and reactive PESs at the MP2 and CCSD(T) levels of theory for FAM and
FAD to characterize their vibrational dynamics. It is established that
for framework vibrational modes (below 2000 cm-1) computed
frequencies from VPT2 and finite- MD simulations agree well with
experiments. However, for the high-frequency XH stretch modes - in
particular the OH modes - MD simulations do not sufficiently sample
the anharmonicities which leads to a considerable overestimation of
the experimentally observed frequencies. Hence, it is primarily the
use of MD simulations that is the source of errors for the
disagreement between experiments and simulations. The estimated
experimentally observed red shift of cm-1 for the
OH stretch peak21 compares with –477 cm-1
from finite- simulations on PESMP2 and –412 cm-1
when using PESTL in the simulations. The red shift from the
VPT2 calculations is –537 cm-1. However, there is considerable
uncertainty on the position and width of the OH-stretch fundamental
which makes it less suited for direct comparison with computations.
For FAM, running simulations at elevated temperatures does not affect
the framework modes but shifts the OH stretch modes towards the
frequencies observed in experiments. On the other hand, for FAD
destabilization of the dimer prevents using such an approach. Hence,
computing accurate complexation-induced spectral shifts remain a
challenge even on high-level PESs due to shortcomings in the dynamics
simulations underlying the spectroscopy. This is also not expected to
change if approximate quantum methods such as QCMD or RPMD simulations
are used, as was shown explicitly.89, 35 The
computed dissociation energy of kcal/mol from
a combination of electronic structure calculations and DMC simulations
on the CCSD(T)-quality PESTL is in favourable agreement with
the value of kcal/mol from experiments.
5 Acknowledgment
We thank Prof. J. M. Bowman and Dr. C. Qu for fruitful exchange on the implementation of DMC and Prof. M. Suhm and Dr. A. Nejad for valuable correspondence. This work was supported by the Swiss National Science Foundation through grants 200021-117810, 200020-188724 and the NCCR MUST, and the University of Basel.
References
- El Hage et al. 2017 El Hage, K.; Brickel, S.; Hermelin, S.; Gaulier, G.; Schmidt, C.; Bonacina, L.; Van Keulen, S. C.; Bhattacharyya, S.; Chergui, M.; Hamm, P. et al. Implications of short time scale dynamics on long time processes. Struct. Dyn. 2017, 4, 061507
- Koner et al. 2020 Koner, D.; Bemish, R. J.; Meuwly, M. Dynamics on Multiple Potential Energy Surfaces: Quantitative Studies of Elementary Processes Relevant to Hypersonics. J. Phys. Chem. A 2020, 124, 6255–6269
- Käser et al. 2020 Käser, S.; Unke, O. T.; Meuwly, M. Reactive dynamics and spectroscopy of hydrogen transfer from neural network-based reactive potential energy surfaces. New J. Phys. 2020, 22, 055002
- Meuwly 2021 Meuwly, M. Machine Learning for Chemical Reactions. Chem. Rev. 2021, https://doi.org/10.1021/acs.chemrev.1c00033
- Unke et al. 2021 Unke, O. T.; Chmiela, S.; Sauceda, H. E.; Gastegger, M.; Poltavsky, I.; Schütt, K. T.; Tkatchenko, A.; Müller, K.-R. Machine learning force fields. Chem. Rev. 2021, https://doi.org/10.1021/acs.chemrev.0c01111
- Qu et al. 2021 Qu, C.; Houston, P. L.; Conte, R.; Nandi, A.; Bowman, J. M. Breaking the Coupled Cluster Barrier for Machine-Learned Potentials of Large Molecules: The Case of 15-Atom Acetylacetone. J. Phys. Chem. Lett. 2021, 12, 4902–4909
- Friesner 2005 Friesner, R. A. Ab initio quantum chemistry: Methodology and applications. Proc. Natl. Acad. Sci. USA 2005, 102, 6648–6653
- Pan and Yang 2009 Pan, S. J.; Yang, Q. A survey on transfer learning. IEEE Trans. Knowl. Data Eng. 2009, 22, 1345–1359
- Taylor and Stone 2009 Taylor, M. E.; Stone, P. Transfer learning for reinforcement learning domains: A survey. J. Mach. Learn. Res. 2009, 10, 1633–1685
- Smith et al. 2018 Smith, J. S.; Nebgen, B. T.; Zubatyuk, R.; Lubbers, N.; Devereux, C.; Barros, K.; Tretiak, S.; Isayev, O.; Roitberg, A. Outsmarting quantum chemistry through transfer learning. Preprint at https://chemrxiv. org/articles/Outsmarting_Quantum_Chemistry_ Through_Transfer_Learning/6744440 2018,
- Ramakrishnan et al. 2015 Ramakrishnan, R.; Dral, P.; Rupp, M.; von Lilienfeld, O. A. Big Data meets quantum chemistry approximations: The -machine learning approach. J. Chem. Theory Comput. 2015, 11, 2087–2096
- Käser et al. 2020 Käser, S.; Koner, D.; Christensen, A. S.; von Lilienfeld, O. A.; Meuwly, M. Machine Learning Models of Vibrating H2CO: Comparing Reproducing Kernels, FCHL, and PhysNet. J. Phys. Chem. A 2020, 124, 8853–8865
- Nandi et al. 2021 Nandi, A.; Qu, C.; Houston, P. L.; Conte, R.; Bowman, J. M. -machine learning for potential energy surfaces: A PIP approach to bring a DFT-based PES to CCSD(T) level of theory. J. Chem. Phys. 2021, 154, 051102
- Käser et al. 2021 Käser, S.; Boittier, E. D.; Upadhyay, M.; Meuwly, M. Transfer Learning to CCSD(T): Accurate Anharmonic Frequencies from Machine Learning Models. J. Chem. Theory Comput. 2021, 17, 3687–3699
- Khare et al. 1999 Khare, P.; Kumar, N.; Kumari, K.; Srivastava, S. Atmospheric formic and acetic acids: An overview. Rev. Geophys. 1999, 37, 227–248
- van Putten et al. 2019 van Putten, R.; Wissink, T.; Swinkels, T.; Pidko, E. A. Fuelling the hydrogen economy: Scale-up of an integrated formic acid-to-power system. Int. J. Hydrog. Energy 2019, 44, 28533–28541
- Wang et al. 2020 Wang, Q.; Warnan, J.; Rodríguez-Jiménez, S.; Leung, J. J.; Kalathil, S.; Andrei, V.; Domen, K.; Reisner, E. Molecularly engineered photocatalyst sheet for scalable solar formate production from carbon dioxide and water. Nat. Energy 2020, 5, 703–710
- Xia et al. 2019 Xia, C.; Zhu, P.; Jiang, Q.; Pan, Y.; Liang, W.; Stavitski, E.; Alshareef, H. N.; Wang, H. Continuous production of pure liquid fuel solutions via electrocatalytic CO2 reduction using solid-electrolyte devices. Nat. Energy 2019, 4, 776–785
- Ito and Nakanaga 2000 Ito, F.; Nakanaga, T. A jet-cooled infrared spectrum of the formic acid dimer by cavity ring-down spectroscopy. Chem. Phys. Lett. 2000, 318, 571–577
- Freytes et al. 2002 Freytes, M.; Hurtmans, D.; Kassi, S.; Liévin, J.; Vander Auwera, J.; Campargue, A.; Herman, M. Overtone spectroscopy of formic acid. Chem. Phys. 2002, 283, 47–61
- Georges et al. 2004 Georges, R.; Freytes, M.; Hurtmans, D.; Kleiner, I.; Vander Auwera, J.; Herman, M. Jet-cooled and room temperature FTIR spectra of the dimer of formic acid in the gas phase. Chem. Phys. 2004, 305, 187–196
- Zielke and Suhm 2007 Zielke, P.; Suhm, M. Raman jet spectroscopy of formic acid dimers: low frequency vibrational dynamics and beyond. Phys. Chem. Chem. Phys. 2007, 9, 4528–4534
- Xue and Suhm 2009 Xue, Z.; Suhm, M. Probing the stiffness of the simplest double hydrogen bond: The symmetric hydrogen bond modes of jet-cooled formic acid dimer. J. Chem. Phys. 2009, 131, 054301
- Kollipost et al. 2012 Kollipost, F.; Larsen, R. W.; Domanskaya, A. V.; Nörenberg, M.; Suhm, M. A. Communication: The highest frequency hydrogen bond vibration and an experimental value for the dissociation energy of formic acid dimer. J. Chem. Phys. 2012, 136, 151101
- Mackeprang et al. 2016 Mackeprang, K.; Xu, Z.-H.; Maroun, Z.; Meuwly, M.; Kjaergaard, H. G. Spectroscopy and dynamics of double proton transfer in formic acid dimer. Phys. Chem. Chem. Phys. 2016, 18, 24654–24662
- Nejad and Suhm 2020 Nejad, A.; Suhm, M. A. Concerted pair motion due to double hydrogen bonding: The formic acid dimer case. J. Ind. Inst. Sci. 2020, 100, 5–19
- Kalescky et al. 2013 Kalescky, R.; Kraka, E.; Cremer, D. Local vibrational modes of the formic acid dimer–the strength of the double hydrogen bond. Mol. Phys. 2013, 111, 1497–1510
- Ivanov et al. 2015 Ivanov, S. D.; Grant, I. M.; Marx, D. Quantum free energy landscapes from ab initio path integral metadynamics: Double proton transfer in the formic acid dimer is concerted but not correlated. J. Chem. Phys. 2015, 143, 124304
- Miliordos and Xantheas 2015 Miliordos, E.; Xantheas, S. S. On the validity of the basis set superposition error and complete basis set limit extrapolations for the binding energy of the formic acid dimer. J. Chem. Phys. 2015, 142, 094311
- Tew and Mizukami 2016 Tew, D. P.; Mizukami, W. Ab initio vibrational spectroscopy of cis-and trans-formic acid from a global potential energy surface. J. Phys. Chem. A 2016, 120, 9815–9828
- Qu and Bowman 2016 Qu, C.; Bowman, J. M. An ab initio potential energy surface for the formic acid dimer: zero-point energy, selected anharmonic fundamental energies, and ground-state tunneling splitting calculated in relaxed 1–4-mode subspaces. Phys. Chem. Chem. Phys. 2016, 18, 24835–24840
- Richardson 2017 Richardson, J. O. Full-and reduced-dimensionality instanton calculations of the tunnelling splitting in the formic acid dimer. Phys. Chem. Chem. Phys. 2017, 19, 966–970
- Qu and Bowman 2018 Qu, C.; Bowman, J. M. High-dimensional fitting of sparse datasets of CCSD(T) electronic energies and MP2 dipole moments, illustrated for the formic acid dimer and its complex IR spectrum. J. Chem. Phys. 2018, 148, 241713
- Qu and Bowman 2018 Qu, C.; Bowman, J. M. Quantum and classical IR spectra of (HCOOH)2, (DCOOH)2 and (DCOOD)2 using ab initio potential energy and dipole moment surfaces. Faraday Discuss. 2018, 212, 33–49
- Qu and Bowman 2018 Qu, C.; Bowman, J. M. IR Spectra of (HCOOH)2 and (DCOOH)2: Experiment, VSCF/VCI, and ab initio molecular dynamics calculations using full-dimensional potential and dipole moment surfaces. J. Phys. Chem. Lett 2018, 9, 2604–2610
- Reutemann and Kieczka 2011 Reutemann, W.; Kieczka, H. Ullmann’s Encyclopedia of Industrial Chemistry; American Cancer Society, 2011
- Balabin 2009 Balabin, R. M. Polar (acyclic) isomer of formic acid dimer: Gas-phase Raman spectroscopy study and thermodynamic parameters. J. Phys. Chem. A 2009, 113, 4910–4918
- Millikan and Pitzer 1957 Millikan, R. C.; Pitzer, K. S. Infrared spectra and vibrational assignment of monomeric formic acid. J. Chem. Phys. 1957, 27, 1305–1308
- Luiz et al. 1997 Luiz, G.; Scalabrin, A.; Pereira, D. Gas phase infrared Fourier transform spectra of H12COOH and H13COOH. Infrared Phys. Technol. 1997, 38, 45–49
- Nejad et al. 2020 Nejad, A.; Suhm, M. A.; Meyer, K. A. Increasing the weights in the molecular work-out of cis- and trans-formic acid: Extension of the vibrational database via deuteration. Phys. Chem. Chem. Phys. 2020, 22, 25492–25501
- Millikan and Pitzer 1958 Millikan, R. C.; Pitzer, K. S. The infrared spectra of dimeric and crystalline formic acid. J. Am. Chem. Soc. 1958, 80, 3515–3521
- Ito and Nakanaga 2002 Ito, F.; Nakanaga, T. Jet-cooled infrared spectra of the formic acid dimer by cavity ring-down spectroscopy: observation of the O–H stretching region. Chem. Phys. 2002, 277, 163–169
- Meyer et al. 2020 Meyer, K. A.; Davies, J. A.; Ellis, A. M. Shifting formic acid dimers into perspective: vibrational scrutiny in helium nanodroplets. Phys. Chem. Chem. Phys. 2020, 22, 9637–9646
- Richter and Carbonnière 2018 Richter, F.; Carbonnière, P. Vibrational treatment of the formic acid double minimum case in valence coordinates. J. Chem. Phys. 2018, 148, 064303
- Nejad and Sibert III 2021 Nejad, A.; Sibert III, E. L. The Raman jet spectrum of trans-formic acid and its deuterated isotopologs: Combining theory and experiment to extend the vibrational database. J. Chem. Phys. 2021, 154, 064301
- Kim 1996 Kim, Y. Direct dynamics calculation for the double proton transfer in formic acid dimer. J. Am. Chem. Soc. 1996, 118, 1522–1528
- Miura et al. 1998 Miura, S.; Tuckerman, M. E.; Klein, M. L. An ab initio path integral molecular dynamics study of double proton transfer in the formic acid dimer. J. Chem. Phys. 1998, 109, 5290–5299
- Ortlieb and Havenith 2007 Ortlieb, M.; Havenith, M. Proton transfer in (HCOOH)2: an IR high-resolution spectroscopic study of the antisymmetric C–O stretch. J. Phys. Chem. A 2007, 111, 7355–7363
- Goroya et al. 2014 Goroya, K. G.; Zhu, Y.; Sun, P.; Duan, C. High resolution jet-cooled infrared absorption spectra of the formic acid dimer: a reinvestigation of the C–O stretch region. J. Chem. Phys. 2014, 140, 164311
- Richardson and Althorpe 2011 Richardson, J. O.; Althorpe, S. C. Ring-polymer instanton method for calculating tunneling splittings. J. Chem. Phys. 2011, 134, 054109
- Zhang et al. 2017 Zhang, Y.; Li, W.; Luo, W.; Zhu, Y.; Duan, C. High resolution jet-cooled infrared absorption spectra of (HCOOH)2, (HCOOD)2, and HCOOH—HCOOD complexes in 7.2 m region. J. Chem. Phys. 2017, 146, 244306
- Santa Daría et al. 2021 Santa Daría, A. M.; Avila, G.; Mátyus, E. Fingerprint region of the formic acid dimer: variational vibrational computations in curvilinear coordinates. Phys. Chem. Chem. Phys. 2021, 23, 6526–6535
- Li et al. 2019 Li, W.; Evangelisti, L.; Gou, Q.; Caminati, W.; Meyer, R. The barrier to proton transfer in the dimer of formic acid: a pure rotational study. Angew. Chem. Int. Ed. Engl. 2019, 58, 859–865
- Unke and Meuwly 2019 Unke, O. T.; Meuwly, M. PhysNet: A neural network for predicting energies, forces, dipole moments, and partial charges. J. Chem. Theory Comput. 2019, 15, 3678–3693
- Rivero et al. 2019 Rivero, U.; Unke, O. T.; Meuwly, M.; Willitsch, S. Reactive atomistic simulations of Diels-Alder reactions: The importance of molecular rotations. J. Chem. Phys. 2019, 151, 104301
- Brickel et al. 2019 Brickel, S.; Das, A. K.; Unke, O. T.; Turan, H. T.; Meuwly, M. Reactive molecular dynamics for the [Cl–CH3–Br]- reaction in the gas phase and in solution: a comparative study using empirical and neural network force fields. Electron. Struct. 2019, 1, 024002
- Käser et al. 2020 Käser, S.; Unke, O. T.; Meuwly, M. Isomerization and decomposition reactions of acetaldehyde relevant to atmospheric processes from dynamics simulations on neural network-based potential energy surfaces. J. Chem. Phys. 2020, 152, 214304
- Sweeny et al. 2020 Sweeny, B. C.; Pan, H.; Kassem, A.; Sawyer, J. C.; Ard, S. G.; Shuman, N. S.; Viggiano, A. A.; Brickel, S.; Unke, O. T.; Upadhyay, M. et al. Thermal activation of methane by MgO+: temperature dependent kinetics, reactive molecular dynamics simulations and statistical modeling. Phys. Chem. Chem. Phys. 2020, 22, 8913–8923
- Behler and Parrinello 2007 Behler, J.; Parrinello, M. Generalized neural-network representation of high-dimensional potential-energy surfaces. Phys. Rev. Lett. 2007, 98, 146401
- Gilmer et al. 2017 Gilmer, J.; Schoenholz, S. S.; Riley, P. F.; Vinyals, O.; Dahl, G. E. Neural message passing for quantum chemistry. Proc. of the 34th Int. Conf. on Machine Learning-Volume 70. 2017; pp 1263–1272
- Baydin et al. 2017 Baydin, A. G.; Pearlmutter, B. A.; Radul, A. A.; Siskind, J. M. Automatic differentiation in machine learning: a survey. J. Mach. Learn. Res. 2017, 18, 5595–5637
- Møller and Plesset 1934 Møller, C.; Plesset, M. S. Note on an approximation treatment for many-electron systems. Phys. Rev. 1934, 46, 618–622
- Kendall et al. 1992 Kendall, R. A.; Dunning Jr, T. H.; Harrison, R. J. Electron affinities of the first-row atoms revisited. Systematic basis sets and wave functions. J. Chem. Phys. 1992, 96, 6796–6806
- Werner et al. 2019 Werner, H.-J.; Knowles, P. J.; Knizia, G.; Manby, F. R.; Schütz, M.; Celani, P.; Györffy, W.; Kats, D.; Korona, T.; Lindh, R. et al. MOLPRO, version 2019, a package of ab initio programs. 2019
- Larsen et al. 2017 Larsen, A. H.; Mortensen, J. J.; Blomqvist, J.; Castelli, I. E.; Christensen, R.; Dułak, M.; Friis, J.; Groves, M. N.; Hammer, B.; Hargus, C. et al. The atomic simulation environment – a Python library for working with atoms. J. Phys. Condens. Matter 2017, 29, 273002
- J.J.P. Stewart 2016 J.J.P. Stewart, S. C. C. MOPAC 2016. 2016; Colorado Springs, CO, USA
- Stewart 2007 Stewart, J. J. Optimization of parameters for semiempirical methods V: modification of NDDO approximations and application to 70 elements. J. Mol. Model. 2007, 13, 1173–1213
- Torrie and Valleau 1977 Torrie, G. M.; Valleau, J. P. Nonphysical sampling distributions in Monte Carlo free-energy estimation: Umbrella sampling. J. Comput. Phys. 1977, 23, 187–199
- Huang and von Lilienfeld 2020 Huang, B.; von Lilienfeld, O. A. Quantum machine learning using atom-in-molecule-based fragments selected on the fly. Nat. Chem. 2020, 12, 945–951
- Behler 2016 Behler, J. Perspective: Machine learning potentials for atomistic simulations. J. Chem. Phys. 2016, 145, 170901
- Behler 2015 Behler, J. Constructing high-dimensional neural network potentials: A tutorial review. Int. J. Quantum. Chem. 2015, 115, 1032–1050
- Smith et al. 2017 Smith, J. S.; Isayev, O.; Roitberg, A. E. ANI-1, A data set of 20 million calculated off-equilibrium conformations for organic molecules. Sci. Data 2017, 4, 170193
- Pople et al. 1987 Pople, J. A.; Head-Gordon, M.; Raghavachari, K. Quadratic configuration interaction. A general technique for determining electron correlation energies. J. Chem. Phys. 1987, 87, 5968–5975
- Purvis III and Bartlett 1982 Purvis III, G. D.; Bartlett, R. J. A full coupled-cluster singles and doubles model: The inclusion of disconnected triples. J. Chem. Phys. 1982, 76, 1910–1918
- Thomas et al. 2013 Thomas, M.; Brehm, M.; Fligg, R.; Vöhringer, P.; Kirchner, B. Computing vibrational spectra from ab initio molecular dynamics. Phys. Chem. Chem. Phys. 2013, 15, 6608–6622
- Schmitz and Tavan 2004 Schmitz, M.; Tavan, P. Vibrational spectra from atomic fluctuations in dynamics simulations. I. Theory, limitations, and a sample application. J. Chem. Phys. 2004, 121, 12233–12246
- Schmitz and Tavan 2004 Schmitz, M.; Tavan, P. Vibrational spectra from atomic fluctuations in dynamics simulations. II. Solvent-induced frequency fluctuations at femtosecond time resolution. J. Chem. Phys. 2004, 121, 12247–12258
- Barone 2005 Barone, V. Anharmonic vibrational properties by a fully automated second-order perturbative approach. J. Chem. Phys. 2005, 122, 014108
- Anderson 1975 Anderson, J. B. A random-walk simulation of the Schrödinger equation: H. J. Chem. Phys. 1975, 63, 1499–1503
- Kosztin et al. 1996 Kosztin, I.; Faber, B.; Schulten, K. Introduction to the diffusion Monte Carlo method. Am. J. Phys. 1996, 64, 633–644
- Abadi et al. 2016 Abadi, M.; Barham, P.; Chen, J.; Chen, Z.; Davis, A.; Dean, J.; Devin, M.; Ghemawat, S.; Irving, G.; Isard, M. et al. Tensorflow: A system for large-scale machine learning. 12th USENIX symposium on operating systems Design and Implementation (OSDI 16). 2016; pp 265–283
- DiRisio et al. 2021 DiRisio, R. J.; Lu, F.; McCoy, A. B. GPU-Accelerated Neural Network Potential Energy Surfaces for Diffusion Monte Carlo. J. Phys. Chem. A 2021, 125, 5849–5859
- Xue 2011 Xue, Z. Raman spectroscopy of carboxylic acid and water aggregates; Logos Verlag Berlin GmbH, 2011
- Kollipost 2015 Kollipost, F. Dissertation: Schwingungsdynamik in O-HO-verbrückten Aggregaten: FTIR-Spektroskopie vom Nah- bis zum Ferninfraroten. 2015, http://hdl.handle.net/11858/00-1735-0000-0023-9644-9
- Bertie and Michaelian 1982 Bertie, J. E.; Michaelian, K. H. The Raman spectra of gaseous formic acid- and-. J. Chem. Phys. 1982, 76, 886–894
- Meyer and Suhm 2018 Meyer, K. A.; Suhm, M. A. Vibrational exciton coupling in homo and hetero dimers of carboxylic acids studied by linear infrared and Raman jet spectroscopy. J. Chem. Phys. 2018, 149, 104307
- Kollipost et al. 2012 Kollipost, F.; Larsen, R. W.; Domanskaya, A.; Nörenberg, M.; Suhm, M. Communication: The highest frequency hydrogen bond vibration and an experimental value for the dissociation energy of formic acid dimer. J. Chem. Phys. 2012, 136, 151101
- Franke et al. 2021 Franke, P. R.; Stanton, J. F.; Douberly, G. E. How to VPT2: Accurate and Intuitive Simulations of CH Stretching Infrared Spectra Using VPT2+K with Large Effective Hamiltonian Resonance Treatments. J. Phys. Chem. A 2021, 125, 1301–1324
- Xu and Meuwly 2017 Xu, Z.-H.; Meuwly, M. Vibrational spectroscopy and proton transfer dynamics in protonated oxalate. J. Phys. Chem. A 2017, 121, 5389–5398
- Häber et al. 2001 Häber, T.; Schmitt, U.; Emmeluth, C.; Suhm, M. A. Ragout-jet FTIR spectroscopy of cluster isomerism and cluster dynamics: from carboxylic acid dimers to N2O nanoparticles. Faraday Discuss. 2001, 118, 331–359
- Chang et al. 1987 Chang, Y. T.; Yamaguchi, Y.; Miller, W. H.; Schaefer III, H. F. An analysis of the infrared and Raman spectra of the formic acid dimer (HCOOH)2. J. Am. Chem. Soc. 1987, 109, 7245–7253
- Bertie et al. 1986 Bertie, J. E.; Michaelian, K. H.; Eysel, H. H.; Hager, D. The Raman-active O–H and O–D stretching vibrations and Raman spectra of gaseous formic acid and-OD. J. Chem. Phys. 1986, 85, 4779–4789
- Yokoyama et al. 1991 Yokoyama, I.; Miwa, Y.; Machida, K. Extended molecular mechanics calculations of thermodynamic quantities, structures, vibrational frequencies, and infrared absorption intensities of formic acid monomer and dimer. J. Am. Chem. Soc. 1991, 113, 6458–6464
- Maréchal 1987 Maréchal, Y. IR spectra of carboxylic acids in the gas phase: A quantitative reinvestigation. J. Chem. Phys. 1987, 87, 6344–6353
- Berckmans et al. 1988 Berckmans, D.; Figeys, H. P.; Marechal, Y.; Geerlings, P. Ab initio and LMO studies on the integrated intensities of infrared absorption bands of polyatomic molecules. 7. The formic acid dimer. Influence of hydrogen bonding and isotopic substitution. J. Phys. Chem. 1988, 92, 66–73
- Toulouse et al. 2016 Toulouse, J.; Assaraf, R.; Umrigar, C. J. Advances in Quantum Chemistry; Elsevier, 2016; Vol. 73; pp 285–314
- Suhm and Kollipost 2013 Suhm, M.; Kollipost, F. Femtosecond single-mole infrared spectroscopy of molecular clusters. Phys. Chem. Chem. Phys. 2013, 15, 10702–10721