High- slow light and its localization in a photonic crystal microring
Abstract
We introduce a photonic crystal ring cavity that resembles an internal gear and unites photonic crystal (PhC) and whispering gallery mode (WGM) concepts. This ‘microgear’ photonic crystal ring (MPhCR) is created by applying a periodic modulation to the inside boundary of a microring resonator to open a large bandgap, as in a PhC cavity, while maintaining the ring’s circularly symmetric outside boundary and high quality factor (), as in a WGM cavity. The MPhCR targets a specific WGM to open a large PhC bandgap up to tens of free spectral ranges, compressing the mode spectrum while maintaining the high-, angular momenta, and waveguide coupling properties of the WGM modes. In particular, near the dielectric band-edge, we observe modes whose group velocity is slowed down by 10 times relative to conventional microring modes while supporting . This is 50 that of the previous record in slow light devices. Using the slow light design as a starting point, we further demonstrate the ability to localize WGMs into photonic crystal defect (dPhC) modes for the first time, enabling a more than 10 reduction of mode volume compared to conventional WGMs while maintaining high- up to (5.60.1)105. Importantly, this additional dPhC localization is achievable without requiring detailed electromagnetic design. Moreover, controlling their frequencies and waveguide coupling is straightforward in the MPhCR, thanks to its WGM heritage. By using a PhC to strongly modify fundamental properties of WGMs, such as group velocity and localization, the MPhCR provides an exciting platform for a broad range of photonics applications, including sensing/metrology, nonlinear optics, and cavity quantum electrodynamics.
Chip-integrated optical micro-/nano-cavities have enabled numerous breakthroughs across the optical sciences Vahala_Nature_2003 . These devices spatio-temporally enhance light-matter interactions in platforms suitable for integration and deployment, and have been established as foundational elements in quantum optics Obrien_NatPhoton_2009 , nonlinear photonics Strekalov_JOpt_2016 , optomechanics Aspelmeyer_RevModPhys_2014 , and sensing Vollmer_Nanophotonics_2012 . The metric for spatial confinement is mode volume (), and the metric related to temporal enhancement is optical quality factor (). While there have been numerous cavity geometries studied, many of them fall into two categories: whispering gallery mode (WGM) cavities Matsko_JSTQE_2006 based on total internal reflection at the device periphery, and photonic crystal (PhC) cavities based on localizing defects in one-dimensional or two-dimensional photonic lattices Istrate_RevModPhys_2006 . In the former category, achieving many high- WGMs across a wide wavelength range Lu_NatPhoton_2019 is natural and requires no specific device geometry, as long as the device radius is sufficiently large and the device sidewall is smooth. In contrast, in PhC cavities, both multi-mode operation and high- resonance(s) require careful and specific design of a device geometry, whose pattern must be preserved with certain accuracy in nanofabrication. Another advantage of WGM cavities is the relative ease of waveguide coupling through evanescent interaction. These two advantages have established WGM cavities as a major platform for broadband nonlinear optics, including Kerr frequency combs, optical frequency conversion, and other nonlinear wave mixing effects Strekalov_JOpt_2016 . However, WGM cavities are unable to match the stronger spatial confinement provided by PhC defect cavities, whose s are typically 10 to 100 smaller Istrate_RevModPhys_2006 . PhC defect cavities can have sub-cubic-wavelength and are particularly suitable for single mode applications in cavity quantum electrodynamics Obrien_NatPhoton_2009 and cavity optomechanics Aspelmeyer_RevModPhys_2014 .
Given the individual strengths of WGM and PhC defect cavities, it is desirable to combine these two geometries into one to utilize the best aspects of both platforms. Indeed, this aspiration has been pursued in various cavity geometries (See Extended Data Table 1). For example, one investigated geometry creates polygonal ‘disk’ or ‘ring’ shape line defects in two-dimensional PhCs, that is, photonic crystal ‘disk/ring’ resonators (PCDRs/PCRRs) Smith_APL_2001 ; Kim_APL_2002 ; Zhang_OL_2014 . Further pioneering work in conventional ring resonators named photonic crystal rings (PhCRs) has been conducted Lee_OL_2012 , where etched air holes are introduced into a microring, with an emphasis on the generation of slow light modes Lee_OL_2012 ; Zhang_PTL_2015 ; Gao_SciRep_2016 ; KML_OE_2017 ; Lo_OL_2018 . In such PhCRs, although the group velocity of light has been slowed down to enhance light-matter interaction, s are significantly degraded compared to state-of-the-art microrings, which offsets the benefits of using slow light in the first place.
Other work has incorporated small-amplitude gratings to microring sidewalls to control the frequencies of selected cavity modes Lu_APL_2014 and has been used for single mode lasing Arbabi_OE_15 and spontaneous pulse formation Yu_NatPhoton_2021 , but without considering PhC-induced slow-light or localization effects. Similar grating concepts have also been applied to whispering gallery resonators in many different contexts, including the generation of orbital angular momentum beams Cai_Science_2012 and the exploration of parity-time concepts in microlasers Feng_Science_2014 , but in general such works have not focused on the achievement of high-Q or strong mode localization through defect incorporation.
In this work, we weave together aspects of WGM and PhC defect cavities in a novel way that retains the ease of realizing high- and straightforward waveguide coupling of the WGM cavities while maintaining the ability to strongly manipulate the propagation and confinement of light associated with the PhC defect cavities. Our device, a ‘microgear’ photonic crystal ring (MPhCR), is a microring cavity in which a judiciously chosen periodic modulation to its inside boundary (resembling the shape of an internal gear), opening a large bandgap at a targeted location in angular-momentum space. Within this platform we show slow-light modes with a high- of and a group velocity slowdown ratio () Krauss_JPhysD_2007 ; Lee_OL_2012 . We further show PhC defect modes based on localization of the slow-light mode at the band-edge. These localized defect modes have similarly high-s up to (5.60.1) and support intuitive frequency engineering and waveguide coupling like conventional WGMs. By marrying WGM and PhC concepts in a way that retains their respective advantages, the MPhCR is a breakthrough platform for microcavity physics and applications.
Introducing the MPhCR Design
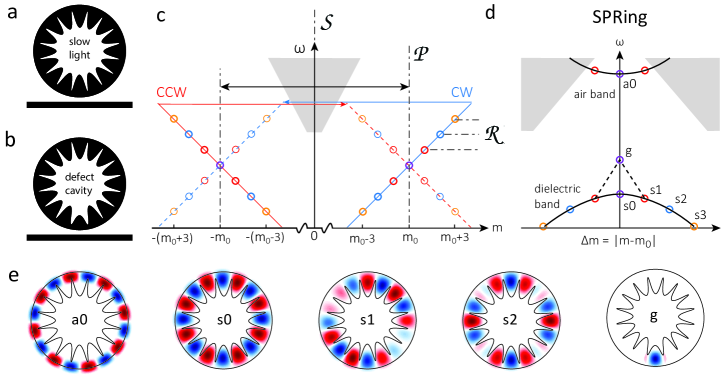
Schematic illustrations of the MPhCR are shown in Fig. 1(a,b), where (a) shows a slow light device and (b) shows a PhC defect (hereafter dPhC) device. Both devices have circular outside boundaries that are the same as a traditional microring that supports high- WGMs with discrete angular momentum (described by azimuthal mode number ) and frequency (). The slow light device has its inside boundary periodically modulated with a large amplitude, as shown in Fig. 1(a), which creates wide photonic band-gaps that support slow-light modes at and near the band-edges. The dPhC device is based on the slow light device design, with a localized defect incorporated in the periodic modulation (defect at center here, next to the couplling waveguide), as shown in Fig. 1(b).
A MPhCR device has three types of symmetry, as shown in Fig. 1(c). stands for mirror symmetry, that is, the symmetry of clockwise (CW) and counterclockwise (CCW) propagating light. represents the angular momentum shift created by the periodic (in the azimuthal direction) PhC modulation, which is a transition of modes from CCW to CW (red arrow), or from CW to CCW (blue arrow). represents the rotational symmetry due to the circular boundary condition, which leads to a quantized/integer angular momentum () and a discrete resonance frequency () for the WGMs.
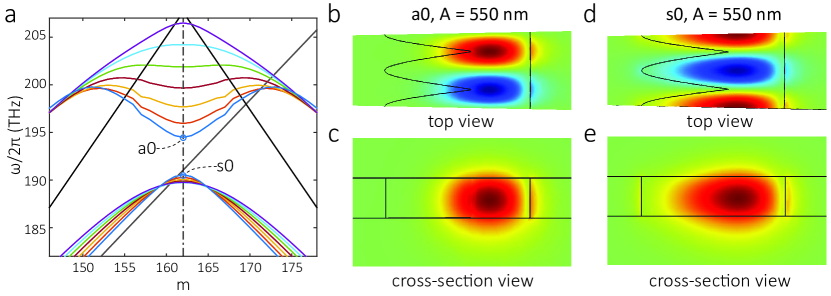
Applying a large inner sidewall modulation as shown in Fig. 1(a) results in a large photonic bandgap opening at in Fig. 1(d), where the PhC modulation period is / (i.e., 2 periods fit within the ring circumference). In the MPhCR, two propagating modes () are renormalized to two standing wave modes, labeled (the air band-edge mode) and (the dielectric band-edge mode), respectively. On either side of the band-edge, four modes with are hybridized to four new modes, two degenerate in the air band (), and two degenerate in the dielectric band (), where can be viewed as having the same spatial profile as with an additional cos() modulation applied ( is the azimuthal angle). The nature of is similar, except the mode profile is modulated by an additional cos() with respect to . We note that the frequency splitting induced by the PhC modulation in a MPhCR results in high-frequency air band modes that begin to impinge on the light cone (grey). Starting with a slow light device, a dPhC device can be made by local perturbation of the modulation amplitude. The dPhC mode () is a localization of mode and has a higher resonance frequency depending on the detailed parameters of the defect, as indicated by the dashed line in Fig. 1(d), while all other modes remain the same. Representative profiles for these optical modes are illustrated in a qualitative fashion in Fig. 1(e). For illustration purposes, here we show an azimuthal mode number = 8, which is 20 times smaller than what we use in real devices. Full numerical simulations of the modes of the real geometries are shown in Methods and Extended Data Figs. 1-2.
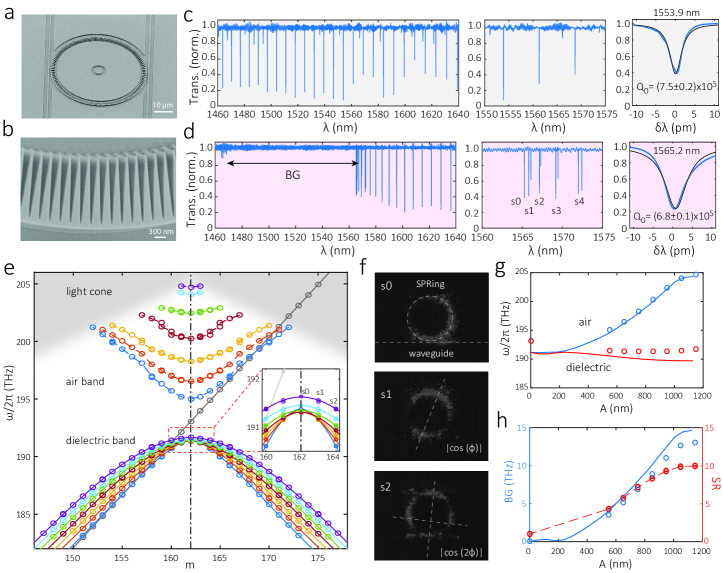
Scanning electron microscopy (SEM) images of fabricated MPhCRs in stoichiometric silicon nitride (Si3N4) are shown in Fig. 2(a,b), where Fig. 2(a) shows a ring radius of 25 m, a thickness of 500 nm, a nominal average ring width of 1250 nm, and a modulation amplitude of = 1150 nm. A zoom-in SEM image of a slow light MPhCR shows the details of the structure in Fig. 2(b), including the large that leaves the ring width at only 100 nm in the narrowest part, similar in shape to ‘alligator’ photonic crystals waveguides Yu_APL_2014 previously studied. The device is fully etched through the Si3N4 layer with a smooth modulation profile and sidewall. The modulation period (length of one cell) is 485 nm, corresponding to 1622 cells in the circumference. See Methods for fabrication details.
Slow light in the MPhCR
Light-matter interactions can be enhanced by increasing the time over which the interaction occurs. Typically this is done by increasing the photon storage time (i.e., improving ), for example, by using optical microcavities Vahala_Nature_2003 . Another approach is by decreasing the group velocity of light, that is, using slow light effects, for example, based on waveguide modes near photonic band-edges Krauss_JPhysD_2007 ; Baba_NatPhoton_2008 ; Arcari_PRL_2014 . While each approach has been extensively studied individually, there should be situations where they can work together, that is, slowing down the group velocity of light while maintaining high . We emphasize that, in the photonic crystal microring, the slowdown factor should be included in the already. In other words, the slow light devices might have higher optical s than the control device and provide additional benefits in applications. While there is evidence supporting the enhancement of by slow light in the regime Fujita_APL_2002 , all these works have values over two order of magnitude below the 106 values that are often achieved in conventional high- microcavities without using slow light, which offsets the benefits of using slow light effects. For example, = 2,000 and a slowdown ratio () of 4 were achieved in pioneering work on photonic crystal microrings Lee_OL_2012 . More recently, improved performance was reported Gao_SciRep_2016 with = 12,100 and = 8. See Extended Data Table 1 for details.
Our first objective in developing the MPhCR is to achieve slow-light modes with high-s comparable to WGMs. In comparison to previous geometries with air holes within microrings Lee_OL_2012 ; Gao_SciRep_2016 , the MPhCR seems favorable for reducing scattering loss. We confirm this through spectral measurements presented in Fig. 2, where and are extracted from linewidths and free spectral ranges (s), respectively (see Methods). In particular, as the is inversely proportional to the resonator mode group index, the reduction in relative to conventional microring modes is indicative of a corresponding increase in group index (and hence a decrease in group velocity). As in earlier works Lee_OL_2012 , we use as a figure of merit for both traveling wave and standing wave modes (both of which are commonly observed in conventional high- WGMs without slow light effects, i.e., = 1). For the latter, we are essentially considering the reduction in group velocity of the constituent counter-propagating traveling waves that make up the standing wave.
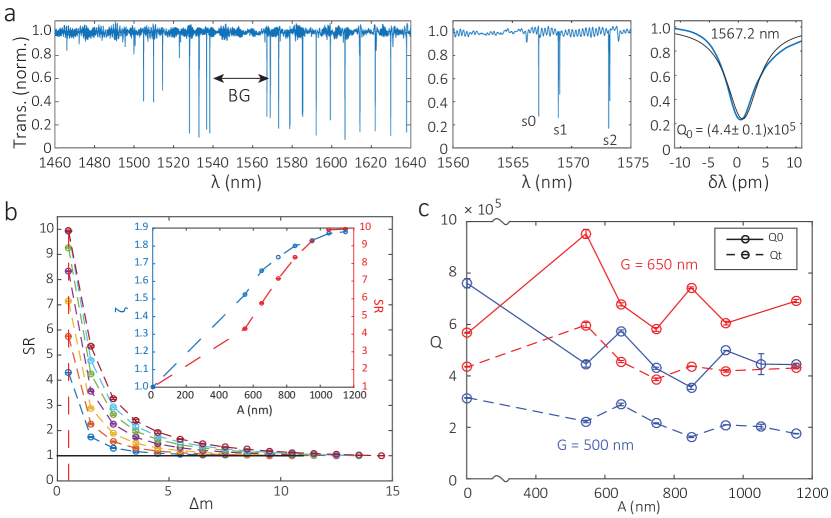
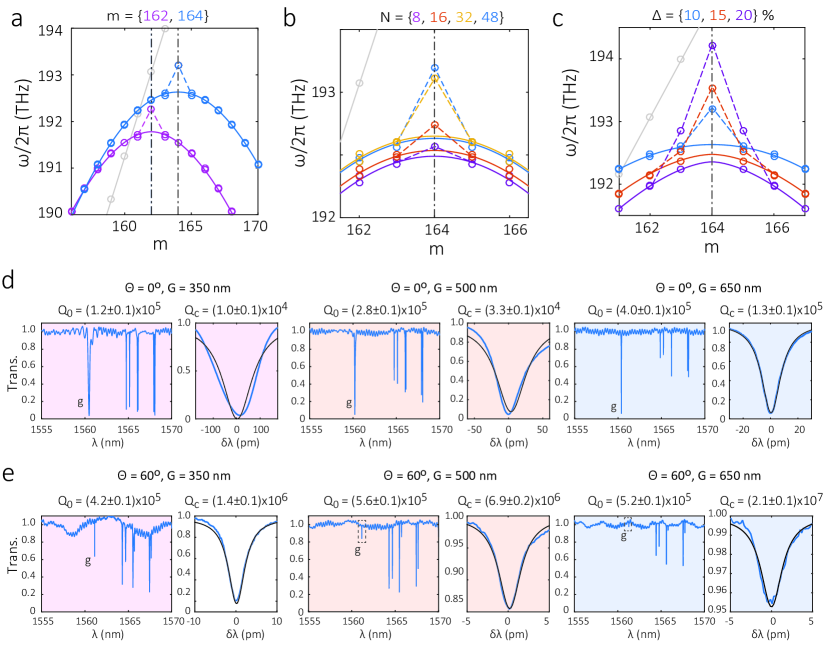
The conventional microring without modulation ( = 0 nm) exhibits WGMs (mostly singlet resonances) with nearly-uniform s ( 0.91 THz or 7.4 nm), as shown in Fig. 2(c). The intrinsic optical quality factor () is (7.50.2)105 (the right panel) for the mode at 1553.9 nm, whose azimuthal mode number ( = 162) is targeted for inner sidewall modulation (the uncertainty of comes from a nonlinear least squares fit of the transmission resonance; see Methods). When the modulation is very large, with = 1150 nm, as shown in Fig. 2(d), most air band modes are pushed into the light cone, leaving only three modes with low and poor waveguide coupling. The dielectric band is well-preserved with a compressed spectrum with a higher spectral density of modes near the band-edge. This device has = (6.8 105 for the mode. Infrared images of scattered light from 0, 1, 2 modes of Fig. 2(d) are shown in Fig. 2(f), and have azimuthal patterns that match those illustrated in Fig. 1(e).
We construct the band diagrams of eight devices (including the two discussed) in Fig. 2(e). When increases, the air bands are pushed towards the light cone, but the dielectric band-edge stays fixed within 1 THz. The measured band-edge frequencies agree well with numerical simulations, as shown in Fig. 2(f) (the full simulated band structure for these devices is shown in Extended Data Fig. 1). Figure 2(h) shows the measured bandgaps, , and s for the modes as a function of . increases with , and the device with the largest exhibits = 9.94 0.02 (the uncertainty of comes from estimating free spectral ranges with split modes, see Methods) with the aforementioned = (6.80.1) 105 for the 0 mode, which is 50 times higher than previous works Lee_OL_2012 ; KML_OE_2014 ; KML_OE_2017 ; Gao_SciRep_2016 . Extended Data Fig. 3(b) shows for all values of and all dielectric band modes near the band-edge, indicating how and also exhibit significant, but smaller values.
An important metric for slow light applications (e.g., interferometry Shi_JOSAB_2008 ) is , where is the group index and is the loss coefficient (directly proportional to ; see Methods). The mode in the =1150 nm device has = (171) cm (the uncertainty is propagated from that of ), which is a significant improvement in comparison to earlier works. Moreover, the optical can be further improved. For example, in Extended Data Fig. 4, we show a slow-light device with high- s0 mode of , with 10 and 28. Such high-, or equivalently , represents enhancement of previous record; see Extended Data Table 1 for comparison. The MPhCR is thus a promising platform for further investigation of slow light applications, including interferometry, telecommunications, and sensing Shi_JOSAB_2008 ; Shi_PRL_2007 ; Boyd_JMO_2009 ; Vollmer_Nanophotonics_2012 .
Defect modes in the MPhCR
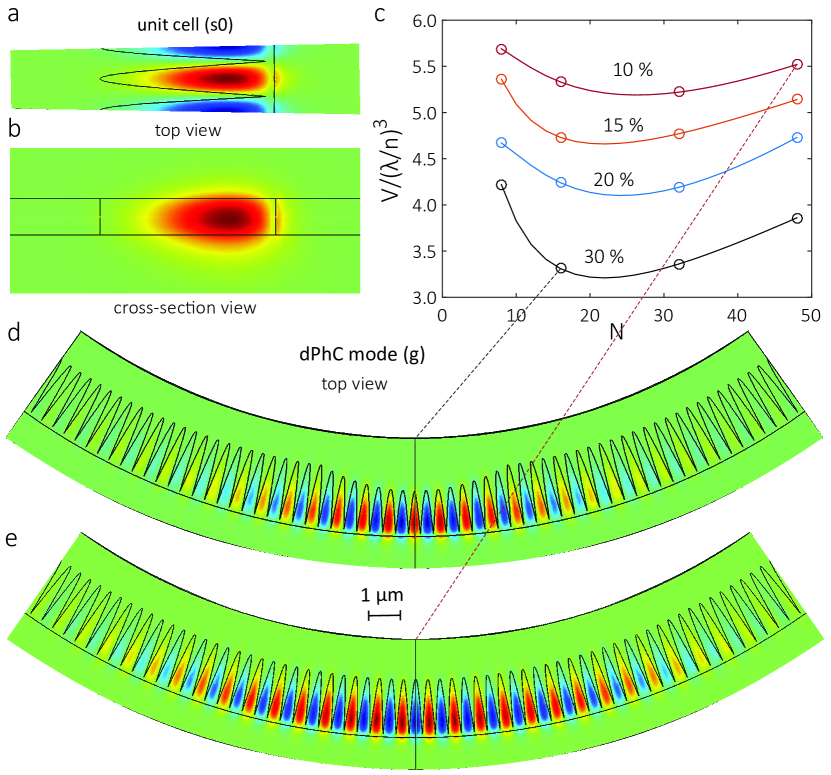
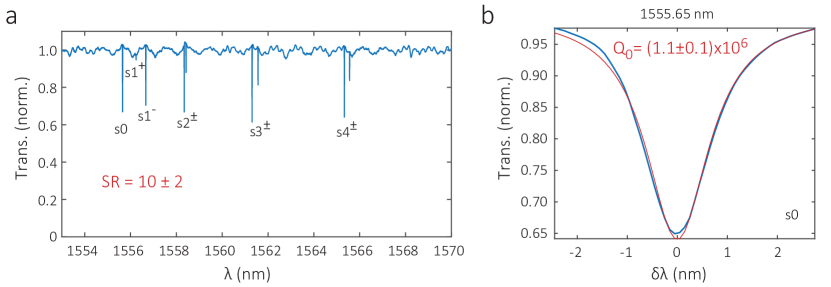
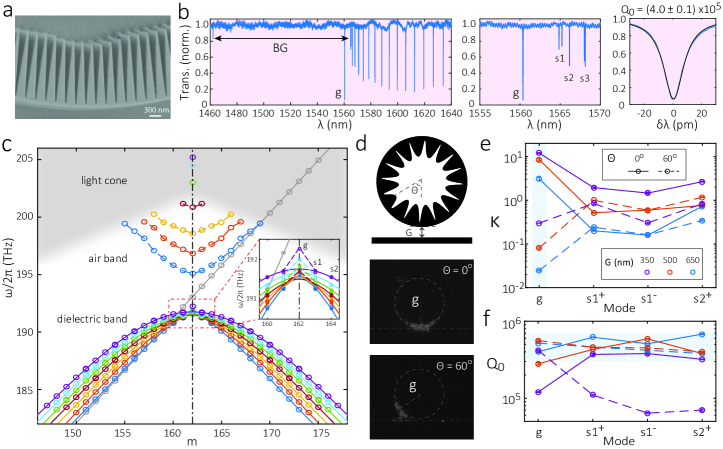
While is an important figure-of-merit for slow light application as discussed in the previous section, is the metric that is critical for cavity-enhanced light-matter interactions, including nonlinear and quantum optical processes (for example, Purcell enhancement). In a microring, this value can be optimized by reducing the radius of the microring while maintaining relatively low radiation/scattering loss, with bending loss ultimately limiting the smallest s achievable. In this section, we show how a localized PhC defect (dPhC) can be introduced into the slow light devices to further reduce the mode volume () and improve by 10 times with respect to our conventional microrings. For example, Fig. 3(a) is a zoom-in SEM image that shows how to derive a dPhC device from a slow light device such as that in Fig. 2(b). Here, a defect region is introduced in which the modulation amplitude is varied quadratically across eight cells (four on either side), with a maximum modulation depth deviation () of 10 % of at the defect center. This intuitive defect design induces a bound simple harmonic potential well that supports a ground state (g) dPhC mode. Figure 3(b) shows the transmission of a dPhC mode () created similarly to Fig. 3(a) but across 48 cells, with that is similar to that of the slow-light modes. The highest observed is (5.60.1); see Extended Data Fig. 5(e). The creation of high- dPhC modes through perturbation of the slow-light cavities is possible without specific detailed design, a heritage from the WGM side that stands in contrast to most dPhC cavities, where detailed numerical simulations are needed to optimize designs to support high- Vuckovic_PRE_2001 ; Srinivasan_OE_2002 ; Englund_OE_2005 ; Asano_JSTQE_2006 ; Quan_OE_2011 . By introducing defects to all eight slow-light designs in Fig. 2(e) in the aforementioned fashion, the defect band diagram in Fig. 3(c) is generated. A zoom-in on the dielectric band-edge (Fig. 3(d)) shows how the dominant change with respect to the band diagram for the unperturbed slow-light devices (Fig. 2(e)) is a shift of the mode into the band-gap to create , while the neighboring slow-light modes (e.g., ) are largely unperturbed. In Extended Data Fig. 5(a-c), we show the frequency control of by parameters other than , including , , and .
We have confirmed in simulation the existence of these experimentally observed modes, and also calculated their mode volumes. Extended Data Fig. 2 presents full numerical simulations of the dPhC mode profiles and resulting s, using the cavity QED definition for based on electric dipole coupling Vuckovic_PRE_2001 (see Methods). to 5.5 in dPhC modes, a reduction relative to the slow-light band-edge modes, and as expected, the amount of localization is dependent on the specific characteristics of the potential. We anticipate that numerical optimization, and incorporation of basic methods to increase modal confinement, such as a lower air cladding or slot-mode architectures, can further reduce in this platform, while values are likely possible in higher index platforms such as silicon-on-insulator.
Applications exploiting enhanced light-matter interactions in optical microcavities also require effective waveguide input/output coupling. We next consider the ability to couple to dPhC modes in a controlled fashion, an attribute passed to the MPhCR from its WGM heritage. In Fig. 3(d), we illustrate two parameters that control the evanescent coupling between a MPhCR and a waveguide, namely the defect angle () and the waveguide-ring gap (). We also show two infrared images of the scattered light from a defect-rotated ( = 60o) and defect-centered ( = 0o) device. The measured coupling ratio , for both of the dPhC mode () and the slow-light modes , is plotted in Fig. 3(e) for six cases – three s and two s. It is clear that the coupling to is very different than that to , because of its localization. In the rotated case, has a weaker coupling ( 1/10 in ) than . In contrast, in the centered case, has a stronger coupling than ( 10 in ). For a MPhCR with = 350 nm, can reach (see Extended Data Fig. 5), and even stronger coupling could be realized by using smaller , optimized waveguide width, and pulley coupling Li_NatPhoton_2016 ; Greg_OL_2019 .
As shown in Fig. 3(e), values for dPhC modes are similar to the slow light modes in the under-coupled cases, and lie in a range of to (shaded area). We note that these slow light modes and dPhC modes have s similar to WGMs in the control devices (within a factor of 2), illustrating how in the MPhCR, slow-light effects and strong modal confinement can be effectively realized in a WGM platform.
Finally, we note that the dPhC mode on its own does not require a full microring to exist, unlike the slow light modes and conventional WGMs. However, retaining the full microring structure enables the co-existence of the dPhC mode with these other modes, which will be essential for nonlinear optics and other multi-mode applications. We also note that the continuous transition of the dPhC mode to the band-edge slow light modes seems to be related to bound-state-in-continuum phenomena.
Discussion We have demonstrated a new microcavity platform for combining some of the most important aspects of WGM and PhC cavities. In essence, our MPhCR design controllably modifies fundamental characteristics of targeted microring WGMs, such as their group velocity and localization length scale, while maintaining their high- and straightforward waveguide coupling. The design of MPhCR geometries is highly intuitive, with the devices we have shown not requiring any detailed numerical modeling to achieve high-, large , or strong mode localization (numerical modeling was used simply to verify device performance). Going forward, the coexistence of slow light, dPhC and conventional WGM modes is promising for nonlinear optics, for example, optical parametric oscillation Lu_Optica_2019 ; Marty_NatPhoton_2021 ; moreover, incorporating multiple photonic bandgap frequencies within a single device is feasible, similar to the ability to selectively introduce backscattering for multiple WGMs Lu_PRJ_2020 . Another effort could be in focusing on the performance of air band modes to, for example, develop devices for coupling to neutral atoms Yu_APL_2014 ; Douglas_NatPhoton_2015 . As discussed in a recent review ji_methods_2021 , while silicon nitride is generally considered as an especially high- platform in integrated photonics, the achieved is a strong function of the amount of modal confinement within the waveguiding layer, which is determined by the waveguide cross-section size and the cladding layer refractive indices. In a moderate-confinement silicon nitride microring, state-of-the-art s are in the 106 range; in high-confinement and low-confinement silicon nitride microrings, state-of-the-art s are much higher, in the 107 and 108 range, respectively. While we demonstrate the MPhCR in a moderate-confinement silicon nitride microring in this work, it is of interest to implement the MPhCR in high-confinement and low-confinement silicon nitride microrings for both higher s and also additional applications such as ultra-narrow-band filters, delay lines, and stimulated Brillouin scattering. Finally, the development of the MPhCR in other platforms, such as silicon carbide Lukin_NatPhoton_2019 and gallium arsenide lodahl_interfacing_2015 could lead to new opportunities to control and exploit strong interactions between confined optical fields and single quantum emitters.
References
- (1) K. J. Vahala, “Optical microcavities,” Nature 424, 839–846 (2003).
- (2) J. L. O’Brien, A. Furusawa, and J. Vučković, “Photonic quantum technologies,” Nat. Photon. 3, 687–695 (2009).
- (3) D. V. Strekalov, C. Marquardt, A. B. Matsko, H. G. L. Schwefel, and G. Leuchs, “Nonlinear and quantum optics with whispering gallery resonators,” J. Opt. 18, 123002 (2016).
- (4) M. Aspelmeyer, T. J. Kippenberg, and F. Marquardt, “Cavity optomechanics,” Rev. Mod. Phys. 86, 1391–1452 (2014).
- (5) F. Vollmer and L. Yang, “Review Label-free detection with high-Q microcavities: a review of biosensing mechanisms for integrated devices,” Nanophotonics 1, 267–291 (2012).
- (6) A. B. Matsko and V. S. Ilchenko, “Optical resonators with whispering gallery modes I: Basics,” IEEE J. Sel. Top. Quantum Electron. 12, 3–14 (2006).
- (7) E. Istrate and E. H. Sargent, “Photonic crystal heterostructures and interfaces,” Rev. Mod. Phys. 78, 455–481 (2006).
- (8) X. Lu, G. Moille, Q. Li, D. A. Westly, A. Rao, S.-P. Yu, T. C. Briles, S. B. Papp, and K. Srinivasan, “Efficient telecom-to-visible spectral translation using silicon nanophotonics,” Nat. Photon. 13, 593–601 (2019).
- (9) C. J. Smith, R. M. De La Rue, M. Rattier, S. Olivier, H. Benisty, C. Weisbuch, T. F. Krauss, R. Houdré, and U. Oesterle, “Coupled guide and cavity in a two-dimensional photonic crystal,” Appl. Phys. Lett. 78, 1487–1489 (2001).
- (10) S. H. Kim, H. Y. Ryu, H. G. Park, G. H. Kim, Y. S. Choi, Y. H. Lee, and J. S. Kim, “Two-dimensional photonic crystal hexagonal waveguide ring laser,” Appl. Phys. Lett. 81, 2499–2501 (2002).
- (11) Y. Zhang, C. Zeng, D. Li, G. Gao, Z. Huang, J. Yu, and J. Xia, “High-quality-factor photonic crystal ring resonator,” Opt. Lett. 39, 1282–1285 (2014).
- (12) J. Y. Lee and P. M. Fauchet, “Slow-light dispersion in periodically patterned silicon microring resonators,” Opt. Lett. 37, 58–60 (2012).
- (13) Y. Zhang, X. Qiu, C. Zeng, D. Li, G. Gao, Y. Wang, J. Yu, and J. Xia, “Slow-Light Dispersion in One-Dimensional Photonic Crystal Racetrack Ring Resonator,” IEEE Photon. Tech. Lett. 27, 1120–1123 (2015).
- (14) G. Gao, Y. Zhang, H. Zhang, Y. Wang, Q. Huang, and J. Xia, “Air-mode photonic crystal ring resonator on silicon-on-insulator,” Sci. Rep. 6, 1–6 (2016).
- (15) K. McGarvey-Lechable, T. Hamidfar, D. Patel, L. Xu, D. V. Plant, and P. Bianucci, “Slow light in mass-produced, dispersion-engineered photonic crystal ring resonators,” Opt. Express 25, 3916–3926 (2017).
- (16) S. M. Lo, J. Y. Lee, S. M. Weiss, and P. M. Fauchet, “Bloch mode selection in silicon photonic crystal microring resonators,” Opt. Lett. 43, 2957–2960 (2018).
- (17) X. Lu, S. Rogers, W. C. Jiang, and Q. Lin, “Selective engineering of cavity resonance for frequency matching in optical parametric processes,” Appl. Phys. Lett. 105, 151104 (2014).
- (18) A. Arbabi, S. M. Kamali, E. Arbabi, B. G. Griffin, and L. L. Goddard, “Grating integrated single mode microring laser,” Opt. Express 23, 5335–5347 (2015).
- (19) S. P. Yu, D. C. Cole, H. Jung, G. T. Moille, K. Srinivasan, and S. B. Papp, “Spontaneous pulse formation in edgeless photonic crystal resonators,” Nat. Photon. 15, 461–467 (2021).
- (20) X. Cai, J. Wang, M. J. Strain, B. Johnson-Morris, J. Zhu, M. Sorel, J. L. O’Brien, M. G. Thompson, and S. Yu, “Integrated compact optical vortex beam emitters,” Science 338, 363–366 (2012).
- (21) L. Feng, Z. J. Wong, R.-M. Ma, Y. Wang, and X. Zhang, “Single-mode laser by parity-time symmetry breaking,” Science 346, 972–975 (2014).
- (22) T. F. Krauss, “Slow light in photonic crystal waveguides,” J. Phys. D: Appl. Phys. 40, 2666–2670 (2007).
- (23) S. P. Yu, J. D. Hood, J. A. Muniz, M. J. Martin, R. Norte, C. L. Hung, S. M. Meenehan, J. D. Cohen, O. Painter, and H. J. Kimble, “Nanowire photonic crystal waveguides for single-atom trapping and strong light-matter interactions,” Appl. Phys. Lett. 104, 111103 (2014).
- (24) T. Baba, “Slow light in photonic crystals,” Nat. Photon 2, 465–473 (2008).
- (25) M. Arcari, I. Söllner, A. Javadi, S. Lindskov Hansen, S. Mahmoodian, J. Liu, H. Thyrrestrup, E. H. Lee, J. D. Song, S. Stobbe, and P. Lodahl, “Near-unity coupling efficiency of a quantum emitter to a photonic crystal Waveguide,” Phys. Rev. Lett. 113, 1–5 (2014).
- (26) M. Fujita and T. Baba, “Microgear laser,” Appl. Phys. Lett. 80, 2051–2053 (2002).
- (27) K. McGarvey-Lechable and P. Bianucci, “Maximizing slow-light enhancement in one-dimensional photonic crystal ring resonators,” Opt. Express 22, 26032–26041 (2014).
- (28) Z. Shi and R. W. Boyd, “Slow-light interferometry: practical limitations to spectroscopic performance,” J. Opt. Soc. Am. B 25, C136–C143 (2008).
- (29) Z. Shi, R. W. Boyd, R. M. Camacho, P. K. Vudyasetu, and J. C. Howell, “Slow-light fourier transform interferometer,” Phys. Rev. Lett. 99, 240801 (2007).
- (30) R. W. Boyd, “Slow and fast light: fundamentals and applications,” J. Mod. Opt. 56, 1908–1915 (2009).
- (31) J. Vučković, M. Lončar, H. Mabuchi, and A. Scherer, “Design of photonic crystal microcavities for cavity QED,” Phys. Rev. E 65, 016608 (2001).
- (32) K. Srinivasan and O. Painter, “Momentum space design of high-Q photonic crystal optical cavities,” Opt. Express 10, 670–684 (2002).
- (33) D. Englund, I. Fushman, and J. Vučković, “General recipe for designing photonic crystal cavities,” Opt. Express 13, 5961–5975 (2005).
- (34) T. Asano, B.-S. Song, Y. Akahane, and S. Noda, “Ultrahigh-$Q$ Nanocavities in Two-Dimensional Photonic Crystal Slabs,” IEEE J. Sel. Top. Quantum Electron. 12, 1123–1134 (2006).
- (35) Q. Quan and M. Loncar, “Deterministic design of wavelength scale, ultra-high Q photonic crystal nanobeam cavities,” Opt. Express 19, 18529–18542 (2011).
- (36) Q. Li, M. Davanço, and K. Srinivasan, “Efficient and low-noise single-photon-level frequency conversion interfaces using silicon nanophotonics,” Nat. Photon. 10, 406–414 (2016).
- (37) G. Moille, Q. Li, T. C. Briles, S.-P. Yu, T. Drake, X. Lu, A. Rao, D. Westly, S. B. Papp, and K. Srinivasan, “Broadband resonator-waveguide coupling for efficient extraction of octave-spanning microcombs,” Opt. Lett. 44, 4737–4740 (2019).
- (38) X. Lu, G. Moille, A. Singh, Q. Li, D. A. Westly, A. Rao, S.-P. Yu, T. C. Briles, S. B. Papp, and K. Srinivasan, “Milliwatt-threshold visible–telecom optical parametric oscillation using silicon nanophotonics,” Optica 6, 1535–1541 (2019).
- (39) G. Marty, S. Combrié, F. Raineri, and A. De Rossi, “Photonic crystal optical parametric oscillator,” Nat. Photon. 15, 53–58 (2021).
- (40) X. Lu, A. Rao, G. Moille, D. A. Westly, and K. Srinivasan, “Universal frequency engineering for microcavity nonlinear optics: multiple selective mode splitting of whispering-gallery resonances,” Photon. Res. 8, 1676–1686 (2020).
- (41) J. S. Douglas, H. Habibian, C. L. Hung, A. V. Gorshkov, H. J. Kimble, and D. E. Chang, “Quantum many-body models with cold atoms coupled to photonic crystals,” Nat. Photon. 9, 326–331 (2015).
- (42) X. Ji, S. Roberts, M. Corato-Zanarella, and M. Lipson, “Methods to achieve ultra-high quality factor silicon nitride resonators,” APL Photon. 6, 071101 (2021).
- (43) D. M. Lukin, C. Dory, M. A. Guidry, K. Y. Yang, S. D. Mishra, R. Trivedi, M. Radulaski, S. Sun, D. Vercruysse, G. H. Ahn, and J. Vuc̆ković, “4H-silicon-carbide-on-insulator for integrated quantum and nonlinear photonics,” Nat. Photon. 14, 330–334 (2020).
- (44) P. Lodahl, S. Mahmoodian, and S. Stobbe, “Interfacing single photons and single quantum dots with photonic nanostructures,” Rev. Mod. Phys. 87, 347–400 (2015).
- (45) S. G. Johnson and J. D. Joannopoulos, “Block-iterative frequency-domain methods for maxwell’s equations in a planewave basis,” Opt. Express 8, 173–190 (2001).
- (46) K. C. Balram, D. A. Westly, M. I. Davanco, K. E. Grutter, Q. Li, T. Michels, C. H. Ray, R. J. Kasica, C. B. Wallin, I. J. Gilbert, B. A. Bryce, G. Simelgor, J. Topolancik, N. Lobontiu, Y. Liu, P. Neuzil, V. Svatos, K. A. Dill, N. A. Bertrand, M. Metzler, G. Lopez, D. Czaplewski, L. Ocola, K. A. Srinivasan, S. M. Stavis, V. A. Aksyuk, J. A. Liddle, S. Krylov, and B. R. Ilic, “The nanolithography toolbox,” J. Res. NIST 121, 464–475 (2016).
- (47) Y. Xu, Y. Li, R. K. Lee, and A. Yariv, “Scattering-theory analysis of waveguide-resonator coupling,” Phys. Rev. E 62, 30–33 (2000).
- (48) F. O. Afzal, S. I. Halimi, and S. M. Weiss, “Efficient side-coupling to photonic crystal nanobeam cavities via state-space overlap,” J. Opt. Soc. Am. B 36, 585–595 (2019).
- (49) T. J. Kippenberg, S. M. Spillane, and K. J. Vahala, “Modal coupling in traveling-wave resonators,” Opt. Lett. 27, 1669–1671 (2002).
- (50) S. Hughes, L. Ramunno, J. F. Young, and J. E. Sipe, “Extrinsic optical scattering loss in photonic crystal waveguides: Role of fabrication disorder and photon group velocity,” Phys. Rev. Lett. 94, 033903 (2005).
Methods
Simulation of MPhCR devices
The inner sidewall modulation is given by the function:
| (1) |
where = 25 m, = 1250 nm, is the modulation amplitude (), is the azimuthal angle, and = 162 or 164 is the targeted azimuthal mode number to open the bandgap.
Simulated band diagrams in Extended Data Fig. 1(a) are obtained with MIT Photonic Bands (MPB) Johnson_OE_2001 . The structure in simulation is a rectangular unit cell with equivalent sidewall contours of the MPhCR, with periodic boundary condition imposed KML_OE_2014 . Neglecting the bending effect in this simulation is an acceptable approximation because the microrings we use have a sufficiently large radius. All simulations use refractive indices of 1.98 and 1.44 for the Si3N4 core and the SiO2 substrate, respectively. Simulated band-edges/gaps in Fig. 2(g,h) are extracted from Extended Data Fig. 1(a).
To consider the microring bending effect and estimate the effective mode volume of the dPhC modes, we set up a 3D finite-element-method (FEM) simulation. For example, as shown in Extended Data Fig. 1(b,c) we simulate a unit cell with boundary conditions of perfect magnetic/electric conductors for the azimuthal-cutting planes () for 0/0 modes, respectively, and scattering conditions for other boundaries. In Extended Data Fig. 2(c-e), we simulate half of a photonic crystal defect structure, with the boundary condition of the plane containing the defect center to be perfect magnetic conductor for the mode (localization of 0), and scattering conditions for the other boundaries. The mode profiles are unfolded in Extended Data Fig. 2(d,e) for viewing. The mode volumes in Extended Data Fig. 1 and 2 are calculated according to the definition used in cavity QED in the context of coupling between the cavity mode and an embedded electric dipole, and is given by:
| (2) |
where and are the electric field and electric displacement field, respectively, and the volume integral is taken over the whole space. The confinement factors are estimated by the energy integrated in the Si3N4 core divided by that over the whole space:
| (3) |
Device fabrication
The device layout was implemented through use of the Nanolithography Toolbox, a free software package developed by the National Institute of Standards and Technology Center for Nanoscale Science and Technology Balram_JResNIST_2016 . The device layer was grown by low-pressure chemical vapor deposition on top of a nominal 3 m thick layer, grown via thermal wet oxidation of Si, on a 100 mm diameter Si wafer. The wavelength-dependent refractive index and layer thicknesses were measured using a spectroscopic ellipsometer, with the data fit to an extended Sellmeier model. The device patterns are created in positive-tone resist by a 100 keV electron-beam lithography system, and then transferred to by reactive ion etching using a chemistry. The devices are then chemically cleaned in multiple steps to remove deposited polymer and remnant resist. An SiO2 lift-off process based on photolithography and plasma-enhanced chemical vapor deposition with an inductivel-coupled plasma source is performed so that the resonators have a top air cladding while the input/output edge-coupler waveguides have a top cladding to create more symmetric modes for coupling to optical fibres. The facets of the chip are then polished for lensed-fibre coupling. After being polished, the chip is annealed again at 1000 in a environment for 4 hours.
Quality factor estimation for MPhCR devices
Whispering gallery modes in high- microring cavities are typically travelling waves, with a transmission at the resonance center is given by:
| (4) |
where is the coupling ratio in Fig. 3(e). Therefore when (critically coupled), ; when (strongly undercoupled) or (strongly overcoupled), .
The slow light modes and dPhC modes in MPhCR devices are standing-wave modes instead of propagating modes, and due to their clockwise and counterclockwise components, couple to both the forward and backward direction of the waveguide. Therefore, the fitting of these modes needs to be modified with an additional coupling channel. Such side-coupled standing wave cavities have been considered in numerous contexts, including PhC defect cavities Xu_PRE_2000 ; Afzal_JOSAB_2019 and WGM cavities in the limit of strong surface-roughness-induced backscattering kippenberg_modal_2002 . The transmission at the resonance center is given by:
| (5) |
where and denote coupling quality factors to the forward and backward direction, respectively. When this coupling is symmetric, that is, , the equation is reduced to:
| (6) |
In the above equation, we keep the same definition of as in the traveling wave case, which means that when , for the standing-wave modes (including slow light modes and dPhC modes), in sharp contrast to for traveling-wave modes (such as conventional whispering gallery modes) with single waveguide coupling. See Extended Data Fig. 5 for experimental results.
‘Hyperbolic’ parameter () in band diagram fits
The calculated s are closely related to , the ‘hyperbolic’ index in band diagram fitting, given by , where is the dielectric band frequency as a function of azimuthal mode number , is a known parameter from the modulation pattern, and , , and are parameters to fit. is the “asymptotic” center frequency of the hyperbolic curve. / is the frequency separation between the mode () at the dielectric band-edge and . describes the curvature of the dielectric band, which is closely related to . Naturally, = 1 when there is no (or a very small) bandgap opened, while 2 is the apparent limit of our design, in keeping the dielectric band-edge fixed and pushing the air band-edges to the light cone and reducing its curvature to be flat ( = 0).
Slowdown ratio ()
The slowdown ratio presented in the main text is calculated from the cavity free spectral ranges (s) Lee_OL_2012 , and is normalized to the that is furthest from the band-edge, as shown in Extended Data Fig. 3(a). Typically there are two standing-wave modes in each mode set, that is 1±, 2±, etc., whereas 0 is always a singlet standing-wave mode. The assignment of for standing wave modes is essentially an estimate of the for their constituent traveling waves. We use the average values of the frequencies of the split modes for calculation of . These average frequencies represent the spectral locations of the constituent traveling wave modes prior to backscattering-induced modal coupling, which forms the split standing wave modes. The mode splitting is therefore used to estimate the uncertainty of (the error bars in Fig. 2(h)). The values are underestimated for , as they use the wider adjacent to the mode, which represents the of a frequency in between that of 0 and 1 ( = 0.5) instead of that of 0 ( = 0). Therefore, the maximum measured = 9.9 is a lower-bound estimate for what is achievable in MPhCRs, as a method to extract a more accurate value of beyond what the analysis can yield requires further investigation.
Metric for high- slow light ()
As mentioned in the main text, an important metric for high- slow light is , due to its relevance for practical applications of slow light. For example, in slow light interferometry, it is important not only that the light is propagating more slowly (i.e., smaller , where is speed of light in vacuum), but also that the light can propagate through sufficient length, in other words, the loss per unit length () needs to be small. Although our high- slow light devices at present cannot be directly used in slow light interferometry, for a guidance of future study within the context of slow light applications, we give the following estimate of :
| (7) |
In the device presented in Fig. 2(d), we have = (0.17 0.01) m, where the uncertainty is a one standard deviation value originating from the nonlinear least squares fit of the transmission data to extract . We can see that is directly proportional to , and that our work seems to suggest a 10 increase of at the band edge for current devices, as we have an increase of 10 with similar . Going forward, it will be important to investigate whether we can further decrease the loss at the band edge, or our work is already approaching the theoretical limit of scattering for slow light Hughes_PRL_2005 .
Data availability The data that supports the plots within this paper and other findings of this study are available from the corresponding authors upon reasonable request.
Acknowledgements This work is supported by the DARPA SAVaNT and NIST-on-a-chip programs. X.L. acknowledges support under the Cooperative Research Agreement between the University of Maryland and NIST-PML, Award no. 70NANB10H193. The authors thank Zhimin Shi and Vladimir Aksyuk for helpful discussions.
Author contributions X.L. led the design, fabrication, and measurement of the MPhCR devices. A.M. led the simulation with the help from X.L., and all authors participated in analysis and discussion of results. X.L. and K.S. wrote the manuscript with assistance from A.M., and K.S. supervised the project.
| device | year | core material | geometry | RRRWRH (m) | (nm) | (cm) | ||
| MPhCR | 2021 | Si3N4 | modulated microring | 25(0.1-2.3)0.5 | 1556 | 1.1 | 8-12 | 28 |
| PhCR Lee_OL_2012 | 2012 | Si | holes in microring | 7.20.450.22 | 1508 | 4-5 | 0.05 | |
| PhCR Zhang_PTL_2015 | 2015 | Si | holdes in racetrack ring | 60.420.22 | 1554 | 11 | 0.2 | |
| PhCR Gao_SciRep_2016 | 2016 | Si | holes in microring | 200.680.22 | 1558 | 8 | 0.3 | |
| PhCR KML_OE_2017 | 2017 | Si | holes in microring | 200.450.22 | 1550 | 7 | 0.6 | |
| PhCR Lo_OL_2018 | 2018 | Si | holes in microring | 7.20.450.22 | 1520 | 4 | ||
| PCDR Smith_APL_2001 | 2001 | GaAs | hexagonal ‘disk’ in 2D PhC | 1000 | - | 0.02 | ||
| PCRR Kim_APL_2002 | 2002 | InGaAsP | hexagonal ‘ring’ in 2D PhC | 410.2 | 1625 | - | 0.05 | |
| PCRR Zhang_OL_2014 | 2014 | Si | hexagon ‘ring’ in 2D PhC | 310.22 | 1554 | - | 1.9 |