Stereo Video Reconstruction Without Explicit Depth Maps for Endoscopic Surgery
Abstract
We introduce the task of stereo video reconstruction or, equivalently, 2D-to-3D video conversion for minimally invasive surgical video. We design and implement a series of end-to-end U-Net–based solutions for this task by varying the input (single frame vs. multiple consecutive frames), loss function (MSE, MAE, or perceptual losses), and network architecture. We evaluate these solutions by surveying ten experts – surgeons who routinely perform endoscopic surgery. We run two separate reader studies: one evaluating individual frames and the other evaluating fully reconstructed 3D video played on a VR headset. In the first reader study, a variant of the U-Net that takes as input multiple consecutive video frames and outputs the missing view performs best. We draw two conclusions from this outcome. First, motion information coming from multiple past frames is crucial in recreating stereo vision. Second, the proposed U-Net variant can indeed exploit such motion information for solving this task. The result from the second study further confirms the effectiveness of the proposed U-Net variant. The surgeons reported that they could successfully perceive depth from the reconstructed 3D video clips. They also expressed a clear preference for the reconstructed 3D video over the original 2D video. These two reader studies strongly support the usefulness of the proposed task of stereo reconstruction for minimally invasive surgical video and indicate that deep learning is a promising approach to this task. Finally, we identify two automatic metrics, LPIPS and DISTS, that are strongly correlated with expert judgement and that could serve as proxies for the latter in future studies.
keywords:
deep learning, U-Net, endoscopy, stereo reconstruction1 Introduction
fig:stereo
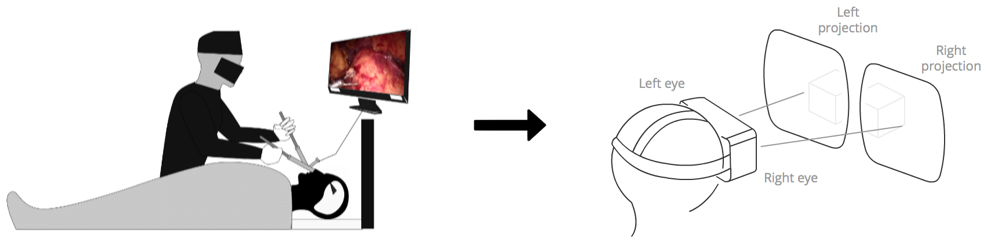
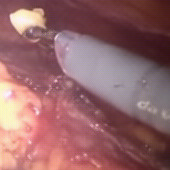
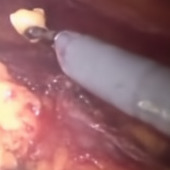
The development and use of endoscopes for minimally invasive surgery was one of the major surgical innovations of the 20th century (Li et al., 2005). An endoscope is a thin, tubular instrument with an attached camera. During surgery, an endoscope is inserted through a small incision or natural orifice so that a surgeon is able to view the internal area and operate on it by way of tiny surgical instruments (see \figurereffig:stereo). This obviates the need for large incisions, reducing patient healing time and the risk of post-operative infection. Technological advances in optics, illumination, and miniaturization over the past hundred years have expanded the reach of endoscopy, which has in turn revolutionized surgery (Berci and Forde, 2000).
A major drawback of early endoscopy was the lack of depth perception arising from 2D vision. Although many surgeries can safely be performed using a 2D endoscope, it is more challenging to operate around critical and highly complex physiological structures in this setting. For example, it is difficult for a surgeon to judge distances between a brain tumor and the surrounding nerves and tissue without depth perception.
Such difficulty is naturally resolved with 3D stereo imaging. Furthermore, 3D stereo endoscopes have a shallower learning curve and can help novice surgeons take advantage of minimally invasive techniques (Koc et al., 2006). While modern 3D stereo endoscopes exist, they cannot be miniaturized to the same degree as 2D endoscopes (4mm vs 2.7mm in diameter for the smallest in each class). They also suffer from a smaller field of view (Gompel et al., 2014), rendering them infeasible for some types of surgeries.
In this paper, we frame the task of automatically converting 2D endoscopic video to a 3D format as stereo video reconstruction. 3D content is typically stored in stereo format: i.e., two perspectives of the same scene. When viewed together, the disparity between the two perspectives simulates natural binocular vision, resulting in a 3D experience (Xie et al., 2016). In the absence of a 3D stereo endoscope with two cameras, one can generate an alternate view of the existing 2D input, which, when combined with the original view, forms a stereo pair. The result can be viewed using 3D glasses or a head-mounted VR display (see \figurereffig:stereo), effectively recreating 3D depth perception for the operating surgeon.
We propose a deep neural network (DNN) as a solution to this task. In our approach, a DNN is trained to reconstruct an alternative perspective of the current frame using the information available in past video frames. This is necessary, as we will demonstrate empirically, since creating an alternative perspective from a single view is a highly under-constrained problem. Past frames may contain information about occluded regions in the current view and may capture more accurate depth information.
We run a series of experiments with DNNs to determine whether multiple past frames improve 3D stereo reconstruction and to identify an optimal network architecture and optimal learning parameters. We conduct an extensive and rigorous evaluation of these DNN variants through two sets of reader studies involving experienced surgeons. Our reader studies confirm that DNNs designed to leverage temporal information from past frames result in superior stereo reconstruction when compared to a single-frame approach. We also test a diverse set of automated metrics and correlate them against the outcome of these reader studies. We identify two perceptual metrics, DISTS (Ding et al., 2020) and LPIPS (Zhang et al., 2018), that correlate strongly with expert judgement.
The task and the approach presented in this paper are not restricted to endoscopic video but rather generally applicable to any video content. We find this particular use case interesting and technically meaningful because factors such as sharpness, hallucinations, and accurate depth perception are more salient here than in many other applications. We anticipate, however, that the findings from this work will be applicable and transferable to other similar use cases in the future.
2 Related Work
Here, we review related prior work in 2D-to-3D reconstruction, applications in endoscopy, and evaluation metrics for the task.
2.1 2D-to-3D Reconstruction
Traditional 2D-to-3D reconstruction methods often consist of two stages. First, a depth map is constructed from the 2D input; then, a depth image-based rendering (DIBR) algorithm combines the depth map with the input view to generate the missing view of the stereo pair (Fehn, 2004). Depth maps can be constructed using various techniques, among them manual construction by artists, structure-from-motion (SfM) approaches, and, more recently, machine learning algorithms (Li et al., 2006; Han and Kanade, 2002; Ummenhofer et al., 2016).
Monocular (i.e., 2D) depth estimation is itself a difficult task. Recent trends in deep learning have shifted toward training end-to-end differentiable systems, allowing explicit depth estimation to be bypassed. Accordingly, our proposed model only requires stereo pairs for training and learns to directly predict the right view from the left view. This is similar to Deep3D (Xie et al., 2016), a stereo reconstruction model trained without supervisory ground-truth depth maps. Deep3D uses a single RGB frame as input, but the authors suggest incorporating temporal information from multiple frames as a promising direction for future research. In our work, we find that using multiple frames as input to our model achieves superior quantitative and qualitative performance when compared to single-frame models.
Our method is built as a fully convolutional encoder–decoder architecture, largely adapting the U-Net architecture (Ronneberger et al., 2015). U-Nets have been used in depth estimation (Wiles et al., 2020) and novel-view synthesis (Kim and Kim, 2020). They have also been applied to the task of semi-supervised video segmentation (Sibechi et al., 2019).
2.2 Deep Learning Applications to Endoscopy
Most of the existing work related to this paper focuses on depth estimation and topographical reconstruction in endoscopy (Mahmood and Durr, 2018b, a; Liu et al., 2018; Turan et al., 2018; Liu et al., 2019). For instance, Kumar et al. (2014) design a multi-stage procedure – involving 3D shape reconstruction, registration with a 3D CT model, endoscope position tracking, and depth map calculation – to allow for stereo image synthesis in laparoscopic surgery. These stages are often developed and tuned separately from one another and require expensive ground-truth annotations. Unlike these earlier studies, we investigate an end-to-end approach that requires minimal engineering and annotation.
It is tempting to generalize the success of deep learning for “natural” video to surgical video. It is, however, unclear whether this generalization is reasonable, since there are many features that are specific to surgical video that are not present in natural video. These include soft textures, homogeneous colors, inconsistent sharpness, variable depth of field and optical zoom, inconsistent motion, and obstructions arising from fluid and smoke (Petscharnig and Schöffmann, 2018). Therefore, it is necessary to investigate the applicability and effectiveness of deep learning–based end-to-end approaches to 2D-to-3D reconstruction in surgical video, as we do in this paper.
2.3 Evaluation Metrics
Quantitatively assessing the quality of generated stereo video an open problem. In our own evaluation, we simplify the problem by assessing the image quality of the generated frames rather than the full video, following the convention of previous work (see Xie et al. (2016)). Various automated metrics have been proposed to assess the quality of generated images, including structural similarity index (SSIM), peak signal-to-noise ratio (PSNR), visual information fidelity (VIF), and Fréchet inception distance (FID) (Li et al., 2019; Song et al., 2014). More recently, a family of metrics called perceptual metrics have been found to closely correspond with human qualitative assessments (Ding et al., 2021). In this first attempt at establishing the suitability of automated metrics in the domain of endoscopic surgery, we correlate a diverse set of automated metrics against human-perceived quality assessments obtained via a series of reader studies with ten experienced surgeons.
3 Methods
In this section, we describe the task of generating stereo video from 2D video and present a neural network–based approach devised for this purpose.
3.1 Task Description
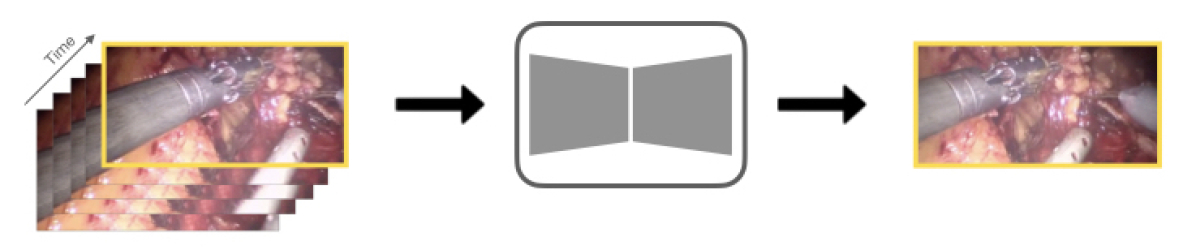
We refer to “stereo vision” as a pair of images (or video frames), corresponding to the left and right views of the same scene, and define the task of 2D-to-3D reconstruction, or equivalently stereo video reconstruction, as the problem of generating a missing view (either left or right) given the other (observed) view. Without loss of generality, we take the left view as the observed input and the right view as the missing view to be reconstructed. In the case of video, we have multiple past frames of the left view available, while we do not assume the availability of any right-view frames.
More specifically, we propose a solution to the task of online frame-level stereo video reconstruction. Given a sequence of left-view frames up to time , we predict the corresponding right view at time .
Surgical video can be of arbitrary length, and it is unlikely for distant past frames to be relevant to the current scene. We therefore consider only a few frames from the immediate past as the input. In other words, a system solving this task takes the most recent frames, including the current frame, , and outputs the right view , where we assume three-channel RGB frames of width and height .
fig:train
3.2 Deep Learning for 2D-to-3D Video Reconstruction
We present a DNN that takes as its input the left view and directly renders the right view. We train this neural network using a dataset of 3D endoscopy procedures, to minimize the reconstruction error between the generated and the true right view. We do not require any explicit depth information or intrinsic camera parameters.
3.2.1 A Base Network Architecture: A Modified U-Net
We modify a fully convolutional U-Net as the base architecture for the task of stereo view generation (Ronneberger et al., 2015). Our U-Net implementation differs from the original architecture in two ways: 1) decoder blocks use padding instead of cropping to concatenate features from the skip connections, and 2) the decoder uses either strided transpose convolution or bilinear interpolation for upsampling. We denote this U-Net model as . As in the original implementation, we do not include any batch normalization layers. The 2D-to-3D reconstruction task is, then, to predict the corresponding right view given the left-view frames: i.e., .
3.2.2 Capturing Temporal Information
Unlike conventional applications of the U-Net, such as semantic segmentation (Ronneberger et al., 2015; Siddique et al., 2020), our modified U-Net must handle a temporal series of left-view frames. The temporal structure contained in the input frames can be exploited by the U-Net in different ways, and we explore three possible approaches in this paper.
(1) Current Frame Only.
The simplest, but least effective, approach is to discard all the past frames and keep only the current frame as input () to the network , in order to predict the corresponding stereo frame . We use this approach to verify our hypothesis that temporal information from the observed view is useful for reconstructing the missing view, which has not yet been confirmed or refuted in the context of surgical video.
(2) Stacking Multiple Frames.
We present the temporal ordering of observed frames by stacking them along the channel axis, similarly to color. In other words, we reshape the 4D input tensor into a 3D tensor of size and feed this 3D tensor to the U-Net architecture , as if it were an image with color channels.
(3) A Spatio-Temporal U-Net.
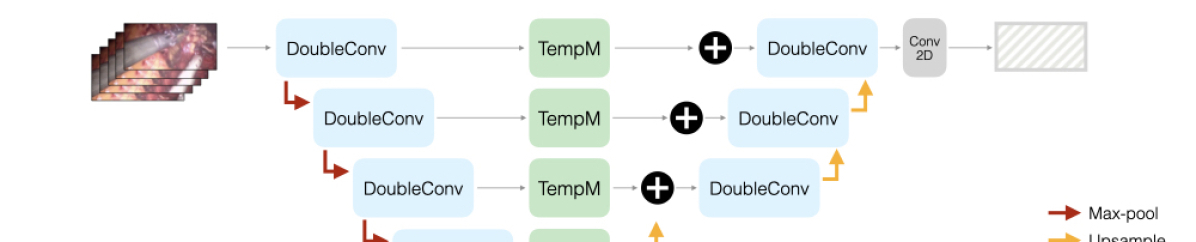
Like spatial structures, temporal structures exhibit themselves at multiple scales. Pixel-level temporal information allow fine-grained textures to be inferred, while object-level temporal information can help overcome occlusion in individual frames. In order to better incorporate the multi-scale nature of temporal information, we modify the U-Net architecture by inserting a “temporal module” at each scale between the encoder and decoder, capturing unique aspects of temporal information at each scale.
More specifically, each of the consecutive frames in the input is fed to the encoder separately and results in spatial feature maps. This sequence of feature maps is processed by the temporal module, before being sent to the corresponding layer at the decoder for concatenation. For a graphical illustration of the method, see can be seen in \figurereffig:spatiotemp_unet. In this work, we use a single 3D convolutional layer as the default temporal module. We compare this module against two naive approaches: the element-wise average and element-wise maximum modules.
fig:spatiotemp_unet
3.3 Loss Functions
The choice of loss function is known to have a large impact on the quality of generated images. Pixel-wise loss functions, such as mean squared error (MSE) and mean absolute error (MAE), correlate poorly with perceived image quality (Ding et al., 2021). However, when these losses are computed in perceptually appropriate representation space, they have been found to correlate better with human perception.
In our experiments, we investigate three loss functions: MSE, MAE, and a perceptual loss function. We use the sum of the MAEs computed using the feature maps extracted from the first three blocks of VGG16 (Simonyan and Zisserman, 2015), pretrained on the ImageNet dataset (Deng et al., 2009) for the perceptual loss.
4 Experimental Setup
In this section, we describe the training procedure for our DNN-based computational models, and the subjective testing procedure used to collect human ratings of the generated images and VR videos. We ensure the reproducibility of our experiments by reporting on public datasets, and by publicly releasing our code.
4.1 Dataset
We use the da Vinci endoscopic dataset from the Hamlyn Center for Robotic Surgery (Ye et al., 2017). This dataset consists of rectified stereo images of size , partitioned into 34,241 train and 7,192 test image sequences from video. Each video was captured in vivo during a partial nephrectomy procedure performed using a da Vinci surgical system. Details regarding the how the specific train and validation dataset splits were obtained is discussed in \appendixrefdata.
4.2 Training
To investigate the effect of using multiple frames for 2D-to-3D reconstruction, we try different training set-ups. Specifically, we vary the number of input frames between one (current only), five, and ten consecutive frames. We also test five- and six-layer U-Nets, to understand whether more layers allow better temporal information to be captured.
All networks are trained with the Adam optimizer (Kingma and Ba, 2017) from scratch, with a constant learning rate of . Each model is trained on a single NVIDIA V100 GPU for no more than 30 hours. We used a mini-batch size of 16, although we sometimes use smaller mini-batches to work with the limited onboard memory (e.g., when we train a network with the 10-frame input). For memory efficiency, we use 16-bit precision wherever possible.
4.3 Constant Shift Baselines
In order to ensure that the proposed U-Net–based approach performs non-trivial reconstruction, we include two baselines for comparison. In both cases, we shift all the pixels in the current left-view frame by a constant disparity . The disparity is estimated by minimizing the loss (MSE, MAE, or perceptual) on the validation set. These two baselines differ in that one fills the newly added pixels with zeros (i.e., the color black), while the other fills the missing pixels with the original values from the input, resulting in a duplicated strip on one side of the generated frame.
4.4 Automatic Evaluation Metrics
Image-quality assessment is an active area of research Ding et al. (2021). Widely used evaluation protocols for video generation often rely on image-similarity-based metrics Oprea et al. (2020). We select and report five image-quality metrics – PSNR, SSIM (Wang et al., 2004), FID (Heusel et al., 2018), LPIPS (Zhang et al., 2018), and DISTS (Ding et al., 2020) – for the purpose of understanding these metrics’ correlation with human perception in the context of surgical endoscopy video.
4.5 Expert Evaluation: Reader Studies
We conduct two main reader studies. In the first reader study, we focus on evaluating individual predictions from the U-Net variants. Each expert is asked to choose between two candidate frames, based on their quality. In the second study, we model a more realistic scenario in which we ask experts to assess the quality of stereo-vision video using a VR kit. Due to time constraints, we use a subset of promising models from the first reader study for 3D-video-quality assessment.
4.5.1 Frame-Level Reader Study
Selected Models.
We select eight models for the frame-level reader study. Our selection is based on a mix of automatic evaluation metrics and qualitative feedback from a supervising surgeon. Descriptions of the eight models, as well as further detail regarding the selection process, can be found in \appendixrefsec:app_screening. The only multi-frame models selected were those that used the spatio-temporal U-Net architecture with a single 3D convolutional layer as the temporal module. Initial evaluation showed that stacking multiple frames resulted in similar or worse performance compared to using just a single frame. Spatio-temporal networks with an average or maximum temporal module produced visible inconsistencies such as double vision and were thus not included in the reader study.
Reader Study Design.
To acquire human perceptual assessment of the generated results at the frame level, we conduct a reader study with 10 experts. Experts are surgeons with between 6 and 30 years of medical experience, and all have experience performing endoscopic surgery.
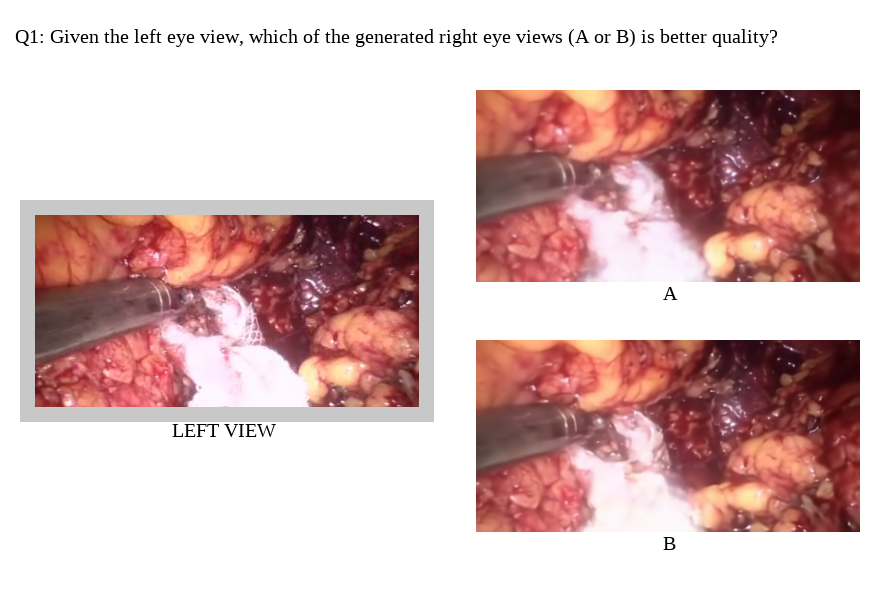
We use the two-alternative forced choice (2AFC) method to compare the eight different models. Each model is compared against every other model three times, using the same three examples. Additionally, each model is compared against the target once, resulting in a total of 92 comparisons. In a given trial, a surgeon is shown two frames generated by two distinct models (candidate synthetic right-view frames), as well as the corresponding left view that was used as the input to the models. The surgeon is then asked the following question: Given the left view, which of the generated right views (A or B) is of better quality? Each image is shown in the native resolution of the dataset ( pixels), with the option to zoom in on any portion of the presented frame. No time limit is applied. An example is shown in \figurereffig:image_survey in \appendixrefsec:image_survey_more. We employ the Bradley-Terry model (Bradley and Terry, 1952) to convert pair-wise comparison results to global rankings and calculate log-worth scores. Further details can be found in \appendixrefsec:bradleyterry.
4.5.2 Video-Level Reader Study: VR
The quality of individual frames is an insufficient proxy for stereo video quality. Successful stereo video reconstruction requires that the viewer’s perception of 3D depth remain consistent across consecutive frames. The shift between the two views that form a stereo pair is subtle. It is difficult to assess from a single left view whether a given right view would in fact result in realistic 3D depth perception when viewed in stereo. Moreover, presented with only a single stereo pair, it is impossible to judge whether the model achieves consistent reconstruction across time.
We select five models from the first reader study and further evaluate them using a VR kit. Experts are first presented with a 25-second 2D clip. They then watch the same clip in 3D, generated from one of the selected models. The 3D videos are played using a Google Cardboard VR headset in conjunction with an iPhone 12. Experts are asked 1) whether the 3D video provided a better viewing experience than the 2D video did, and 2) to rate the quality of the reconstructed 3D video on a scale from 1 (worst) to 5 (best).
5 Results and Discussion
tab:models Reader Study Automated Metrics Rank Model log-worth win % DISTS LPIPS FID PSNR SSIM 1 5 fr+perceptual+6 layers 0.00 0.20 100 0.110 0.116 50.53 22.88 0.627 2 5 fr+perceptual -0.91 0.17 86 0.116 0.119 48.42 22.77 0.616 3 5 fr+perceptual+bilinear -1.85 0.16 52 0.117 0.124 53.68 23.25 0.710 4 1 fr+perceptual -2.04 0.16 52 0.119 0.125 52.56 22.63 0.624 5 10 fr+perceptual -2.41 0.16 38 0.120 0.131 50.16 22.63 0.620 6 1 fr+MSE+6 layers -2.55 0.16 48 0.143 0.156 65.78 23.04 0.700 7 1 fr+MAE -3.74 0.20 19 0.140 0.156 74.66 23.14 0.716 8 5 fr+MSE+6 layers -4.42 0.23 5 0.143 0.159 66.28 23.78 0.722
5.1 Frame-Level Reader Study
Multiple Frames and Perceptual Loss.
A major finding from the first reader study is that the proposed U-Net variant benefits from the availability of multiple left-view frames as input. This is clear from the top-three entries in \tablereftab:models, according to both the log-worth and the win rate. All three models take five left-view frames as input. This observation confirms our earlier hypotheses that 1) multiple frames from one view facilitate reconstructing the other view, and 2) the proposed variant of the U-Net is capable of exploiting such temporal information from multiple frames.
Another finding – in line with earlier observations (Ding et al., 2021) – is the importance of using a perceptual loss function for training image-generation models. The top five models were all trained to minimize the perceptual loss and outperformed models trained with either MSE or MAE in the original pixel space.
Advanced Perceptual Metrics with Expert Judgement.
The five final columns of \tablereftab:models reveal that recently proposed advanced perceptual metrics – in particular, DISTS and LPIPS – select the best models, as defined by expert judgement. \tablereftab:models reports the metric values on our held-out validation set and we also show that performance is roughly consistent on the official da Vinci test set in \appendixreftest-perf. Given the high costs associated with obtaining surgeon feedback, this is a positive finding. Future research can rely on DISTS and/or LPIPS for faster and cheaper iteration in designing approaches to 2D-to-3D surgical video reconstruction.
Unlike DISTS and LPIPS, MSE-based PSNR did not show any discriminative capability among these models, resulting in more or less similar scores for all the tested models. On the other hand, SSIM, which has been successful with natural images (not surgical images), ended up choosing the two worst models, suggesting major differences between natural and surgical images. FID preferred models trained with the perceptual loss, perhaps unsurprisingly because FID itself is a perceptual loss. However, FID ended up favoring the pixel-shift baselines over any of the learned models, which significantly limits the applicability and reliability of FID. See \appendixrefbaseline for more details.
These observations are further confirmed by the rank correlations among automatic metrics and experts, as shown in \tablereftab:spear_rank_corr. The rankings of the models by both DISTS and LPIPS correlate almost perfectly with the expert ranking. This correlation does not exist with the other automatic metrics tested.
tab:spear_rank_corr Expert DISTS LPIPS FID SSIM PSNR Expert 1.0 0.98 0.95 0.76 0.64 0.41 DISTS 1.0 0.98 0.71 0.60 0.39 LPIPS 1.0 0.74 0.67 0.52 FID 1.0 0.93 0.73 SSIM 1.0. 0.88 PSNR 1.0
Qualitative Inspection.
In order to get a better sense of how models differ, we manually inspect selected output frames. \figurereffig:qual_rank_comparison shows a representative example, displaying cropped tiles from the outputs of the eight ranked models. These are ordered according to their ranks (best to worst). Full frames and additional examples are found in \appendixrefsec:image_survey_more.
The models trained using the perceptual loss produce visibly sharper images. One can easily discern visual details in the gauze in examples (b–f) that are not present in examples (g–i), the latter of which were produced by the only three models that did not use the perceptual loss.
fig:qual_rank_comparison
\subfigure[][b]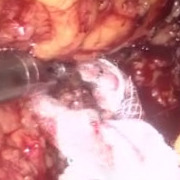 \subfigure[][b]
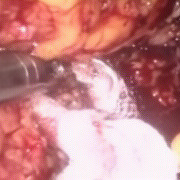 \subfigure[][b]
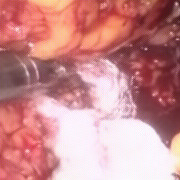 \subfigure[][b]
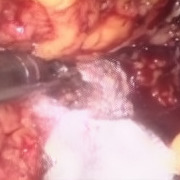 \subfigure[][b]
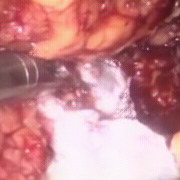 \subfigure[][b]
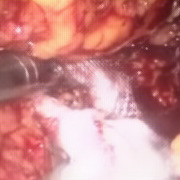 \subfigure[][b]
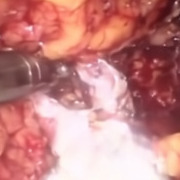 \subfigure[][b]
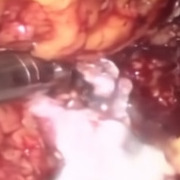 \subfigure[][b]
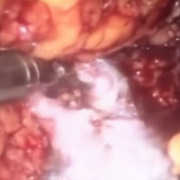
Expert Judgement vs. Non-Expert Judgement.
As additional analysis, we conducted another frame-level reader study with 10 non-expert readers with no medical expertise. We calculate how often the majority vote of the experts agrees with the majority vote of the non-experts over all questions. We found that, for 80% of the questions, the expert and non-expert majority votes were in agreement. We attribute this high level of agreement to visual anchors common for both the expert and non-expert readers, such as the legibility of text or the sharp edges of a surgical tool. Disagreements between experts and non-experts, on the other hand, seem to be caused by certain features that are visually subtle but that impact surgical outcomes and whose presence surgeons are therefore trained to search for. For instance, two surgeons commented on the appearance of the vasculature in the generated images. Although vasculature is critical in surgical processes, since blood vessels bleed when cut, non-experts are unlikely to notice it in a given image.
The average within-group disagreement was slightly higher among the non-experts (0.26) than among the experts (0.17), where the within-group disagreement was calculated as the percentage of members who disagreed with the majority vote of the group, averaged over all questions. We conjecture that this lower within-group disagreement rate among the experts is also due to their attention to surgically relevant details that are not taken into account by non-expert readers.
Based on this comparison between the expert and non-expert readers, we conclude that one cannot fully substitute expert judgment with non-expert judgement. Nevertheless, reasonably high agreement indicates that non-expert surveys – which are easier to come by than expert surveys – can be used to iterate more efficiently in future work.
5.2 VR Video Reader Study
We choose the top three models from \tablereftab:models in addition to the best MSE model and the best MAE model for testing in the second reader study, a VR video survey. We recruit two surgeons for this study. The full version of \tablereftab:vr_results includes detailed individual surgeon comments and can be found in \appendixrefvr_vid_supp.
tab:vr_results Model description Avg StdDev 5 fr, perceptual, bilinear 4.67 0.52 5 fr, perceptual 3.83 0.98 5 fr, perceptual, 6 layers 3.50 0.55 1 fr, MSE, 6 layers 2.83 0.75 1 fr, MAE 2.83 0.98
The first finding from this reader study is that both surgeons strongly favored the 3D reconstructed surgical video clips over the corresponding 2D clips. This supports the validity and importance of the proposed task of 2D-to-3D reconstruction in surgical video and demonstrates the effectiveness of the proposed U-Net–based approach to this problem.
The second finding is that models trained with the perceptual loss were strongly preferred over models trained with MSE or MAE, which confirms our observation from the first reader study. Comments by the readers suggest that one major cause of this distinction is the blurriness associated with pixel-wise losses such as MSE or MAE. In particular, two comments describing the MSE-trained model mention the lack of detail in the right periphery.
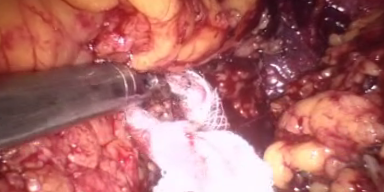
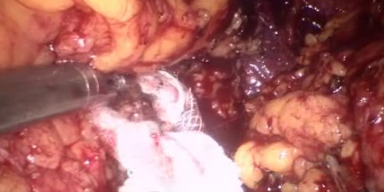
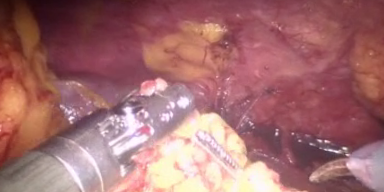
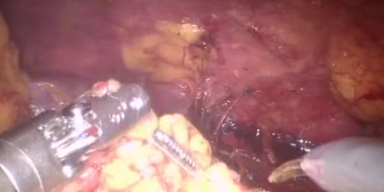
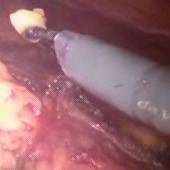
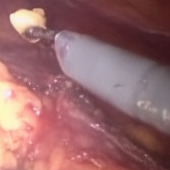
We observe that the favorite model among the experts in the second reader study was the third model from the first, frame-level reader study. The major difference between this model and the other two models, also trained with the perceptual loss, is that it uses bilinear interpolation for upsampling in the decoder rather than transposed convolution. In order to study the difference between these two upsampling implementations, we manually inspect the generated frames from the models (one with bilinear upsampling and the other with transposed convolution). Doing so revealed that transposed convolution tends to amplify checkerboard artifacts, as shown in \figurereffig:bilinear, which is in line with earlier observations by Odena et al. (2016). Although this effect is subtle at the frame level, we suspect that, when viewed in 3D, the artifacts produce a more disorientating visual experience.
fig:bilinear
\subfigure[TC (6)][b] \subfigure[TC (5)][b]
 \subfigure[BI (5)][b]
6 Conclusion
Minimally invasive endoscopic surgery is one of the most important surgical advances of the past half-century. The use of endoscopy, however, is often limited by the steep learning curve associated with a lack of depth perception, and the challenge of delivering high-quality visualization via increasingly smaller optical instruments. Enhanced endoscopic imaging through computer vision has the potential to further democratize minimally invasive surgery.
In this paper, we proposed the task of converting 2D endoscopy video to 3D video and investigated the feasibility of deep learning for tackling the lack of depth perception in surgical endoscopy. More specifically, we designed modified U-Nets to generate a novel perspective (right view) given a series of consecutive left-view frames and tested their effectiveness by running an extensive set of reader studies, both frame-level and video-level, with experienced surgeons.
The reader studies along with thorough analysis revealed a few major findings. First, surgeons preferred the generated stereo video over the corresponding 2D video. This confirms the usefulness of the proposed task and the effectiveness of the proposed deep learning–based solution. Second, the models that were favored by expert surgeons were all trained with a perceptual loss and utilized multiple consecutive frames of the observed view with a convolutional temporal module. This finding 1) verifies our hypothesis that temporal information, available from multiple past frames, is critical in reconstructing the missing view in the stereo pair, and 2) shows that the proposed variant of the U-Net is able to exploit such information from input frames. Third, we identified two perceptual loss functions, DISTS and LPIPS, that correlate strongly with expert judgement. These automatic metrics will enable rapid iteration to improve algorithms for solving the proposed task without relying on time-consuming and costly reader studies. Finally, we demonstrated the overall importance of expert readers compared to non-expert readers (without any medical experience) when assessing 2D-to-3D reconstruction algorithms for surgical video. Overall, these findings indicate that the proposed task is feasible and useful, and that the proposed approach, despite being the very first attempt at this problem, is a promising one.
Future Directions.
The positive findings from this paper present us with a number of future directions. First, running another set of video-based reader studies with higher-resolution reconstruction and higher-quality VR gear would further strengthen the usefulness of both the proposed task and the proposed approach. Second, better network architectures as well as learning hyperparameters should be sought out, now that our experiments have revealed advanced perceptual loss to be a good proxy for expensive human evaluation. Third, we expect more advanced temporal modules, such as a recurrent DNN-based module, to generate better images by capturing longer-range dependencies. Finally, this task is not necessarily limited to endoscopy, and we anticipate that our findings will be transferable to similar problems in medicine and other domains.
References
- Berci and Forde (2000) G. Berci and K. A. Forde. History of endoscopy: What lessons have we learned from the past? Surgical endoscopy, 14(1):5–15, 01 2000. URL http://proxy.library.nyu.edu/login?url=https://www.proquest.com/scholarly-journals/history-endoscopy/docview/219490456/se-2?accountid=12768. Copyright - Springer-Verlag 2000; Last updated - 2010-08-26.
- Bradley and Terry (1952) Ralph Allan Bradley and Milton E Terry. Rank analysis of incomplete block designs: I. the method of paired comparisons. Biometrika, 39(3/4):324–345, 1952.
- Correa et al. (2017) Karin Correa, Andres Vivas, and Jose Sabater-Navarro. Neurosurgery and brain shift: review of the state of the art and main contributions of robotics. TecnoLógicas, 20:125–138, 12 2017. 10.22430/22565337.719.
- Deng et al. (2009) J. Deng, W. Dong, R. Socher, L.-J. Li, K. Li, and L. Fei-Fei. ImageNet: A Large-Scale Hierarchical Image Database. In CVPR09, 2009.
- Ding et al. (2020) Keyan Ding, Kede Ma, Shiqi Wang, and Eero P. Simoncelli. Image quality assessment: Unifying structure and texture similarity. IEEE Transactions on Pattern Analysis and Machine Intelligence, page 1–1, 2020. ISSN 1939-3539. 10.1109/tpami.2020.3045810. URL http://dx.doi.org/10.1109/TPAMI.2020.3045810.
- Ding et al. (2021) Keyan Ding, Kede Ma, Shiqi Wang, and Eero P. Simoncelli. Comparison of full-reference image quality models for optimization of image processing systems. International Journal of Computer Vision, 129(4):1258–1281, Jan 2021. ISSN 1573-1405. 10.1007/s11263-020-01419-7. URL http://dx.doi.org/10.1007/s11263-020-01419-7.
- Fehn (2004) Christoph Fehn. Depth-image-based rendering (DIBR), compression, and transmission for a new approach on 3D-TV. In Mark T. Bolas, Andrew J. Woods, John O. Merritt, and Stephen A. Benton, editors, Stereoscopic Displays and Virtual Reality Systems XI, volume 5291, pages 93 – 104. International Society for Optics and Photonics, SPIE, 2004. 10.1117/12.524762. URL https://doi.org/10.1117/12.524762.
- Firth (2003) David Firth. 1. overcoming the reference category problem in the presentation of statistical models. Sociological Methodology, 33(1):1–18, 2003. 10.1111/j.0081-1750.2003.t01-1-00125.x.
- Gompel et al. (2014) Jamie Gompel, Mark Tabor, Ahmed Soliman Youssef, Tsz Lau, Andrew Carlson, Harry Loveren, and Siviero Agazzi. Field of view comparison between two-dimensional and three-dimensional endoscopy. The Laryngoscope, 124, 02 2014. 10.1002/lary.24222.
- Han and Kanade (2002) Mei Han and Takeo Kanade. A perspective factorization method for euclidean reconstruction with uncalibrated cameras. The Journal of Visualization and Computer Animation, 13(4):211–223, 2002. https://doi.org/10.1002/vis.290. URL https://onlinelibrary.wiley.com/doi/abs/10.1002/vis.290.
- Heusel et al. (2018) Martin Heusel, Hubert Ramsauer, Thomas Unterthiner, Bernhard Nessler, and Sepp Hochreiter. Gans trained by a two time-scale update rule converge to a local nash equilibrium, 2018.
- Kim and Kim (2020) Juhyeon Kim and Young Min Kim. Novel view synthesis with skip connections. In 2020 IEEE International Conference on Image Processing (ICIP), pages 1616–1620, 2020. 10.1109/ICIP40778.2020.9191076.
- Kingma and Ba (2017) Diederik P. Kingma and Jimmy Ba. Adam: A method for stochastic optimization, 2017.
- Koc et al. (2006) Kenan Koc, Ihsan Anik, Dilek Ozdamar, Burak Cabuk, Gurkan Keskin, and Savas Ceylan. The learning curve in endoscopic pituitary surgery and our experience. Neurosurg. Rev., 29(4):298–305; discussion 305, October 2006.
- Kumar et al. (2014) Atul Kumar, Yen-Yu Wang, Ching-Jen Wu, Kai-Che Liu, and Hurng-Sheng Wu. Stereoscopic visualization of laparoscope image using depth information from 3d model. Computer Methods and Programs in Biomedicine, 113(3):862–868, 2014. ISSN 0169-2607. https://doi.org/10.1016/j.cmpb.2013.12.013. URL https://www.sciencedirect.com/science/article/pii/S0169260713004033.
- Li et al. (2005) Khan W Li, Clarke Nelson, Ian Suk, and George I Jallo. Neuroendoscopy: past, present, and future. Neurosurg. Focus, 19(6):E1, December 2005.
- Li et al. (2019) Leida Li, Xi Chen, Yu Zhou, Jinjian Wu, and Guangming Shi. Depth image quality assessment for view synthesis based on weighted edge similarity. In Proceedings of the IEEE/CVF Conference on Computer Vision and Pattern Recognition (CVPR) Workshops, June 2019.
- Li et al. (2006) Ping Li, Dirk Farin, Rene Gunnewiek, and Peter With. On creating depth maps from monoscopic video using structure from motion. In Proc. 27th Symposium on Information Theory in the Benelux, June 8-9, 2006, Noordwijk, The Netherlands, pages 85–91. Werkgemeenschap voor Informatie- en Communicatietheorie (WIC), 2006. ISBN 978-90-71048-22-7.
- Liu et al. (2018) Xingtong Liu, Ayushi Sinha, Mathias Unberath, Masaru Ishii, Gregory D. Hager, Russell H. Taylor, and Austin Reiter. Self-supervised learning for dense depth estimation in monocular endoscopy. In Danail Stoyanov, Zeike Taylor, Duygu Sarikaya, Jonathan McLeod, Miguel Angel González Ballester, Noel C.F. Codella, Anne Martel, Lena Maier-Hein, Anand Malpani, Marco A. Zenati, Sandrine De Ribaupierre, Luo Xiongbiao, Toby Collins, Tobias Reichl, Klaus Drechsler, Marius Erdt, Marius George Linguraru, Cristina Oyarzun Laura, Raj Shekhar, Stefan Wesarg, M. Emre Celebi, Kristin Dana, and Allan Halpern, editors, OR 2.0 Context-Aware Operating Theaters, Computer Assisted Robotic Endoscopy, Clinical Image-Based Procedures, and Skin Image Analysis, pages 128–138, Cham, 2018. Springer International Publishing. ISBN 978-3-030-01201-4.
- Liu et al. (2019) Xingtong Liu, Ayushi Sinha, Masaru Ishii, Gregory D. Hager, Austin Reiter, Russell H. Taylor, and Mathias Unberath. Self-supervised learning for dense depth estimation in monocular endoscopy. CoRR, abs/1902.07766, 2019. URL http://arxiv.org/abs/1902.07766.
- Mahmood and Durr (2018a) Faisal Mahmood and Nicholas J. Durr. Deep learning-based depth estimation from a synthetic endoscopy image training set. In Elsa D. Angelini and Bennett A. Landman, editors, Medical Imaging 2018: Image Processing, volume 10574, pages 521 – 526. International Society for Optics and Photonics, SPIE, 2018a. 10.1117/12.2293785. URL https://doi.org/10.1117/12.2293785.
- Mahmood and Durr (2018b) Faisal Mahmood and Nicholas J. Durr. Deep learning and conditional random fields-based depth estimation and topographical reconstruction from conventional endoscopy. Medical Image Analysis, 48:230–243, 2018b. ISSN 1361-8415. https://doi.org/10.1016/j.media.2018.06.005. URL https://www.sciencedirect.com/science/article/pii/S1361841518303761.
- (23) Mozilla Contributors. Web VR Concepts. Accessed Sept. 10, 2021 [Online]. URL https://developer.mozilla.org/en-US/docs/Web/API/WebVR_API/Concepts.
- Odena et al. (2016) Augustus Odena, Vincent Dumoulin, and Chris Olah. Deconvolution and checkerboard artifacts. Distill, 2016. 10.23915/distill.00003. URL http://distill.pub/2016/deconv-checkerboard.
- Oprea et al. (2020) Sergiu Oprea, Pablo Martinez-Gonzalez, Alberto Garcia-Garcia, John Alejandro Castro-Vargas, Sergio Orts-Escolano, Jose Garcia-Rodriguez, and Antonis Argyros. A review on deep learning techniques for video prediction. IEEE Transactions on Pattern Analysis and Machine Intelligence, page 1–1, 2020. ISSN 1939-3539. 10.1109/tpami.2020.3045007. URL http://dx.doi.org/10.1109/TPAMI.2020.3045007.
- Petscharnig and Schöffmann (2018) Stefan Petscharnig and Klaus Schöffmann. Learning laparoscopic video shot classification for gynecological surgery. Multimedia Tools and Applications, 77(7):8061–8079, Apr 2018. ISSN 1573-7721. 10.1007/s11042-017-4699-5. URL https://doi.org/10.1007/s11042-017-4699-5.
- Ronneberger et al. (2015) Olaf Ronneberger, Philipp Fischer, and Thomas Brox. U-net: Convolutional networks for biomedical image segmentation, 2015.
- Sibechi et al. (2019) Radu Sibechi, Olaf Booij, Nora Baka, and Peter Bloem. Exploiting temporality for semi-supervised video segmentation, 2019.
- Siddique et al. (2020) Nahian Siddique, Paheding Sidike, Colin Elkin, and Vijay Devabhaktuni. U-net and its variants for medical image segmentation: theory and applications, 2020.
- Simonyan and Zisserman (2015) Karen Simonyan and Andrew Zisserman. Very deep convolutional networks for large-scale image recognition, 2015.
- Song et al. (2014) Rui Song, Hyunsuk Ko, and C.-C. Jay Kuo. MCL-3D: a database for stereoscopic image quality assessment using 2d-image-plus-depth source. CoRR, abs/1405.1403, 2014. URL http://arxiv.org/abs/1405.1403.
- Turan et al. (2018) Mehmet Turan, Yusuf Yigit Pilavci, Ipek Ganiyusufoglu, Helder Araujo, Ender Konukoglu, and Metin Sitti. Sparse-then-dense alignment-based 3d map reconstruction method for endoscopic capsule robots. Machine Vision and Applications, 29(2):345–359, 2018.
- Turner et al. (2020) Heather L. Turner, Jacob van Etten, David Firth, and Ioannis Kosmidis. Modelling rankings in R: The PlackettLuce package. Computational Statistics, 35:1027–1057, 2020. 10.1007/s00180-020-00959-3. URL https://doi.org/10.1007/s00180-020-00959-3.
- Ummenhofer et al. (2016) Benjamin Ummenhofer, Huizhong Zhou, Jonas Uhrig, Nikolaus Mayer, Eddy Ilg, Alexey Dosovitskiy, and Thomas Brox. Demon: Depth and motion network for learning monocular stereo. CoRR, abs/1612.02401, 2016. URL http://arxiv.org/abs/1612.02401.
- Wang et al. (2004) Zhou Wang, Alan Conrad Bovik, Hamid Rahim Sheikh, Student Member, Eero P. Simoncelli, and Senior Member. Image quality assessment: From error visibility to structural similarity. IEEE Transactions on Image Processing, 13:600–612, 2004.
- Wiles et al. (2020) Olivia Wiles, Georgia Gkioxari, Richard Szeliski, and Justin Johnson. Synsin: End-to-end view synthesis from a single image, 2020.
- Xie et al. (2016) Junyuan Xie, Ross Girshick, and Ali Farhadi. Deep3d: Fully automatic 2d-to-3d video conversion with deep convolutional neural networks, 2016.
- Ye et al. (2017) Menglong Ye, Edward Johns, Ankur Handa, Lin Zhang, Philip Pratt, and Guang-Zhong Yang. Self-supervised siamese learning on stereo image pairs for depth estimation in robotic surgery, 2017.
- Zhang et al. (2018) Richard Zhang, Phillip Isola, Alexei A. Efros, Eli Shechtman, and Oliver Wang. The unreasonable effectiveness of deep features as a perceptual metric, 2018.
Appendix A Hamlyn da Vinci Dataset
The da Vinci dataset from the Hamlyn Center for Robotic Surgery (Ye et al., 2017) contains rectified stereo images of size pixels partitioned into 34,241 train and 7,192 test image sequences from video. To generate train and validation data splits, the full train image sequence is split into sequences of 1000 images. After this, 80% of the splits are randomly allocated to the train set and the remaining 20% are allocated to the validation set. To generate samples from each data split, a sliding window of length , where is the image input sequence length for the model, is applied to each sequence of 1000 images in their respective data split. Individual samples are shuffled again before training.
The dataset does not disclose the frame rate of the original video stream. We found that generating video from the dataset images at 20 frames per second yielded realistic results for evaluation.
fig:full_ref
\subfigure[Left view (input)][]
 \subfigure[Right view (target)][]
Appendix B Test Set Performance
We verify that the model performance in terms of DISTS and LPIPS, the two most successful automatic metrics, is consistent on the official Da Vinci test dataset.
tab:test_set_perf Rank Model DISTS LPIPS 1 5 fr+perceptual+6 layers 0.129 0.148 2 5 fr+perceptual 0.141 0.155 3 5 fr+perceptual+bilinear 0.147 0.166 4 1 fr+perceptual 0.156 0.180 5 10 fr+perceptual 0.142 0.167 6 1 fr+MSE+6 layers 0.157 0.194 7 1 fr+MAE 0.159 0.200 8 5 fr+MSE+6 layers 0.152 0.187
Appendix C Baseline Results
Baseline results were generated using the procedure described in \sectionrefsec:baseline_setup. Although most automatic metrics ranked baseline models poorly when compared to U-Net based models, FID failed as a reliable measure in this study. The FID metric ranked the baseline models higher than the trained models (\tablereftab:baselinemodels). Images generated by the baseline models (\figurereffig:baseline_imgs) contain discontinuities, a duplicated strip of the original image or a black strip in place of the missing pixels, and a constant global disparity. Since the baseline models are not candidate solutions to the task of 2D-to-3D reconstruction, we find FID using 2048 final average pooling features to be unsuitable in the context of our task.
tab:baselinemodels Baseline Model Pixel Shift DISTS LPIPS FID SSIM PSNR Copy pixels, perceptual loss -31 0.129 0.201 30.079 0.493 17.675 Copy pixels, MSE loss -37 0.128 0.205 32.648 0.486 17.728 Copy pixels, MAE loss -37 0.128 0.205 32.648 0.486 17.728 Fill zeros, perceptual loss -384 0.800 0.840 549.658 0.002 5.254 Fill zeros, MSE loss -32 0.145 0.237 35.148 0.458 16.067 Fill zeros, MAE loss -33 0.146 0.237 35.655 0.455 16.043
fig:baseline_imgs
\subfigure[Left view (input)][]
 \subfigure[Right view (target)][]
[Baseline with original pixel fill][]
 \subfigure[Baseline with black fill][]
Appendix D Image Reader Study
D.1 Initial model screening for reader study
Eight models (\tablereftab:selected_models) were selected for the frame-level reader study from an initial set of over 40 different configurations with varying architecture and loss as presented in \tablereftab:configs. As part of the effort to identify automatic metrics for model selection, we selected the top eight models based on four metrics: LPIPS, FID, SSIM and PSNR. In addition, we ran multiple multiple rounds of qualitative assessments with the supervising surgeon to assess perceptual differences and rankings of the generated images as additional screening for the reader study.
tab:configs Model Component Tested Configurations Loss function MSE, MAE, Perceptual Temporal structure channel-stacking, spatio-temporal, 3D convolutions, max-pooling, avg-pooling Number of input frames 1, 5, or 10 U-Net depth 5 or 6 blocks Upsampling mechanism transposed convolution or bilinear interpolation upsampling Sigmoid output Yes/No Extra skip connection Yes/No
tab:selected_models Model description Loss 1 frame Perceptual 1 frame MAE 1 frame, 6 layers MSE 5 frames Perceptual 5 frames, 6 layers Perceptual 5 frames, 6 layers MSE 5 frames, bilinear upsampling Perceptual 10 frames MSE
All spatio-temporal models based on maximum or average pooling temporal modules were eliminate from the study as the generated images were poor quality (\figurereffig:max_avg_pool). Stacking multiple frames along the channel axis did not result in significant qualitative or quantitative improvements and were also filtered from the study. Thus, all multi-frame models included in the reader study used a spatio-temporal architecture with 3D convolutions.
fig:max_avg_pool
.
\subfigure[][]
 \subfigure[][]
 \subfigure[][]
D.2 Image-based reader study format
The image-based reader study was completed remotely by subjects using a Google Forms survey. The first page summarized the background, goals, and methods for the project. In addition, we state instructions for the survey. The second page of the survey requests the subject’s profession and if they have performed endoscopic surgery (2D and/or 3D). On the third page, readers are presented a set of instructions, a set of questions, and a link to the directory containing the image comparison questions (\figurereffig:image_survey).
D.3 Qualitative Examples
fig:top_eight_qual
\subfigure[][]
 \subfigure[][]
[][]
 \subfigure[][]
[][]
 \subfigure[][]

[][]
 \subfigure[][]
D.4 Multi-frame models vs. single frame models
To validate that increased performance for multi-frame models was not due to increased model complexity (3 increased model complexity when compared to the equivalent single frame model), we re-train the best multi-frame model (as ranked by LPIPS and DISTS and the reader study) with the repeated frames as input. This repeated frame model resulted in significantly lower LPIPS and DISTS values than the equivalent model conditioned on past frames.
D.5 Bradley Terry ranking model
Given a set of models to be ranked, the probability of selecting the output from some model from a presented pair of outputs from model and is
where is the worth of item . We use the PlackettLuce package (Turner et al., 2020), which reduces to the Bradley-Terry model given a list of pairwise-comparisons, to estimate relative rankings of the reader study models. We estimate worth and bounded quasi-standard errors (Firth, 2003) for each model and transform them to log-scale. Since we expect all models compared to have worth greater than 0, we transform worth to the log scale to provide bounds on confidence intervals such that then are constrained to be greater than 0. We choose the target images as the reference such that the quasi-standard errors for the other models can be estimated.
Appendix E VR Video Reader Study
tab:vr_expanded_results Model description Avg StdDev Comments 5 fr, perceptual, bilinear 4.67 0.52 “Perfect.” “Great.” 5 fr, perceptual 3.83 0.98 “Really like this one.” “Temporal inconsistencies in grasper with shearing between frames” 5 fr, perceptual, 6 layers 3.50 0.55 “Loves it in 3D. Surprised at how much I like it.” “Looked good. Couldn’t see text on instrument.” 1 fr, MSE, 6 layers 2.83 0.75 “Periphery is not as crisp.” “Right periphery is not very good.” “Blurrier, little disorienting.” “Globally less sharpness. Less details. Less pronounced stereoscopic effect” 1 fr, MAE 2.83 0.98 “Depth perception was not as good as the first round.” “Blurrier, still pretty good.” “Not as detailed.”
We selected the three top ranked models from \tablereftab:models as well as the top MAE and MSE models to generate stereo video for the VR video reader study. We selected a diverse set of models to determine if image-based reader study results match video-based reader study results.
In the VR video reader study, subjects were given a Google Cardboard headset with an iPhone 12 Pro as the video source. Subjects were shown six videos of three scenes of approximately 20 seconds in length per model. Different scenes were selected based on variation in depth, movement, and color in each scene. Subjects were first shown the scene in 2D in which both eyes are shown the exact same video. Subjects are then shown a generated stereo 3D video of the same scene seen previously. Subjects are asked three questions: 1) Would you prefer the first video or second video when doing surgery? 2) Rate the stereo 3D video quality from 1-5 with 5 being best? 3) Provide general feedback about the quality of the video based on your experience in surgery.