Harnessing Perceptual Adversarial Patches for Crowd Counting
Abstract.
Crowd counting, which has been widely adopted for estimating the number of people in safety-critical scenes, is shown to be vulnerable to adversarial examples in the physical world (e.g., adversarial patches). Though harmful, adversarial examples are also valuable for evaluating and better understanding model robustness. However, existing adversarial example generation methods for crowd counting lack strong transferability among different black-box models, which limits their practicability for real-world systems. Motivated by the fact that attacking transferability is positively correlated to the model-invariant characteristics, this paper proposes the Perceptual Adversarial Patch (PAP) generation framework to tailor the adversarial perturbations for crowd counting scenes using the model-shared perceptual features. Specifically, we handcraft an adaptive crowd density weighting approach to capture the invariant scale perception features across various models and utilize the density guided attention to capture the model-shared position perception. Both of them are demonstrated to improve the attacking transferability of our adversarial patches. Extensive experiments show that our PAP could achieve state-of-the-art attacking performance in both the digital and physical world, and outperform previous proposals by large margins (at most +685.7 MAE and +699.5 MSE). Besides, we empirically demonstrate that adversarial training with our PAP can benefit the performance of vanilla models in alleviating several practical challenges in crowd counting scenarios, including generalization across datasets (up to -376.0 MAE and -354.9 MSE) and robustness towards complex backgrounds (up to -10.3 MAE and -16.4 MSE) 111Our code can be found in https://github.com/shunchang-liu/PAP-Pytorch..
1. Introduction
Crowd counting, which estimates the number of people in unconstrained scenes, is becoming increasingly important in many safety-critical scenarios in practice (e.g., pedestrian density monitoring). Up to now, research has focused on designing different crowd counting methods, including detection-based approaches (Lin et al., 2001; Li et al., 2008; Zhao and Nevatia, 2003), count regression approaches (Chan and Vasconcelos, 2009; Chen et al., 2012; Wang et al., 2015; Chen et al., 2013), and density-map-estimation-based methods (Zhang et al., 2016; Onoro-Rubio and López-Sastre, 2016; Boominathan et al., 2016; Sheng et al., 2016; Li et al., 2018; Liu et al., 2019b; Zhang et al., 2019; Ma et al., 2019; Wang et al., 2020b; Song et al., 2021). The last has become the de facto solution for the crowd counting task due to its insensitivity to occlusion and stability for large crowd scenes. In general, given an input image, this type of approach first generates a 2D crowd density map and then subsequently estimates the total number of the crowd by summing the density values across all spatial locations of the density map.
With increasing deployment of intelligent crowd counting devices in the safety-critical scenarios, their vulnerability has attracted considerable attention and become a growing concern for the public. Unfortunately, current estimation-based crowd counting models are highly vulnerable to adversarial examples, i.e., small perturbations that are imperceptible to humans but can easily lead deep neural networks to make wrong predictions (Szegedy et al., 2013). Though harmful, adversarial attacks could also be used to evaluate model robustness and provide valuable insights into the blind spots of deep learning models. In contrast with norm based attacks (Szegedy et al., 2013; Goodfellow et al., 2014), adversarial patch (Brown et al., 2017), a type of perturbation confined into a small patch region without an ball constraint, has a much higher application value in the real world due to its strong resistance to physical influences. However, as the only adversarial patch study for crowd counting models, (Wu et al., 2021) performs weak transferable attacks, which limits its ability to evaluate the robustness of black-box crowd counting systems in practice.
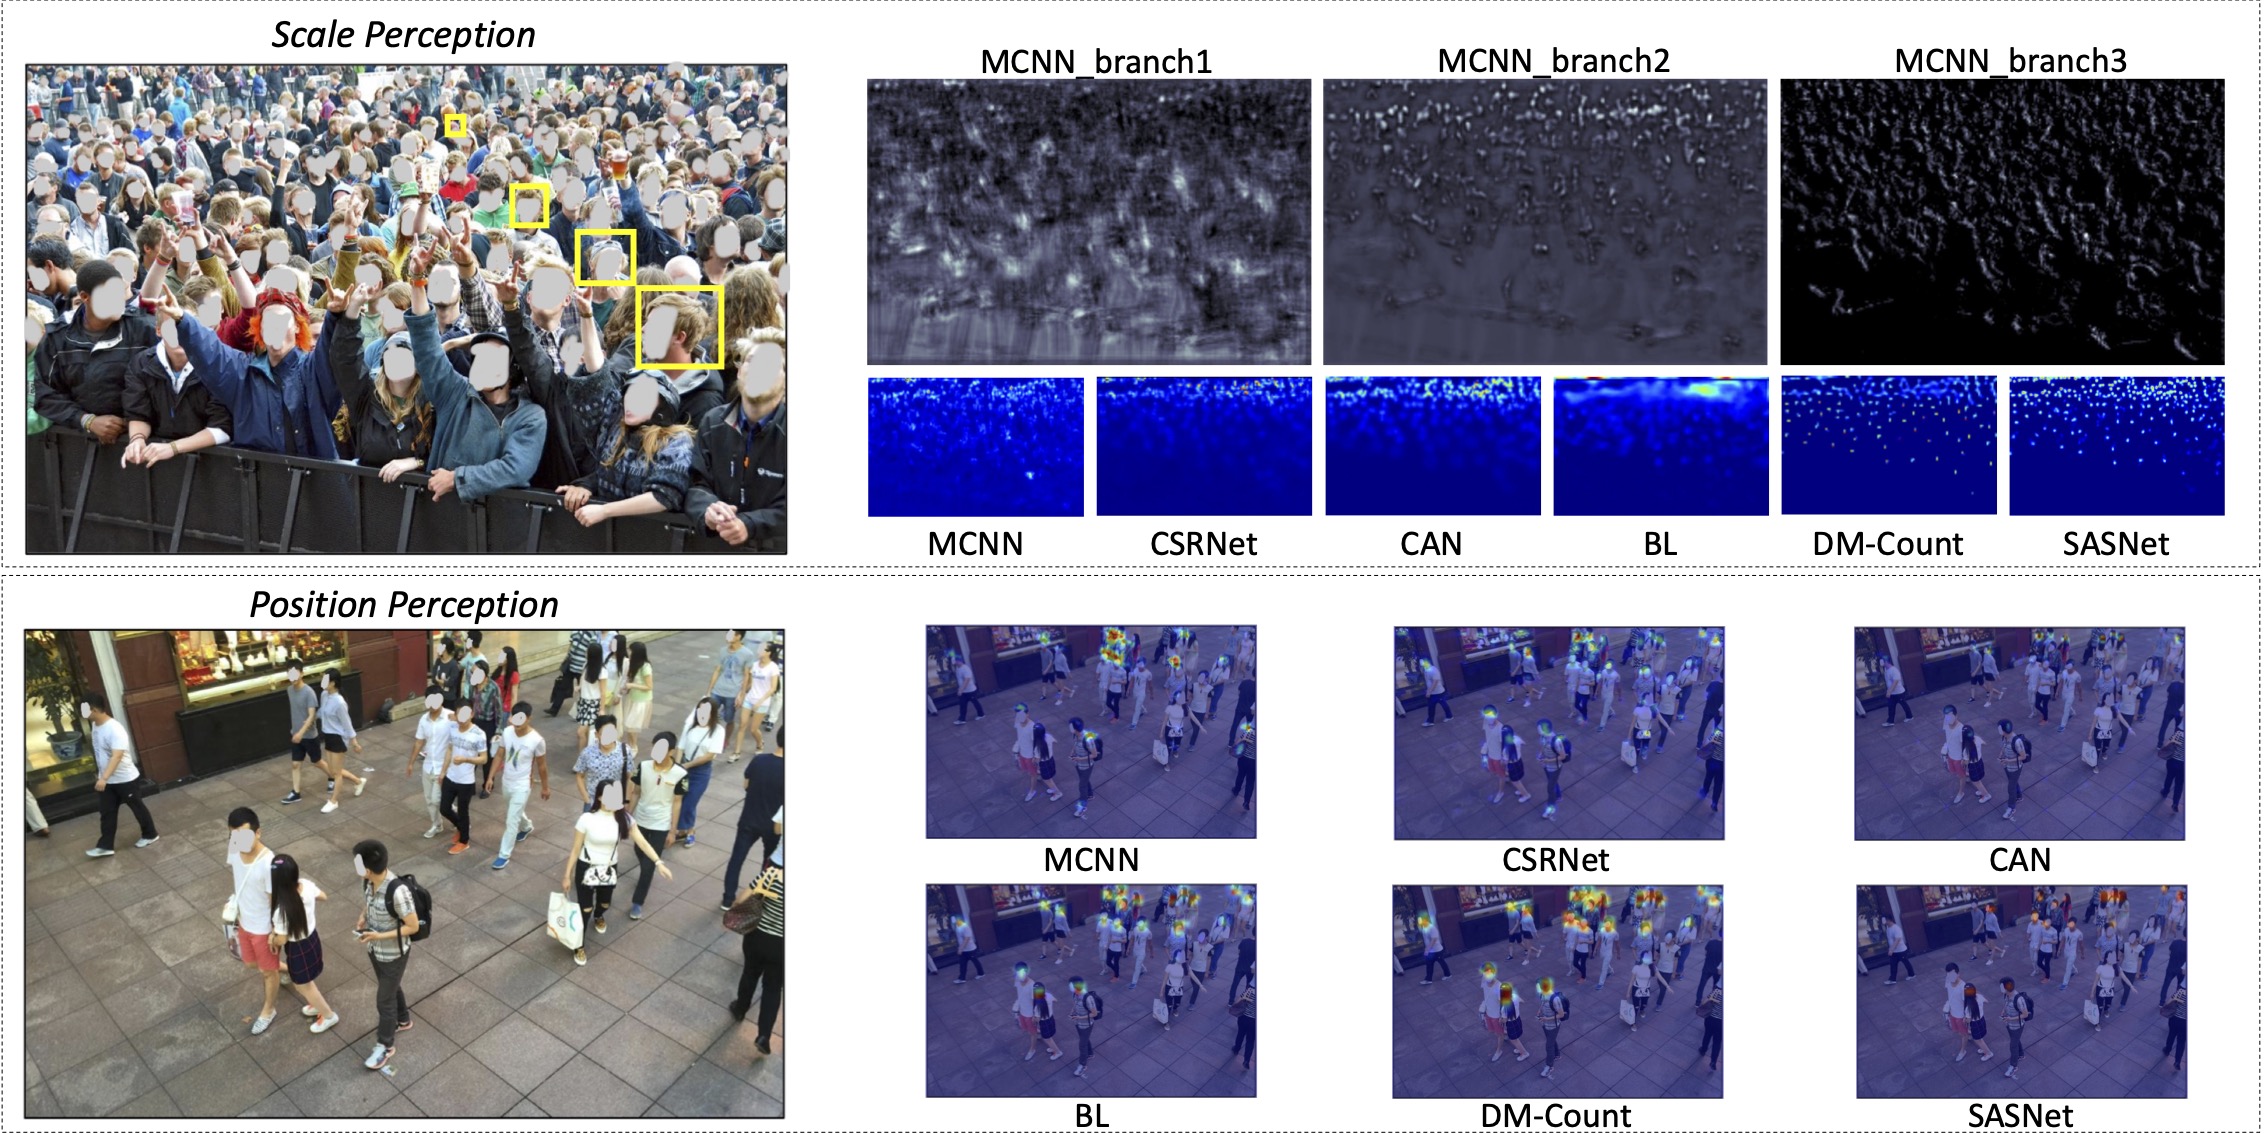
Recent studies (Dong et al., 2019a; Lennon et al., 2021) have shown that model-invariant characteristics greatly influence transferable attacks in vision tasks. In light of this, we aim to find those intrinsic characteristics that are shared between models for generating adversarial patches with strong transferability. For crowd counting, we reached two key insights: (1) Different models tend to show different perceptual preferences for different crowd scales, i.e., multiple scale perceptions. Due to the different structures, various models with different receptive fields can hardly capture consistent scale representations. Therefore, a model trained with specific object scales (e.g., the sizes of human heads) always performs well on its preferred scale while it is difficult to make correct predictions on others. (2) Different models show similar attention patterns at the same crowd positions, i.e., shared position perception. Almost all density-estimation-based models rely on head features for crowd prediction. In other words, they have similar attention patterns to the position of human heads. Figure 2 illustrates the above observations.
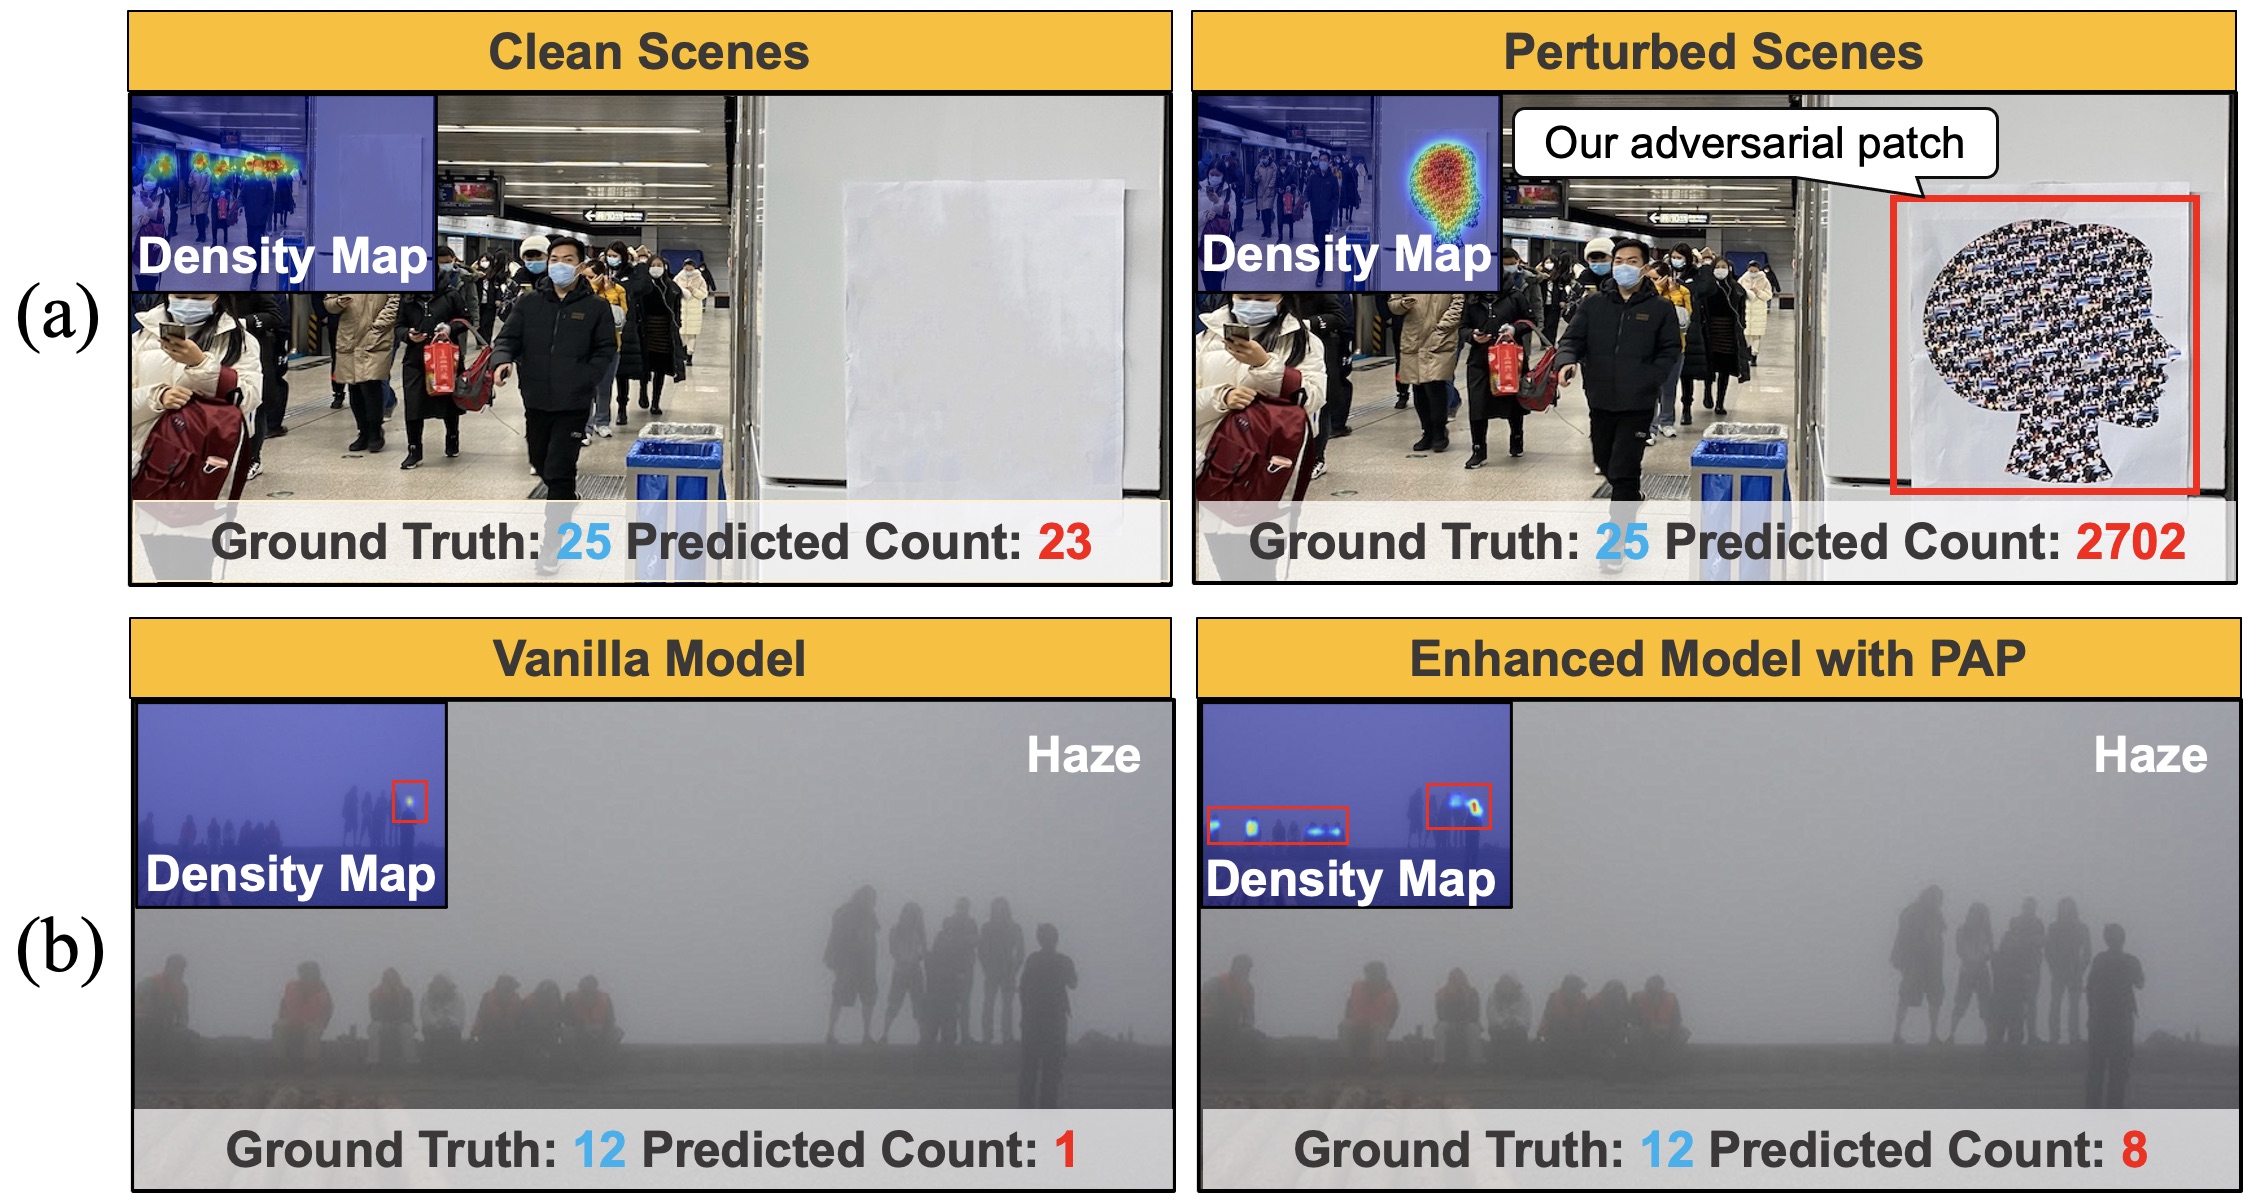
Thus, based on the above investigations, we propose the Perceptual Adversarial Patch (PAP) generation framework to learn model-invariant features by exploiting the model scale and position perceptions, thus promoting the transferability of our adversarial patches. (1) As for scale perception, PAP introduces the adaptive density during training to dynamically adjust the contribution of features with different scales, which helps to capture the scale invariance between models. In particular, we automatically enhance the contribution of the crowd scale features that are not captured well by the specific target model, so that the adversarial patches can be optimized with the complete scale features, i.e., the adversarial patches could adapt to models with different crowd scale perceptions. (2) Regarding position perception, PAP draws the model-shared attention of the target model from the spatially dispersed crowd patterns to the patch region, which helps to capture position invariance among models. Specifically, we utilize density-based gradients to obtain the attention map and strengthen the salient degree of the patch region. Thus, we could force the position perception of different models to focus on the patch. Overall, as shown in Figure 1 (a), our approach can generate strongly transferable adversarial patches in the physical world.
Furthermore, while most studies have found that adversarial training will reduce the model’s performance on the original task (Madry et al., 2018; Tsipras et al., 2019), we found an intriguing effect that benefits model performance for crowd counting by training with our adversarial patches. Since the generated adversarial patches consist of model-invariant characteristics (i.e., scale perception and position perception), adversarial training with our patches can force the vanilla model to better focus on crowds at perception level. We empirically demonstrate that it could benefit the vanilla models for better generalization across datasets and better robustness towards complex backgrounds (as shown in Figure 1 (b)).
To sum up, our contributions are as follows:
-
•
We proposed a Perceptual Adversarial Patch (PAP) generation framework that exploits the inherent perceptual properties to capture the model-invariant features for attacking the real-world crowd counting systems.
-
•
We designed the adaptive density and guided attention to capture scale and position perceptions, which could improve the transferable attacking ability of the adversarial patches across multiple crowd counting models in various structures.
-
•
Besides, we empirically demonstrated that our generated adversarial patches could be utilized for promoting the vanilla model’s robustness in several aspects (e.g., generalization across datasets and robustness towards complex backgrounds) via the adversarial training scheme.
-
•
Extensive experiments in the digital and physical world demonstrated that our PAP achieves the state-of-the-art attacking ability and outperforms other baselines by large margins (at most +685.7 MAE and +699.5 MSE). In addition, adversarial training with our PAP can improve the model performance by at most -376.0 MAE, -354.9 MSE for generalization across datasets, and -10.3 MAE, -16.4 MSE for robustness towards complex backgrounds.
2. Related Works and Preliminary
2.1. Crowd Counting
Image or video-based crowd counting aims to automatically estimate the number of people in unconstrained scenes. Early work mainly focuses on detection-based methods (Lin et al., 2001; Li et al., 2008; Zhao and Nevatia, 2003) and count regression methods (Chan and Vasconcelos, 2009; Chen et al., 2012; Wang et al., 2015; Chen et al., 2013), which either show unsatisfactory results in extremely dense crowds or have weak interpretability due to ignoring the key information in the dot annotation maps. Nowadays, density-map-estimation-based approaches (Zhang et al., 2016; Onoro-Rubio and López-Sastre, 2016; Boominathan et al., 2016; Sheng et al., 2016; Li et al., 2018; Liu et al., 2019b; Zhang et al., 2019; Ma et al., 2019; Wang et al., 2020b; Song et al., 2021), which we focus on, have been widely used due to their better performance. They take images or videos as inputs and predict the crowd density maps to estimate the number of people. Formally, given an input image , a model is designed to approximate the ground truth density map by solving the following optimization problem:
| (1) |
where denotes the number of input samples.
Several methods have been proposed as solutions to this problem. For instance, (Zhang et al., 2016) designed a Multi-column Convolutional Neural Network (MCNN) utilizing three network branches with different kernel sizes to map the image to its density map. (Li et al., 2018) replaced the multi-branch structure with dilated convolution and proposed an end-to-end Congested Scene Recognition Network (CSRNet). Further, (Liu et al., 2019b) introduced an adaptively Context-Aware Network (CAN) to capture the contextual information. From an optimization view, (Ma et al., 2019) designed a Bayesian Loss (BL) to construct a density contribution probability model and (Wang et al., 2020b) proposed optimal transport loss and total variation loss for Distribution Matching (DM-Count). Recently, (Song et al., 2021) proposed a Scale-Adaptive Selection Network (SASNet) which can automatically learn the internal correspondence between the scales and the feature levels and further proposed a pyramid region awareness loss to fix the most hard sub-regions. These estimation-based methods can be roughly divided into two categories based on the branches used for feature extraction: multi-column strategies, e.g., (Zhang et al., 2016; Onoro-Rubio and López-Sastre, 2016; Boominathan et al., 2016; Zhang et al., 2019; Song et al., 2021), and single-column strategies, e.g., (Sheng et al., 2016; Li et al., 2018; Liu et al., 2019b; Ma et al., 2019; Wang et al., 2020b).
Though having achieved promising results, (Gao et al., 2020) pointed out that current crowd counting models still suffer from multiple challenges. Specifically, current methods show unsatisfactory generalization across datasets. The overfitting problem has always been the hot potato in the field of deep learning. As for the estimation-based crowd counting methods, the performance of the predictor will inevitably reduce when generalizing the model trained on the specific data distribution to unseen scenes with non-uniform distributions. The reduction will cause sub-optimal results, though it may not lead to a collapse of the model. Moreover, they have weak robustness for complex backgrounds. That is, it is easily influenced by natural noises, e.g., adverse weather (rain, snow, haze, etc.), and objects with similar densities, e.g., hard samples that are similar to crowds (leaves, birds, etc). These drawbacks inject potential risks into real-world crowd counting systems.
2.2. Adversarial Attacks
Adversarial examples are inputs intentionally designed to mislead DNNs but are imperceptible to humans (Szegedy et al., 2013; Goodfellow et al., 2014). A long line of work has been devoted to performing adversarial attacks in different scenarios by generating imperceptible perturbations (Goodfellow et al., 2014; Madry et al., 2018; Chen et al., 2017; Brendel et al., 2017; Ilyas et al., 2018; Dong et al., 2018; Athalye et al., 2018; Dong et al., 2019b, a; Xie et al., 2019; Croce and Hein, 2020). These adversarial attacking methods are mainly divided into white-box and black-box manners. For white-box attacks, adversaries have complete knowledge of the target model and can fully access it. For example, (Szegedy et al., 2013) first introduced the L-BFGS method to generate adversarial examples. Subsequently, (Goodfellow et al., 2014) proposed the Fast Gradient Sign Method (FGSM), and (Madry et al., 2018) improved it and proposed the Projected Gradient Decent (PGD) method, which is currently the strongest first-order attack. All of them depend on access to the gradients of target models. For black-box attacks, adversaries have limited model knowledge and can not directly access the model. Black-box attacks can be divided into three categories, i.e., score-based, decision-based, and transfer-based. The score-based (Chen et al., 2017; Ilyas et al., 2018) and decision-based (Brendel et al., 2017; Dong et al., 2019b) attacks rely on querying either the output scores or labels of the target network, which limits their usability in the physical world. The transfer-based attacks generate adversarial perturbations on a source model and then transfer them to the unknown target model. A series of approaches (Dong et al., 2018, 2019a; Xie et al., 2019) have been proposed to improve the attack transferability among different models and achieve substantial results in the digital world. However, their attacking abilities will degenerate significantly when introduced into the physical world.
Besides perturbations, adversarial patches (Brown et al., 2017), where noises are confined to a small and localized patch region, have emerged for its easy accessibility in real-world scenarios. They have been widely studied and applied to attack different real-world applications. (Eykholt et al., 2018) mixed the attacking noises into the black and white stickers to attack the stop sign recognition devices. (Liu et al., 2019a) proposed the PS-GAN framework to generate scrawl-like adversarial patches to fool autonomous-driving systems. Recently, adversarial patches have been used to attack automatic checkout systems (Wang et al., 2021a) and surveillance cameras (Thys et al., 2019).
In this paper, we aim to generate an adversarial perturbation , constrained to a localized patch, to fool the crowd counting model for wrong predictions. Specifically, given the crowd counting model , we generate adversarial patch perturbation by maximizing the model loss as
| (2) |
where an adversarial example is composed of a clean image , an additive adversarial patch perturbation , and a location mask {0,1}n. It can be formulated as
| (3) |
where is the element-wise multiplication.
In the crowd counting scenario, rare attempts have been made to perform adversarial attacks. (Liu et al., 2019c) generated adversarial perturbations using FGSM and studied the defense against them in the digital world. (Wu et al., 2021) proposed the first and the only method APAM for adopting adversarial patches to attack crowd counting models. It aims to directly fit the target density map values, which are many times larger than the ground truth. However, it will overfit the specific model perception and thus tend to fall into local minima. For example, the multiplicative will not work for regions where the density value is 0. Through experiments, we found it fails to generate adversarial examples with strong transferability, which shows limited abilities for evaluating the black-box crowd counting models in practice. Instead, we do not constrain the target values, that is, they are expected to be infinitely far from the ground truth, and utilize scale and position perceptual properties to generate strongly transferable adversarial patches.
3. Threat Model
In this section, we aim to give a detailed description correlated to our proposed perceptual adversarial patches from several aspects, i.e., the possible attacking scenarios, the detailed attacking goal, the constraints to attackers, and the capabilities of attackers, therefore better benefiting the understanding of the proposed method at a practical level.
3.1. Possible Attacking Scenarios
As for adversarial attacking tasks, one of the most important questions that should be answered is whether they are practical or not. More precisely, the existence of the potential threats or benefits associated with the attacking method decides its value and significance.
When it comes to our proposed perceptual adversarial patches, we claim that they are applicable to multiple crowd-counting correlated scenarios, such as crowd monitoring in a particular place, population warning in a traffic scenario, and other similar scenarios. Note that we generate the adversarial patches with printing papers in this paper. However, besides utilizing paper patches as attacking vectors, we can also perform attacks by printing those adversarial textures on slogans, as shown in Figure 1 (a) and Figure 5, which strongly indicates the diverse attacking pathways of this novel perceptual adversarial patch generation framework.
3.2. Detailed Attacking Goal
Overall, we consider generating adversarial patches to attack density-map-estimation-based crowd counting models. As mentioned in Section 2, given a crowd counting model that takes an image as input, attackers aim to mislead into making wrong predictions, therefore outputting an inaccurate density map far from the ground-truth density map. And the achievement of this goal depends on the design of the adversarial patches.
Further, there are two directions for misleading the crowd counting model into wrong density maps. One is leading it to output more crowd counting values, i.e., to increase the predicted crowd numbers. Another is leading it to output fewer crowd counting values, i.e., to decrease the predicted crowd numbers. In this paper, we respectively investigate both the increasing approach and decreasing approach to comprehensively demonstrate the strong attacking ability of the proposed perceptual adversarial patch generation framework. The experimental results of the increasing approach are mainly shown in Section 5.2 and 5.3 and those of the decreasing approach are shown in Section 5.4.
3.3. Attackers’ Constraint
With full consideration of the crowd counting scenarios in the physical world, we have to take note of the complexity and dynamics of the real-world conditions, such as unknown model architectures, unknown parameters, and unknown crowd densities. Therefore, it is necessary for us to simulate the real conditions as far as possible. To this end, we consider the more comprehensive experimental conditions, which consist of white-box and black-box settings.
In white-box experiments, we take target models, i.e., the models that might be attacked, as source models during the training process. That is, the attackers could totally access the model information, including middle-layer features, output density maps, gradient information, etc. In black-box settings, we impose the strictest constraint on attackers, which means that the attackers could acquire little knowledge about the target models. To be more practical, we consider the transfer-based attack. More precisely, we just generate adversarial patches based on a certain model and then perform attacks without any other additional actions, e.g., fine-tuning or query. Therefore, an essential guarantee for successful attacks is strong inter-model transferability. Based on that, we could guarantee that all the information of target models is unavailable to the attackers in black-box settings, which helps us to conduct the strictest measures for simulating the physical scenarios. Besides, since we aim to generate adversarial patches, it is important for us to constrain the perturbed ratio, i.e., the ratio of perturbed pixels to all pixels. In this paper, we only perturb pixels (i.e., nearly 0.83% of a certain image) and constrain their shapes by the mask in Equation (3).
3.4. Attackers’ Capability
Most attackers who perform typical adversarial attacks (i.e., adversarial examples) could be classified into two categories:, adversarial perturbations and adversarial patches. The adversarial perturbations always have an invisible appearance to human beings, whereas they also show weak attacking ability in real scenarios due to the domain gap during re-sampling. Therefore, in this paper, we aim to generate adversarial patches, which are confined to patch-like textures without ball constraint. These kinds of adversarial noises could be more threatening in our crowd counting tasks, especially in the physical world.
As for the attack workflow, we basically follow a classic attacking paradigm. Specifically, an attacker needs to first generate an adversarial patch by training it on certain datasets. Then, one can produce these adversarial textures by printing them out in the physical world. Also, adversaries could clip or shear the printed adversarial patches into particular shapes, such as the “human-head-like patch” that is shown in Figure 1 (a). Finally, attackers could simply stick the handled adversarial patches into a target object and attack the deployed model in the corresponding scenarios. To sum up, the attacking paradigm of attacking with our perceptual adversarial patches can be simply described as a “generating-producing-processing-attacking” approach.
4. Perceptual Adversarial Patch Generation Framework
4.1. Overview
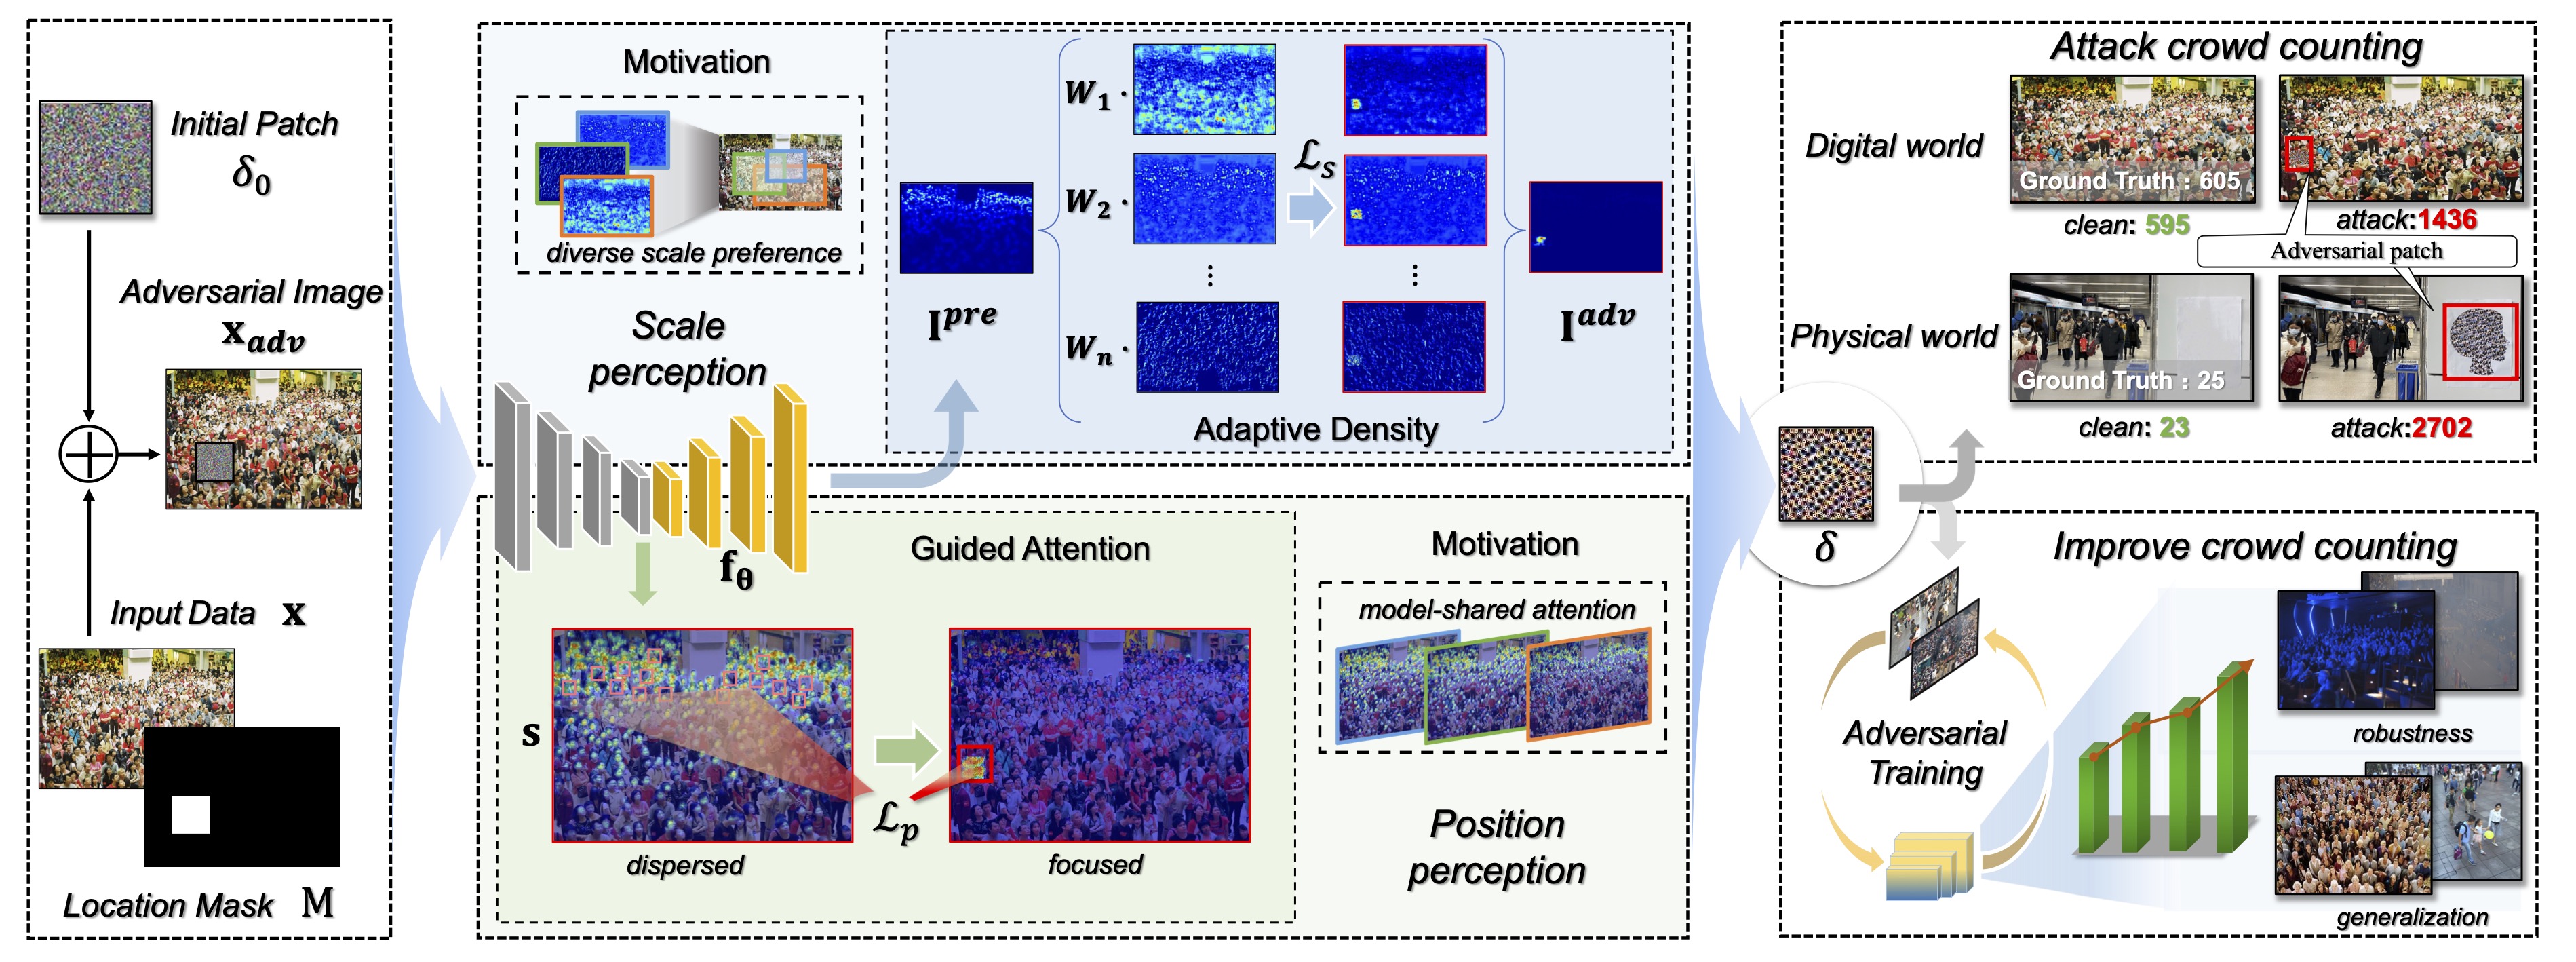
Existing studies reveal that the model-invariant characteristics largely influence the transferability of attacks (Dong et al., 2019a; Lennon et al., 2021). Thus, we aim to find the model-shared characteristics that highly influence model performance and then learn model-invariant features from them to generate transferable adversarial patches across models. Driven by this belief, we propose the Perceptual Adversarial Patch (PAP) generation framework by introducing adaptive density and guided attention to help adversarial patches exploit the model’s intrinsic perceptual characteristics, i.e., scale perception and position perception, so as to capture the model-invariant features. Thus, our generated adversarial patches could enjoy better transfer attacking abilities. The overall framework is shown in Figure 3.
4.2. Scale Perception via Adaptive Density
(Zhang et al., 2016) illustrated that the variation of crowd scales highly challenges the design and performance of crowd counting models. It is difficult for a single model to well recognize crowd features at all scales, and different models, more or less, tend to show different crowd scale perception preferences. Therefore, capturing the scale-invariant features could benefit the adversarial patches for better adaptation to models with different crowd scale perceptions, resulting in stronger transferability. In order to achieve the objective, we introduce the adaptive density during patch generation to dynamically adjust the contribution of features with different scales.
Simply generating perturbations via Eqn (3) will spontaneously capture features that overfit the specific scale perception of the source model, which leads to weak transferability. Therefore, we aim to enhance its scale capture among different models, especially scales that the source model does not perceive well. Given an input image , we generate the ground truth density map by the geometry-adaptive kernels for the highly congested scenes, following the method in (Zhang et al., 2016). The geometry-adaptive kernel is defined as:
| (4) |
For the input image , if there is a head at the pixel , it can be represented as a delta function . is the number of heads contained in . Then we convolve it with a Gaussian kernel with the standard deviation , where indicates the average distance of nearest neighbors. In practice, we set and , following the configuration in (Zhang et al., 2016). For the sparse scenes, we use a constant to blur all the annotations.
By smoothing each head annotation with a Gaussian kernel, the ground truth density map considers the spatial distribution of all input images and thus contains the full crowd scale information of the scenario. We, therefore, propose the density weights matrix as follows:
| (5) |
where denotes the Sigmoid function. Apparently, for the crowd region with specific scales that are included in the ground truth while not perceived by the source model based on the density map, will be increased to a higher value. In other words, the crowd scales perceived weakly by the model will be granted higher weights, which will help the patches to better adapt to them.
Since our goal is to mislead the model to wrong predictions, we intuitively ought to force the model to recognize the adversarial patches as crowds to a large extent. Therefore, based on the weighted predicted density map, we introduce the scale perception loss as follows:
| (6) |
where and are the value at of the and the predicted density map. Through the density weights, our adversarial patch could capture the scale-invariant features and better adapt to the scale perceptions of different models, which will benefit the transferability.
4.3. Position Perception via Guided Attention
Previous work reveals that different models share similar positional perceptions towards the same image (Wang et al., 2021b). As for crowd counting models, we find that they also have similar spatially dispersed attention patterns at the same crowd positions. Therefore, we disturb the position perception of the target model by attracting the model-shared attention patterns to the adversarial patch region through salient map aggregation. In this way, the generated adversarial patches can capture the position-invariant features and perform better transferable attacks.
In particular, several visual attention mechanisms (Zhou et al., 2016; Selvaraju et al., 2017; Chattopadhay et al., 2018) have been proposed to explain deep learning behaviors. Grad-CAM (Selvaraju et al., 2017) is a class-discriminative localization technique that can generate visual explanations from any CNN-based network. Given an input image and a model, the method could produce a salient map with hot regions where the pixel values are higher. It reveals that the model will pay more attention to the regions which are meaningful to the final predictions. When it comes to crowd counting tasks, the density map of a certain image to be predicted also shows significant differences among diverse sub-parts, which inspires us to regard this observation as the density perception of models. Therefore, by introducing the idea of the Grad-CAM, we elaborately design to calculate the density-guided attention map for helping the generated adversarial patches to disturb the position perception and capture the position-invariant features in turn, leading to better transferable attacks. Specifically, given the image and a target model , we compute the attention map by introducing a density attention module as:
| (7) | ||||
where , is the pixel value at position of the th feature map, denotes the ReLU function, and is for global average pooling. The conventional Grad-CAM computes the gradients of the scores for specific classes, while we utilize the summary of density values, i.e., the people number, to obtain the gradients. Thus, we can generate the salient map, which can be used to explain the decision basis of the crowd counting models.
In order to successfully attack a crowd counting model, we draw the model’s attention to our adversarial patches and thus distract it from other crowds. We introduce the position perception loss as follows, which directly increases the attention values in the patch region:
| (8) |
where is the pixel value at of the attention map. Thus, different models with similar salient attention areas will focus on the adversarial patches and make the wrong predictions.
4.4. Overall Optimization
In this section, we aim to give a brief operation procedure of our proposed perceptual adversarial patches, therefore establishing an integral cognition of the novel crowd counting attacking method for readers.
In general, given a target model , hyperparameters , , , dataset , and initial patch noise , we generate the adversarial patches by jointly optimizing the scale perception loss and position perception loss . The overall optimization for generating the transferable adversarial patches could be formulated by the following equation:
| (9) |
where controls the contributions of each term. Specifically, we totally employ the gradient-based iteration algorithm to optimize our adversarial patches. In each iteration, we first generate adversarial examples with an initial adversarial patch at a random position; then we conduct the forward pass to obtain the predicted density map; next, we derive the density weights matrix and attention map , and subsequently compute the scale perception loss and position perception loss; finally, we update the adversarial patch through the back-propagation algorithm (Rumelhart et al., 1986) to lead the model to wrong density predictions and enhance the model-shared attention towards the patch region. By strictly conducting the described operation procedures, we can efficiently generate adversarial patches with strong transferability by exploiting the model-shared perceptual features, i.e., scale perception and position perception. The overall detailed training algorithm can be described as Algorithm 1.
| MAE / MSE | Target Model | ||||||
| Source model | Method | MCNN | CSRNet | CAN | BL | DM-Count | SASNet |
| Part A | |||||||
| Clean | 108.0 / 165.0 | 67.0 / 105.2 | 59.9 / 94.1 | 61.8 / 94.1 | 58.2 / 93.2 | 52.8 / 86.2 | |
| MCNN | APAM | 317.7 / 378.5 | 68.9 / 107.2 | 62.9 / 99.3 | 63.7 / 96.2 | 61.4 / 96.4 | 54.2 / 87.9 |
| Ours | 908.7 / 989.1 | 69.6 / 109.3 | 62.9 / 101.3 | 64.1 / 96.9 | 62.0 / 96.8 | 54.3 / 89.9 | |
| CSRNet | APAM | 124.6 / 174.8 | 312.5 / 396.4 | 71.3 / 100.9 | 250.8 / 265.2 | 131.1 / 151.4 | 53.7 / 87.9 |
| Ours | 147.0 / 190.8 | 568.4 / 613.8 | 212.5 / 242.8 | 388.1 / 401.4 | 249.1 / 263.6 | 56.3 / 89.5 | |
| CAN | APAM | 133.5 / 180.5 | 99.9 / 128.8 | 386.5 / 500.0 | 272.1 / 285.6 | 144.6 / 165.1 | 53.9 / 88.5 |
| Ours | 147.6 / 191.5 | 321.0 / 341.7 | 513.3 / 545.3 | 412.7 / 424.8 | 218.8 / 233.9 | 56.2 / 88.8 | |
| BL | APAM | 115.1 / 168.6 | 69.9 / 106.2 | 62.9 / 97.0 | 138.3 / 160.0 | 103.5 / 130.3 | 54.0 / 88.0 |
| Ours | 119.0 / 170.7 | 79.6 / 111.5 | 73.1 / 106.6 | 1090.9 / 1171.6 | 519.7 / 541.6 | 54.5 / 90.0 | |
| DM-Count | APAM | 115.0 / 169.0 | 69.6 / 107.3 | 62.2 / 98.4 | 81.2 / 113.7 | 112.5 / 147.5 | 54.1 / 88.1 |
| Ours | 115.6 / 169.6 | 87.6 / 119.3 | 82.8 / 115.0 | 747.5 / 793.6 | 751.3 / 784.9 | 56.5 / 90.8 | |
| SASNet | APAM | 110.5 / 169.1 | 68.3 / 108.4 | 61.7 / 99.3 | 63.6 / 98.4 | 62.3 / 99.7 | 58.8 / 99.8 |
| Ours | 112.8 / 169.4 | 69.5 / 109.0 | 62.6 / 100.3 | 69.9 / 99.8 | 75.1 / 105.4 | 200.0 / 220.3 | |
| Part B | |||||||
| Clean | 28.3 / 38.7 | 9.2 / 14.7 | 7.5 / 11.9 | 7.6 / 12.0 | 7.3 / 11.8 | 6.4 / 9.9 | |
| MCNN | APAM | 29.1 / 39.7 | 10.8 / 16.0 | 8.4 / 12.5 | 7.7 / 12.8 | 7.7 / 12.1 | 7.0 / 10.6 |
| Ours | 442.6 / 445.2 | 11.0 / 16.9 | 26.6 / 28.8 | 7.8 / 13.3 | 7.7 / 12.5 | 7.2 / 10.9 | |
| CSRNet | APAM | 66.7 / 72.8 | 83.3 / 87.4 | 21.7 / 24.1 | 21.4 / 25.0 | 8.3 / 13.0 | 6.9 / 10.5 |
| Ours | 162.8 / 167.9 | 948.2 / 961.3 | 112.0 / 113.8 | 48.4 / 50.7 | 27.4 / 37.3 | 7.2 / 10.9 | |
| CAN | APAM | 28.9 / 42.3 | 10.6 / 15.9 | 8.3 / 12.5 | 7.7 / 12.9 | 7.6 / 12.0 | 6.9 / 10.5 |
| Ours | 29.0 / 42.7 | 11.2 / 17.3 | 37.0 / 39.4 | 7.8 / 13.3 | 7.8 / 12.6 | 7.2 / 11.0 | |
| BL | APAM | 53.5 / 59.6 | 10.9 / 16.1 | 9.8 / 13.5 | 13.9 / 18.8 | 7.7 / 12.1 | 6.9 / 10.5 |
| Ours | 69.3 / 75.0 | 28.4 / 32.9 | 81.0 / 82.4 | 146.5 / 147.5 | 58.3 / 69.9 | 7.2 / 10.9 | |
| DM-Count | APAM | 47.9 / 54.4 | 15.6 / 20.5 | 12.0 / 15.3 | 7.9 / 13.1 | 9.8 / 16.7 | 6.9 / 10.5 |
| Ours | 65.2 / 71.1 | 162.6 / 167.0 | 72.7 / 74.2 | 83.6 / 84.9 | 295.6 / 297.1 | 7.2 / 10.9 | |
| SASNet | APAM | 33.9 / 41.8 | 10.4 / 16.5 | 10.7 / 14.7 | 9.4 / 14.6 | 7.7 / 12.7 | 7.0 / 10.9 |
| Ours | 95.3 / 101.2 | 177.2 / 180.5 | 114.9 / 116.2 | 39.7 / 42.3 | 10.4 / 16.1 | 293.0 / 295.3 | |
5. Evaluation of PAP Attack
In this section, we first outline the experimental settings and then illustrate the effectiveness of our proposed attacking method by thorough evaluations in both the digital and physical world. Finally, we provide some additional discussions.
5.1. Experimental Settings
Datasets.
Following (Wu et al., 2021), we conduct experiments on the Shanghai Tech dataset (Zhang et al., 2016), a commonly used large-scale crowd counting dataset. It consists of 1198 annotated crowd images with 330,165 annotated people. The dataset is divided into Part A and Part B. Part A contains 300 samples for training and 182 samples for testing, where images were collected from the Internet. Part B contains 400 samples for training and 316 samples for testing, where images were collected on the busy streets of Shanghai.
Target models.
We employ six commonly-used and SOTA density-map-estimation-based crowd counting models to attack: MCNN (Zhang et al., 2016), CSRNet (Li et al., 2018), CAN (Liu et al., 2019b), BL (Ma et al., 2019), DM-Count (Wang et al., 2020b), and SASNet (Song et al., 2021). Among them, (Zhang et al., 2016; Song et al., 2021) are multi-column methods while the others are single-column methods. In addition to the vanilla model, we also conduct attacks towards the empirical defensive method based on adversarial training (Madry et al., 2018) and certified defense against crowd counting based on randomized ablation (Wu et al., 2021) 222Implementation details and results can be found in appendix section B.
Evaluation metrics.
We use the widely-used crowd counting metrics Mean Absolute Error (MAE) and Mean Squared Error (MSE) following (Li et al., 2018) for evaluation, which are defined as:
| (10) |
where N is the size of the test set, is the ground truth of counting and represents the estimated count. For attacks, higher MAE and MSE values indicate stronger adversarial attacks.
Baselines.
We compare with the only adversarial patch generation method for crowd counting, i.e., APAM (Wu et al., 2021). We use the officially released codes and keep the same settings (size, shape, position, etc) for fair comparisons. Besides, we also compare with several plug-and-play transferable attacks (MIGM (Dong et al., 2018), NIGM (Lin et al., 2019), TI-NIGM (Dong et al., 2019a), NAA (Zhang et al., 2022)) and ensemble-based attacks (Avg-Dens, MGAA (Yuan et al., 2021)).
Implementation details.
We randomly initialize a square adversarial patch with a fixed size and conduct training with batch size 1 by iterations every epoch with an attack step size of 0.01, and a maximum of 2 epochs. The position and orientation of the patch are randomly chosen, which makes our adversarial patches able to universally attack all scenes. We set the position perception loss weight as 0.01. We give a detailed discussion related to the effect of and different patch shapes in Section 5.4. All of our codes are implemented in PyTorch. We conduct all experiments on an NVIDIA Tesla V100 GPU cluster.
| MAE / MSE | Target Model | |||||
| Method | MCNN | CSRNet | CAN | BL | DM-Count | SASNet |
| MIGM | 145.2 / 188.9 | 255.6 / 273.9 | 104.2 / 128.8 | 703.9 / 713.2 | 491.9 / 504.9 | 55.9 / 90.3 |
| NIGM | 146.9 / 190.2 | 267.2 / 285.3 | 87.4 / 110.7 | 701.0 / 731.2 | 511.7 / 526.5 | 55.8 / 90.0 |
| TI-NIGM | 111.2 / 169.3 | 74.5 / 109.8 | 65.4 / 98.1 | 75.8 / 104.3 | 77.9 / 107.3 | 54.5 / 89.9 |
| NAA | 139.3 / 184.5 | 257.3 / 276.9 | 93.8 / 120.4 | 737.7 / 746.0 | 508.9 / 522.1 | 56.4 / 90.8 |
| Avg-Dens | 136.0 / 182.6 | 220.2 / 238.9 | 128.8 / 158.5 | 650.7 / 660.4 | 403.3 / 417.4 | 58.1 / 90.9 |
| MGAA | 135.3 / 181.2 | 205.4 / 225.6 | 118.1 / 148.7 | 685.5 / 695.7 | 416.2 / 430.8 | 56.5 / 90.3 |
| Ours | 147.6 / 191.5 | 321.0 / 341.7 | 212.5 / 242.8 | 747.5 / 793.6 | 519.7 / 541.6 | 56.5 / 90.8 |
5.2. Digital World Attack
We evaluate the performance of our adversarial patches in the digital world under both white-box and black-box settings. Due to the limited space, we hereby only report the results of adversarial patches with the size of which only accounts for 0.83% of the size of images in the Shanghai Tech dataset 333For other patch sizes, please refer to appendix section A. For a fair comparison with APAM, we here report the results of attacks that increase the counting number. Besides, we can also generate adversarial patches that decrease the crowd counting number and defer the results in Section 5.4.
White-box attacks.
For the white-box attack, we generate adversarial patches using the specific target model and perform attacks on it accordingly. As shown in Table 1 (diagonal), in contrast to APAM, our method achieves higher MAE and MSE in the white-box settings on different models (up to +1029.1 MAE and +1077.5 MSE on BL). Therefore, our method is able to generate adversarial patches with a much stronger white-box attacking ability.
Black-box attacks.
In the black-box setting, we first generate adversarial patches based on one specific source model, and then transfer the attacks to other models and test their attacking ability. Tables 1 and 2 list the black-box attacking results with a series of patch attacks and transferable attacks. Regarding MIGM, NIGM, TI-NIGM, and NAA and Ours in Table 2, we select the highest MAE/MSE of a target model from the results of five source models444Implementation details and more results can be found in appendix section C. In Figure 4, we plot the model overestimation curves with a sweep of . Specifically, for each target model, we consider the source model which possesses the best black-box attacking performance referring to Table 1, and calculate the percentage of the samples on which the model overestimation value, i.e., , exceeds the . Through the results, we can draw some observations:
(1) Compared with APAM, we achieve stronger black-box attacking ability for different models and outperform it by large margins (up to +685.7 MAE, +699.5 MSE from DM-Count to BL). According to Figure 4, almost all model overestimation values achieve above 100 for 80% of the samples.
(2) Compared with other transferable attacks, we significantly beat them except for being slightly worse than Avg-Dens on SASNet. We note that TI-NIGM has a much weaker attacking ability, which illustrates that the translation-invariant method may not be well suitable for the crowd counting task.
(3) We found that adversarial attacks could hardly transfer between multi-column (e.g., MCNN and SASNet) and single-column models. We conjecture the reasons might be those multi-column models have more complex architectures with several branches and more information redundancy (Li et al., 2018). These architectures might cause the weak black-box transferability of adversarial attacks, and we leave the detailed analyses as future work.
5.3. Physical World Attack
Here, we further evaluate the practical performance of our adversarial patches in the physical world, which is more challenging and meaningful. We first generated an adversarial patch using the CSRNet model and printed it. Then, we took 110 pictures with an iPhone 11 mobile phone by holding them or sticking them as a flag or poster. To prove its effectiveness in the complex real-world scenario, we took photos in various settings, including:
patch sizes: resizing the generated patches to [5cm5cm, 40cm40cm];
distances: placing the camera [1m, 5m] away from the patch;
view angles and heights: considering special view angle offsets, e.g., left or right deflection, and special view heights, e.g., top or bottom view;
patch shapes: cutting the patch into the shape of a cat, bird, plane and so on;
illuminations: considering special illumination conditions such as dusk and darkness;
crowd densities: considering various density conditions, including scenes with no people and very congested scenarios.
For each setting, we took photos in different places (schools, cafes, subway stations, etc.). All pictures were taken with the same patch texture, that is, there is no need to re-generate the adversarial patch for different scenes. We evaluate the performance using a black-box SoTA crowd counting model DM-Count and the error caused by our adversarial patch is able to achieve 135.4 for MAE and 178.9 for MSE. As shown in Figure 5, the generated adversarial patches are quite natural in the real world and will pose safety problems when deployed in practice.
5.4. Discussion
In this section, we first analyze the effectiveness of the two losses. Then, we discuss the influence of different patch shapes and attacking effects across datasets. Finally, we propose the method that utilizes our PAP to maliciously decrease the predicted crowd counting numbers.
The effect of the two loss functions
We conduct ablation studies to further investigate the contributions of scale perception and position perception, i.e., and . Thus, we generate adversarial patches with or without these two losses from one specific model and then perform transfer attacks to other models on the Shanghai Tech Part A. Due to the limited space, we here only report the results of the source model CSRNet 555More results can be found in appendix section D.
| Loss | MCNN | CAN | BL | DM-Count | SASNet |
|---|---|---|---|---|---|
| None | 108.0 / 165.0 | 59.9 / 94.1 | 61.8 / 94.1 | 58.2 / 93.2 | 52.8 / 86.2 |
| w/o | 138.4 / 184.1 | 185.4 / 216.6 | 374.0 / 386.9 | 239.4 / 254.9 | 54.6 / 88.8 |
| 143.3 / 188.3 | 190.4 / 223.6 | 385.5 / 397.4 | 240.3 / 255.8 | 54.8 / 88.9 | |
| 116.2 / 167.9 | 94.6 / 121.5 | 251.9 / 266.3 | 152.9 / 169.8 | 54.3 / 87.0 | |
| 147.0 / 190.8 | 212.5 / 242.8 | 388.1 / 401.4 | 249.1 / 263.6 | 56.3 / 89.5 |
As shown in Table 3, compared with the clean scenario, the MAE and MSE values for attacking all target models increase after adding the perception loss . This proves that the patch could successfully mislead the model under the drive of the loss item. Furthermore, we removed the adaptive density weight matrix from the loss, i.e., the scale perception loss was represented only by the summary of predicted density values. We found that the MAE and MSE have a significant drop, which validates that the density weight matrix plays a key role in benefiting the transferability. Meanwhile, the transfer attacking ability is also improved after introducing the position loss . We achieve the highest MAE and MSE values when two modules are added (), which illustrates that the model scale perception and position perception are not completely independent, and the utilization of both can play a superimposed role in the attacking transferability. Thus, the above experimental results demonstrate the effectiveness of our dual perception loss for improving the transferability of attacks.
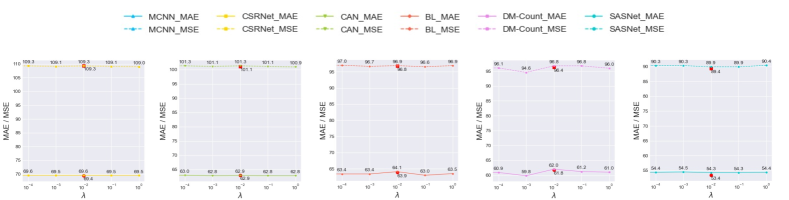
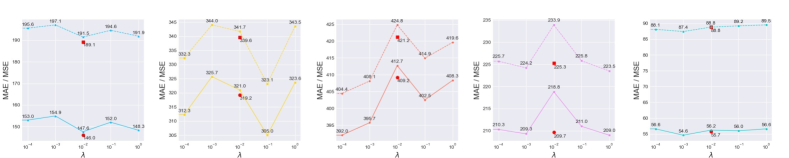
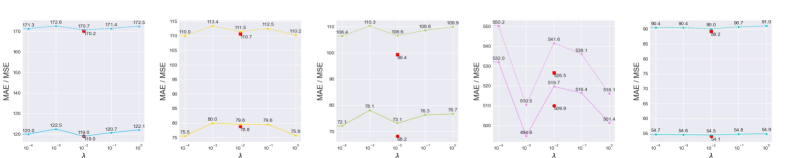
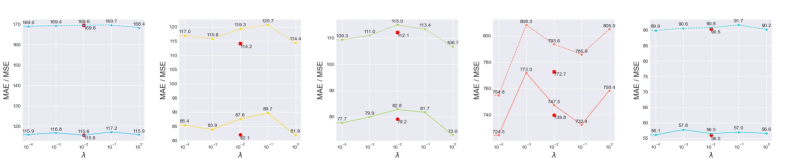
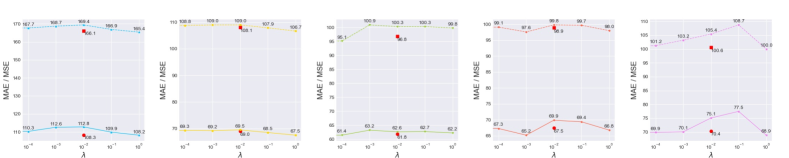
Ulteriorly, we analyze the influence of the hyperparameter . Refer to the above, we conduct transfer black-box attacks on the Shanghai Tech Part A and set the as , , , , , and . As illustrated in Figure 6, the MAE and MSE will mostly increase after introducing the position perception loss. Nevertheless, according to the results, we found that excessively small or large values might cause the decline of the transfer attacking ability. Based on that, we set as during patch optimization.
The influence of the patch shapes
We have considered several different patch shapes (e.g., cat, bird) in the physical world, and they show comparable performances. Here, we conduct additional ablations to further evaluate the influence of various patch shapes. We conduct a toy experiment on the Shanghai Tech Part A. Specifically, we clip the adversarial patches into three different shapes including circular, square, and trapezoid under similar patch sizes (0.83% of the image size). Then we evaluate their transfer attack performance based on the source model CSRNet. As illustrated in Table 4, patches with different shapes show similar attacking results. Thus, we conclude that the shape does not affect transferability.
| Shape | MCNN | CAN | BL | DM-Count | SASNet |
|---|---|---|---|---|---|
| Square | 147.0 / 190.8 | 212.5 / 242.8 | 388.1 / 401.4 | 249.1 / 263.6 | 56.3 / 89.5 |
| Circular | 154.7 / 196.0 | 216.8 / 248.9 | 377.2 / 398.6 | 251.2 / 264.5 | 54.6 / 91.1 |
| Trapezoid | 151.6 / 193.1 | 215.2 / 255.8 | 380.2 / 401.8 | 250.0 / 266.1 | 55.8 / 93.1 |
| MAE / MSE | Target Model | |||||
|---|---|---|---|---|---|---|
| Source Model | MCNN | CSRNet | CAN | BL | DM-Count | SASNet |
| Clean | 108.0 / 165.0 | 67.0 / 105.2 | 59.9 / 94.1 | 61.8 / 94.1 | 58.2 / 93.2 | 52.8 / 86.2 |
| CSRNet trained on Part A | 147.0 / 190.8 | – | 212.5 / 242.8 | 388.1 / 401.4 | 249.1 / 263.6 | 56.3 / 89.5 |
| CSRNet trained on Part B | 132.1 / 179.1 | 155.0 / 174.3 | 200.9 / 216.7 | 264.7 / 279.4 | 155.8 / 172.8 | 53.4 / 86.9 |
| MAE / MSE | Target Model | |||||
| Source Model | MCNN | CSRNet | CAN | BL | DM-Count | SASNet |
| Clean | 28.3 / 38.7 | 9.2 / 14.7 | 7.5 / 11.9 | 7.6 / 12.0 | 7.3 / 11.8 | 6.4 / 9.9 |
| CSRNet trained on Part A | 139.5 / 144.5 | 114.7 / 153.4 | 60.8 / 67.6 | 39.1 / 42.4 | 17.9 / 22.3 | 7.1 / 11.0 |
| CSRNet trained on Part B | 162.8 / 167.9 | – | 112.0 / 113.8 | 48.4 / 50.7 | 27.4 / 37.3 | 7.2 / 10.9 |
| MAE / MSE | Target Model | |||||
| Source model | MCNN | CSRNet | CAN | BL | DM-Count | SASNet |
| Clean | 108.0 / 165.0 | 67.0 / 105.2 | 59.9 / 94.1 | 61.8 / 94.1 | 58.2 / 93.2 | 52.8 / 86.2 |
| MCNN | 121.5 / 180.7 | 69.7 / 109.6 | 63.0 / 101.7 | 63.3 / 97.4 | 61.9 / 98.5 | 54.0 / 90.1 |
| CSRNet | 113.5 / 167.6 | 72.9 / 114.5 | 65.4 / 105.6 | 64.2 / 98.1 | 62.4 / 98.5 | 55.1 / 92.6 |
| CAN | 122.1 / 172.3 | 70.8 / 110.7 | 67.2 / 109.3 | 98.9 / 123.7 | 72.4 / 108.8 | 54.8 / 91.2 |
| BL | 109.5 / 167.6 | 70.1 / 110.0 | 63.6 / 102.3 | 64.7 / 99.2 | 62.5 / 99.4 | 54.7 / 91.1 |
| DM-Count | 110.2 / 168.5 | 70.0 / 110.3 | 63.8 / 102.7 | 65.3 / 100.4 | 66.2 / 104.8 | 54.1 / 90.8 |
| SASNet | 110.5 / 168.1 | 69.3 / 109.4 | 61.9 / 98.2 | 61.9 / 96.3 | 61.3 / 96.3 | 55.9 / 91.1 |
Effectiveness across different datasets.
In practice, it is highly impossible that an adversary would have access to the training set used for training the target model. The utility of one attack will become poor if it does not generalize well across different datasets. We conduct a toy experiment using the various Parts of the Shanghai Tech dataset in order to evaluate the effectiveness of our adversarial patches under different data distributions. Using CSRNet, we first train our patches on one Part and then test them on the other. Note that Part A and Part B follow different distributions and the test models are only trained on data from one part.
As illustrated in Table 6(b), when tested across datasets, the performance of the black-box attack degrades slightly, however, it is still adequate to pose a threat to the clean scenes, demonstrating its potential threats in real-world applications.
Decreasing crowd counting numbers with PAP
In the above section, we only report the results of attacks that increase the counting numbers. Besides, we can also generate adversarial patches that decrease the crowd counting numbers. Intuitively, in order to mislead the model to produce the zero-density response, we need to force the model to hardly recognize the crowd features and pay more attention to other non-people regions. Thus, we could simply modify the optimization direction as follows,
| (11) |
where is the scale perception loss and is the position perception loss. By minimizing the scale perception loss, we can generate our adversarial patches by weakening the model recognition for the crowds under different scales. As for minimizing the position perception loss, the crowd density guided model-shared attention will be suppressed while the attention towards the other objects will be enhanced. Therefore, based on the two loss items, our adversarial patches may also successfully lead the model to wrong estimations by decreasing the counting numbers.
To evaluate the effectiveness, we conduct experiments on the Shanghai Tech Part A. Except for the optimization direction, we followed all the settings in Section 5.1. Table 6 lists the attacking results. From the table, we found an interesting phenomenon that the black-box attacks may be stronger than the white-box for decreasing the predicted density (such as for BL and DM-Count, generating adversarial examples using CAN is more reliable). Further, we plot the overestimation percentage in Figure 7. Compared with Table 1 and Figure 4, adversarial patches aiming to decrease the counting numbers have relatively weaker attacking ability than those for increasing the density. We will study how to expand the adversarial impact in future work.
6. Improving Crowd Counting with Perceptual Adversarial Patches
6.1. Overview
Recent studies have revealed the fact that crowd counting models are still facing several challenges, including weak generalization abilities across datasets and robustness on complex backgrounds, which cast a shadow over the applications in practice (Gao et al., 2020). Some studies (Xie et al., 2020; Chen et al., 2021) have shown that adversarial examples can also be used to improve model performance if harnessed in the right manner. Inspired by them, we aim to take the advantage of our perceptual adversarial patches and use them to improve the performance of crowd counting models. However, to improve image recognition and object detection models, current studies (Xie et al., 2020; Chen et al., 2021) adopt multiple Batch Normalization (BN) branches to respectively handle clean and adversarial examples during adversarial training, which modifies the model architectures. They cannot be simply implemented in the crowd counting task, where most models do not have BN layers. Therefore, we adversarially train crowd counting models with our perceptual adversarial patches to improve the model performance without modifying architectures.
Specifically, we modify the standard adversarial training scheme (Madry et al., 2018) to adapt our PAP framework, which can be defined as follows:
| (12) |
where is the adversarial example (combined by and via Eqn (3), is the ground truth density map, and is the crowd counting model parameters. In the max manner, refers to the loss for patch generation while it represents the loss for model optimization in the min manner. In practice, instead of solving the min-max optimization problem iteratively, we simply generate all the adversarial examples via the pre-trained model at the beginning, which could achieve better performance and take less time 666More analyses can be found in appendix section E.
Our perceptual adversarial patches can attack models under different crowd scale perceptions and disturb them to focus on the wrong position perception regions. Adversarial training with our patches is able to further enhance the model for the tolerance of perturbations brought from scales and positions. In other words, the enhanced crowd counting model with our adversarial patches could increase the perception generalization for multiple crowd scales and rectify their perceptions by better focusing on the crowd itself under noises. Therefore, it will better generalize to unseen scenarios with different crowd scales and pay more attention to crowd regions rather than complex backgrounds in natural scenes.
In the following sections, we aim to prove the effectiveness of our perceptual adversarial patches in benefiting the model performance. Specifically, we evaluate the generalization ability across datasets and robustness towards complex backgrounds of the enhanced crowd counting models.
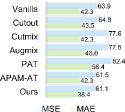
| Method | Shanghai Tech Part B | UCF-CC-50 | Crowd Surveillance |
|---|---|---|---|
| Vanilla | 22.8 / 34.3 | 417.7 / 664.2 | 24.9 / 52.2 |
| Cutout | 18.0 / 27.9 | 396.7 / 615.0 | 19.5 / 40.0 |
| Cutmix | 22.1 / 34.1 | 416.9 / 632.6 | 19.7 / 37.9 |
| Augmix | 17.9 / 29.0 | 467.2 / 672.3 | 13.6 / 35.4 |
| PAT | 23.7 / 35.1 | 443.0 / 625.5 | 30.6 / 69.1 |
| APAM-AT | 23.6 / 35.1 | 421.9 / 664.9 | 25.0 / 53.2 |
| Ours | 17.5 / 27.5 | 382.0 / 594.9 | 12.7 / 30.9 |
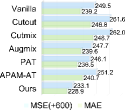
| Method | Shanghai Tech Part A | UCF-CC-50 | Crowd Surveillance |
|---|---|---|---|
| Vanilla | 142.4 / 241.3 | 1093.9 / 1405.6 | 11.2 / 22.7 |
| Cutout | 153.1 / 272.3 | 1135.0 / 1454.5 | 11.5 / 23.9 |
| Cutmix | 147.5 / 241.9 | 1129.4 / 1437.1 | 12.0 / 22.6 |
| Augmix | 145.3 / 243.2 | 1060.2 / 1385.2 | 11.0 / 23.5 |
| PAT | 145.7 / 249.6 | 1112.6 / 1445.9 | 13.5 / 25.8 |
| APAM-AT | 142.6 / 243.4 | 1145.3 / 1459.6 | 13.1 / 24.8 |
| Ours | 129.8 / 220.5 | 717.9 / 1050.7 | 10.8 / 22.6 |
Experimental settings.
Following the settings in Section 5.1, we first generate adversarial patches on each image in the original training set and mix them to obtain the new training set (the ratio of adversarial examples and clean examples is 1:1). Then, we train the crowd counting model using the new training set. We select the multi-column based model MCNN and single-column based model DM-Count for evaluation and compare with two adversarial training methods: adversarial training with APAM generated adversarial patches (APAM-AT), PGD- adversarial training (Madry et al., 2018) (PAT, ), and three data augmentation methods: Cutout (DeVries and Taylor, 2017), Cutmix (Yun et al., 2019), and Augmix (Hendrycks et al., 2019). We faithfully follow the original settings for better implementation of the mentioned strategies. Moreover, we conduct the above methods on the same samples and use the same amount of extra data to train models for fair comparisons. Due to limited pages, we here only report the results of DM-Count 777More results can be found in appendix section F.
6.2. Generalization across Datasets
As images in different parts of the Shanghai Tech dataset were taken from different scenarios in different ways, we use Part A and Part B to conduct the cross-dataset performance evaluation. Besides, we also test the model performance on two other commonly-used crowd counting datasets, i.e., UCF-CC-50 (Idrees et al., 2013) and Crowd Surveillance (Yan et al., 2019).
As shown in Table 8(b), models trained with our PAP can significantly improve the generalization ability across datasets by large margins (at most -376.0 MAE and -354.9 MSE). We also outperform the adversarial training baselines (e.g., APAM-AT and PAT) which deteriorate the model generalization and the data augmentation techniques (e.g., Cutout, Cutmix, and Augmix).
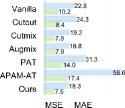
6.3. Robustness for Complex Backgrounds
Following (Gao et al., 2020), we validate the model performance using three test sets including: 100 distractors and 191 adverse weather samples in JHU-CROWD++ (Sindagi et al., 2020), and 351 negative samples in NWPU (Wang et al., 2020a). Specifically, distractors are densely arranged other objects which may be confused for the crowd; adverse weather samples were taken under special weather conditions such as rain, snow, and haze; and negative samples do not contain any persons.
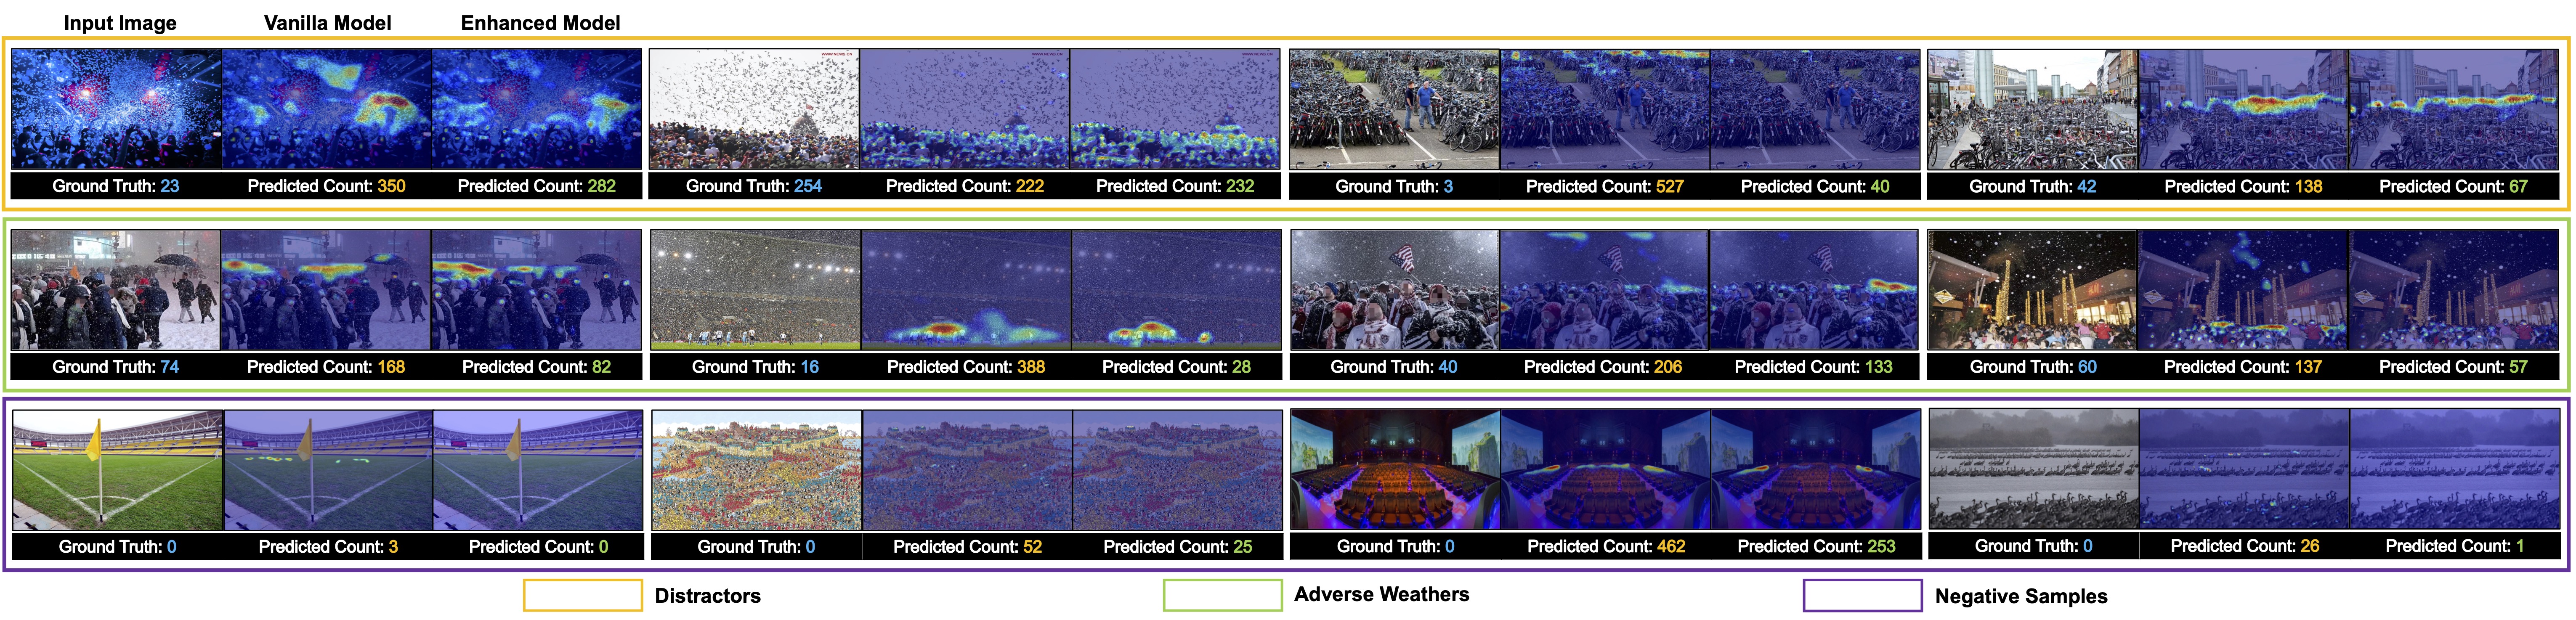
Figure 8 shows the estimation errors on the mentioned three types of samples. Models trained with our PAP could improve robustness on all test sets (-3.9 MAE and -2.8 MSE on distractors, -10.3 MAE and -16.4 MSE on adverse weather samples, and -2.7 MAE and -4.5 MSE on negative samples), and also outperform other methods. Intuitively, adversarial training with our patches can help models to resist the crowd-like noises and focus on the real crowd patterns, resulting in stronger robustness on negative samples. As the visualization shown in Figure 9, many non-target areas are highlighted on the density map of the vanilla model, such as the region of bicycles in the second row, whereas the enhanced model is significantly more robust to these distractors. The attention of the models trained with our PAP could focus on the human areas more accurately and thus the number of people predicted by the enhanced model is much closer to the ground truth. Therefore, our method can effectively facilitate the crowd counting model to perform better in the real world.
7. Conclusion and Ethics Statement
The premise of our work is that automated crowd counting is considered valuable, though, it may expose privacy risks in the application and data collection process. We oppose its application for malicious surveillance; instead, we focus on scenarios that are beneficial to humans. For instance, traffic monitoring and public safety are significantly meaningful use-cases for automated crowd counting. This technology can be utilized for crowd flow monitoring which promises better traffic planning for automated driving systems. Besides, effective crowd counting can prevent stampede accidents caused by excessive crowd density. Therefore, we believe that automated crowd counting is developed for the better. In addition, we have made every effort to protect personal information during the collection and use of data. All images used in this paper are from public datasets or collected legally. We seek the consent of the subject when capturing images in the physical world and mask the face information in our paper for privacy protection.
Adversarial attacks, as an effective way to discover security vulnerabilities in practice, will facilitate researchers to pay more attention to the robustness of the models. Given this, to generate strong transferable attacks for crowd counting models, this paper proposes the Perceptual Adversarial Patch (PAP) generation framework to learn the model-invariant features by exploiting both the model scale perception and position perception. To validate the effectiveness of our proposed method, we conduct extensive experiments in both the digital and physical world, which shows that PAP achieves state-of-the-art performance. Through our attack, it is demonstrated that existing adversarial defense strategies on the regression task are not infallible. Moreover, it is worthwhile to further explore how to effectively define robustness metrics on the crowd counting task. We believe this paper will inspire future research on these aspects.
Additionally, our attack can be utilized to protect privacy. We can successfully disrupt malicious surveillance systems to protect crowd information, thus preventing the infringement of the right to a public meeting. In this case, we still have a lot of obstacles to overcome, such as how to make our adversarial patch appear natural enough to go undetected and how to efficiently cover all observation locations. Even while our work suggests putting patches on clothing or posters, we anticipate more effective methods of patch generation to prevent anomalous warnings brought on by human perception.
From another perspective, we expect that the automated crowd counting models have a strong generalization to cope with changing real-world conditions. However, existing deep learning methods do suffer from overfitting known data distributions. Nevertheless, the deep crowd counting approach based on density map estimation has been the most accurate and efficient way. In contrast to most previous studies, we surprisingly find that adversarial training with our patches can benefit model performance, revealing another approach to exploit adversarial attack techniques for social positive. We utilize our adversarial patches as beneficial enhancement data to enhance the model generalization to unknown crowd scales and robustness towards complex backgrounds, leading to better application in reality. Though providing a preliminary explanation, we are interested in investigating the nature and mechanism of the observation, and we leave it as future work.
Acknowledgements.
This work was supported by The National Key Research and Development Plan of China (2020AAA0103502), and National Natural Science Foundation of China (62022009 and 61872021).References
- (1)
- Athalye et al. (2018) Anish Athalye, Nicholas Carlini, and David Wagner. 2018. Obfuscated gradients give a false sense of security: Circumventing defenses to adversarial examples. In International conference on machine learning. PMLR, 274–283.
- Boominathan et al. (2016) Lokesh Boominathan, Srinivas SS Kruthiventi, and R Venkatesh Babu. 2016. Crowdnet: A deep convolutional network for dense crowd counting. In Proceedings of the 24th ACM international conference on Multimedia. 640–644.
- Brendel et al. (2017) Wieland Brendel, Jonas Rauber, and Matthias Bethge. 2017. Decision-based adversarial attacks: Reliable attacks against black-box machine learning models. arXiv preprint arXiv:1712.04248 (2017).
- Brown et al. (2017) Tom B Brown, Dandelion Mané, Aurko Roy, Martín Abadi, and Justin Gilmer. 2017. Adversarial patch. arXiv preprint arXiv:1712.09665 (2017).
- Chan and Vasconcelos (2009) Antoni B Chan and Nuno Vasconcelos. 2009. Bayesian poisson regression for crowd counting. In 2009 IEEE 12th international conference on computer vision. IEEE, 545–551.
- Chattopadhay et al. (2018) Aditya Chattopadhay, Anirban Sarkar, Prantik Howlader, and Vineeth N Balasubramanian. 2018. Grad-cam++: Generalized gradient-based visual explanations for deep convolutional networks. In 2018 IEEE winter conference on applications of computer vision (WACV). IEEE, 839–847.
- Chen et al. (2013) Ke Chen, Shaogang Gong, Tao Xiang, and Chen Change Loy. 2013. Cumulative attribute space for age and crowd density estimation. In Proceedings of the IEEE conference on computer vision and pattern recognition. 2467–2474.
- Chen et al. (2012) Ke Chen, Chen Change Loy, Shaogang Gong, and Tony Xiang. 2012. Feature mining for localised crowd counting.. In Bmvc, Vol. 1. 3.
- Chen et al. (2017) Pin-Yu Chen, Huan Zhang, Yash Sharma, Jinfeng Yi, and Cho-Jui Hsieh. 2017. Zoo: Zeroth order optimization based black-box attacks to deep neural networks without training substitute models. In Proceedings of the 10th ACM workshop on artificial intelligence and security. 15–26.
- Chen et al. (2021) Xiangning Chen, Cihang Xie, Mingxing Tan, Li Zhang, Cho-Jui Hsieh, and Boqing Gong. 2021. Robust and Accurate Object Detection via Adversarial Learning. In CVPR.
- Croce and Hein (2020) Francesco Croce and Matthias Hein. 2020. Reliable Evaluation of Adversarial Robustness with an Ensemble of Diverse Parameter-free Attacks. In ICML.
- DeVries and Taylor (2017) Terrance DeVries and Graham W Taylor. 2017. Improved regularization of convolutional neural networks with cutout. arXiv preprint arXiv:1708.04552 (2017).
- Dong et al. (2018) Yinpeng Dong, Fangzhou Liao, Tianyu Pang, Hang Su, Jun Zhu, Xiaolin Hu, and Jianguo Li. 2018. Boosting adversarial attacks with momentum. In Proceedings of the IEEE conference on computer vision and pattern recognition. 9185–9193.
- Dong et al. (2019a) Yinpeng Dong, Tianyu Pang, Hang Su, and Jun Zhu. 2019a. Evading defenses to transferable adversarial examples by translation-invariant attacks. In CVPR.
- Dong et al. (2019b) Yinpeng Dong, Hang Su, Baoyuan Wu, Zhifeng Li, Wei Liu, Tong Zhang, and Jun Zhu. 2019b. Efficient decision-based black-box adversarial attacks on face recognition. In Proceedings of the IEEE/CVF Conference on Computer Vision and Pattern Recognition. 7714–7722.
- Eykholt et al. (2018) Kevin Eykholt, Ivan Evtimov, Earlence Fernandes, Bo Li, Amir Rahmati, Chaowei Xiao, Atul Prakash, Tadayoshi Kohno, and Dawn Song. 2018. Robust physical-world attacks on deep learning visual classification. In CVPR.
- Gao et al. (2020) Guangshuai Gao, Junyu Gao, Qingjie Liu, Qi Wang, and Yunhong Wang. 2020. Cnn-based density estimation and crowd counting: A survey. arXiv preprint arXiv:2003.12783 (2020).
- Goodfellow et al. (2014) Ian J Goodfellow, Jonathon Shlens, and Christian Szegedy. 2014. Explaining and harnessing adversarial examples (2014). arXiv preprint arXiv:1412.6572 (2014).
- Hendrycks et al. (2019) Dan Hendrycks, Norman Mu, Ekin D Cubuk, Barret Zoph, Justin Gilmer, and Balaji Lakshminarayanan. 2019. Augmix: A simple data processing method to improve robustness and uncertainty. arXiv preprint arXiv:1912.02781 (2019).
- Idrees et al. (2013) Haroon Idrees, Imran Saleemi, Cody Seibert, and Mubarak Shah. 2013. Multi-source multi-scale counting in extremely dense crowd images. In Proceedings of the IEEE conference on computer vision and pattern recognition. 2547–2554.
- Ilyas et al. (2018) Andrew Ilyas, Logan Engstrom, Anish Athalye, and Jessy Lin. 2018. Black-box adversarial attacks with limited queries and information. In International Conference on Machine Learning. PMLR, 2137–2146.
- Lennon et al. (2021) Max Lennon, Nathan Drenkow, and Philippe Burlina. 2021. Patch Attack Invariance: How Sensitive are Patch Attacks to 3D Pose? arXiv preprint arXiv:2108.07229 (2021).
- Levine and Feizi (2020) Alexander Levine and Soheil Feizi. 2020. (De) Randomized smoothing for certifiable defense against patch attacks. Advances in Neural Information Processing Systems 33 (2020), 6465–6475.
- Li et al. (2008) Min Li, Zhaoxiang Zhang, Kaiqi Huang, and Tieniu Tan. 2008. Estimating the number of people in crowded scenes by mid based foreground segmentation and head-shoulder detection. In 2008 19th international conference on pattern recognition. IEEE, 1–4.
- Li et al. (2018) Yuhong Li, Xiaofan Zhang, and Deming Chen. 2018. Csrnet: Dilated convolutional neural networks for understanding the highly congested scenes. In CVPR.
- Lin et al. (2019) Jiadong Lin, Chuanbiao Song, Kun He, Liwei Wang, and John E Hopcroft. 2019. Nesterov accelerated gradient and scale invariance for adversarial attacks. arXiv preprint arXiv:1908.06281 (2019).
- Lin et al. (2001) Sheng-Fuu Lin, Jaw-Yeh Chen, and Hung-Xin Chao. 2001. Estimation of number of people in crowded scenes using perspective transformation. IEEE Transactions on Systems, Man, and Cybernetics-Part A: Systems and Humans 31, 6 (2001), 645–654.
- Liu et al. (2019a) Aishan Liu, Xianglong Liu, Jiaxin Fan, Yuqing Ma, Anlan Zhang, Huiyuan Xie, and Dacheng Tao. 2019a. Perceptual-Sensitive GAN for Generating Adversarial Patches. In AAAI.
- Liu et al. (2019b) Weizhe Liu, Mathieu Salzmann, and Pascal Fua. 2019b. Context-aware crowd counting. In CVPR.
- Liu et al. (2019c) Weizhe Liu, Mathieu Salzmann, and Pascal Fua. 2019c. Using depth for pixel-wise detection of adversarial attacks in crowd counting. arXiv preprint arXiv:1911.11484 (2019).
- Liu et al. (2016) Yanpei Liu, Xinyun Chen, Chang Liu, and Dawn Song. 2016. Delving into transferable adversarial examples and black-box attacks. arXiv preprint arXiv:1611.02770 (2016).
- Ma et al. (2019) Zhiheng Ma, Xing Wei, Xiaopeng Hong, and Yihong Gong. 2019. Bayesian loss for crowd count estimation with point supervision. In ICCV.
- Madry et al. (2018) Aleksander Madry, Aleksandar Makelov, Ludwig Schmidt, Dimitris Tsipras, and Adrian Vladu. 2018. Towards deep learning models resistant to adversarial attacks. In ICLR.
- McCoyd et al. (2020) Michael McCoyd, Won Park, Steven Chen, Neil Shah, Ryan Roggenkemper, Minjune Hwang, Jason Xinyu Liu, and David Wagner. 2020. Minority reports defense: Defending against adversarial patches. In International Conference on Applied Cryptography and Network Security. Springer, 564–582.
- Nesterov (1983) Yurii Nesterov. 1983. A method for unconstrained convex minimization problem with the rate of convergence O (1/k^ 2). In Doklady an ussr, Vol. 269. 543–547.
- Onoro-Rubio and López-Sastre (2016) Daniel Onoro-Rubio and Roberto J López-Sastre. 2016. Towards perspective-free object counting with deep learning. In European conference on computer vision. Springer, 615–629.
- Rumelhart et al. (1986) David E Rumelhart, Geoffrey E Hinton, and Ronald J Williams. 1986. Learning representations by back-propagating errors. nature 323, 6088 (1986), 533–536.
- Selvaraju et al. (2017) Ramprasaath R Selvaraju, Michael Cogswell, Abhishek Das, Ramakrishna Vedantam, Devi Parikh, and Dhruv Batra. 2017. Grad-cam: Visual explanations from deep networks via gradient-based localization. In ICCV.
- Sheng et al. (2016) Biyun Sheng, Chunhua Shen, Guosheng Lin, Jun Li, Wankou Yang, and Changyin Sun. 2016. Crowd counting via weighted VLAD on a dense attribute feature map. IEEE Transactions on Circuits and Systems for Video Technology 28, 8 (2016), 1788–1797.
- Sindagi et al. (2020) Vishwanath Sindagi, Rajeev Yasarla, and Vishal MM Patel. 2020. Jhu-crowd++: Large-scale crowd counting dataset and a benchmark method. IEEE TPAMI (2020).
- Song et al. (2021) Qingyu Song, Changan Wang, Yabiao Wang, Ying Tai, Chengjie Wang, Jilin Li, Jian Wu, and Jiayi Ma. 2021. To Choose or to Fuse? Scale Selection for Crowd Counting. In AAAI.
- Szegedy et al. (2013) Christian Szegedy, Wojciech Zaremba, Ilya Sutskever, Joan Bruna, Dumitru Erhan, Ian Goodfellow, and Rob Fergus. 2013. Intriguing properties of neural networks. arXiv preprint arXiv:1312.6199 (2013).
- Thys et al. (2019) Simen Thys, Wiebe Van Ranst, and Toon Goedemé. 2019. Fooling automated surveillance cameras: adversarial patches to attack person detection. In Proceedings of the IEEE/CVF conference on computer vision and pattern recognition workshops. 0–0.
- Tramèr et al. (2017) Florian Tramèr, Alexey Kurakin, Nicolas Papernot, Ian Goodfellow, Dan Boneh, and Patrick McDaniel. 2017. Ensemble adversarial training: Attacks and defenses. arXiv preprint arXiv:1705.07204 (2017).
- Tsipras et al. (2019) Dimitris Tsipras, Shibani Santurkar, Logan Engstrom, Alexander Turner, and Aleksander Madry. 2019. Robustness may be at odds with accuracy. In ICLR.
- Wang et al. (2020b) Boyu Wang, Huidong Liu, Dimitris Samaras, and Minh Hoai. 2020b. Distribution matching for crowd counting. arXiv preprint arXiv:2009.13077 (2020).
- Wang et al. (2015) Chuan Wang, Hua Zhang, Liang Yang, Si Liu, and Xiaochun Cao. 2015. Deep people counting in extremely dense crowds. In Proceedings of the 23rd ACM international conference on Multimedia. 1299–1302.
- Wang et al. (2021a) Jiakai Wang, Aishan Liu, Xiao Bai, and Xianglong Liu. 2021a. Universal Adversarial Patch Attack for Automatic Checkout Using Perceptual and Attentional Bias. IEEE Transactions on Image Processing 31 (2021), 598–611.
- Wang et al. (2021b) Jiakai Wang, Aishan Liu, Zixin Yin, Shunchang Liu, Shiyu Tang, and Xianglong Liu. 2021b. Dual Attention Suppression Attack: Generate Adversarial Camouflage in Physical World. In CVPR.
- Wang et al. (2020a) Qi Wang, Junyu Gao, Wei Lin, and Xuelong Li. 2020a. NWPU-crowd: A large-scale benchmark for crowd counting and localization. IEEE TPAMI (2020).
- Wu et al. (2021) Qimin Wu, Zhikang Zou, Pan Zhou, Xiaoqing Ye, Binghui Wang, and Ang Li. 2021. Towards Adversarial Patch Analysis and Certified Defense against Crowd Counting. In ACM MM.
- Xiang et al. (2021) Chong Xiang, Saeed Mahloujifar, and Prateek Mittal. 2021. PatchCleanser: Certifiably Robust Defense against Adversarial Patches for Any Image Classifier. arXiv preprint arXiv:2108.09135 (2021).
- Xie et al. (2020) Cihang Xie, Mingxing Tan, Boqing Gong, Jiang Wang, Alan L Yuille, and Quoc V Le. 2020. Adversarial examples improve image recognition. In CVPR.
- Xie et al. (2019) Cihang Xie, Zhishuai Zhang, Yuyin Zhou, Song Bai, Jianyu Wang, Zhou Ren, and Alan L Yuille. 2019. Improving transferability of adversarial examples with input diversity. In Proceedings of the IEEE/CVF Conference on Computer Vision and Pattern Recognition. 2730–2739.
- Yan et al. (2019) Zhaoyi Yan, Yuchen Yuan, Wangmeng Zuo, Xiao Tan, Yezhen Wang, Shilei Wen, and Errui Ding. 2019. Perspective-guided convolution networks for crowd counting. In Proceedings of the IEEE/CVF international conference on computer vision. 952–961.
- Yuan et al. (2021) Zheng Yuan, Jie Zhang, Yunpei Jia, Chuanqi Tan, Tao Xue, and Shiguang Shan. 2021. Meta gradient adversarial attack. In Proceedings of the IEEE/CVF International Conference on Computer Vision. 7748–7757.
- Yun et al. (2019) Sangdoo Yun, Dongyoon Han, Seong Joon Oh, Sanghyuk Chun, Junsuk Choe, and Youngjoon Yoo. 2019. Cutmix: Regularization strategy to train strong classifiers with localizable features. In ICCV.
- Zhang et al. (2019) Anran Zhang, Jiayi Shen, Zehao Xiao, Fan Zhu, Xiantong Zhen, Xianbin Cao, and Ling Shao. 2019. Relational attention network for crowd counting. In Proceedings of the IEEE/CVF International Conference on Computer Vision. 6788–6797.
- Zhang et al. (2022) Jianping Zhang, Weibin Wu, Jen-tse Huang, Yizhan Huang, Wenxuan Wang, Yuxin Su, and Michael R Lyu. 2022. Improving Adversarial Transferability via Neuron Attribution-Based Attacks. In Proceedings of the IEEE/CVF Conference on Computer Vision and Pattern Recognition. 14993–15002.
- Zhang et al. (2016) Yingying Zhang, Desen Zhou, Siqin Chen, Shenghua Gao, and Yi Ma. 2016. Single-image crowd counting via multi-column convolutional neural network. In CVPR.
- Zhao and Nevatia (2003) Tao Zhao and Ramakant Nevatia. 2003. Bayesian human segmentation in crowded situations. In 2003 IEEE Computer Society Conference on Computer Vision and Pattern Recognition, 2003. Proceedings., Vol. 2. IEEE, II–459.
- Zhou et al. (2016) Bolei Zhou, Aditya Khosla, Agata Lapedriza, Aude Oliva, and Antonio Torralba. 2016. Learning deep features for discriminative localization. In Proceedings of the IEEE conference on computer vision and pattern recognition. 2921–2929.
Appendix A Attacks with different patch sizes
For the limited page sizes, we only show the results of our PAP with the size of in the main body of the paper. Here, we provide the results on Shanghai Tech Part A with different patch sizes (, ) following (Wu et al., 2021) in the digital world. As illustrated in Table 8 and Table 9, our adversarial patches have strong attacking ability under both white-box and black-box settings, which outperforms APAM (Wu et al., 2021) by large margins.
| MAE / MSE | Target Model | ||||||
| Source model | Method | MCNN | CSRNet | CAN | BL | DM-Count | SASNet |
| Clean | 108.0 / 165.0 | 67.0 / 105.2 | 59.9 / 94.1 | 61.8 / 94.1 | 58.2 / 93.2 | 52.8 / 86.2 | |
| MCNN | APAM | 111.5 / 170.5 | 69.5 / 109.7 | 60.9 / 96.6 | 62.5 / 95.6 | 60.3 / 96.2 | 53.6 / 87.8 |
| Ours | 201.0 / 245.9 | 142.8 / 230.1 | 141.3 / 230.7 | 135.5 / 216.6 | 142.5 / 224.6 | 110.2 / 195.9 | |
| CSRNet | APAM | 109.6 / 168.0 | 69.3 / 109.3 | 61.0 / 96.5 | 62.4 / 95.5 | 60.1 / 96.2 | 53.6 / 87.5 |
| Ours | 118.6 / 182.1 | 116.6 / 192.6 | 122.4 / 211.7 | 107.8 / 178.3 | 110.5 / 189.7 | 107.3 / 193.6 | |
| CAN | APAM | 109.5 / 167.0 | 69.1 / 108.9 | 61.2 / 98.2 | 64.1 / 96.4 | 60.0 / 96.0 | 53.5 / 87.7 |
| Ours | 118.4 / 181.7 | 111.3 / 195.6 | 116.9 / 199.0 | 108.9 / 181.6 | 114.3 / 196.3 | 107.0 / 193.4 | |
| BL | APAM | 109.6 / 167.6 | 69.2 / 109.3 | 60.9 / 96.3 | 63.1 / 96.4 | 60.2 / 97.3 | 53.6 / 87.8 |
| Ours | 118.8 / 182.2 | 134.2 / 222.5 | 139.0 / 228.4 | 195.7 / 224.8 | 125.3 / 179.6 | 109.3 / 195.3 | |
| DM-Count | APAM | 109.4 / 167.8 | 69.3 / 109.5 | 61.0 / 96.6 | 62.9 / 95.6 | 62.4 / 98.0 | 53.5 / 87.8 |
| Ours | 119.0 / 182.4 | 135.3 / 224.3 | 138.9 / 228.5 | 148.4 / 189.2 | 144.5 / 186.6 | 109.2 / 195.2 | |
| SASNet | APAM | 109.9 / 183.2 | 69.2 / 108.9 | 61.1 / 96.1 | 63.2 / 96.3 | 62.3 / 98.3 | 53.7 / 87.6 |
| Ours | 119.3 / 183.2 | 142.1 / 229.4 | 141.4 / 230.8 | 133.6 / 214.7 | 142.0 / 224.3 | 106.4 / 192.5 | |
| MAE / MSE | Target Model | ||||||
| Source model | Method | MCNN | CSRNet | CAN | BL | DM-Count | SASNet |
| Clean | 108.0 / 165.0 | 67.0 / 105.2 | 59.9 / 94.1 | 61.8 / 94.1 | 58.2 / 93.2 | 52.8 / 86.2 | |
| MCNN | APAM | 432.1 / 495.3 | 80.1 / 126.9 | 76.2 / 121.6 | 69.7 / 108.2 | 70.6 / 108.4 | 63.2 / 103.4 |
| Ours | 4431.8 / 4470.2 | 80.8 / 127.7 | 76.9 / 123.9 | 70.5 / 108.4 | 71.2 / 109.3 | 63.3 / 104.9 | |
| CSRNet | APAM | 354.6 / 379.1 | 463.5 / 589.4 | 127.4 / 158.1 | 613.3 / 626.7 | 368.5 / 384.0 | 61.8 / 100.8 |
| Ours | 463.8 / 484.2 | 2234.4 / 2268.4 | 660.5 / 736.2 | 1246.8 / 1255.0 | 626.9 / 639.3 | 63.4 / 101.9 | |
| CAN | APAM | 441.5 / 464.4 | 330.6 / 346.8 | 410.2 / 528.4 | 719.4 / 728.0 | 439.6 / 453.0 | 63.7 / 99.5 |
| Ours | 530.3 / 551.3 | 1070.1 / 1083.2 | 2084.0 / 2142.0 | 1051.3 / 1058.9 | 472.3 / 485.5 | 71.9 / 105.2 | |
| BL | APAM | 230.2 / 262.4 | 77.9 / 116.8 | 72.7 / 111.2 | 290.4 / 313.1 | 370.0 / 387.0 | 61.9 / 100.2 |
| Ours | 285.7 / 311.3 | 238.0 / 255.0 | 213.0 / 261.5 | 5213.4 / 5300.0 | 1987.5 / 2003.3 | 62.0 / 103.2 | |
| DM-Count | APAM | 204.3 / 238.5 | 67.2 / 111.1 | 71.1 / 113.4 | 114.5 / 140.8 | 207.4 / 236.5 | 63.9 / 100.1 |
| Ours | 249.7 / 278.3 | 266.9 / 284.5 | 207.1 / 262.0 | 2740.0 / 2767.2 | 3168.0 / 3194.2 | 73.2 / 103.8 | |
| SASNet | APAM | 111.4 / 171.6 | 78.9 / 127.6 | 74.2 / 118.9 | 68.7 / 107.2 | 71.1 / 111.4 | 71.8 / 119.3 |
| Ours | 444.4 / 463.7 | 388.2 / 402.4 | 142.7 / 167.7 | 727.8 / 744.0 | 423.0 / 438.1 | 1801.9 / 1813.9 | |
Appendix B Attacks against defended models
To better evaluate our PAP performance, we conduct attacks under different defensive methods. Due to limited computing resources, we select five models listed in the main paper, i.e., MCNN, CSRNet, CAN, BL and DM-Count, as the target models. First, we choose the adversarial training scheme (Madry et al., 2018), which has been proved to be the best empirical defense. In the adversarial patch scene, we iteratively generate white-box adversarial patches during the model training loop to improve the robustness. Referring (Wu et al., 2021), the training loss can be formulated as follows,
| (13) |
For the total epochs , we set in to warm up, and then slowly decrease from 1 to 0.5 in , finally, maintain to finish the remaining epochs. We set and for our PAP attack. Except as mentioned above, the training of all models follows the original setup.
As for the certified method, several studies (Levine and Feizi, 2020; McCoyd et al., 2020; Xiang et al., 2021) have been devoted to improving the robustness against adversarial patches in the classification task. However, these approaches have strict constraints on the patch size and require classification-oriented information, e.g., output probabilities and category labels. This leads to the fact that they cannot be directly applied to the regression scenario like crowd counting. Therefore, we consider the randomized ablation method, a general certified defense method for crowd counting models proposed in (Wu et al., 2021) as our target. We follow (Wu et al., 2021) re-training the models with the hyperparameter .
Table 10 and 11 list the results for the adversarial training and randomized ablation, respectively. It can be seen that our PAP still performs strong attacking ability, which will facilitate research into better defenses.
| MAE / MSE | Target Model | ||||
|---|---|---|---|---|---|
| Source model | MCNN | CSRNet | CAN | BL | DM-Count |
| Clean | 112.7 / 169.6 | 71.0 / 109.7 | 69.4 / 108.7 | 67.2 / 109.1 | 73.0 / 117.8 |
| MCNN | 1580.9 /1781.1 | 72.1 / 112.7 | 70.8 / 110.5 | 67.7 / 109.2 | 74.1 / 120.1 |
| CSRNet | 171.2 / 215.7 | 535.7 / 576.5 | 263.7 / 292.3 | 372.6 / 387.6 | 102.2 / 140.5 |
| CAN | 168.5 / 214.1 | 318.9 / 340.7 | 427.5 / 478.1 | 319.3 / 335.0 | 88.6 / 130.6 |
| BL | 130.1 / 182.5 | 120.8 / 146.1 | 144.7 / 168.9 | 1075.9 / 1103.3 | 122.6 / 154.5 |
| DM-Count | 116.9 / 172.0 | 89.9 / 122.2 | 87.4 / 119.4 | 230.1 / 257.8 | 257.8 / 285.1 |
| MAE / MSE | Target Model | ||||
|---|---|---|---|---|---|
| Source model | MCNN | CSRNet | CAN | BL | DM-Count |
| Clean | 117.3 / 185.4 | 75.3 / 134.9 | 74.2 / 117.8 | 73.7 / 108.1 | 68.9 / 105.5 |
| MCNN | 249.1 /378.3 | 148.8 / 214.1 | 167.1 / 258.0 | 218.4 / 323.9 | 166.0 / 255.3 |
| CSRNet | 247.3 / 376.5 | 621.3 / 677.7 | 338.4 / 472.1 | 228.4 / 321.7 | 180.9 / 264.3 |
| CAN | 249.0 / 378.1 | 134.0 / 176.5 | 699.6 / 760.5 | 225.8 / 322.7 | 185.0 / 274.3 |
| BL | 248.8 / 378.9 | 181.6 / 268.3 | 361.1 / 508.1 | 328.4 / 422.0 | 183.3 / 275.5 |
| DM-Count | 259.0 / 388.2 | 169.0 / 254.2 | 365.5 / 510.4 | 222.9 / 321.7 | 386.5 / 525.5 |
| MAE / MSE | Target Model | ||||||
| Source model | Method | MCNN | CSRNet | CAN | BL | DM-Count | SASNet |
| Clean | 108.0 / 165.0 | 67.0 / 105.2 | 59.9 / 94.1 | 61.8 / 94.1 | 58.2 / 93.2 | 52.8 / 86.2 | |
| MCNN | MIGM | 702.5 / 728.8 | 69.8 / 109.3 | 62.2 / 100.9 | 63.4 / 96.7 | 60.8 / 95.9 | 53.5 / 89.3 |
| NIGM | 673.0 / 701.9 | 69.8 / 109.5 | 62.2 / 100.8 | 62.9 / 97.0 | 61.3 / 95.9 | 54.3 / 89.0 | |
| TI-NIGM | 182.4 / 220.5 | 69.5 / 109.0 | 62.7 / 100.9 | 63.2 / 97.2 | 61.0 / 96.8 | 53.9 / 89.5 | |
| NAA | 700.5 / 731.3 | 69.8 / 109.4 | 62.0 / 100.6 | 62.9 / 97.0 | 60.2 / 95.8 | 53.5 / 89.2 | |
| Ours | 908.7 / 989.1 | 69.6 / 109.3 | 62.9 / 101.3 | 64.1 / 96.9 | 62.0 / 96.8 | 54.3 / 89.9 | |
| CSRNet | MIGM | 118.5 / 170.3 | 305.5 / 326.7 | 104.2 / 128.8 | 239.8 / 253.1 | 185.4 / 201.2 | 54.2 / 89.9 |
| NIGM | 125.6 / 175.2 | 312.3 / 333.4 | 87.4 / 110.7 | 267.9 / 281.2 | 204.4 / 220.4 | 54.2 / 90.0 | |
| TI-NIGM | 110.3 / 167.7 | 107.3 / 133.5 | 60.7 / 95.2 | 75.8 / 104.3 | 72.7 / 103.2 | 53.8 / 88.7 | |
| NAA | 119.4 / 171.1 | 298.6 / 320.7 | 93.8 / 120.4 | 201.5 / 222.4 | 165.1 / 184.2 | 53.9 / 89.5 | |
| Ours | 147.0 / 190.8 | 568.4 / 613.8 | 212.5 / 242.8 | 388.1 / 401.4 | 249.1 / 263.6 | 56.3 / 89.5 | |
| CAN | MIGM | 145.2 / 188.9 | 255.6 / 273.9 | 426.0 / 453.3 | 385.9 / 397.7 | 203.8 / 218.3 | 54.2 / 88.5 |
| NIGM | 146.9 / 190.2 | 267.2 / 285.3 | 438.2 / 466.2 | 395.8 / 407.7 | 204.0 / 218.3 | 53.8 / 88.3 | |
| TI-NIGM | 111.0 / 169.7 | 69.5 / 109.1 | 64.2 / 103.4 | 63.3 / 97.2 | 61.6 / 97.6 | 54.5 / 88.5 | |
| NAA | 139.3 / 184.5 | 257.3 / 276.9 | 417.6 / 445.6 | 398.8 / 411.8 | 220.5 / 234.8 | 54.3 / 88.0 | |
| Ours | 147.6 / 191.5 | 321.0 / 341.7 | 513.3 / 545.3 | 412.7 / 424.8 | 218.8 / 233.9 | 56.2 / 88.8 | |
| BL | MIGM | 120.4 / 171.6 | 77.9 / 111.0 | 72.2 / 105.6 | 1001.6 / 1023.7 | 491.9 / 504.9 | 54.5 / 89.4 |
| NIGM | 119.1 / 170.9 | 74.2 / 107.6 | 68.1 / 102.3 | 1023.9 / 1051.3 | 511.7 / 526.5 | 53.7 / 89.5 | |
| TI-NIGM | 109.9 / 167.8 | 74.5 / 109.8 | 65.4 / 98.1 | 111.1 / 130.6 | 77.9 / 107.3 | 54.5 / 89.9 | |
| NAA | 121.0 / 172.6 | 78.5 / 110.2 | 69.3 / 103.4 | 1022.6 / 1044.9 | 508.9 / 522.1 | 53.7 / 89.6 | |
| Ours | 119.0 / 170.7 | 79.6 / 111.5 | 73.1 / 106.6 | 1090.9 / 1171.6 | 519.7 / 541.6 | 54.5 / 90.0 | |
| DM-Count | MIGM | 116.2 / 169.4 | 70.9 / 106.2 | 65.8 / 100.8 | 703.9 / 713.2 | 742.0 / 779.1 | 55.9 / 90.3 |
| NIGM | 117.8 / 170.0 | 70.3 / 106.5 | 64.8 / 100.1 | 701.0 / 731.2 | 744.7 / 761.9 | 55.8 / 90.0 | |
| TI-NIGM | 111.2 / 169.3 | 68.9 / 108.7 | 62.3 / 99.9 | 63.3 / 96.6 | 62.4 / 98.1 | 53.9 / 89.5 | |
| NAA | 117.0 / 170.1 | 70.6 / 106.5 | 65.3 / 101.1 | 737.7 / 746.0 | 744.0 / 781.4 | 56.4 / 90.8 | |
| Ours | 115.6 / 169.6 | 87.6 / 119.3 | 82.8 / 115.0 | 747.5 / 793.6 | 751.3 / 784.9 | 56.5 / 90.8 | |
| SASNet | MIGM | 123.2 / 173.2 | 71.5 / 108.3 | 61.7 / 95.7 | 65.5 / 95.3 | 69.0 / 91.3 | 122.5 / 147.5 |
| NIGM | 124.6 / 174.2 | 71.0 / 106.5 | 60.5 / 93.9 | 63.9 / 93.5 | 72.0 / 92.1 | 132.0 / 147.0 | |
| TI-NIGM | 110.4 / 168.7 | 69.4 / 108.2 | 61.9 / 99.5 | 64.1 / 97.5 | 61.0 / 97.6 | 56.1 / 89.2 | |
| NAA | 110.6 / 169.3 | 69.9 / 109.8 | 61.0 / 99.5 | 63.5 / 97.4 | 62.1 / 98.1 | 53.8 / 90.1 | |
| Ours | 112.8 / 169.4 | 69.5 / 109.0 | 62.6 / 100.3 | 69.9 / 99.8 | 75.1 / 105.4 | 200.0 / 220.3 | |
Appendix C Comparing with other transferable attacks
In the main paper, we conduct experiments to compare our PAP with six other methods designed for transferable attacks (MIGM (Dong et al., 2018), NIGM (Lin et al., 2019), TI-NIGM (Dong et al., 2019a), NAA (Zhang et al., 2022), Avg-Dens, and MGAA (Yuan et al., 2021)). For a fair comparison, all hyperparameters are set the same as in the main paper, except for the method-specific ones mentioned below. We refer to their papers for the settings of these specific hyperparameters. All additional results are listed in Table 12.
For the Momentum Iterative Gradient-based Method (MIGM) (Dong et al., 2018), it integrates momentum into the iterative FGSM (Goodfellow et al., 2014) and the update procedure of the adversarial patch can be formalized as follows,
| (14) |
represents the loss function for the source crowd counting model. We set following (Dong et al., 2018).
For the Nesterov Iterative Gradient-based Method (NIGM) (Lin et al., 2019), it utilizes Nesterov Accelerated Gradient (Nesterov, 1983) to improve the attacking transferability. Following (Lin et al., 2019), we can update our patch by slightly modifying the formula (14) as follows,
| (15) |
We set and referring to (Lin et al., 2019).
Further, we combine the Translation-Invariant method (Lin et al., 2019) and NIGM, named TI-NIGM, which has much stronger transferability. Specifically, the accumulated gradients observe the following update rule,
| (16) |
where is the pre-defined gaussian kernel.
In addition to the method directly manipulating the model output, we also compare with a feature-level transfer-based attack named Neuron Attribution-based Attack (NAA) (Zhang et al., 2022) which can be formulated into solving the following constrained minimization problem,
| (17) |
where and are the activation values of the neuron when the input is an adversarial image and a black image, respectively. reflects Integrated Attention proposed in (Zhang et al., 2022). is a transformation function with hyperparameter for distinguishing between positive and negative neuron attributions. Following (Zhang et al., 2022), we set integrated step and . We choose MCNN-branch1,2,3-(9), CSRNet-frontend-(22), CAN-frontend-(22), BL-features-(35), DM-Count-features-(35), SASNet-features5-(9) as target layers to obtain and .
In addition to attacking with a single source model, we also consider the ensemble-based method. Referring to (Liu et al., 2016; Tramèr et al., 2017; Dong et al., 2018), we first conduct an ensemble-based attack by Averaging Density (Avg-Dens). Specifically, for a target model, we generate adversarial patches using the other five models by taking the average predicted count as the loss as follows,
| (18) |
Besides, we compare with another ensemble-based method called Meta Gradient Adversarial Attack (MGAA) (Yuan et al., 2021). Specifically, we randomly sample four models from a source model zoo to compose different meta tasks and iteratively simulate a transfer-based black-box attack in each task. We set the number of iterations and the number of ensemble models in the meta-train step. To keep it comparable, we set the number of sample tasks and meta-test step .
Appendix D More results for the ablation study related to the loss functions
We report the results of CSRNet (Li et al., 2018) in our main paper. In this section, we provide additional model results for the ablation study on two perception loss functions and the loss weight . Table 17 and Figure 10 respectively list the results for MCNN (Zhang et al., 2016), CAN (Liu et al., 2019b), BL (Ma et al., 2019), DM-Count (Wang et al., 2020b), and SASNet (Song et al., 2021). All results demonstrate the conclusions in the main paper.
| MAE / MSE | Cross-dataset Evaluation | |
|---|---|---|
| Method | Part APart B | Part BPart A |
| Vanilla | 22.8 / 34.3 | 142.4 / 241.3 |
| IAT | 23.5 / 35.1 | 140.0 / 245.1 |
| OAT(Ours) | 17.5 / 27.5 | 129.8 / 220.5 |
| MAE / MSE | Complex Backgrounds | ||
|---|---|---|---|
| Method | Distractors | Special Weathers | Negative Samples |
| Vanilla | 42.3 / 63.9 | 239.2 / 849.5 | 10.2 / 22.8 |
| IAT | 40.4 / 64.2 | 242.2 / 840.7 | 7.8 / 21.0 |
| OAT(Ours) | 38.4 / 61.1 | 228.9 / 833.1 | 7.5 / 18.3 |
| Method | Shanghai Tech Part B | UCF-CC-50 | Crowd Surveillance |
|---|---|---|---|
| Vanilla | 50.1 / 62.8 | 441.8 / 700.9 | 159.0 / 210.1 |
| Ours | 33.1 / 48.8 | 431.4 / 669.6 | 87.1 / 148.0 |
| Method | Shanghai Tech Part A | UCF-CC-50 | Crowd Surveillance |
|---|---|---|---|
| Vanilla | 178.7 / 265.9 | 624.0 / 950.9 | 167.1 / 221.9 |
| Ours | 157.8 / 265.0 | 503.7 / 724.8 | 33.3 / 55.5 |
| Method | Distractors | Special Weathers | Negative Samples |
|---|---|---|---|
| Vanilla | 151.6 / 199.7 | 301.0 / 895.8 | 280.1 / 481.7 |
| Ours | 122.1 / 165.8 | 283.9 / 875.1 | 167.3 / 330.4 |
| Loss | CSRNet | CAN | BL | DM-Count | SASNet |
|---|---|---|---|---|---|
| None | 67.0 / 105.2 | 59.9 / 94.1 | 61.8 / 94.1 | 58.2 / 93.2 | 52.8 / 86.2 |
| w/o | 69.3 / 109.0 | 62.8 / 101.1 | 63.2 / 96.7 | 60.2 / 94.4 | 53.4 / 89.3 |
| 69.4 / 109.3 | 62.9 / 101.1 | 63.9 / 96.8 | 61.8 / 96.4 | 53.4 / 89.4 | |
| 69.5 / 109.0 | 62.9 / 101.2 | 64.0 / 96.0 | 60.8 / 95.5 | 53.4 / 89.1 | |
| 69.6 / 109.3 | 62.9 / 101.3 | 64.1 / 96.9 | 62.0 / 96.8 | 54.3 / 89.9 |
| Loss | MCNN | CSRNet | BL | DM-Count | SASNet |
|---|---|---|---|---|---|
| None | 108.0 / 165.0 | 67.0 / 105.2 | 61.8 / 94.1 | 58.2 / 93.2 | 52.8 / 86.2 |
| w/o | 141.2 / 186.5 | 303.6 / 317.7 | 309.4 / 322.7 | 173.6 / 191.3 | 55.4 / 88.5 |
| 146.0 / 189.1 | 319.2 / 339.6 | 409.2 / 421.2 | 209.7 / 225.3 | 55.7 / 88.8 | |
| 146.3 / 189.6 | 300.0 / 320.1 | 366.0 / 379.5 | 210.6 / 225.7 | 54.8 / 88.5 | |
| 147.6 / 191.5 | 321.0 / 341.7 | 412.7 / 424.8 | 218.8 / 233.9 | 56.2 / 88.8 |
| Loss | MCNN | CSRNet | CAN | DM-Count | SASNet |
|---|---|---|---|---|---|
| None | 108.0 / 165.0 | 67.0 / 105.2 | 59.9 / 94.1 | 58.2 / 93.2 | 52.8 / 86.2 |
| w/o | 117.9 / 169.9 | 76.8 / 109.7 | 65.3 / 99.3 | 492.3 / 509.9 | 53.0 / 88.5 |
| 119.0 / 170.2 | 78.8 / 110.7 | 68.2 / 99.4 | 509.9 / 526.5 | 54.1 / 89.2 | |
| 118.3 / 169.4 | 76.9 / 110.8 | 69.4 / 104.3 | 505.7 / 525.1 | 53.8 / 89.2 | |
| 119.0 / 170.7 | 79.6 / 111.5 | 73.1 / 106.6 | 519.7 / 541.6 | 54.5 / 90.0 |
| Loss | MCNN | CSRNet | CAN | BL | SASNet |
|---|---|---|---|---|---|
| None | 108.0 / 165.0 | 67.0 / 105.2 | 59.9 / 94.1 | 61.8 / 94.1 | 52.8 / 86.2 |
| w/o | 113.9 / 167.0 | 77.5 / 111.1 | 78.2 / 109.3 | 726.7 / 773.6 | 55.7 / 89.3 |
| 115.6 / 169.6 | 82.1 / 114.2 | 79.2 / 112.1 | 739.8 / 772.7 | 56.0 / 90.5 | |
| 115.2 / 169.1 | 81.4 / 111.4 | 81.6 / 112.4 | 728.6 / 768.5 | 56.0 / 89.9 | |
| 115.6 / 169.6 | 87.6 / 119.3 | 82.8 / 115.0 | 747.5 / 793.6 | 56.5 / 90.8 |
| Loss | MCNN | CSRNet | CAN | BL | DM-Count |
|---|---|---|---|---|---|
| None | 108.0 / 165.0 | 67.0 / 105.2 | 59.9 / 94.1 | 61.8 / 94.1 | 58.2 / 93.2 |
| w/o | 108.3 / 166.1 | 68.9 / 106.6 | 60.9 / 95.2 | 65.3 / 98.2 | 65.5 / 96.6 |
| 110.0 / 167.5 | 69.0 / 108.1 | 61.8 / 96.8 | 67.5 / 98.9 | 70.4 / 100.6 | |
| 109.1 / 167.1 | 67.2 / 105.5 | 60.2 / 94.9 | 62.7 / 96.3 | 68.2 / 99.1 | |
| 112.8 / 169.4 | 69.5 / 109.0 | 62.6 / 100.3 | 69.9 / 99.8 | 75.1 / 105.4 |
Appendix E Discussion for Different Adversarial Training Schemes
In this section, we plan to discuss the influence of different implementations of adversarial training. Specifically, we train two DM-Count models with our patches in two different adversarial training schemes, i.e., generating all adversarial examples based on the pre-trained model at the beginning or conducting the min-max optimization iteratively. Then, we evaluate their performance for generalization across datasets and robustness towards complex backgrounds.
As shown in Table 13 and Table 14, generating adversarial patches once at the beginning will achieve better performance. We conjecture that our patches may fail to capture satisfactory model-invariant features during the iteratively min-max optimization. Besides, iteratively generating adversarial examples and training the model will take obviously more time (622.1h) than once preparing (33.6h). Thus, we take an adversarial training scheme with once adversarial patch generation in our framework.
Appendix F More results for the model improvement
In the main paper, we demonstrate the effectiveness of adversarial training with our PAP for the single-column method DM-Count (Wang et al., 2020b). In this section, we use another crowd counting model MCNN (Zhang et al., 2016), a multi-column method, to evaluate our approach. Specifically, we conduct experiments to test the model generalization ability across datasets and robustness on scenes with complex backgrounds. Except for the crowd counting model, we all follow the same settings in the main paper. As shown in Table 16(b) and Table 16, our method can generally benefit the model performance.