Do Language Models Know the Way to Rome?
Abstract
The global geometry of language models is important for a range of applications, but language model probes tend to evaluate rather local relations, for which ground truths are easily obtained. In this paper we exploit the fact that in geography, ground truths are available beyond local relations. In a series of experiments, we evaluate the extent to which language model representations of city and country names are isomorphic to real-world geography, e.g., if you tell a language model where Paris and Berlin are, does it know the way to Rome? We find that language models generally encode limited geographic information, but with larger models performing the best, suggesting that geographic knowledge can be induced from higher-order co-occurrence statistics.
1 Introduction
Language models (LMs) are fundamental building blocks in state-of-the-art natural language processing. These models are trained to predict words in context, and as a side product, they learn to compress higher-order co-occurrence statistics to represent the distributional properties of words and phrases.
It is well-documented that the representations of modern language models encode some syntactic Tenney et al. (2019) and semantic knowledge (Reif et al. (2019)), as well as some real-world knowledge Davison et al. (2019); Petroni et al. (2019); Jiang et al. (2020); Roberts et al. (2020), i.e., some knowledge base relations can be extracted directly from language models. Much of this information was available in older language models such as Word2Vec, too Mikolov et al. (2013).
The probes that have been designed for the above studies, however, only probe for one-dimensional information (e.g., part of speech or semantic class) or very local relations (e.g., is Daniel Kehlmann a writer?). It is an open question whether higher-order co-occurrence statistics found in textual corpora can induce representations show isomorphism to human mental representations of entities and relations. To test this we operationalize a dataset of geographic information. Geographic knowledge is a domain in which we can go beyond local relations, since we can access global representations of geographic knowledge (to the extent it is isomorphic to the physical world).
Cross-lingual language model alignment provides additional motivation for probing for geographic knowledge: We know that language models of different languages are sometimes near-isomorphic Søgaard et al. (2018); Vulić et al. (2020), and it is tempting to think that this is because language models reflect real-world structures, and that the (occasional) near-isomorphism of language models is simply the result of the fact that we use language(s) to talk about the same world. Is the isomorphism of language models a result of them being in part isomorphic to the physical world?
Why would language models potentially encode physical geometry? Higher-order co-occurrence statistics can be surprisingly informative. Copenhagen and Malmö are in different countries, but connected by a bridge, often referred to as the bridge between Copenhagen and Malmö. Other cities belong to the same municipalities and their names therefore co-occur with the name of the municipality. Other cities were, for instance, potentially impacted by the same natural disaster or part of the same development project. By distilling thousands, or maybe hundreds of thousands, of such co-occurrences, we conjecture that language models might be able to induce somewhat fine-grained maps of physical geometry.
In this work, we study the extent to which geographical information is encoded by language models. Based on geographic information from multiple sources, we train probing models on language model representations and evaluate their ability to predict the locations of cities and countries, as well as their ability to predict (one-dimensional) population numbers and (local) neighbor relations, relative to control probe performance levels.
Contributions
We collect geographic information from multiple sources and design experimental protocols to probe language models for such information. We evaluate two BERT models Devlin et al. (2019) of different sizes, two RoBERTa models Liu et al. (2019) of different sizes, as well as GPT-2 Radford et al. (2019) and Word2Vec Mikolov et al. (2013) across three different tasks and various protocols. Our results show that modern language models do not encode much more geographic information than Word2Vec, but that larger (non-autoregressive) language models encode more information than their smaller counterparts, suggesting that such information is nevertheless available through higher-order co-occurrence statistics.
2 Related Work
Word representations based on distributional statistics have been theorised to capture a wide range of information Schütze (1992). To evaluate this, a considerable body of literature has made use of semantic similarity, relatedness, and analogy datasets Agirre et al. (2009); Bruni et al. (2012); Baroni et al. (2014); Faruqui et al. (2014); Hill et al. (2015); Drozd et al. (2016); Abdou et al. (2018). Asking a broader question, Rubinstein et al. (2015) investigated the types of semantic information which are encoded by different classes of word embedding models, finding that taxonomic properties (such as animacy) are well-modelled. In a similar direction, Collell Talleda and Moens (2016) and Lucy and Gauthier (2017) draw on semantic norm datasets to test how well these models can encode a range of perceptual and conceptual features.
In the context of the neural language models, several recent works such as Davison et al. (2019) and Petroni et al. (2019) have attempted to extract factual and commonsense knowledge from them by posing knowledge base triplets as close statements which are used to query the models. Most related to this work, Forbes et al. (2019) investigate whether LMs can learn physical commonsense through language. They find that LM representations do indeed encode information regarding object properties (e.g., bananas are yellow), and affordances (e.g. bananas can be eaten) but they do not to capture the more subtle interplay between the two.
Studies investigating the geometry of word representations have focused on intrinsic dimensionality and subspaces Yaghoobzadeh and Schütze (2016); Coenen et al. (2019), embedding concentration in narrow cones and anisotropy Mimno and Thompson (2017); Ethayarajh (2019), and comparisons to the geometry of cognitive measurements or perceptual spaces Abnar et al. (2019); Abdou et al. (2021). In this work we investigate the degree of isomorphism between language model representations of geographic location names and their real-world counterparts. See Vulić et al. (2020) for a general discussion of isomorphism across language models, what explains this, and what it depends on.
3 Methodology
We probe language model representations of city and country names. Below, we propose three classification/regression probing tasks, as an well as an analysis based on (relational) similarity.
3.1 Probing tasks
Task 1: Predicting geo-coordinates
We probe LMs’ representation about whether they convey information about the actual position of the location. To this extent, we train a model to predict GPS coordinates (latitude and longitude) given the location’s representation through language models. We evaluate prediction error by computing the distance in kilometers between the predicted GPS point and the expected point, and compute the average of error distances. Since we use linear models (Lasso111We also include an MLP regressor for comparison.) to predict geo-coordinates, we effectively evaluate the isomorphism of language model representations to the physical world. Our target variable is two-dimensional, and we evaluate non-local relations.
Task 2: Predicting population sizes
In the physical world, cities are characterized not only by their location, but also by their size and population. There is indeed a major difference between Shanghai (27M people) and Worcester (101K people). Given the representation of a country name or a city name, we train a probe to predict the population living in the location. We evaluate the performance by computing the mean squared error. This is a one-dimensional attribute included here for comparison.
Task 3: Predicting neighboring countries
Borders between countries are also an important geographic relation that is closely related to a country’s international policy. It also provides information about the continental situation ; indeed, a country with no land borders must be an island. To probe language models for neighboring relations, we train an classifier to predict whether two countries share a border or not, given the pair of representations. We report the probe accuracy. Neighboring relations are local and included here for comparison.
3.2 Control tasks and scores
Hewitt and Liang (2019) have shown the importance of a control task to balance the probe accuracy. We construct our control tasks by randomly permuting the target variables and train the model on this randomly-permuted dataset. We repeat this control task 10 times and take the mean error/accuracy.
Probe classifier selectivity
For the country borders classification task, we define the probe selectivity as the difference between the probe accuracy on the original task and the accuracy on the control task Hewitt and Liang (2019).
Probe error reduction
Similarly, we define the probe error reduction, which measures how well the probe performs on the original task compared to the control task, by comparing positive error measures of both tasks through error reduction, i.e., the proportion of control task error that is reduced in our probe.
Less formally, if the PER is between 0 and 1, its upper bound, it indicates to what extent the probe is doing better on the original task than on the control task ; a negative PER indicates the probe is doing worse on the original task than on the control task. We use PER for regression tasks rather than absolute error or MSE, because figures are more easily interpretable when properly baselined. Note that if absolute error is 0, PER is 1; if absolute error is as high as the random baseline, PER is 0. Under the assumption performance is better than random, PER thus ranges between 0 and 1.
3.3 Similarity Analysis
For each language models, we compute the cosine similarity between each pair of cities. Our hypothesis is that cities belonging to the same country will be more similar than two cities from different countries. We report both average similarities (cities in the same country and cities in different countries) and also compute the histogram of the distribution of these two sets of similarities.
4 Experimental Settings and Data
Language models
We compare three different state-of-the-art contextualized LMs, namely BERT (Devlin et al., 2019), RoBERTa (Liu et al., 2019) and GPT-2 (Radford et al., 2019). A major difference between GPT-2 and the two other models is that it is trained to be unidirectional (i.e. using next-token language modelling), whereas BERT and RoBERTa are trained to be bidirectionnal (i.e. using masked language modelling). For BERT and RoBERTa, we used both base ( layers and output dimensions) and large ( layers and output dimensions) version, so we can study the influence of the model’s size. We probe widely-used pre-trained versions of these models, as they have been trained in their respective original papers. Both versions of BERT and RoBERTa have been pre-trained on the BookCorpus (800M words) and English Wikipedia (2.5B words). GPT-2 is also trained on the Book Corpus.
Geographic data
We get a list of names of cities around the world having a population of 100K or more people, with their GPS coordinates (Latitude and Longitude), their country and their population, from a MaxMind database222https://www.kaggle.com/max-mind/world-cities-database. Country geo-coordinates correspond to the centroid of each country. We obtain population size data from the United Nations’ Human Development Data Center333http://hdr.undp.org/en/data, given in millions of inhabitants. Our datasets are then composed of 3527 cities and 249 countries and territories.
Representations extraction
Since the LMs provide contextualised token representations, we provide three linguistically-basic contexts : He lives in , She moved to and I come from , replacing with either a city name or a country name. For each context, we extract the representation corresponding to the name by averaging the hidden states of the last 4 layers of the LMs. Following Bommasani et al. (2020), we use a mean pooling of subwords’ representations when necessary.
Word2Vec
To compare static and contextualized models, we also use pre-trained Word2Vec static representations learned over the Google News dataset (150B words), provided by the gensim444https://radimrehurek.com/gensim/ library. The representational vectors are in 300 dimensions.
| Task | Probe | Dataset | Word2Vec | BERT | BERT-L | GPT-2 | RoBERTa | RoBERTa-L |
|---|---|---|---|---|---|---|---|---|
| GPS | MLP | city | 0.666 | 0.479 | 0.585 | 0.424 | 0.466 | 0.517 |
| country | 0.57 | 0.424 | 0.58 | 0.422 | 0.405 | 0.468 | ||
| Lasso | city | 0.498 | 0.454 | 0.555 | 0.364 | 0.398 | 0.466 | |
| country | 0.395 | 0.394 | 0.465 | 0.349 | 0.378 | 0.454 | ||
| Population | MLP | city | 0.507 | 0.694 | 0.704 | 0.624 | 0.696 | 0.707 |
| country | 0.618 | 0.59 | 0.63 | 0.568 | 0.528 | 0.505 | ||
| Lasso | city | 0.628 | 0.539 | 0.55 | 0.447 | 0.403 | 0.531 | |
| country | -0.242 | 0.116 | 0.276 | 0.372 | 0.078 | 0.116 |
Probe models
For the classification problem (task 3), we use a 100-units single-layered MLP as a classifier. As a probe for regression task (1 and 2), we train both a Lasso regressor with a L2-penalty of and a single hidden layer MLP with 100 units. We arbitrarily choose , except for task 1 for which we remarked that significantly decreased the training time without affecting to much the error ratio. No other hyperparameters-tuning was done, since we are not interested in designing the best task-specific models. Probes are trained on a random split of 80% of the dataset, and evaluate on the 20% remaining.
| Accuracy | Probe | ||
|---|---|---|---|
| Model | Prb. | Ctrl. | Selectivity |
| Word2Vec | 0.849 | 0.49 | 0.36 |
| BERT | 0.856 | 0.51 | 0.34 |
| BERT-L | 0.873 | 0.51 | 0.37 |
| GPT-2 | 0.808 | 0.51 | 0.3 |
| RoBERTa | 0.817 | 0.51 | 0.31 |
| RoBERTa-L | 0.843 | 0.52 | 0.32 |
5 Results
In Table 1, probe error reduction scores are displayed for both regression tasks, namely Task 1 and 2. The full list of performances (error distances in kilometers) for Task 1 is provided in the appendix A.1. In Appendix A.2, error values for population prediction with countries are reported. Since the number of countries is relatively small, we perform a 5-fold cross-validation with this dataset.
When predicting a location’s GPS coordinates, all models have an error reduction score significantly larger than 0, across both families of regressors and across cities and countries. The Word2Vec model especially has often the lowest error and a high PER, showing no real weakness compared to contextualised models. GPT-2 has the lowest PER and the worst error value, across almost all tasks and probes. The two regressors globally lead to the same error values, even though MLP allows a slightly bigger error reduction than Lasso. We can also note that, for both BERT and RoBERTa, increasing model size (moving from base models to large), one increases the gap between the performance on the task and on the random control, reducing overall error. Finally, we can also see that the models are generally not very accurate for predicting GPS coordinates, leading to an average error of 2’500-5’000 kilometers. It is relatively accurate continent-wise, but not precise.
In sum, we can conclude that it is non-trivial to learn linear maps from language models to physical world geo-coordinates, presumably because representations are non-isomorphic. On the other hand, the improvements from larger models seem to suggest that geographical knowledge is available from higher-order co-occurrence statistics. Static model also provide a strong baseline compared to contextualised models.
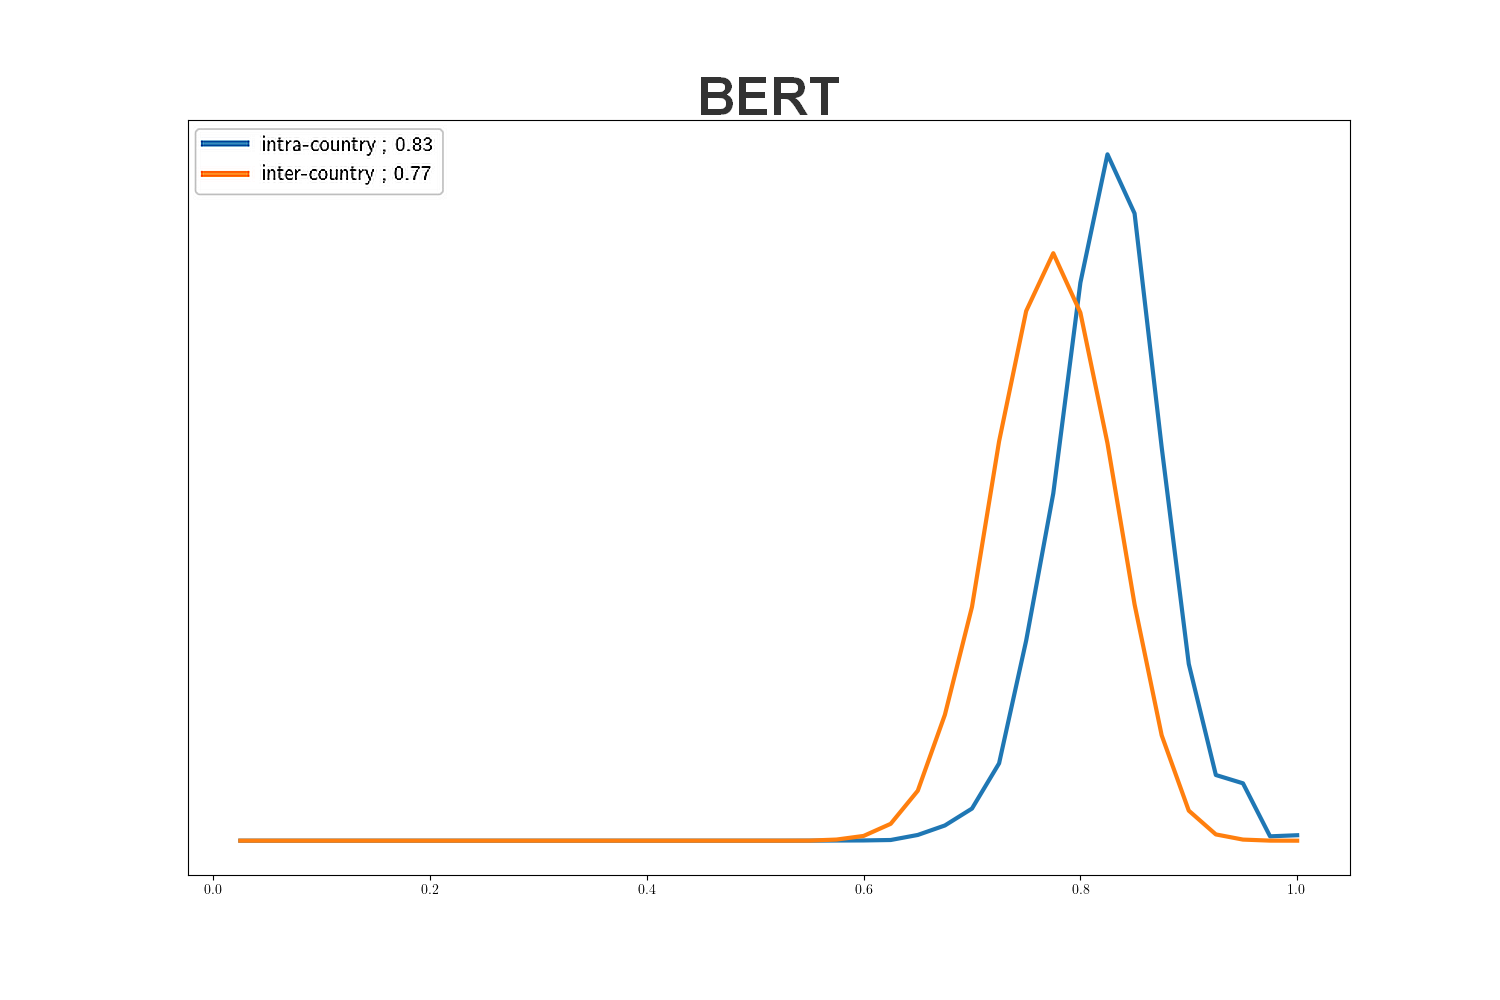
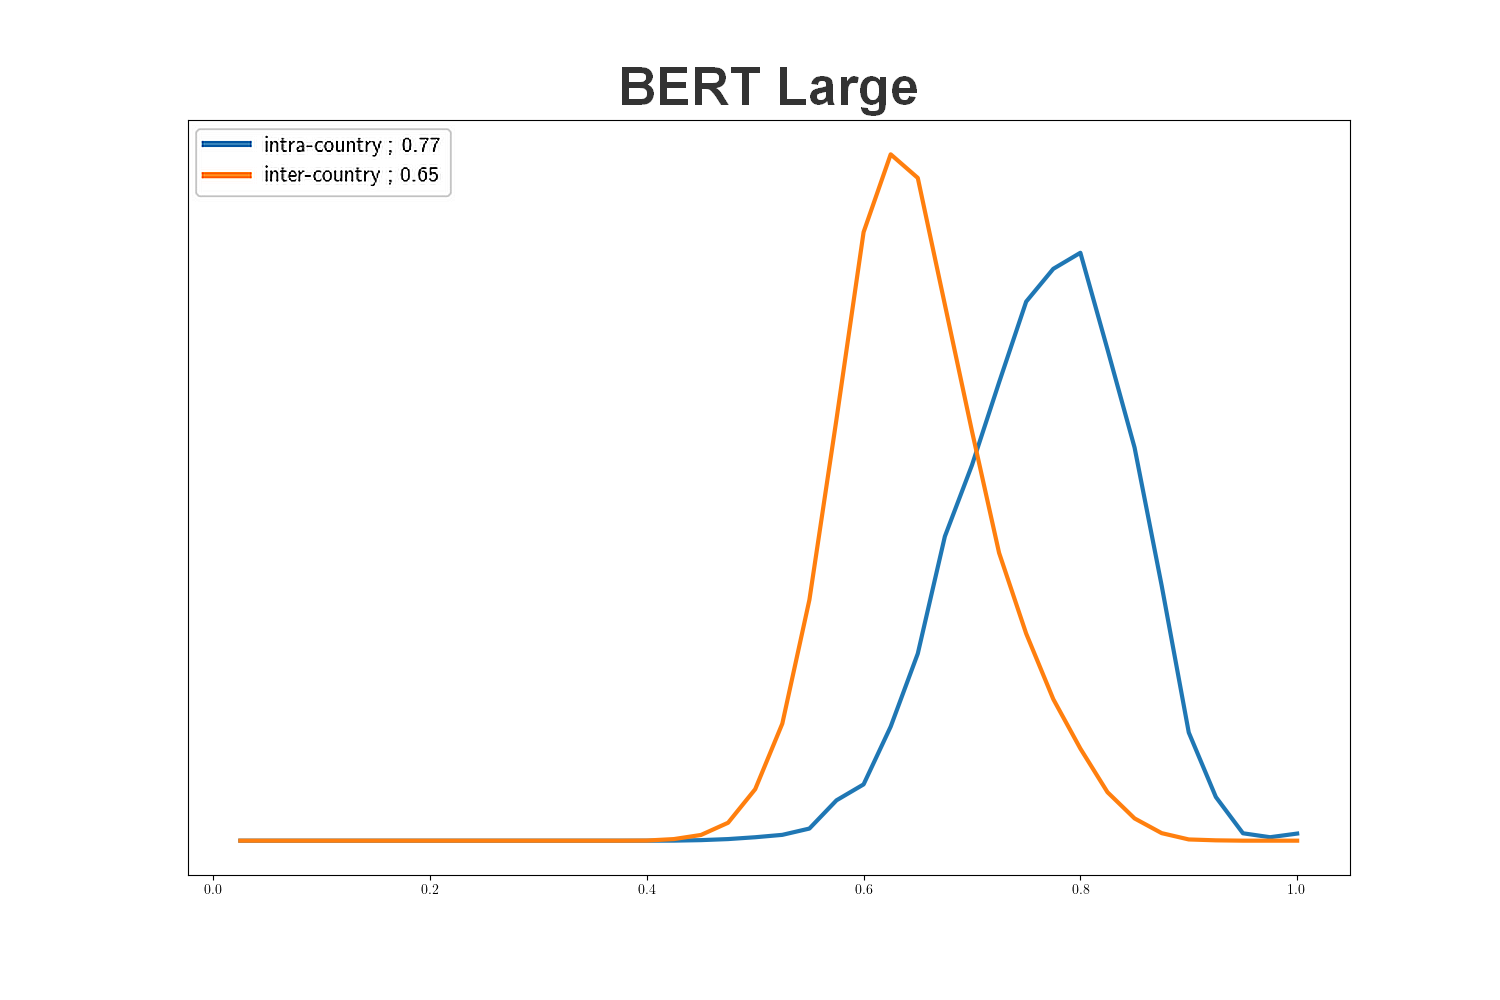
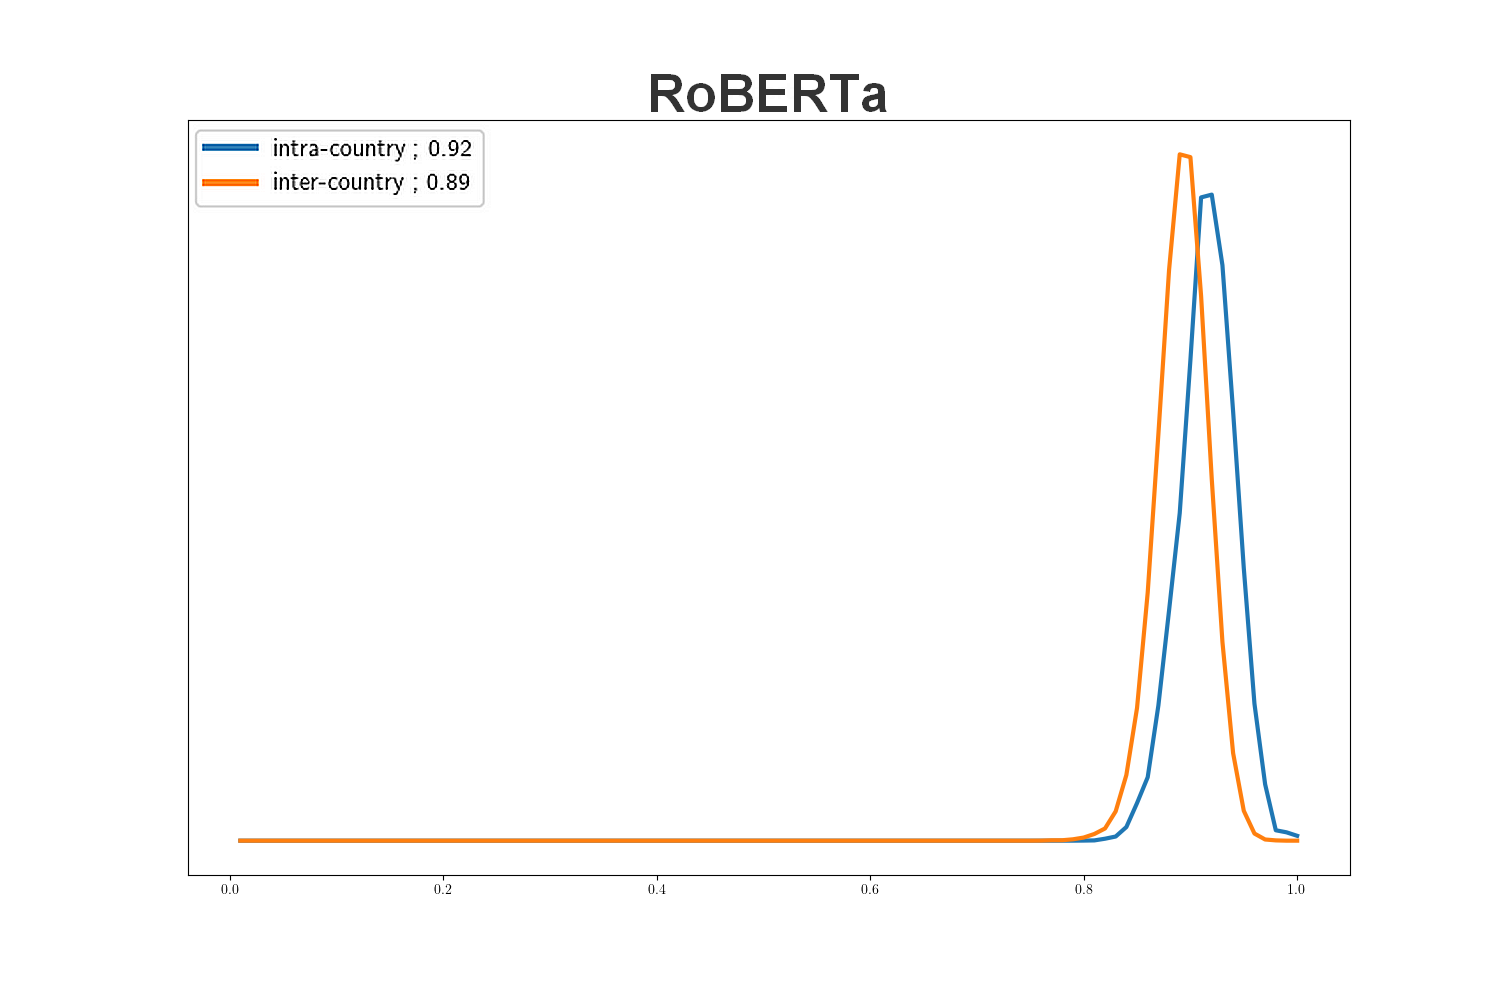
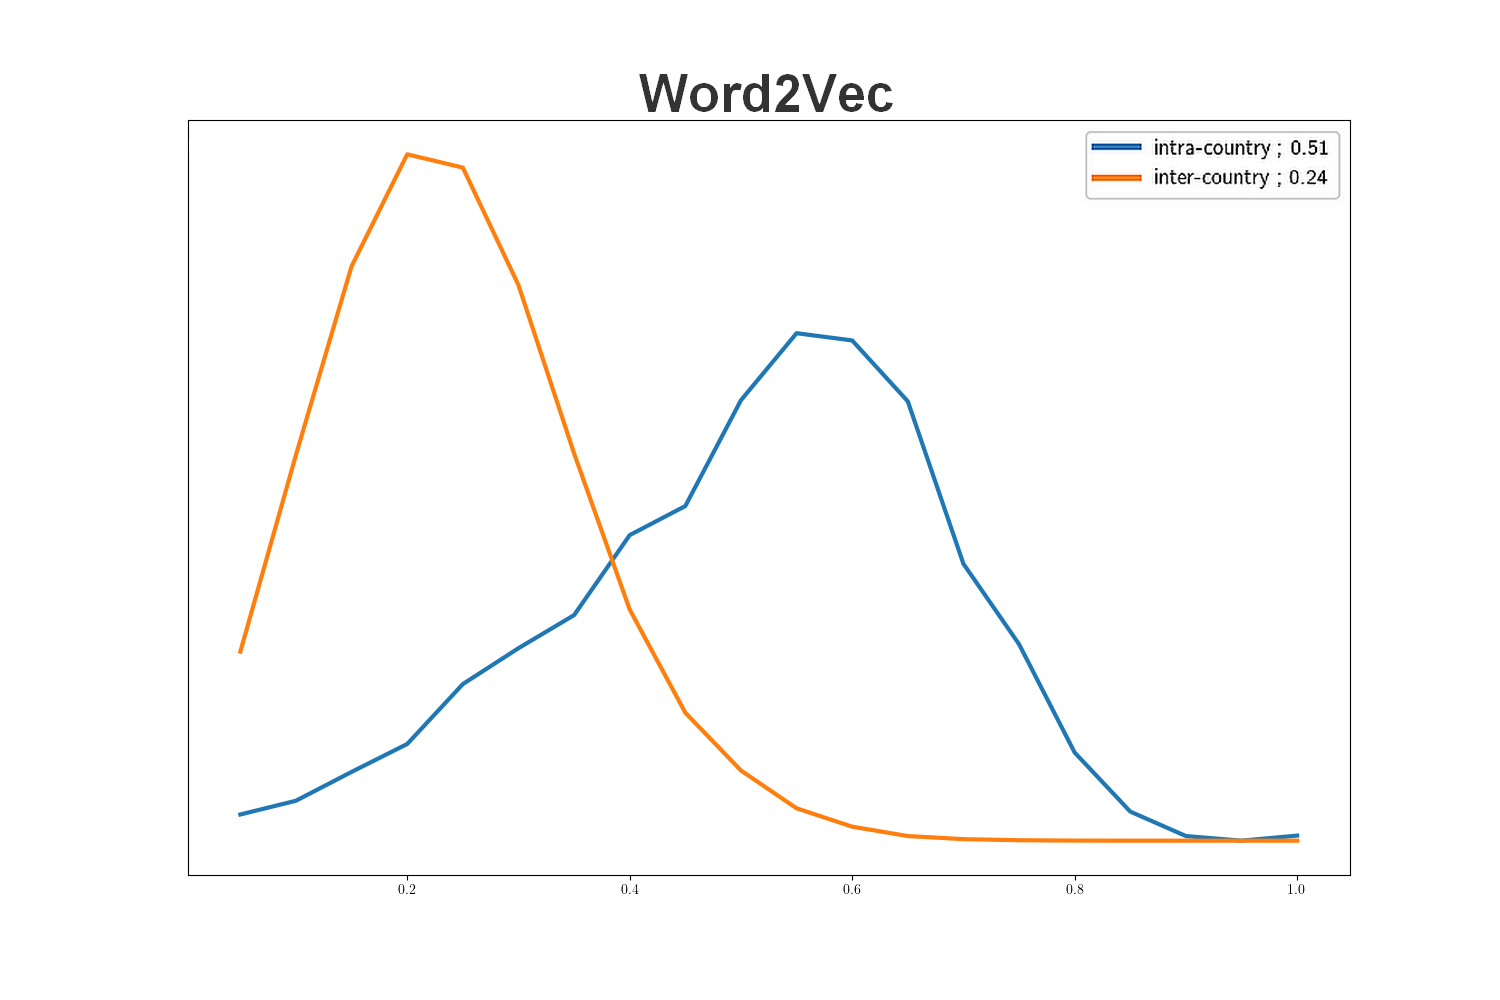
| Model | intra | inter | gap |
|---|---|---|---|
| Word2Vec | 0.51 | 0.24 | 0.27 |
| BERT | 0.83 | 0.77 | 0.06 |
| BERT-L | 0.77 | 0.65 | 0.12 |
| GPT-2 | 0.90 | 0.89 | 0.01 |
| RoBERTa | 0.92 | 0.89 | 0.03 |
| RoBERTa-L | 0.94 | 0.93 | 0.01 |
In Task 2, the gap between the two regressors is more noticeable compared to Task 1: MLP exhibits much higher error reductions between the original task and the random control, and generally allow for lower error numbers. We remark that our Lasso model is particularly ineffective for country population prediction, leading only to low PER and high errors. On this task and dataset, GPT-2 random control error is high, leading to an outlying PER for this LM, even if its probing-task error is still the biggest. The scheme observed in Task 1 between base and large version of BERT and RoBERTa seems to hold, with only an exception for countries with MLP. This overall indicates that a one-dimensional attribute is easier to learn than a two-dimensional space, giving more expressive models an upper hand.
Table 2 shows the probe’s accuracy and selectivity on Task 3, predicting country borders. This is a local relation, included for comparison. Probe accuracy scores exhibit little variance, and control accuracies are almost identical, close to 0.5, which is expected for random binary classification. All language models allow exhibit probe accuracies above . This indicates the insufficiency of probing only for local relations.
The results of the similarity analysis on city names are displayed in Table 3 and in Figure 1. It is to be observed that representations are highly similar in contextualized LMs, especially compared to those from Word2Vec, which is in accordance with Ethayarajh (2019) results about anisotropy in higher layers of LMs. On the other hand, we observe that representations of cities in the same country are always more similar than cities in different countries, even if the gap is small for some models. Finally, we can note that no conclusion can be made about the effect of increasing the LM’s size in this analysis: the gap is bigger in large version of BERT than in the base version, but this relation does not hold for RoBERTa.
6 Discussion
Tasks 1 to 3 suggest that the amount of geographic knowledge learned by the language models is limited. On the one hand, trained predictors for both GPS coordinates and population are of poor quality, making average errors of thousands of kilometers or hundreds of millions of people. On the other hand, the probes are doing significantly better on these tasks than during random control, and information about country borders have been shown by results of Task 3 to be embedded in pre-trained language models’ representations. This suggests that approximate geographic positions and their neighborhood are learned during training by these models. Similarity analysis also indicates that pre-trained models have learned to associate representations of cities in the same country.
In the end, language models, whether they are static or contextualized, seem to be able to extract limited geographical knowledge from higher-order co-occurrence statistics. The size of the language models, as well as the amount of data they were trained on, seem to be important for how well they encode this information. Increasing the model’s size leads to best performances and error reduction scores, indicating a better learning of geographic knowledge. Overall, context-sensitive language models do not show significantly better performances than Word2Vec. Finally, our experiments demonstrate the importance of probing for global, multi-dimensional relations that require near-isomorphism and are not easily saturated.
In the future, it would be of interest to test models finetuned on corpora which contain a wealth of geographic information (e.g. a corpus of atlases) in order to evaluate a) whether representational alignment to real-world geography can be affected by seeing factual expressions such as “Italy, France, and Switzerland share borders." and b) how exactly representations of entities (e.g. France) alter when the model sees factual statements as the one above.
Acknowledgements
We thank the anonymous reviewers. Mostafa Abdou was funded by a Google Focused Research Award. We used data created by MaxMind, available from http://www.maxmind.com/.
References
- Abdou et al. (2021) Mostafa Abdou, Artur Kulmizev, Daniel Hershcovich, Stella Frank, Ellie Pavlick, and Anders Søgaard. 2021. Can language models encode perceptual structure without grounding? a case study in color.
- Abdou et al. (2018) Mostafa Abdou, Artur Kulmizev, and Vinit Ravishankar. 2018. Mgad: Multilingual generation of analogy datasets. In Proceedings of the Eleventh International Conference on Language Resources and Evaluation (LREC 2018).
- Abnar et al. (2019) Samira Abnar, Lisa Beinborn, Rochelle Choenni, and Willem Zuidema. 2019. Blackbox meets blackbox: Representational similarity and stability analysis of neural language models and brains. arXiv preprint arXiv:1906.01539.
- Agirre et al. (2009) Eneko Agirre, Enrique Alfonseca, Keith Hall, Jana Kravalova, Marius Pasca, and Aitor Soroa. 2009. A study on similarity and relatedness using distributional and wordnet-based approaches.
- Baroni et al. (2014) Marco Baroni, Georgiana Dinu, and Germán Kruszewski. 2014. Don’t count, predict! a systematic comparison of context-counting vs. context-predicting semantic vectors. In Proceedings of the 52nd Annual Meeting of the Association for Computational Linguistics (Volume 1: Long Papers), pages 238–247.
- Bommasani et al. (2020) Rishi Bommasani, Kelly Davis, and Claire Cardie. 2020. Interpreting Pretrained Contextualized Representations via Reductions to Static Embeddings. In Proceedings of the 58th Annual Meeting of the Association for Computational Linguistics, pages 4758–4781, Online. Association for Computational Linguistics.
- Bruni et al. (2012) Elia Bruni, Gemma Boleda, Marco Baroni, and Nam-Khanh Tran. 2012. Distributional semantics in technicolor. In Proceedings of the 50th Annual Meeting of the Association for Computational Linguistics (Volume 1: Long Papers), pages 136–145.
- Coenen et al. (2019) Andy Coenen, Emily Reif, Ann Yuan, Been Kim, Adam Pearce, Fernanda Viégas, and Martin Wattenberg. 2019. Visualizing and measuring the geometry of bert. arXiv preprint arXiv:1906.02715.
- Collell Talleda and Moens (2016) Guillem Collell Talleda and Marie-Francine Moens. 2016. Is an image worth more than a thousand words? on the fine-grain semantic differences between visual and linguistic representations. In Proceedings of the 26th International Conference on Computational Linguistics, pages 2807–2817. ACL.
- Davison et al. (2019) Joe Davison, Joshua Feldman, and Alexander Rush. 2019. Commonsense knowledge mining from pretrained models. In Proceedings of the 2019 Conference on Empirical Methods in Natural Language Processing and the 9th International Joint Conference on Natural Language Processing (EMNLP-IJCNLP), pages 1173–1178, Hong Kong, China. Association for Computational Linguistics.
- Devlin et al. (2019) Jacob Devlin, Ming-Wei Chang, Kenton Lee, and Kristina Toutanova. 2019. Bert: Pre-training of deep bidirectional transformers for language understanding.
- Drozd et al. (2016) Aleksandr Drozd, Anna Gladkova, and Satoshi Matsuoka. 2016. Word embeddings, analogies, and machine learning: Beyond king-man+ woman= queen. In Proceedings of coling 2016, the 26th international conference on computational linguistics: Technical papers, pages 3519–3530.
- Ethayarajh (2019) Kawin Ethayarajh. 2019. How contextual are contextualized word representations? comparing the geometry of BERT, ELMo, and GPT-2 embeddings. In Proceedings of the 2019 Conference on Empirical Methods in Natural Language Processing and the 9th International Joint Conference on Natural Language Processing (EMNLP-IJCNLP), pages 55–65. Association for Computational Linguistics.
- Faruqui et al. (2014) Manaal Faruqui, Jesse Dodge, Sujay K Jauhar, Chris Dyer, Eduard Hovy, and Noah A Smith. 2014. Retrofitting word vectors to semantic lexicons. arXiv preprint arXiv:1411.4166.
- Forbes et al. (2019) Maxwell Forbes, Ari Holtzman, and Yejin Choi. 2019. Do neural language representations learn physical commonsense? arXiv preprint arXiv:1908.02899.
- Hewitt and Liang (2019) John Hewitt and Percy Liang. 2019. Designing and interpreting probes with control tasks. In Proceedings of the 2019 Conference on Empirical Methods in Natural Language Processing and the 9th International Joint Conference on Natural Language Processing (EMNLP-IJCNLP), pages 2733–2743, Hong Kong, China. Association for Computational Linguistics.
- Hill et al. (2015) Felix Hill, Roi Reichart, and Anna Korhonen. 2015. Simlex-999: Evaluating semantic models with (genuine) similarity estimation. Computational Linguistics, 41(4):665–695.
- Jiang et al. (2020) Zhengbao Jiang, Frank F Xu, Jun Araki, and Graham Neubig. 2020. How can we know what language models know? Transactions of the Association for Computational Linguistics, 8:423–438.
- Liu et al. (2019) Yinhan Liu, Myle Ott, Naman Goyal, Jingfei Du, Mandar Joshi, Danqi Chen, Omer Levy, Mike Lewis, Luke Zettlemoyer, and Veselin Stoyanov. 2019. Roberta: A robustly optimized bert pretraining approach.
- Lucy and Gauthier (2017) Li Lucy and Jon Gauthier. 2017. Are distributional representations ready for the real world? evaluating word vectors for grounded perceptual meaning. arXiv preprint arXiv:1705.11168.
- Mikolov et al. (2013) Tomás Mikolov, Kai Chen, Greg Corrado, and Jeffrey Dean. 2013. Efficient estimation of word representations in vector space. In 1st International Conference on Learning Representations, ICLR 2013, Scottsdale, Arizona, USA, May 2-4, 2013, Workshop Track Proceedings.
- Mimno and Thompson (2017) David Mimno and Laure Thompson. 2017. The strange geometry of skip-gram with negative sampling. In Empirical Methods in Natural Language Processing.
- Petroni et al. (2019) Fabio Petroni, Tim Rocktäschel, Sebastian Riedel, Patrick Lewis, Anton Bakhtin, Yuxiang Wu, and Alexander Miller. 2019. Language models as knowledge bases? In Proceedings of the 2019 Conference on Empirical Methods in Natural Language Processing and the 9th International Joint Conference on Natural Language Processing (EMNLP-IJCNLP), pages 2463–2473, Hong Kong, China. Association for Computational Linguistics.
- Radford et al. (2019) Alec Radford, Jeff Wu, R. Child, David Luan, Dario Amodei, and Ilya Sutskever. 2019. Language models are unsupervised multitask learners.
- Reif et al. (2019) Emily Reif, Ann Yuan, Martin Wattenberg, Fernanda B Viegas, Andy Coenen, Adam Pearce, and Been Kim. 2019. Visualizing and measuring the geometry of bert. In Advances in Neural Information Processing Systems, volume 32. Curran Associates, Inc.
- Roberts et al. (2020) Adam Roberts, Colin Raffel, and Noam Shazeer. 2020. How much knowledge can you pack into the parameters of a language model? arXiv preprint arXiv:2002.08910.
- Rubinstein et al. (2015) Dana Rubinstein, Effi Levi, Roy Schwartz, and Ari Rappoport. 2015. How well do distributional models capture different types of semantic knowledge? In Proceedings of the 53rd Annual Meeting of the Association for Computational Linguistics and the 7th International Joint Conference on Natural Language Processing (Volume 2: Short Papers), pages 726–730.
- Schütze (1992) Hinrich Schütze. 1992. Dimensions of meaning. In SC, pages 787–796.
- Søgaard et al. (2018) Anders Søgaard, Sebastian Ruder, and Ivan Vulić. 2018. On the limitations of unsupervised bilingual dictionary induction. In Proceedings of the 56th Annual Meeting of the Association for Computational Linguistics (Volume 1: Long Papers), pages 778–788, Melbourne, Australia. Association for Computational Linguistics.
- Tenney et al. (2019) Ian Tenney, Dipanjan Das, and Ellie Pavlick. 2019. BERT rediscovers the classical NLP pipeline. In Proceedings of the 57th Annual Meeting of the Association for Computational Linguistics, pages 4593–4601, Florence, Italy. Association for Computational Linguistics.
- Vulić et al. (2020) Ivan Vulić, Sebastian Ruder, and Anders Søgaard. 2020. Are all good word vector spaces isomorphic? In Proceedings of the 2020 Conference on Empirical Methods in Natural Language Processing (EMNLP), pages 3178–3192, Online. Association for Computational Linguistics.
- Yaghoobzadeh and Schütze (2016) Yadollah Yaghoobzadeh and Hinrich Schütze. 2016. Intrinsic subspace evaluation of word embedding representations. arXiv preprint arXiv:1606.07902.
Appendix A Appendices
A.1 Task 1 performances
On the following tables, Prb. stands for “probing task” and Ctl. for “control task”.
| Model | MLP | Lasso | ||
|---|---|---|---|---|
| Prb. | Ctl. | Prb. | Ctl. | |
| Word2Vec | 2612 | 7825 | 3447 | 6870 |
| BERT | 4195 | 8057 | 3780 | 6920 |
| BERT-L | 3315 | 7997 | 3077 | 6911 |
| GPT-2 | 4613 | 8011 | 4498 | 7070 |
| RoBERTa | 4278 | 8007 | 4148 | 6894 |
| RoBERTa-L | 3876 | 8029 | 3686 | 6903 |
| Model | MLP | Lasso | ||
|---|---|---|---|---|
| Prb. | Ctrl. | Prb. | Ctrl. | |
| Word2Vec | 3738 | 8695 | 4379 | 7234 |
| BERT | 4950 | 8598 | 4944 | 8152 |
| BERT-L | 3603 | 8578 | 4488 | 8394 |
| GPT-2 | 5111 | 8840 | 5658 | 8684 |
| RoBERTa | 5522 | 9275 | 5036 | 6091 |
| RoBERTa-L | 4764 | 8960 | 4433 | 8125 |
A.2 Task 2 performances on countries
Reported results are mean squared errors. Therefore, mean absolute errors are at most of the magnitude of few hundreds (of millions) of people.
| Model | MLP | Lasso | ||
|---|---|---|---|---|
| Prb. | Ctrl. | Prb. | Ctrl. | |
| Word2Vec | 12142 | 31815 | 22112 | 17810 |
| BERT | 16382 | 39952 | 26583 | 30063 |
| BERT-L | 17166 | 46365 | 22559 | 31174 |
| GPT-2 | 15264 | 3566 | 32130 | 51171 |
| RoBERTa | 15266 | 32338 | 26375 | 28592 |
| RoBERTa-L | 16390 | 33112 | 22927 | 25923 |