Exclusive decay study of the 16.62 MeV (2-, T=1) resonance in 12C
Abstract
The 3 decay of the 16.62 MeV (2-, T=1) resonance in 12C has been studied for nearly a century starting with one of the first nuclear reaction studies at the Cavendish Laboratory in the 1930s. In the hitherto latest study published a decade ago a model based on earlier work from the 1960s was found to give a good account of a set of inclusive data. This model describes the decay as an l=3 -particle populating the 2+ state of 8Be. Here we provide new exclusive data on the 3 decay of the 16.62 MeV resonance, and demonstrate that the decay is best described by a model with predominantly l=1 emission with an admixture of l=3.
keywords:
Collective levels , breakup and momentum distributions , multifragment emission and correlationsiint \restoresymbolTXFiint
1 Introduction
The 16.62 MeV (2-, T=1) resonance in 12C is positioned 663 keV above the proton threshold in 12C. With a width of 300 keV the state is prolifically produced by impinging 1 MeV protons on 11B, which was one of the first nuclear reactions to be studied at the Cavendish Laboratory [1, 2, 3].
There are at least three different interests in the p+11B reaction at the energies relevant for the population of the 2- resonance. Firstly, roughly 50% of the decay leads to the 3-final state (with the rest being back to p+11B ), and the mechanism of this three-body decay has been in focus since the early work at the Cavendish Laboratory. Secondly, the 11B(p,3) reaction is considered a candidate for fusion energy generators [4], a possibility which is still being pursued in research [5] and by several commercial companies. Finally, the reaction is considered as a potential way to enhance proton cancer therapy efficiency by adding a concentration of boron to the tumor volume, which will then produce high-LET particles when protons in the Bragg peak enter the tumor and interact with the boron, e.g. [6].
Here we present a new complete kinematics measurement of the 3-decay of the 16.62 MeV resonance and demonstrate how conflicting conclusions on its decay mechanism from previous studies throughout almost a century are a consequence of previous analyses being based primarily on inclusive data.
2 Review of previous work
With unnatural parity s-wave partial waves cannot contribute to the 3-decay of the 16.62 MeV resonance. The initial work at the Cavendish Laboratory in the 1930s established that the 3-decay is strongly influenced by the broad 2+ state in 8Be as illustrated in Fig. 1. Within this picture the first particle can have orbital angular momentum with either l=1 or l=3 relative to 8Be.
Until the end of the 1960s, the problem was only visited intermittently. Then, in the period 1967-1972 at least five different groups published detailed work on the problem. Some of this work was spurred by MacDonald, who in 1965 pointed to the importance of symmetry effects related to the boson character of the three particles in the final state, which should lead to characteristic patterns in the Dalitz plot of the decay [7].
In 1967 the first high quality data came from Kamke and Krug [8] with a detailed analysis and interpretation given by Schäfer in 1970 [9], who confirmed the presence of symmetry effects and concluded that a strong l=3 component is needed to understand the data. In 1969 Quebert and Marquez in an independent study also identified the symmetry effect and pointed to a dominant l=3 contribution [10]. Next, Giorni et al. published data in 1968 [11] and interpretation in 1970 [12] where the data were fitted with an adjustable coherent sum of l=1 and l=3 contributions leading to 83% branching ratio for l=1 (no uncertainty given). In 1970 Cockburn et al. also provided high quality data and a remarkably illuminating analysis and discussion of the data [13]. Cockburn et al. were able to make a fit to the full Dalitz plot including a coherent sum of l=1 and l=3 contributions, which resulted in a ratio of reduced widths of =0.60-0.65. Since the l=3 wave is damped by the angular momentum barrier, this could be in rough agreement with the ratio deduced by Giorni [12]. By analysing regions in the Dalitz plot with the largest discrepancies between theory and data, Cockburn et al. could identify the effect of rescattering between primary (emitted from 12C) and secondary (emitted from 8Be) particles, and also examined if the properties of the 8Be 2+ resonance were affected by the presence of the third particle. The last result from this period was published by Treado et al. [14]. In this work a ratio of 10(3) between the branching ratios to the l=3 and l=1 components in favour of l=1 was deduced from an analysis of angular correlations between primary and secondary particles. This indicates a stronger dominance of l=1 over l=3 relative to the findings of Cockburn et al. and Giorni et al.
Somewhat later two scans of the reaction 11B(p,3) were published with the aim of deducing the astrophysical reaction rate [15, 16]. In these studies the treatment of the 3 breakup of 12C states populated in the reaction was somewhat crude, e.g. neglecting symmetrisation effects, and including only the l=1 contribution.
In 2011 Stave et al. [17] published a new measurement of the 3-decay of the 16.62 MeV state. They refer to [16] for providing the modern view of the decay of the 2- state emphasizing the choice of l=1. Stave et al. then use a comparison of their new data to a model neglecting symmetry effects to conclude that the primary particle is emitted with l=3 and the conclusions from [16] on the breakup mechanism of the 2- state therefore is erroneous.
All experiments referred to in this section used similar detector setups consisting of one or two small detectors with one at a fixed positions and the other free to rotate around the target position. In contrast, the present study uses a compact array of DSSDs allowing for a complete-kinematics measurement, as detailed later.
3 3 breakup model
We use the R-matrix based description and parametrisation of the 3 decay from [18]. This parametrisation has also been used to describe the decay of other states in 12C: e.g. 0+ (7.65 MeV) [19], 1+ (12.71 MeV) [20], and 2+ (16.11 MeV) [21]. This description takes into account the symmetry stemming from the Boson character of the -particles as pointed out by MacDonald [7]. The description is also very similar to those used by [10, 9, 12, 13].
In this description the decay amplitude is given by
| (1) |
where is a factor describing the resonant strength of the intermediate system. In R-matrix theory the single-level approximation is
| (2) |
To obtain the total decay weight the expression is symmetrised by permutation of the indices of the particles:
| (3) |
| Angular momentum quantum numbers of 12C. | |
| Same for 8Be. | |
| Orbital angular momentum in 12C8Be and 8Be2 | |
| The level populated in 8Be. Implicitly specifies and . | |
| Decay channel specifying . | |
| Reduced width amplitude for decay of 12C through channel . | |
| Same for decay of 8Be. | |
| Direction of the first emitted in the rest frame of 12C. | |
| Direction of the second emitted in the rest frame of 8Be. | |
| Relative energy between and | |
| , where is the wave number and is the channel radius for the primary breakup channel. | |
| Same for the secondary breakup channel. | |
| Penetrability for the primary and secondary breakup channels. | |
| Coulomb phase shifts. | |
| Hard-sphere phase shifts. | |
| Level energy of in the intermediate system. | |
| Shift function and boundary condition for the secondary breakup channel. |
Contributions from and can be added coherently. We will also allow an additional adjustable phase between the and amplitudes.
| (4) |
The question that will be adressed in the following is then: is the 3 breakup of the 16.62 MeV resonance well described by this model, and if so, is the breakup dominated by , , or a mixture of the two? We anticipate that the model cannot provide a perfect description of the data since it ignores any interaction between the -particle emitted in the process 12C8Be and those from 8Be2 [13, 20].
4 Experiment
The experiment was conducted at the Van de Graaff accelerator at Aarhus University. Other results from the same experimental campaign have been published elsewhere [22, 23].
The 16.62 MeV resonance was populated via (p), as depicted in Fig. 1. The accelerator provided a beam of , which was guided through a sequence of slits and steerers into the reaction chamber where it impacted a target on a carbon backing produced in house. The measurement time was hours with an integrated beam current of .
The detection setup consisted of four double-sided silicon-strip detectors (DSSSD’s). Two of the detectors were square ( with 16 rectangular strips on each side) and two were annular (inner radius and outer radius is with 32 radial strips (spokes) on the front side and 24 circular strips (rings) on the back), all from Micron Semiconductor Ltd.
The signals from the detectors were analysed in a conventional scheme of preamplifiers, amplifiers, ADCs and TDCs.
5 Data analysis and discussion
In the off-line analysis events of interest were selected by imposing energy and momentum conservation of three detected particles, and that the individual energies were larger than 250 keV. Finally, events corresponding to population of the ground state in 8Be, which cannot originate from the 2- state, were identified from the relative energy of pairs of -particles, and removed from further analysis. Of the order of 6 105 3-events were collected in the experiment.
In the lower panel in fig.2 we display the 3 events selected in this way in a Dalitz plot with axes and , where is the energy of the ’th alpha particle in the center-of-mass frame.
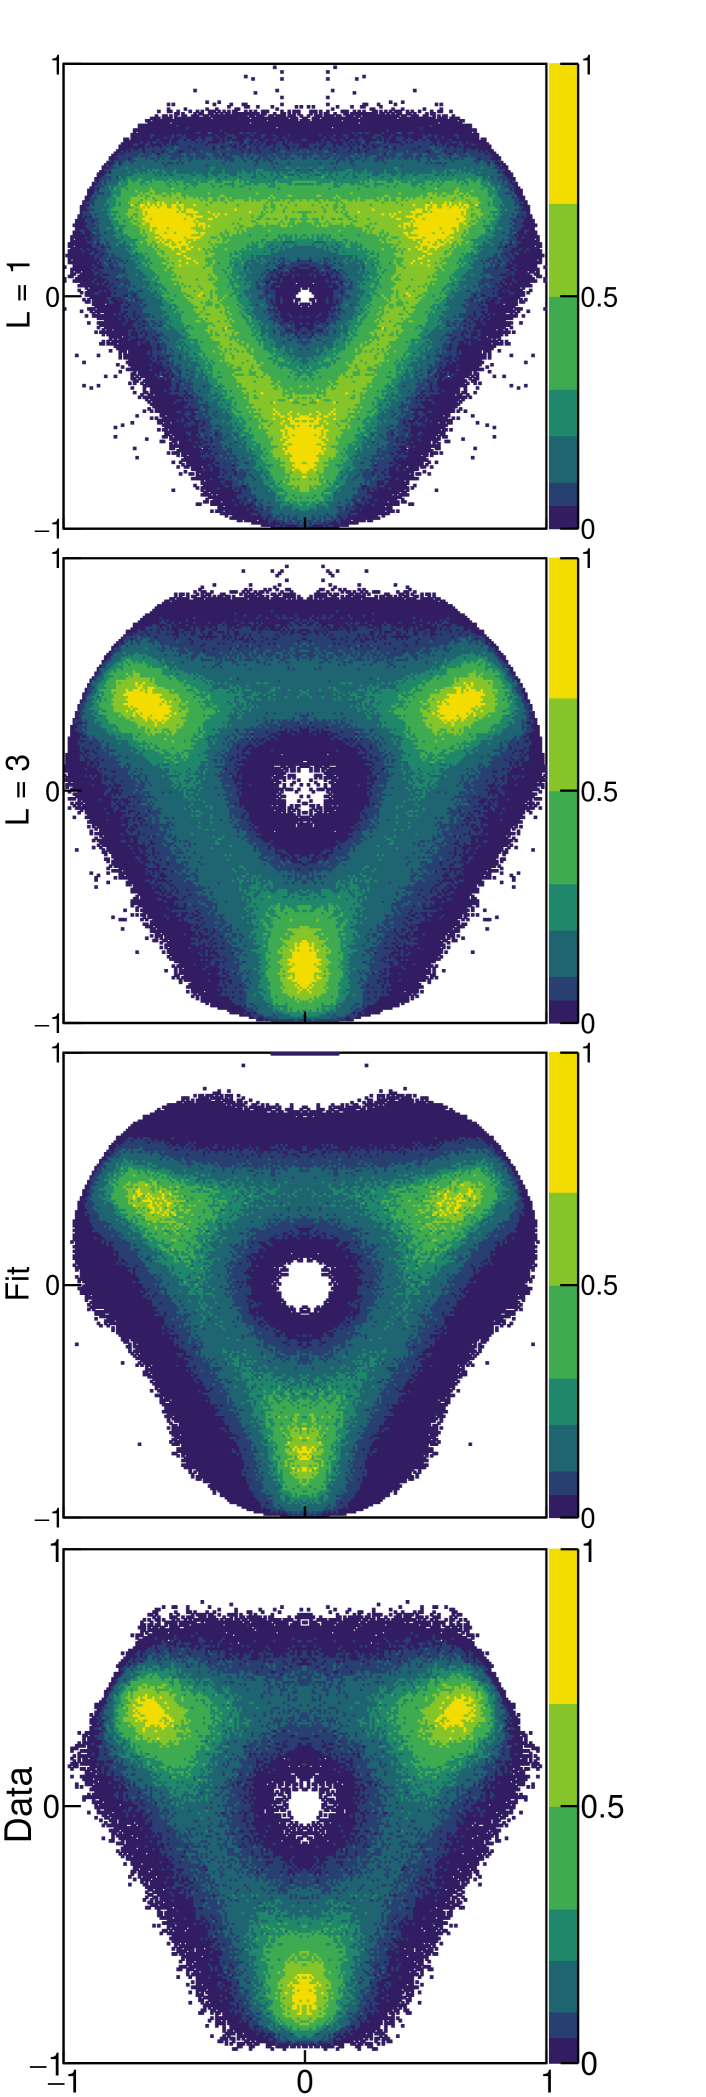
A qualitative understanding of the measured distribution of data in the Dalitz plot comes from the general description given in [24]: The events are confined to the inside of a circle due to momentum conservation. As first pointed out by [7], the centre and the rim of the circle are excluded due to symmetry requirements characteristic for a 2- state. The influence of resonances between two of the three -particles is seen as lines corresponding to fixed values of the relative energy of two -particles. The width of these lines are determined by the width of the resonance. Due to the presence of three identical particles this leads to the appearance of the triangular region of enhanced intensity in fig. 2. The intensity distribution along the lines of this triangle is determined by angular correlations. Interference effects are strongest where the lines overlap. Note, interference effects were ignored in several studies referred to in section 2, e.g. [15, 16, 17].
To facilitate a quantitative understanding of the data and to elucidate the veracity of the different conclusions on the 3-decay of the 2- resonance outlined in section 2 we explore if the data is well described by the model from section 3, and if so, if the breakup is dominated by , , or a mixture of the two. The upper three panels in fig.2 show the model prediction for , , and our best fit to a mixture of the two, respectively. In table 2 we give the result of fits of the models to the data. For completeness we also give the result of a fit to Eq. 4 with =0. Obviously, the best model is obtained by allowing an admixture of and - this is true whether or not the extra phase is included.
The fitted values of the admixture are in broad agreement with the ratios found by [12, 13]. The two models with only =1 or =3 give similar quality fits with a slight preference for the former. This preference is somewhat surprising based on visual inspection of the Dalitz plots in fig. 2.
To understand the difference between =1 and =3 we show in fig. 3 the projected -spectra from the Dalitz-plots in fig. 2.
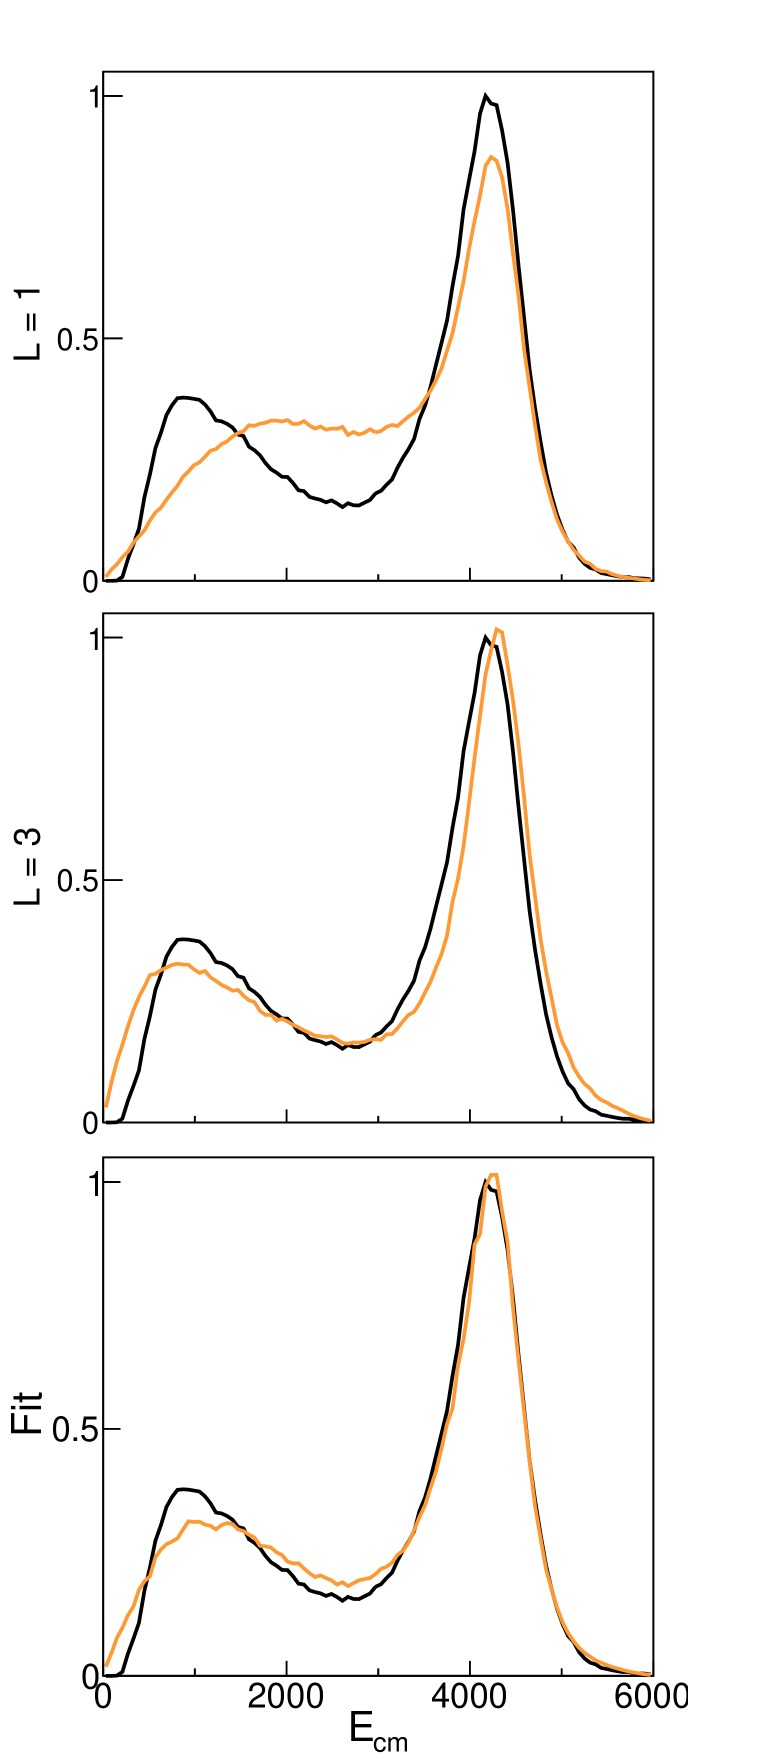
There are primarily two places where influences the decay amplitude given in Eq. 3: In the penetrability and in the angular part through Clebsh-Gordon coefficients and spherical harmonic functions. The effect of the penetrability can be seen on the high energy side of the energy distribution where the larger barrier from =3 appears to push the main peak a little up in energy. The difference in the low-energy part of the spectra is due to the difference in angular correlations for =1,3; the latter effect is discussed in more detail in [20, 21]. The angular part also accounts for the difference in the size of the hole in the centre of the Dalitz-plot, which corresponds to events with equal energies of the three -particles. This corresponds to individual energies around 3 MeV.
Allowing for an admixture of the two angular momenta gives the best fit because all of these features can be better reproduced. Allowing the 8Be 2+ resonance energy to move by more than 100keV does not change the conclusion that =1 dominates when the two values are both allowed to contribute.
Note, the energy spectra displayed in fig. 3 are very similar to those in [10] and to some extent also those in [17]. To further elucidate the conclusions from previous studies we have also compared our data to a model neglecting interference effects, which is obtained by using only one of the three permutations in Eq. 3. This model is equivalent to those used by [15, 16, 17]. With this model, =3 gives the best reproduction of our -spectrum in agreement with the conclusion of [17]. It therefore appears that the conclusion of the dominance of =3 is based on using too simple a model that only allows for one value of and neglects interference, and basing the conclusion primarily on inclusive data.
| [%] | [%] | ||
| 22705 | n/a | ||
| 22808 | n/a | ||
| 85(1) | 15(1) | 15360 | |
| 76(5) | 25(5) | 12297 |
6 Conclusion
In summary, we have collected exclusive data from the 3-decay of the 16.62 MeV (2-, T=1) resonance in 12C and compared our measurements with R-matrix based sequential models. We found that the model with admixture of =1 and 3 describes the data quite well. We also demonstrate that the conflicting conclusions from previous measurements spanning almost a century may be partly explained by neglecting the possible admixture or two angular momenta, neglecting interference effects or basing conclusions only on inclusive data.
It remains to be examined what the consequences are of our results on e.g. the rate of the 11B(p,3) and therefore on scenarios where this rate plays a role including astrophysics and possibly fusion reactors.
References
- [1] J. D. Cockcroft, E. T. S. Walton. Proceedings of the Royal Society of London. Series A, Containing Papers of a Mathematical and Physical Character 137 (831) (Jul. 1, 1932) 229–242. URL http://www.jstor.org/stable/95941
- [2] M. L. E. Oliphant, L. Rutherford. Proceedings of the Royal Society of London. Series A, Containing Papers of a Mathematical and Physical Character 141 (843) (Jul. 3, 1933) 259–281. URL http://www.jstor.org/stable/96218
- [3] P. I. Dee, C. W. Gilbert. Proceedings of the Royal Society of London. Series A, Mathematical and Physical Sciences 154 (881) (Mar. 2, 1936) 279–296. URL http://www.jstor.org/stable/96484
- [4] D. C. Moreau. Nuclear Fusion 17 (1) (1977) 13–20. URL http://dx.doi.org/10.1088/0029-5515/17/1/002
- [5] L. Giuffrida, et al. Physical Review E 101 (1) (2020) 013204–. URL https://link.aps.org/doi/10.1103/PhysRevE.101.013204
- [6] G. A. P. Cirrone, et al. Scientific Reports 8 (1) (2018) 1141. URL https://doi.org/10.1038/s41598-018-19258-5
- [7] N. Macdonald. Physics Letters 19 (4) (1965) 293–294. URL http://www.sciencedirect.com/science/article/pii/0031916365909935
- [8] D. Kamke, J. Krug. Zeitschrift für Physik 201 (3) (1967) 301–322. URL http://dx.doi.org/10.1007/BF01326819
- [9] K. Schäfer. Nuclear Physics A 140 (1) (1970) 9–22. URL http://www.sciencedirect.com/science/article/pii/0375947470908808
- [10] J. L. Quebert, L. Marquez. Nuclear Physics A 126 (3) (1969) 646–670. URL http://www.sciencedirect.com/science/article/B6TVB-4730XKK-44/2/95848385b148bb3303a1d432195c4685
- [11] A. Giorni, et al. J. Phys. France 29 (1) (1968) 4–8. URL http://dx.doi.org/10.1051/jphys:019680029010400
- [12] A. Giorni. Nuclear Physics A 144 (1) (1970) 146–160. URL http://www.sciencedirect.com/science/article/pii/0375947470904987
- [13] P. M. Cockburn, et al. Nuclear Physics A 141 (3) (1970) 532–550. URL http://www.sciencedirect.com/science/article/pii/0375947470909851
- [14] P. A. Treado, et al. Nuclear Physics A 198 (1) (1972) 21–32. URL http://www.sciencedirect.com/science/article/B6TVB-471XB0W-12/2/9acf1ad21687bf6e96f195aa3664991c
- [15] J. M. Davidson, et al. Nuclear Physics A 315 (1-2) (1979) 253–268. URL http://www.sciencedirect.com/science/article/B6TVB-473MB0H-16G/2/dae29ac31eb6d5ab839d5b3fcb99428a
- [16] H. W. Becker, C. Rolfs, H. P. Trautvetter. Zeitschrift für Physik A Hadrons and Nuclei 327 (3) (1987) 341–355. URL http://dx.doi.org/10.1007/BF01284459
- [17] S. Stave, et al. Physics Letters B 696 (1-2) (2011) 26–29. URL http://www.sciencedirect.com/science/article/B6TVN-51NNPBD-2/2/db1c1c64bb6f13bbabf90080d6a7c332
- [18] D. P. Balamuth, R. W. Zurmühle, S. L. Tabor. Physical Review C 10 (3). URL http://link.aps.org/abstract/PRC/v10/p975
- [19] J. Refsgaard, et al. Physics Letters B 779 (2018) 414–419. URL http://www.sciencedirect.com/science/article/pii/S0370269318301333
- [20] H. O. U. Fynbo, et al. Physical Review Letters 91 (8). URL http://link.aps.org/abstract/PRL/v91/e082502
- [21] K. L. Laursen, et al. The European Physical Journal A 52 (9) (2016) 271. URL http://dx.doi.org/10.1140/epja/i2016-16271-2
- [22] M. Munch, H. O. Uldall Fynbo. The European Physical Journal A 54 (8) (2018) 138. URL https://doi.org/10.1140/epja/i2018-12577-3
- [23] O. S. Kirsebom, et al. The European Physical Journal A 56 (7) (2020) 179. URL https://doi.org/10.1140/epja/s10050-020-00183-z
- [24] H. O. U. Fynbo, et al. Physical Review C 79 (5). URL http://link.aps.org/abstract/PRC/v79/e054009
- [25] E. Norbeck, F. D. Ingram. Physical Review Letters 20 (21) (1968) 1178–1180. URL https://link.aps.org/doi/10.1103/PhysRevLett.20.1178
- [26] D. T. Thompson, G. E. Tripard, D. H. Ehlers. Physical Review C 5 (4) (1972) 1174–1180. URL https://link.aps.org/doi/10.1103/PhysRevC.5.1174