Performance evaluation of GAGG(Ce)/LFS scintillator + MPPC array readout with ASIC
Abstract
We constructed a gamma-ray detector by combining two types of scintillator array detectors with an MPPC array and evaluated the spectral performance by reading out the signals from the MPPC with a low-power integrated circuit (ASIC) manufactured by IDEAS in Norway. One of the two types of scintillators is a GAGG(Ce) (Ce-doped ) scintillator, and the other is an LFS scintillator. The scintillator array is 2.5 cm 2.5 cm in size and is coated with -based white paint for GAGG(Ce) and an enhanced specular reflector (ESR) for LFS except for the side optically coupled to the MPPC. The spectra derived from the array are affected by the MPPC photon saturations and light leakage from the adjacent pixels, and we carefully corrected for both effects in our data analysis. The energy resolution of 662 keV at 20 ∘C is 6.100.04% for the GAGG(Ce) scintillator array and 8.570.15% for the LFS scintillator array, this is equivalent to the typical energy resolution found in the references. The energy resolution depends on the temperature: the energy resolution improves as the temperature decreases. We found that the contribution of thermal noise from the MPPCs to the energy resolution is negligible within the range of –20 to 40 ∘C, and the energy resolution is mainly determined by the light yield of the crystals.
keywords:
MPPC, GAGG(Ce) scintillator array, LFS scintillator array, ASIC1 Introduction
The soft gamma-ray within the 100 keV to 1 MeV or higher range is an unexplored wavelength in astrophysics, although there are many scientifically important targets, e.g., non-thermal radiation related to particle accelerations in a supernovae explosion and black holes, and a nuclear gamma-ray line emission from and and a 511 keV line gamma-ray from electron-positron annihilation. This is because it is difficult to focus soft gamma-rays on detectors utilizing optics and measure the incident energy because Compton scattering is a dominant physical process used in detection techniques. Hence, the detector suffers from a rather high instrumental background compared to signals from celestial sources, reducing the signal-to-noise ratio. A Compton camera is mainly used in soft gamma-rays, which measures the incident direction and energy by using events that are scattered by the scatterer and then photoelectrically absorbed by the absorber. Actually, no astrophysical observations using a Compton camera have been made since COMPTEL [1], a large Compton camera using liquid scintillators and NaI(TI) scintillators, onboard the Compton Gamma-Ray Observatory (CGRO), was deorbited in 2000.
Recently, with the advancement of instrumentation technologies such as integrated circuits and semiconductor technology, a Compton camera using semiconductor detectors have the potential tools to achieve much higher sensitivity than COMPTEL. One of them is the Soft Gamma-ray Detector (SGD) onboard the Hitomi satellite, which uses the a Si semiconductor sensor as a scatterer and a CdTe semiconductor sensor as an absorber and has a sensitivity of 60 to 600 keV [2]. If this sensitivity is extended up to 1 MeV or more with only semiconductor sensors, CdTe semiconductor layers (0.75 mm 8 layers, total 6 mm) would need to be as thick as a few centimeters, which is more difficult both technically and budgetary. As an absorber for MeV regions, the easiest way is to develop a hybrid Compton camera combined with an inorganic scintillator, which has a high stopping power and can be easily processed with a thickness of several centimeters. During the 21st century, new scintillators with a high performance in terms of light yield, time response, and stopping power have been developed, which exceeds the performance of conventional NaI(Tl) crystals.
In this paper, we evaluate a 44 (6 cubic for each) array using two types of scintillators, cerium-doped gadolinium aluminum gallium garnet (GAGG(Ce)) and lutetium fine silicate (LFS), a readout with a multi-pixel photon counter (MPPC) array provided by Hamamatsu Photonics K.K. and an application specific integration circuit (ASIC) IDE3380 [3] provided by Integrated Detector Electronics AS Co. (IDEAS) for future Compton camera applications in space. These two scintillators were newly developed in the 2000s and show an excellent performance in terms of a high light yield, fast time response, and high stopping power. In Section 2, we describe the experimental setup. In Section 3, we report on the analysis and results of the spectral performance and temperature dependence of the detector. Finally, we provide some concluding remarks.
2 Experimental Setup
2.1 Inorganic scintillator arrays and Multi-Pixel Photon Counter (MPPC)
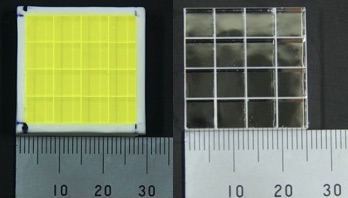
We constructed two types of 44 MPPC+scintillator array for the readout test using the ASIC IDE3380. One is the GAGG(Ce) (Cerium-doped ) scintillator manufactured by Furukawa Denshi Co., Ltd., and the other is an LFS (: A= Gd, Sc, Y, La, Eu, or Tb) scintillator manufactured by Zecotek Photonics, Inc. Both crystals have a higher stopping power than those of NaI(Tl) and CsI(Tl). Table 1 shows the characteristics for both scintillators in comparison with other crystals. The scintillator array consists of cubic crystals with a side length of 6 mm arranged in a 44 matrix with each gap of 0.2 mm. The overall size is 25 mm 25 mm. All six faces of crystals are polished, and different reflectors are used in the gap and surrounding: BaSO4-based white reflector for the GAGG(Ce) array and a 3M Enhanced Specular Reflector (ESR) for the LFS array (see Figure 1 for images). The array size is completely matched to the sensitive area of the Hamamatsu MPPC 4 4 array S14161-6050HS-04. This MPPC array is newly developed for the Positron-Emission Tomography (PET) application and has a higher photon detection efficiency (PDE) and lower operation voltage than those of the S13360 series. The PDE is 42% and 50% for the GAGG(Ce) peak of 520 nm and LFS peak of 425 nm, respectively. This surface-mount type MPPC array was mounted on the electric board and RC low-pass filters with = 1 k and = 1 F were put near the array to reduce high frequency noise from the power supply. The scintillator array was attached to the MPPC array with optical grease EJ-550 (ELJEN).
| GAGG(Ce) | LFS | NaI(Tl) | CsI(Tl) | BGO | |
| Density (g ) | 6.63 | 7.35 | 3.67 | 4.53 | 7.13 |
| Light yield (photons ) | 60000 | 36000–38000 | 45000 | 56000 | 8000 |
| Effective atomic number | 54 | 64 | 51 | 54 | 74 |
| Decay time (ns) | 88 | 33 | 230 | 1050 | 300 |
| Peak emission wavelength (nm) | 520 | 425 | 415 | 550 | 480 |
| Deliquescence | no | no | yes | yes | no |
2.2 Application Specific Integrated Circuit (ASIC)
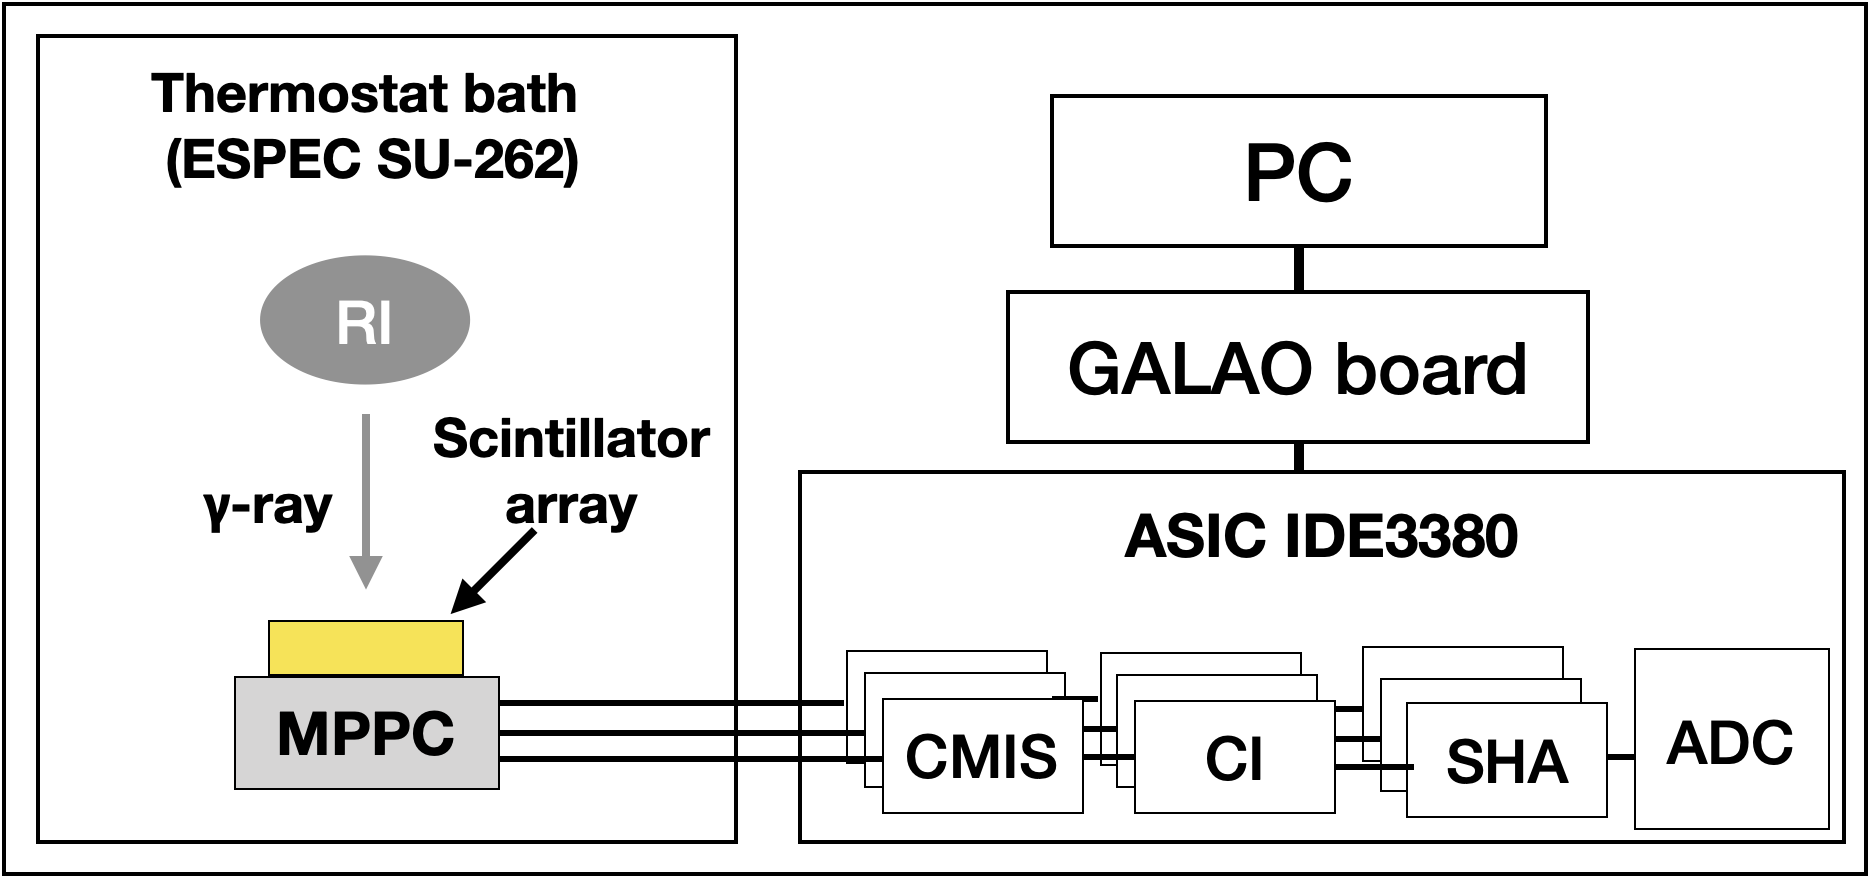
For the readout of the MPPC+GAGG(Ce)/LFS array, we used the IDEAS evaluation system, which consists of an ASIC IDE3380 test board, a so-called SIPHRA TG, and the GALAO board. The ASIC IDE3380 can process signals from 16-channel sensors under an extremely low-power consumption (less than 2 mW per channel). The ASIC has current divider circuits (current mode input stage (CMIS)), charge-sensitive amplifiers (charge integrator (CI)), shaping amplifiers (SHA), and trigger generation circuits. A sample-hold analog-to-digital converter (ADC) is also implemented in the ASIC, and it can digitize the pulse height information at the pulse peak timing. It is possible to program the gain, shaping time, and threshold voltage for the input signal for each of the 16 channels. There are two types of gain for each of the 16 channels in the CMIS and CI. The CMIS can downscale the current input from the MPPC mainly to four stages (1/10, 1/100, 1/200, and 1/400), and the CI then integrates the current from the CMIS in four steps (1 V/30 pico-coulomb (pC), 1 V/27.75 pC, 1 V/3 pC, and 1 V/0.75 pC). By adjusting these two gains, we can determine the dynamic range of the sensors. The shaping time in the SHA can be changed to four different values (200, 400, 800, and 1600 ns) through the configuration register. The output data consist of the time of the event, the trigger type, the triggered channels, and 12-bit ADC data. The GALAO board, equipped with a field programmable gate array (FPGA), is the interface between a PC and an ASIC, and mainly reads serialized data and controls the ASIC. The ASIC settings are programmed from the PC through the GALAO board using the benchmark software provided by IDEAS. The deadtime for processing the signals from 16 channels is approximately 209.6 s.
2.3 Measurement Setup
The overall system setup is shown in Figure 2. Scintillation detectors consisting of an MPPC array and two scintillator arrays were placed in a thermostat bath (ESPEC SU-262), and the temperature in the bath was set to the four different temperatures (–20, 0, 20, and 40 ∘C) to evaluate the performance. A 137Cs source with an intensity of 40 kBq was used to irradiate the arrays with 662 keV gamma-rays. To adjust the ASIC negative charge input, the negative bias voltage was provided to the anode side of the MPPC using a KEITHLEY 6487. The gain of the MPPC significantly changes with the temperature. To measure the intrinsic temperature dependence of the scintillators, the operation voltage of MPPC array was carefully changed such that an over-voltage of 3.0 V was applied at any temperature. The shaping time, CMIS gain, and CI gain are set to 800 ns, 1/200, and 1 V/27.75 pC, respectively. The input charge can be measurable at up to 10000 pC in this setting.
3 Analysis & Results
We have analyzed 44 array data at several stages consisting of basic corrections (pedestal subtraction, conversion of ADC channel into a charge, background subtraction, and deadtime correction), single event selection using the center of gravity (COG) method, and corrections of the MPPC saturation and light leakage effect. We describe each of these in the following subsections.
3.1 Basic corrections
The pedestal and linearity between the input charge and ADC channels are measurable using a test pulse function in the GALAO board. The pedestal value is distributed within 140 to 260 ADC channels in the 16-channel array, and is always subtracted during the analysis. The linearity curve was fitted using fourth-order polynomial function and was converted from an ADC channel to a charge in units of pC.
We found an extremely high intrinsic background when reading out the LFS scintillator array, which was caused by 176Lu contained in the LFS scintillator. Here, 176Lu predominantly emits two gamma-rays with an energy of 201.83 and 306.78 keV as well as beta-rays [4]. The background rate at above 10 keV was only approximately 14 Hz for the GAGG(Ce) scintillator array, and was 1050 Hz for the LFS scintillator array. Hence, particularly for the LFS array, we found that the background was not negligible for the relatively weak 137Cs source we used, and the deadtime effect should also be considered for analysis.
3.2 Single Hit Event Selection by Center of Gravity (COG) Method
To obtain the position information of each gamma-ray event in the array, the center of gravity (,) was calculated using the following equations.
| (1) |
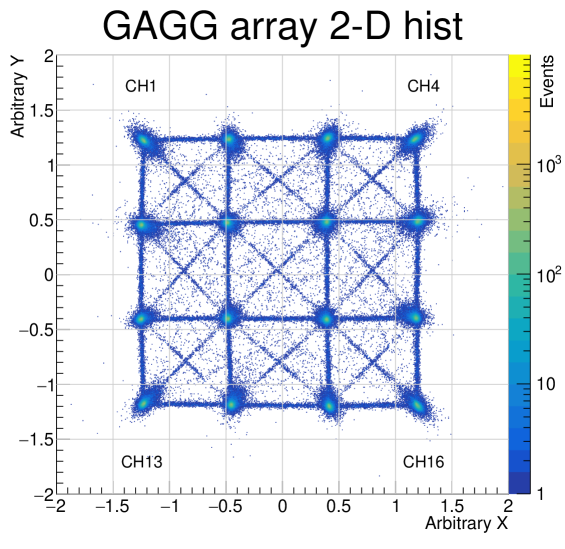
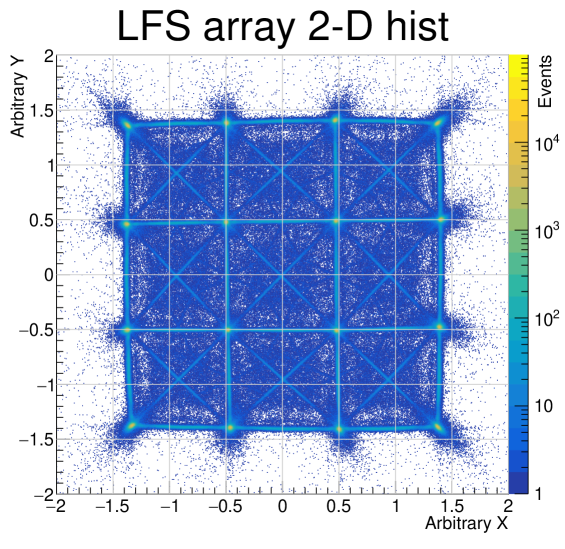
where the is the ADC value for each CH (=1, 2,…16 from upper-left to right-lower in Fig.3), and and are position information, which takes a value at –1.5, –0.5, +0.5 and +1.5. The COG distribution of the GAGG(Ce) and LFS array is shown in Figure 3. If gamma-rays are reacted in only one pixel and there is no light leakage to adjacent pixels, the COG coordinates should take discrete values of (, ), where ,=–1.5, –0.5, +0.5, and +1.5. The 44 COG peaks show a single interaction event in each CH, e.g., the coordinate of COG (–1.5, +1.5) corresponds to single hit events in the CH1. However, for the GAGG(Ce) array, the COG scale decreases by a factor of 0.8–0.9 compared with such values, probably due to the light leakage effect. In addition, we can also see many straight lines connected between the COG peaks, e.g., the horizontal line between CH1 and CH2, vertical line between CH1 and CH5, and diagonal line between CH1 and CH6, owing to Compton scattering events between two pixels. All other events except for the COG peaks correspond to events interacted in more than one pixel, i.e., a multi-pixel hit event. To select only single-hit detection events, we extracted events around a peak in the COG distribution.
3.3 MPPC Saturation and Light Leakage Effect
The GAGG(Ce) is a scintillator, which yields a high light output of 60,000 photons MeV-1, which could result in saturation of MPPC fired pixels. The saturation effect on an MPPC coupled to scintillators is described by the following equation:
| (2) |
where is the number of MPPC fired pixels; is the effective maximum pixel number determined by the number of MPPC pixels, the decay time of the scintillator, and the recovery time for a fired pixel; is all photons created within the scintillator; is the PDE of the MPPC; and is the light collection efficiency. The photon number () can easily be converted to a charge () measured in the ASIC using , where is the MPPC gain of and is the elementary charge of the electrons.
Light leakage from adjacent pixels cannot be avoided because each crystal in the array is not completely separated by reflectors. The GAGG(Ce) and LFS arrays utilize different reflectors with a 0.2-mm thickness among the crystals, i.e., BaSO4 and ESR, and hence we found that the GAGG(Ce) array has more light leakage than the LFS array. This effect is expected to be proportional to the light output produced in one pixel. If we assume a light leakage factor from the pixel where the scintillation light is produced to the pixel as , the relation between charges and in the pixel and is given by the following:
| (3) |
where we assume the maximum charge (), the PDE (), and the MPPC gain () to be common in all pixels.
Figure 4 shows a scattered plot between charges in CH1 and CH2 between GAGG(Ce) and LFS. A simple light leakage effect should follow a linear correlation between two pixels, but both correlations show a clear non-linear correlation with a curvature. We fitted data with Equation (3) using two free parameters and , and the fit is reasonable as indicated by the best-fit function shown by the black curve in the upper panel of Figure 4. In this case, the best-fit parameters are for GAGG(Ce) and for LFS, respectively. The LFS scintillator has a lower light yield, but a faster decay time than those of GAGG(Ce). The combined effect of the two parameters is considered to reduce the saturation level more than that of GAGG(Ce). The charge (=) corrected for the saturation effect is given by Equation (4), and shown by red in lower panel of Figure 4. The measured 662 keV photopeak is found to be shifted by 15% for GAGG(Ce) and by 22% for LFS from a real photopeak.
| (4) |
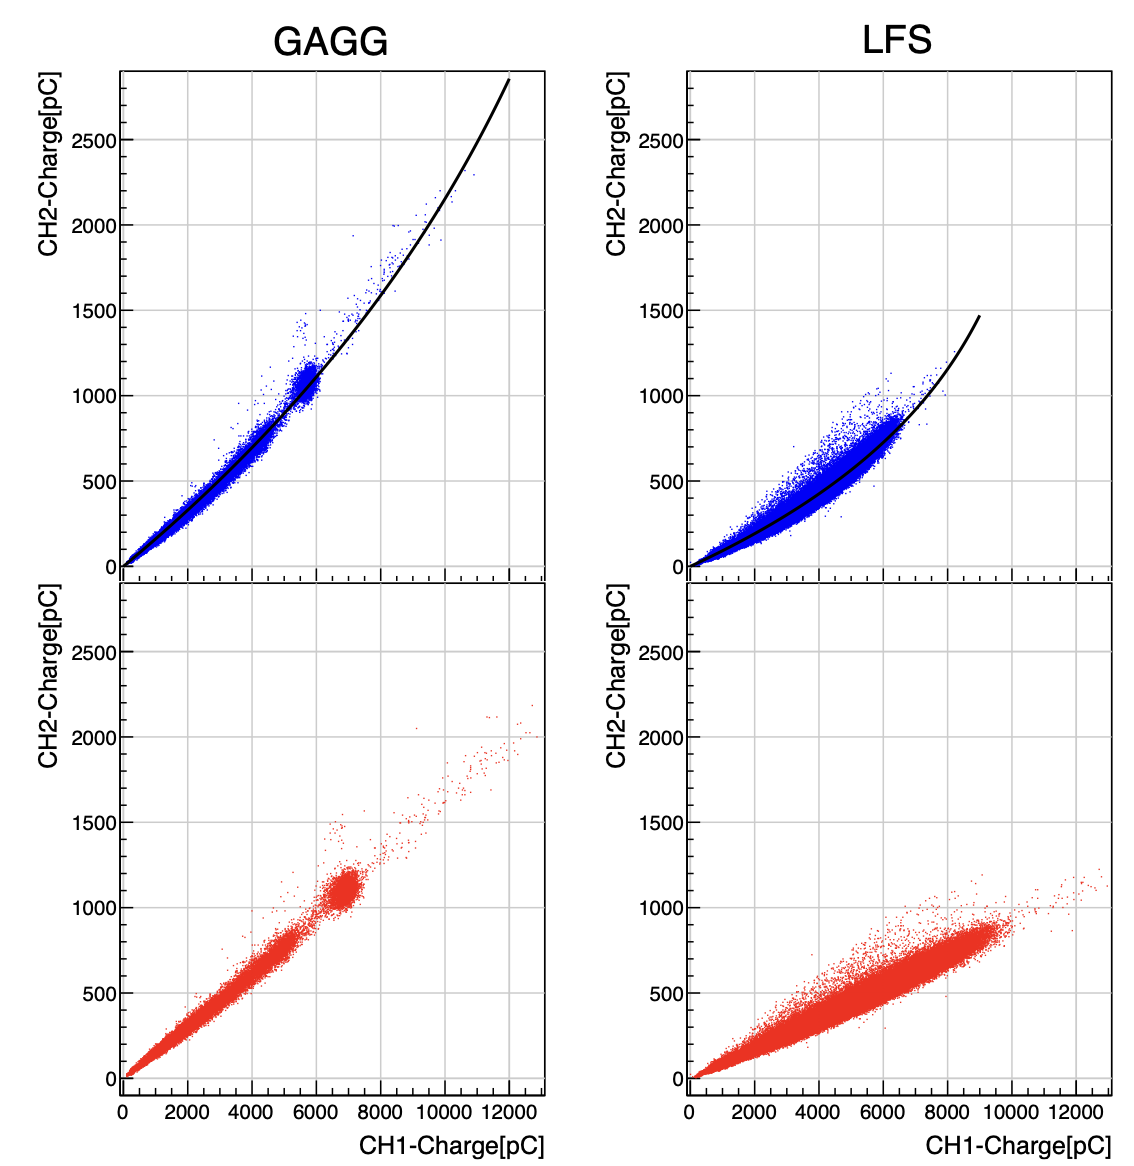
To collect all of the scintillation light scattered over the pixels, we obtained charge for a single-hit event in the pixel by summing up the entire charge produced owing to light leakage in all pixels as follows.
| (5) |
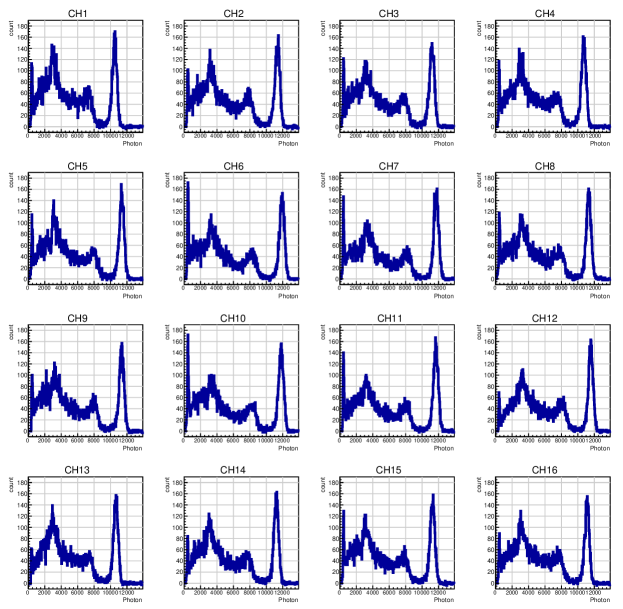
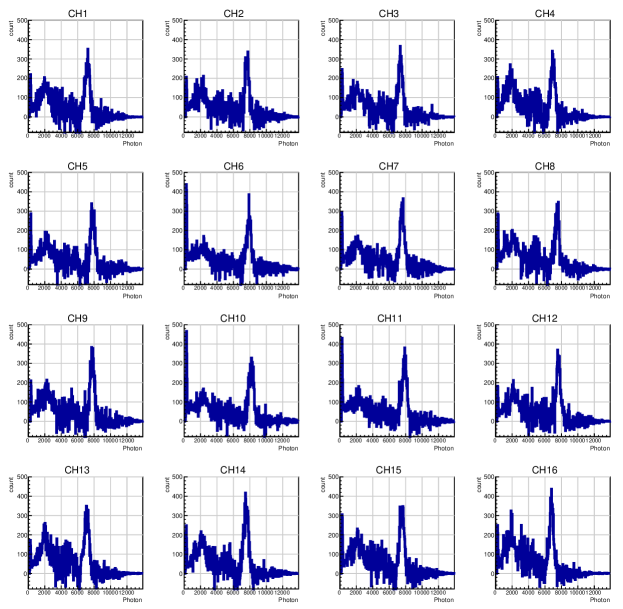
Thus, the spectra derived for 16 individual pixels are shown in Figure 5. After light leakage corrections, the photopeak was increased by 5294% (GAGG(Ce)) and 2132% (LFS) compared with the original spectra at 20 .
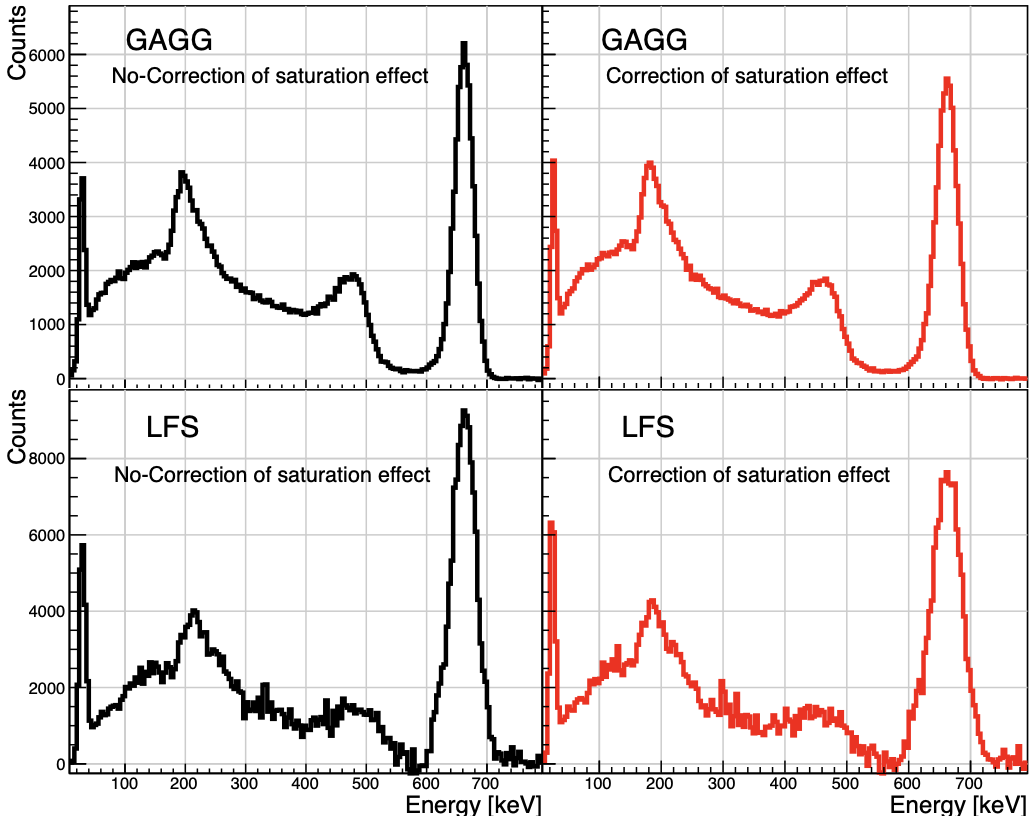
Using 662 keV photopeak as an energy calibration, we further co-added 16-channel spectra after the gain correction. Figure 6 shows a comparison between without and with MPPC saturation correction. Before the MPPC saturation effect correction, the full width half maximum (FWHM) energy resolution was 5.560.04% for the GAGG(Ce) array and 7.110.13% for the LFS array, whereas after the correction, both values significantly changed into 6.100.04% for the GAGG(Ce) and 8.570.15% for the LFS. This means that the MPPC saturation effect causes a compression of the 662 keV photopeak, which looks apparently sharper than the real one. As can be seen from Figure 6, we also found that the backscattered line at 184 keV was shifted to below 200 keV after the saturation correction. The energy resolution we obtained is a typical value (6%-7% for GAGG(Ce), and 8%-9% for LFS) in comparison with published references [6, 7] even when we used an array and an ASIC readout system.
The temperature dependence of the FWHM energy resolution is shown in Table 2. As the temperature increases, the energy resolution for both crystals worsens. The resolution is 5.750.04% and 7.880.17% at –20 ∘C and 6.540.05% and 8.380.15% at 40 ∘C for GAGG(Ce) and LFS, respectively. The thermal noise of the MPPC is also measured by applying the test pulse function to the ASIC, and its contribution to the energy resolution is negligible at only 0.02% even at 40 ∘C. The light yield at –20 ∘C linearly increases by almost the same factor of approximately 1.20 for GAGG(Ce) and 1.23 for LFS from that measured at 40 ∘C. Assuming that the energy resolution is determined by the statistical fluctuation of the photo-electrons, the energy resolution should be proportional to the reciprocal of the square root of the light yield (). The expected value at –20 ∘C is 5.980.04% and 7.660.14% using the 40 ∘C values, which is consistent with the experimental results. Thus, we conclude that the energy resolution in the temperature range of –20 to 40 ∘C is determined not by MPPC thermal noise but by the light yield of the scintillators.
4 Conclusions
We constructed GAGG(Ce) and LFS 44 scintillator arrays coupled to the Hamamatsu MPPC 44 array, and evaluated the spectral performance and temperature dependence using an FWHM of a 662 keV peak by reading out the sensor signals using the ASIC IDE3380 provided by IDEAS. By considering the MPPC saturation effect and applying the gain correction to each pixel based on the center of gravity information, we correctly obtained 16-channel summed spectra. The energy resolution obtained at 20 ∘C is 6.100.04% for GAGG(Ce) and 8.570.15% for LFS. This energy resolution is quite good even when we use an array of scintillators and an ASIC. The energy resolution improves (e.g., 5.750.04% for GAGG(Ce) and 7.880.17% for LFS at –20 ∘C) as the temperature decreases from 40 to –20 ∘C. We found that the energy resolution of the MPPC+GAGG(Ce)/LFS array is determined only by the light yield of crystals with little effect from the thermal noise by the MPPCs. In terms of the internal background and spectral performance, we conclude that the GAGG(Ce) scintillator array is more suitable as an absorber of a Compton camera than the LFS array. This paper is the first evaluation test report of an array readout using an ASIC, and the sizes of the GAGG(Ce) crystals need to be optimized for future Compton camera application in space.
| Temperature | FWHM energy resolution(%) | |
|---|---|---|
| Degree (∘C ) | GAGG(Ce) | LFS |
| –20 | 5.750.04 | 7.880.17 |
| 0 | 5.880.04 | 8.090.15 |
| 20 | 6.100.04 | 8.570.15 |
| 40 | 6.540.05 | 8.380.15 |
5 Acknowledgment
We thank the anonymous referees for carefully reading our manuscript. This research was partially supported by the Toyoaki Scholarship Foundation and JSPS Grant-in-Aid for Scientific Research (KAKENHI) Grant No. JP18H03700 (KY).
References
- [1] V. Schönfelder et al. ”Instrument description and performance of the Imaging Gamma-Ray Telescope COMPTEL aboard the Compton Gamma-Ray Observatory.” Astrophysical Journal Supplement Series 86, (1993) 657 – 692
- [2] Tajima, Hiroyasu, et al. ”Design and performance of soft gamma-ray detector onboard the Hitomi (ASTRO-H) satellite.” Journal of Astronomical Telescopes, Instruments, and Systems 4.2 (2018): 021411.
- [3] Meier, Dirk, et al. ”SIPHRA 16-channel silicon photomultiplier readout ASIC.” Proceedings of the ESA AMICSA & DSP, 6th International Workshop. 2016.
- [4] Wei, Qingyang. ”Intrinsic radiation in lutetium based PET detector: Advantages and disadvantages.” arXiv preprint arXiv:1501.05372 (2015).
- [5] C.-Y. Liu and A. L Goertzen, ”Improved event positioning in a gamma ray detector using an iterative position-weighted centre-of-gravity algorithm.” Phys. Medi. Biol. 58 (2013) N189-N200.
- [6] M. Yoneyama et al, ”Evaluation of Ce:GAGG scintillators for future space applications.” JINST 13 JINST (2018) P02023-P02023.
- [7] M. Grodzicka et al., ”Characterization of LFS3 scintillator in comparison with LSO.” Nucl. Sci. 652 (2011) 226 – 230.