LeMMINGs. III. The e-MERLIN Legacy Survey of the Palomar sample. Exploring the origin of nuclear radio emission in active and inactive galaxies through the [O iii] – radio connection.
Abstract
What determines the nuclear radio emission in local galaxies? To address this question, we combine optical [O iii] line emission, robust black hole (BH) mass estimates, and high-resolution e-MERLIN 1.5-GHz data, from the LeMMINGs survey, of a statistically-complete sample of 280 nearby, optically active (LINER and Seyfert) and inactive (Hii and Absorption line galaxies [ALG]) galaxies. Using [O iii] luminosity () as a proxy for the accretion power, local galaxies follow distinct sequences in the optical–radio planes of BH activity, which suggest different origins of the nuclear radio emission for the optical classes. The 1.5-GHz radio luminosity of their parsec-scale cores () is found to scale with BH mass () and [O iii] luminosity. Below 106.5 M⊙, stellar processes from non-jetted Hii galaxies dominate with and . Above 106.5 M⊙, accretion-driven processes dominate with and for active galaxies: radio-quiet/loud LINERs, Seyferts and jetted Hii galaxies always display (although low) signatures of radio-emitting BH activity, with 1019.8 W Hz-1 and M⊙, on a broad range of Eddington-scaled accretion rates (). Radio-quiet and radio-loud LINERs are powered by low- discs launching sub-relativistic and relativistic jets, respectively. Low-power slow jets and disc/corona winds from moderately high to high- discs account for the compact and edge-brightened jets of Seyferts, respectively. Jetted Hii galaxies may host weakly active BHs. Fuel-starved BHs and recurrent activity account for ALG properties. In conclusion, specific accretion-ejection states of active BHs determine the radio production and the optical classification of local active galaxies.
keywords:
galaxies: active – galaxies: jet – galaxies: nuclei – galaxies: star formation – radio continuum: galaxies1 Introduction
Supermassive black holes (SMBHs) are expected to reside at the centre of all massive galaxies (e.g. Aller & Richstone 2002; Marconi et al. 2004; Shankar et al. 2004). The accretion on to SMBHs in Active Galactic Nuclei (AGN) provides a major power source in the Universe and is believed to regulate the evolution of galaxies, by injecting energy and momentum (‘feedback’, Fabian 2012). Such feedback sets the reciprocal relation between the observed properties of SMBHs (e.g. central velocity dispersion as a proxy of BH mass) and their host bulges (e.g. Magorrian et al. 1998; Gebhardt et al. 2000; Häring & Rix 2004). Much of our understanding of AGN phenomena (feeding and feedback) comes from the study of bright, powerful active SMBHs that have accreted primarily during typical active periods of the order of a few 108 yr in a radiatively efficient mode, as Seyfert nuclei and QSOs (Marconi et al., 2004; Shankar et al., 2004; Cao, 2007). During such a phase, a geometrically thin, optically thick, standard accretion disc (SAD, Shakura & Sunyaev 1973), characterised by a high radiative efficiency mode (mass-to-energy conversion efficiency of 0.1, e.g. Shankar et al. 2020), is needed both to reproduce the currently observed SMBH space density and large-scale environment and to solve the Soltan argument (Soltan, 1982).
However, the vast majority of SMBHs in the local Universe are in a quiescent state or, unless activity has been seen in some band, of extremely-low nuclear outputs (e.g. Huchra & Burg 1992; Filho et al. 2006; Ho 2008): the latter are regarded to host a low-luminosity AGN (LLAGN, traditionally defined as having H luminosities 1040 erg s-1, Ho et al. 1997a). Unfortunately, the weakness of the radiative signals from low-activity SMBHs make their study difficult. Problems include: i) confusion with brighter, non-AGN components, ii) obscuration and, iii) selection effects.
The scarcity of deep multi-band studies for large samples of LLAGN means that understanding SMBH activity in the low luminosity regime is currently limited. Theories indicate that LLAGN are characterized by a low accretion rate () and/or low radiative efficiency (Ho, 1999; Panessa et al., 2007). In models of radiatively inefficient accretion flows (RIAFs; Narayan & Yi 1994, 1995; Yuan et al. 2012b, a; White et al. 2020), the kinetic energy is either advected with the gas into the SMBH, or channelled into an outflow. The magnetic field combined with ‘puffed-up’ geometrically thick structures could provide a plausible mechanism for collimating axial outflows, accounting for a large fraction of observed jets in LLAGN (Maoz, 2007; Mezcua & Prieto, 2014).
Probably the most common manifestation of LLAGN appears in the form of low-ionisation nuclear emission-line regions (LINERs; Heckman 1980), which are detected in the nuclei of a large fraction of nearby galaxies (Ho et al., 1997b; Kauffmann et al., 2003). The current picture of LINERs is a ‘mixed bag’ of objects, with some photoionized by stars, some by AGN, and some perhaps excited by shocks (Allen et al., 2008; Sarzi et al., 2010; Capetti & Baldi, 2011; Singh et al., 2013). By assuming an active BH origin of the LINER population (or a part of it), the transition from the Seyfert to LINER regime corresponds to a decrease in the Eddington ratio (defined as the ratio between the bolometric AGN luminosity and the Eddington luminosity, /) (Ho, 2008; Kewley et al., 2006), accompanied by a hardening of the ionizing spectrum. At the extremely low end of the Eddington luminosity, active SMBHs with low and low radiative efficiency can even be hidden at the centre of (apparently) inactive galaxies, where star formation (SF) outshines the faint active nucleus.
| Name | Hubble | class | log | log | log Edd | det | morph | log | log | |
| BPT | km s-1 | M⊙ | erg s-1 | ratio | erg s-1 | erg s-1 | ||||
| (1) | (2) | (3) | (4) | (5) | (6) | (7) | (8) | (9) | (10) | (11) |
| NGC 7817 | SAbc | H | 66.7 | 6.21 | 39.29 | 1.51 | U | 35.64 | ||
| IC 10 | IBm? | H | 35.5 | 5.11 | 37.13 | 2.57 | U | 32.91 | ||
| NGC 147 | dE5 pec | ALG | 22 | 4.28 | U | 32.39 | ||||
| NGC 185 | dE3 pec | L | 19.9 | 4.10 | 34.63 | 4.06 | U | 32.33 | ||
| NGC 205 | dE5 pec | ALG | 23.3 | 4.34∗ | U | 32.36 |
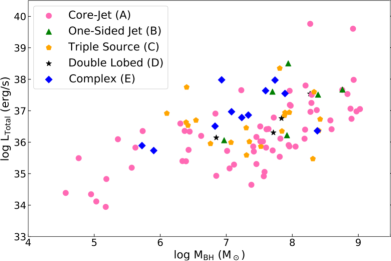
Column description: (1) source name; (2) morphological galaxy type taken from RC3 (de Vaucouleurs et al., 1991); (3) optical spectroscopic classification based on BPT diagrams and from the literature. H=Hii, S=Seyfert, L=LINER, and ALG=Absorption line galaxy. ‘j H’ marks the jetted Hii galaxies and ‘RL’ identifies the RL AGN; (4) stellar velocity dispersion () from Ho et al. (2009); (5) logarithm of BH mass () determined from (Tremaine et al., 2002) or from direct BH mass measurements (galaxies marked with ∗, van den Bosch 2016) ; (6) logarithm of [O iii] luminosities from Ho et al. (1997a) or from the literature (non corrected for extinction, see Paper II for references); (7) logarithm of Eddington ratio (/); (8) radio detection status: ‘I’ = detected and core identified; ‘U’ = undetected; ‘unI’ = detected but core unidentified; ‘I+unI’ = detected and core identified with additional unknown source(s) in the field; (9) radio morphological class: A = core/core–jet; B = one-sided jet; C = triple; D = doubled-lobed ; E = complex; (10)–(11) logarithm of radio core and total luminosities at 1.5 GHz (erg s-1). To convert the radio luminosities in erg s-1 to W Hz-1 at 1.5 GHz, an amount of +16.18 should be subtracted from log and log . The full table is available as supplementary material.
Understanding the physics of the accretion/ejection of matter in low-luminosity regimes is important for a variety of reasons. First, the steep local AGN luminosity function shows that LLAGN outnumber the QSO population by a few orders of magnitudes at (Heckman & Best, 2014; Saikia et al., 2018b). The large abundance of local LLAGN indicates that such a population represents the common mode of SMBH accretion at low redshifts and gives a snapshot of the ordinary relation between the SMBH and its host. Second, the identification of the LLAGN population would help to constrain the occupation fraction of active SMBH in galaxies. Such a quantity is unknown at low stellar masses 109-10 M⊙ (Greene, 2012; Gallo & Sesana, 2019), and is crucial for establishing the BH mass density function and to calibrate the prescriptions for SMBH–galaxy growth of semi-analytical and numerical models (Shankar, 2009; Barausse et al., 2017). Third, the discovery of large cavities of hot gas that have been formed in the intra-cluster medium typically by jets from LLAGN in massive elliptical galaxies (e.g. Dunn & Fabian 2006; Werner et al. 2019), indicates that jet-mode feedback is a crucial aspect of the low-luminosity stage of SMBH activity (Heinz et al., 2007; Fabian, 2012).
In the last decades, the preferred method for finding active SMBHs was by X-ray selection, but even the deepest current observations cannot probe the heavily absorbed sources (e.g. the Chandra Deep Fields, Alexander et al. 2003). High-resolution radio observations (providing quantities such as, e.g., Spectral Energy Distribution [SED] or brightness temperature []) offer complementary, direct views of BH accretion even in dusty environments, and can detect AGN at below those detectable in other wave-bands
In active galaxies, apart from stellar processes, a plethora of radio-emitting mechanisms associated with SMBH accretion can compete (see Panessa et al. 2019 for a review). Relativistic or sub-relativistic jets which accelerate particles (Padovani, 2016; Blandford et al., 2019), disc winds which shock and sweep the interstellar medium (ISM) (Zakamska & Greene, 2014) and outflowing magnetically-active coronae (Laor & Behar, 2008), are the main astrophysical phenomena which can account for cm/mm-wavelength radiation in the pc-scale regions of AGN. The combination of radio and optical data can provide more robust diagnostics to separate SF and AGN components (see e.g. Best et al. 2005b; Smolčić et al. 2008; Kauffmann et al. 2008; Best & Heckman 2012; Radcliffe et al. 2018; Muxlow et al. 2020) and break the degeneracy among all the possible radio-emitting physical processes: the goal of this work.
Jets111The term ‘jet’ indicates outflow of ejected plasma that becomes collimated (unlike a wind), which transports outwards mass, energy and angular momentum. The bulk speed can generally be relativistic, leading to a radio-loud AGN, or sub-relativistic, corresponding to a radio-quiet one., generally seen in radio, but sometimes in other bands as well (e.g. in the optical, as in M 87, Perlman et al. 1999) are an unambiguous indicator of nuclear activity seen in LLAGN (e.g. Körding et al. 2006). The increasing evidence of finding jets associated with LLAGN compared to the high-luminosity AGN is supported by sparse radio studies of LLAGN and QSOs (e.g. Kukula et al. 1999; Nagar et al. 2000; Mezcua & Prieto 2014; Padovani 2016), although a few studies have found contradictory results (e.g. Jiang et al. 2007; Macfarlane et al. 2021). This result can be generalised by the fact that the radio loudness, i.e. the ratio between the radio and the optical emission associated with the active SMBH, increases at lower bolometric luminosities and at low Eddington ratios (Ho, 2002, 2008; Kozieł-Wierzbowska et al., 2017; Laor et al., 2019). The presence of a link between the SMBH capability of emanating bright jets and their AGN multi-band nuclear properties (bolometric luminosities, Eddington ratios, etc.) has been interpreted in the light of different accretion modes. Among active galaxies, RIAF discs and large SMBHs (108 M⊙) are generally more efficient at accelerating particles to relativistic velocities than SAD and small SMBHs (Meier, 2001; Nemmen et al., 2007; Begelman, 2012; McKinney et al., 2012). All these favourable conditions are generally met in LLAGN, which despite weak optical nuclei, display a broad variety of radio properties, from flat-spectrum cores to steep-spectrum kpc-scale jets (Nagar et al., 2000).
Since jets are observed across all types of active BHs (Galactic BHs, X-ray binaries [XRBs], and AGN), it is still under debate whether the accretion–jet symbiosis is scale-invariant, regardless of the accretion mode in, e.g., the so-called ‘Fundamental Plane of BH activity’ (Merloni et al., 2003; Falcke et al., 2004; Plotkin et al., 2012; Bonchi et al., 2013; Gültekin et al., 2019). This 3D plane (radio luminosity , X-ray luminosity and BH mass ) is believed to unify all active BHs at different mass scales, indicating common physical mechanisms in accretion and jet production among all accreting compact objects. Historically, in analogy with the states in XRBs, LINERs are thought to be the hard-state equivalent of an XRB, where the radiation is produced inefficiently and the jet is dominating over the disc emission ( , e.g. Esin et al. 1997), while Seyfert galaxies are thought to be the equivalent of high- XRBs ( , e.g. Fender et al. 2003), where jets are never seen222Dark decaying jets have been rarely seen in particular transitional stages of the soft state (e.g. Rushton et al. 2012; Drappeau et al. 2017).. However, recently there is compelling evidence that the AGN optical classifications are not likely to map in a 1-to-1 manner to the spectral states observed from accreting stellar mass BHs and a growing list of disc observational constraints of XRBs challenge its application to AGN (see review from Davis & Tchekhovskoy 2020). For AGN, the break between LINERs and Seyferts is typically at about , while for the XRBs hard states are typically seen below 2 per cent of (Maccarone, 2003; Vahdat Motlagh et al., 2019), and soft states are typically seen above that level. A few Seyfert galaxies also show evidence of Fourier power spectra with similar characteristics to those of hard-state XRBs (Markowitz et al., 2003; Vaughan et al., 2005) and (low-luminosity) Seyferts often show jetted structures (e.g. Kukula et al. 1995; Thean et al. 2000; Giroletti & Panessa 2009; Kharb et al. 2017), differently from soft-state XRBs.
To have a less biased view of the properties of SMBH accretion and the SMBH–host link at low masses, an accurate census of the accretion and jet properties is needed. This requirement is satisfied by the LeMMINGs (Legacy e-MERLIN Multi-band Imaging of Nearby Galaxy Sample) survey333http://www.e-MERLIN.ac.uk/legacy/projects/lemmings.html (Beswick et al., 2014). It consists of 1.5-GHz observations (and upcoming 5-GHz observations) of 280 nearby galaxies from the Palomar sample, which is usually considered to be one of the best selected and most complete samples of nearby galaxies. The two data releases (Baldi et al. 2018, Paper I, and Baldi et al. 2021, Paper II) represent the deepest 1.5-GHz survey of local (110 Mpc) active and inactive galaxies at milli-arcsecond resolution and Jy sensitivity with the e-MERLIN array. Only partial conclusions on the optical-radio connection have been already drawn in Paper I because of incompleteness of the sample. The full coverage of the [O iii]-line optical and radio data in this work allows to exploit the statistical completeness of the sample to investigate the origin of the radio cores in local galaxies.
In Section 2 we present the LeMMINGs project and the radio and optical [O iii] properties of the sample. We show the optical–radio diagnostics to explore the nature of the radio emission for each optical class in Section 3. In Section 4 we discuss the results and focus on each optical class. We revise the radio properties of the LLAGN population and draw our conclusions about disc–jet coupling in LLAGN and SMBH-host connection in nearby galaxies in Section 5. A supplementary section A focuses on the BH mass function of local galaxies.
2 The Survey and the sample
The LeMMINGs sample represents a subset of 280 galaxies from the Revised Shapley-Ames Catalog of Bright Galaxies and the Second Reference Catalogue of Bright Galaxies (Sandage & Tammann, 1981) (details in Papers I and II). The sample is taken from the optical spectroscopic Palomar survey (Ho et al., 1997a), selecting only targets with 20∘, to be accessible to the e-MERLIN array. The sample is optically selected ( 12.5 mag), so has no radio bias, and a median distance of 20 Mpc. Based on the updated optical emission-line diagnostic diagrams (BPT, Baldwin et al. 1981; Kewley et al. 2006; Buttiglione et al. 2010), the sample has been classified into Hii, Seyfert, LINER and Absorption Line Galaxies (ALG) (see Papers I and II). The galaxies for which the active SMBH is the main photoionising source are Seyferts (18/280) and LINERs (94/280). The inactive galaxies are represented by Hii galaxies (140/280) where star forming regions populated by massive young stars mainly photoionise the surrounding gas, and ALG (28/280), which are optically inactive galaxies and do not show evident emission lines and are typically in early-type hosts.
e-MERLIN observations at L band (1.2–1.7 GHz) of the 280 Palomar galaxies are presented in Papers I and II. An angular resolution of 200 mas and high sensitivity (mJy beam-1) enabled the detection of radio emission at pc scale of 44.6 per cent (125/280) of the sample. We detected the radio cores444We define core as the unresolved central component of the radio source, which pinpoints the location of a putative SMBH, and may represent a jet base, an unresolved disc-driven emission or a nuclear stellar cluster (NSC). with typical radio sizes of 100 pc and radio core luminosities, , in the range 1034–1040 erg s-1 (Table 1). For 106 of the 125 detected sources we identified the radio core within the structure, co-spatial with the optical galaxy centre: 56/94 LINERs, 12/18 Seyferts, 5/28 ALGs and 33/140 Hii galaxies. Conversely for the remaining 19 ‘unidentified’ sources, the detected radio emission was not associated with the central optical nucleus. We resolved parsec-scale radio structures with a broad variety of morphologies (Tab. 1): core/core–jet (class A, the most common), one-sided jet (class B), triple sources (class C), double-lobed (class D), and complex shapes (class E) with extents of 3–6600 pc. There are 31 sources with clear jets (class B, C and D), which are referred to as ‘jetted’ galaxies. LINERs and Seyferts are the most luminous sources, whereas Hii galaxies are the least. LINERs show elongated core-brightened radio structures while Seyferts reveal the highest fraction of symmetric morphologies. The majority of the 33 radio-detected Hii galaxies have single radio core or complex extended structures, but seven of them show clear jets. ALGs exhibit on average the most luminous radio structures, similar to that of LINERs.
When considering the galaxy morphological types, most of the sources are late-type galaxies (LTGs, from Sa to Sd, 71 per cent), with a smaller fraction of elliptical and lenticulars (E and S0, early-type galaxies [ETGs]). In terms of BH masses, we derive the values using the stellar velocity dispersions measured from optical spectra (mostly from Ho et al. 2009, see Table 1) and the empirical – relation from Tremaine et al. (2002), analogous to what was done in Paper I. For 36 sources, we use direct SMBH measurements (derived from stellar and gas dynamics, mega-masers, or reverberation mapping) available from the compilation of van den Bosch (2016). Our sample of 280 galaxies harbours BHs with 104 109 M⊙. As a test, we also derive the BH masses using the – relation from van den Bosch (2016), which is based on a larger sample of BH masses than the one from Tremaine et al. (2002). The two relations agree with each other within 0.3 dex, for intermediate BH masses, 106–108 M⊙, but differ at higher BH masses within 0.5 dex and at lower BH masses within 1 dex. This scatter defines the errors on the measurements. LINERs, Seyferts and ALGs typically host SMBHs with masses 107 M⊙, while Hii galaxies have typically lower BH masses.
2.1 [O iii] emission line
The [O iii] emission line is an optical forbidden 5007 Å transition, produced by gas photoionisation by a strong radiation field either from an active SMBH or star-forming region. In the case of an AGN, because of its high energy ionisation level, [O iii] emission is extended from several kpc on galaxy scale down to the innermost central region on pc scale, in the so-called ‘narrow-line region’ (NLR) (Kewley et al., 2019). Despite being slightly dependent on the AGN orientation and obscuration (e.g. Risaliti et al. 2011; Bisogni et al. 2017), [O iii] line luminosity, , is a good (but not ideal) indicator of the bolometric AGN luminosity ( = 3500, Heckman et al. 2004 for LLAGN). Since the line emitting region can extend up to several kpc, the main caveat of the [O iii] line is the contribution from other ionising sources, such as shocks and purely stellar processes (Binette et al., 1994; Dickson et al., 1995; Dopita et al., 1997), which could result in an overestimate of the SMBH accretion power. Conversely, if the kpc-scale NLR extends beyond the spectroscopic slit used by Ho et al. (1995) (1–2 arcsec, from a few pc to 1 kpc for our sample), this may lead to an underestimate of the AGN bolometric luminosity.
For the LeMMINGs sample, we collect the [O iii] luminosities (Tab. 1, not corrected for extinction) from the Palomar optical survey (Ho et al., 1997a) and from the most recent surveys/observations (see Papers I and II for more details). In our sample, Seyferts, LINERs and Hii galaxies have mean [O iii] luminosities of 5.01039, 3.51038, and 1.51038 erg s-1, respectively. For the vast majority of ALGs, upper limits on [O iii] luminosities are not available.
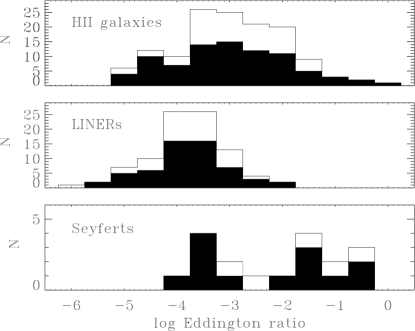
Despite some caveats on as an indicator of AGN strength (e.g. Lamastra et al. 2009; Netzer 2009, particularly at low luminosities), we can also calculate the Eddington ratio, /, a gauge of the accretion rate, (listed in Table 1 and shown in Figure 1 for our sample). The Eddington ratios of LINERs and Seyferts are generally below and above 10-3, respectively, the typical threshold used to separate between low and high on to the SMBHs (Best & Heckman, 2012). For Hii galaxies, in the conservative scenario that their line emission is powered by the AGN, we note that, although less luminous in line emission, they have intermediate Eddington ratios between LINERs and Seyferts because their BH masses are typically lower than those of active galaxies.
Since optical emission lines (e.g. H and [O iii]) can be caused by hot, young massive stars in star-forming regions, we can also assume a stellar origin of the line emission: can thus be used as a SF rate (SFR) estimator, SFR (M⊙/yr) = 7.910-42 (erg s-1) following Kennicutt (1998) and adopting log([O iii]/H) = 0.00.5, Moustakas et al. 2006; Suzuki et al. 2016).
2.2 Radio loudness
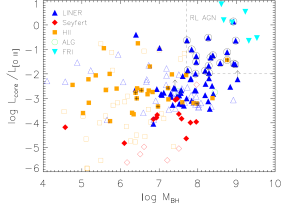
The investigation of the nature of the radio emission in the LeMMINGs galaxies would benefit from a separation between radio-loud (RL) and radio-quiet (RQ) AGN. For the former (i.e. radio galaxies, RGs) the relativistic jets are the main power source; for the latter different mechanisms (SF, sub-relativistic jets, and disc/corona winds) are likely to produce radio continuum (Panessa et al., 2019). Accordingly, we have used the ratio defined as the spectroscopic radio loudness parameter (Capetti & Balmaverde, 2006) based on local ellipticals. In general Seyfert galaxies and RQ AGN show a larger excess of line-emission (at a given radio-core luminosity) than those of RL objects, i.e. / 10-2 (Capetti & Balmaverde, 2007; Ishibashi et al., 2014). Since the LeMMINGs sample contains a more heterogeneous mixture of early and late type galaxies than the sample used by Capetti & Balmaverde (2006), and RL AGN are known to be associated with the most massive BHs555More than 80 per cent of the local AGN with ¿ 107.7 M⊙ and with 150-MHz radio luminosities 1021 W Hz-1 are RL (Sabater et al., 2019). (Chiaberge & Marconi, 2011), we select the RL galaxies (black circles, Fig. 2) based on these two conditions: / 10-2 and > 107.7 M⊙ (in agreement with local RL LLAGN, Baldi & Capetti 2010). The selected RL AGN in the LeMMINGs sample are thus 18 LINERs and one jetted Hii galaxy (see Tab. 1).
The radio loudness is known to increase with (Fig. 2, see Nelson 2000; Best et al. 2005b), and the presence of a bimodal, dichotomous or continuous distribution of radio loudness between RQ and RL AGN is still controversial (e.g. Kellermann et al. 1989; Cirasuolo et al. 2003). In fact, we note that other possible RL candidates (mostly LINERs) are close to our RL/RQ selection boundary. A clean RQ/RL separation simply based on the radio-loudness parameter and BH mass is not possible, as a detailed radio study of the jet with very-long baseline interferometers (VLBI) would be needed (see Giovannini 2003, 2004). Therefore, our criteria select the most bona fide RL AGN of the sample. Furthermore, the radio loudness is also known to inversely correlate with the Eddington ratio (Ho, 2008; Yang et al., 2020). However, since in our case both quantities are derived from the [O iii] luminosities (i.e. the spectroscopic radio loudness and Eddington ratio ), an inverse correlation between these two quantities is hence expected.
3 The optical–radio connection and the origin of the radio emission
BPT diagrams attribute the optical emission lines of LINERs and Seyferts to photoionisation from AGN activity, whereas for Hii galaxies the line ionisation is most likely due to SF processes. The paucity of studies on the nuclear emission of ALGs casts doubts on the nature of this class of sources. However, the origin of the radio emission associated with an optical nucleus for each class is controversial, since several processes compete (Panessa et al., 2019). The [O iii] line emission taken from the Palomar spectroscopic survey is extracted from a more extended nuclear region than the sub-arcsec radio emission detected by our e-MERLIN survey. A direct spatial comparison between the optical and radio emitting regions is therefore not possible in this work. Consequently, a possible mismatch between the spatial distributions of the radio and optical regions could lead to a misinterpretation of the origin of the radio emission, e.g. genuine AGN-driven nucleus in a Hii galaxy. Fortunately, forthcoming studies with integral-field spectroscopy (e.g. from the MaNGA survey, Bundy et al. 2015) on local radio-emitting galaxies (e.g. Roy et al. 2021, Mulcahey et al in prep.) and with HST photometry on the LeMMINGs sample itself (Dullo et al. in prep.) will clarify this point.
In analogy to Paper I for a sub-sample (103 objects), we here carefully study the connection between the radio emission down to 50 pc and the sub-kpc [O iii] emission, weighing the role of , for the entire LeMMINGs sample. Specifically, we explore the –– relation to investigate the origin of nuclear radio emission in active and inactive galaxies.
3.1 Radio properties versus BH mass
Hints to possibly identify the genuine AGN origin of the nuclear emission come from two quantities: the BH mass and the radio luminosity. The former is often used as an indicator of BH activity as active nuclei are preferentially associated with massive systems (e.g., Chiaberge & Marconi 2011). The latter roughly establishes the likelihood of the source being radio-jet dominated, a sign of an active SMBH (Cattaneo & Best, 2009). Both quantities are connected in active nuclei, as AGN tend to become more radio powerful (e.g. radio louder) at larger (e.g. Best et al. 2005b).
| Fig. | sub-sample | Stat | Slope | Intercept | |||||
| (1) | (2) | (3) | (4) | (5) | (6) | (7) | (8) | (9) | (10) |
| 3 | active galaxies | S | 0.549 | 0.0001 | 0.526 | 1.650.25 | 23.08.1 | ||
| 3 | non-jetted Hii | S | 0.575 | 0.0003 | 0.541 | 0.610.33 | 31.28.7 | ||
| 3 | RL AGN + 3C/FR I | P | 0.526 | 0.00069 | 0.496 | 1.520.31 | 25.14.1 | ||
| 4 | all ( M⊙) | P | 0.951 | 0.00098 | 0.220.03 | -1.110.24 | |||
| 4 | active gal. ( M⊙) | P | 0.925 | 0.0028 | 0.150.03 | -0.450.21 | |||
| 6 | Seyferts | K | 1.190 | 0.0002 | 0.920 | 0.990.20 | -3.55.5 | ||
| 6 | RL AGN + 3C/FR I | P | 0.876 | 9.410-9 | 0.840 | 1.310.18 | -13.17.0 | ||
| 6 | RQ LINERs | S | 0.579 | 0.0001 | 0.542 | 1.210.28 | -11.16.4 | ||
| 6 | non-jetted Hii | S | 0.347 | 0.0001 | 0.323 | 0.790.30 | 5.010.2 | ||
| Eddington ratio | 7 | Seyfert | K | 0.591 | 0.0149 | 0.582 | 0.980.36 | 37.613.4 | |
| 0.83 + 0.82 | 8 | Seyferts | K | 1.072 | 0.0007 | 0.840.21 | 3.310.2 | ||
| 0.83 + 0.82 | 8 | RL AGN + 3C/FR I | P | 0.886 | 3.810-9 | 1.200.15 | -9.16.1 | ||
| 0.83 + 0.82 | 8 | RQ LINERs | S | 0.543 | 0.0001 | 0.830.19 | 4.09.5 | ||
| 0.83 + 0.82 | 8 | non-jetted Hii | S | 0.426 | 0.0001 | 0.600.25 | 13.012.9 |
Column description: (1)-(2) the two variables of the considered relation; (3) Figure; (4) the sub-sample of galaxies for the tested correlation. ‘Active galaxies’ include AGN (LINER and Seyferts) and jetted (ALG and Hii) galaxies; (5)–(6)–(7) the statistical analysis used for the given sub-sample to calculate the associated linear regression coefficient and the probability that there is no correlation : for the censored generalised Spearman’s correlation coefficient (for 30 objects), for the censored generalised Kendall’s correlation coefficient (for 30 objects) and for the Pearson correlation coefficient for fully a detected data set; (8) censored partial rank correlation coefficient between X and Y adjusting for the target distance D; (9)-(10) the slope and the intercept of the best fits with their 1- errors.
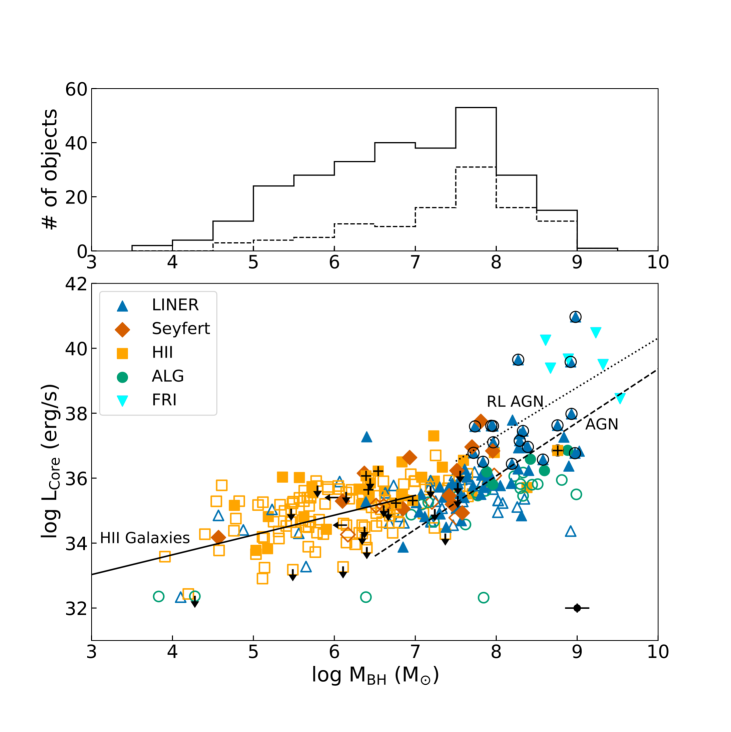
The distribution of radio-detected galaxies as a function of BH mass in the LeMMINGs sample is shown in Figure 3 (upper panel) and it is clear that the detection fraction increases with (a closer look in Fig. 4). Similarly, a positive trend between the radio core luminosities, , and is also observed (lower panel, Fig. 3). In analogy to Paper I, for the objects with M⊙, a clear sequence includes all active and jetted galaxies, despite the large scatter. However, below 106.5 M⊙, which mostly includes Hii galaxies, a flatter correlation emerges. Interestingly, the small sub-group of jetted Hii galaxies have M⊙ and generally follow the sequence of the active galaxies.
In order to assess the presence of correlations, we performed a
statistical censored analysis (ASURV package;
Feigelson &
Nelson 1985; Lavalley et al. 1992) which takes into account upper
limits. We used the schmittbin task (Schmitt, 1985) to
calculate the associated linear regression coefficients for two sets
of variables. The best fit is represented by the bisector of the two
regression lines obtained by switching the and axes as
dependent and independent variables. In order to estimate the
quality of the linear regression, for small data sets () we
also derived the generalised Kendall’s correlation coefficient (Kendall, 1938)
between the two variables, using the bhkmethod
task. Otherwise for larger samples, we used the Spearman’s rank order
correlation coefficient, using the spearman task
(Akritas, 1989). To measure the linear correlation between two fully detected sets of data, we estimate the Pearson correlation coefficient (Pearson, 1895). We also test the possible influence of the sample distance D in driving the established correlations, estimating the censored partial rank coefficient (Akritas &
Siebert, 1996). Table 2 reports the parameters of
the statistical analysis of the correlations we analyse hereafter in this work.
We fit the linear (in a - plot, hereafter) radio– correlation by including all the active galaxies, i.e. those which show characteristics of AGN activity in optical (emission line ratios) or radio (presence of jets) bands: RQ/RL LINERs, Seyferts and jetted ALG and Hii galaxies. For BH masses 106.5 M⊙, we find with a Spearman’s correlation coefficient of 0.549. This value shows the likelihood of the two quantities not correlating as less than 110-4 (Tab. 2).
In contrast, the non-jetted Hii galaxies tend to fall on another radio– sequence with 106.5 M⊙. Indeed, their relation clearly flattens with respect to that of active galaxies as with a chance (Spearman’s = 0.575) probability of correlation of 310-4 (Tab. 2). The two incident radio– relations valid for star-forming and active galaxies strengthen the scenario of a different origin of the radio emission: SF-driven for non-jetted Hii galaxies and AGN-driven for active galaxies.
Paper I suggested that LINERs and low-power RGs are powered by a common central engine, e.g. a RIAF disc with a coupled jet (Falcke et al., 2004; Nemmen et al., 2014). Paper I compiled a sample of six Fanaroff & Riley type I (FR I) RGs (i.e. 3C 66B, 3C 264, 3C 78, 3C 338, 3C274, and 3C 189, from the Revised Third Cambridge Catalogue, 3C, Bennett 1962) at 0.05 observed with MERLIN at 1.5 GHz (see Table 4 in Paper I). In Figures 2 and 3, FR Is stand out from the rest of the sources for their large radio luminosities and BH masses, and thus higher radio loudness, and clearly extend the LINER population to higher values. Therefore, we fit the mass-radio relation valid for the whole RL AGN group (RL Palomar + FR I galaxies, dotted line in Fig. 3). We find with a Pearson correlation coefficient of 0.526 and a two-sided no-correlation probability significance of 6.910-4.
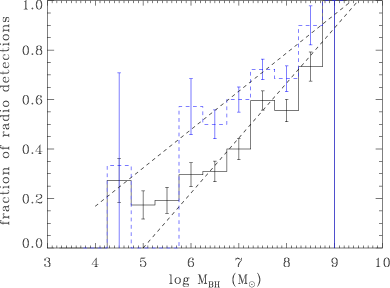
Two different radio- sequences below and above 106.5 M⊙, respectively, for star-forming and active galaxies have been thus validated, also by excluding the distance effect in driving the correlations (as the censored partial rank coefficients only marginally decrease, see Tab 2). Therefore, now that the presence of a break at 106.5 M⊙ has been highlighted, we can focus on the fraction of radio detections, , as a function of for the entire LeMMINGs sample (Fig. 4). For 107.5 M⊙, this fraction is 50 per cent, reaching 75 per cent in the last bins, 108.5 M⊙. Conversely, the fraction flattens at 20 per cent below 106.5 M⊙, where the SF was found to largely contribute in our sample (Fig. 3). By considering only the sub-sample of active galaxies, the fraction of radio detections is unexpectedly higher than that of the entire sample in each BH mass bin. We also note that the reaches 100 per cent for active galaxies with 1036 erg s-1 ( W Hz-1) and 107 M⊙. We fit the two detection fraction distributions as a function of BH mass for 106.5 M⊙ to avoid both the SF flattening and a single AGN case (Seyfert NGC 4395666The active galaxy with the lowest of the sample, 3.7104 M⊙). The best fits (see statistical parameters in Tab. 2) are and , respectively, for the whole LeMMINGs sample and for the active galaxies.
All of the radio morphological classes are represented along the radio (both and ) sequence. The total integrated radio luminosity, , also broadly increases with the BH mass (Fig. 5). There is no overall trend which links a specific radio morphological classification to a given range of radio luminosities. The fraction of targets assigned to class B, C, D and E (e.g. clear jetted structures or complex) typically increases with / because of their large extended, and sometimes diffuse, radio emission. Core/core–jet structures (class A) are observed across a slightly broader and range than the other classes. A similar effect has been also noted in the – plot. This could be the consequence of two effects: the preference for faint sources to appear as single cores and a Doppler boosted flux in the case of aligned sources. However, the latter scenario, i.e. a core boosting, is expected to marginally affect our results at 1.5 GHz in the sub-mJy regime (only for RL AGN, see e.g. blazar-like heart of NGC 1275, Walker et al. 1994).
3.2 Radio properties versus [O iii] luminosity
The comparison between radio and optical properties of galaxies is a powerful tool to explore the nature of their nuclear emission. The [O iii] luminosity represents a robust upper limit (unless there is strong dust extinction) to any bolometric emission from an accretion disc in the case of an AGN (Lamastra et al., 2009) (or from stellar emission in the case of an Hii galaxy, Moustakas et al. 2006). The radio emission efficiency, i.e. the fraction of the radio emission produced with respect to the AGN (or SF) bolometric luminosity, offers a good diagnostic to investigate the nature of the nuclei.
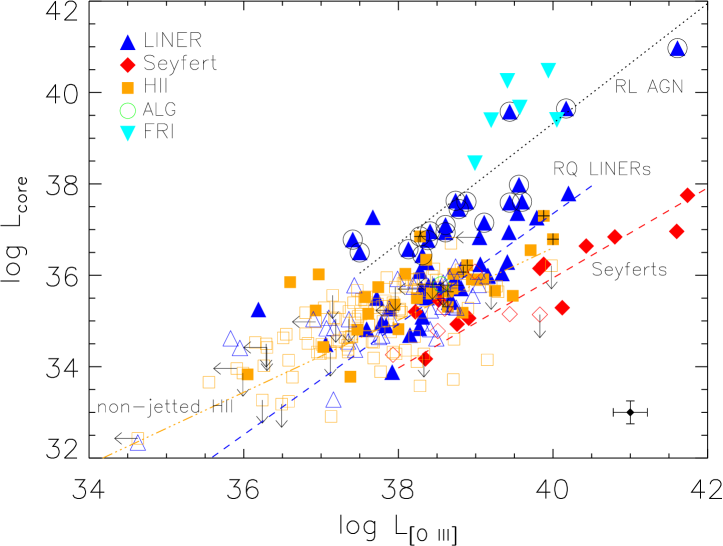
The radio core luminosity as a function of [O iii] luminosity is shown in Figure 6 for the LeMMINGs sample (without ALGs which lack optical counterparts, but including NGC 5982 with a upper limit). The three optical classifications (LINER, Seyfert, Hii galaxy) tend to cluster in different regions of the [O iii]–radio diagram, despite a large overlap, similarly to what has been noted in the analogous plot for a smaller sub-sample in Paper I. Seyferts are up to 100 times more luminous in the [O iii] emission line compared with LINERs for a given , or equivalently have 100 times less luminous radio cores. The Hii galaxies have the lowest radio and [O iii] luminosities, whilst the LINERs have intermediate values. Analogously to Paper I, we report that the LINERs appear to broadly follow a linear trend in the [O iii]-radio plot. Similarly to Fig. 3, the relation formed by Hii galaxies shows a break with respect to that valid for active galaxies at lower luminosities. Compared to the results from Paper I, we note that Seyferts show a distinct relation with respect to the other classes. The current complete sample allows us to derive more robust relations by using the censored data analysis (see Table 2) than those obtained in Paper I.
First, Seyfert galaxies clearly show a striking linear correlation in the form 0.99±0.20 with a (Kendall’s = 1.190) probability of 0.0002 of being caused fortuitously. At higher radio luminosities, RL AGN follow the 3C/FR Is on a steeper linear fit, 1.31±0.18 (Pearson’s P value = 9.410-9). RQ LINERs fill the gap between RL AGN and Seyferts with a correlation almost parallel to the one found for RGs, i.e. 1.21±0.28 (Spearman’s P value 0.0001). At low powers, the sequence of non-jetted Hii galaxies clearly flattens with respect to that formed by active galaxies, but with a broader scatter, i.e. 0.79±0.30 (Spearman’s P value 0.0001). Once the distance dependence has been considered, these optical-radio relations are still statistically valid, because the censored partial rank coefficients are only slightly smaller than the generalised correlation coefficients (see Tab. 2).
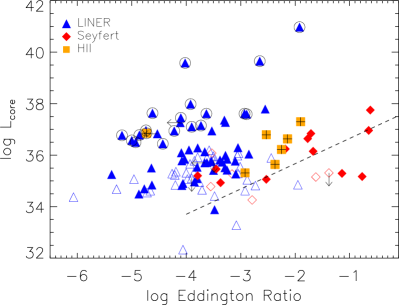
Beyond the optical classification, the sources with a core/core–jet or triple structure tend to follow the correlation of the active galaxies, as they are mostly classified as LINERs and Seyferts. Similarly, most of the ETGs also follow the correlation of active galaxies. Conversely, we do not find any statistically significant correlation between the Eddington ratios and for our sample (see Fig.7, probability of fortuitous correlations 0.04). Nevertheless, we note for Seyferts: i) a mild positive trend where and Eddington ratio linearly increases with a slope 0.980.36 with a large scatter 1 dex (Kendall’s = 0.591 [ essentially unchanged correlation coefficient, if considering the distance dependence] and probability of a null correlation 0.0149, Tab. 2]) and ii) the jetted morphologies correspond to objects with higher Eddington rates.
3.3 The optical Fundamental plane of BH activity
Observational attempts at explaining the similarities between the X-ray and radio properties of SMBHs and XRBs eventually culminated in the discovery of the so-called ‘Fundamental Plane of Black Hole Activity’ (hereafter ‘FPBHA’ Merloni et al., 2003; Heinz & Sunyaev, 2003; Falcke et al., 2004). The FPBHA is a 3D hyper-plane that correlates the radio luminosity with the X-ray luminosity, scaled by the BH mass, and seems to hold for XRBs and active SMBHs. By using a similar approach, Saikia et al. (2015) introduced a new version of the FPBHA using the [O iii] luminosity as a tracer of the accretion, instead of the X-ray luminosity and found an analogous correlation for active BHs. The advantage of using the [O iii] line instead of the X-ray data is the accessibility from the ground with reasonable resolution. Full coverage of the optical and radio data for the entire LeMMINGs sample allows a complete analysis of the Fundamental Plane (FP). New X-ray Chandra observations and the X-ray-based FP of the LeMMINGs sample will be addressed in forthcoming papers (Williams et al., in prep.)
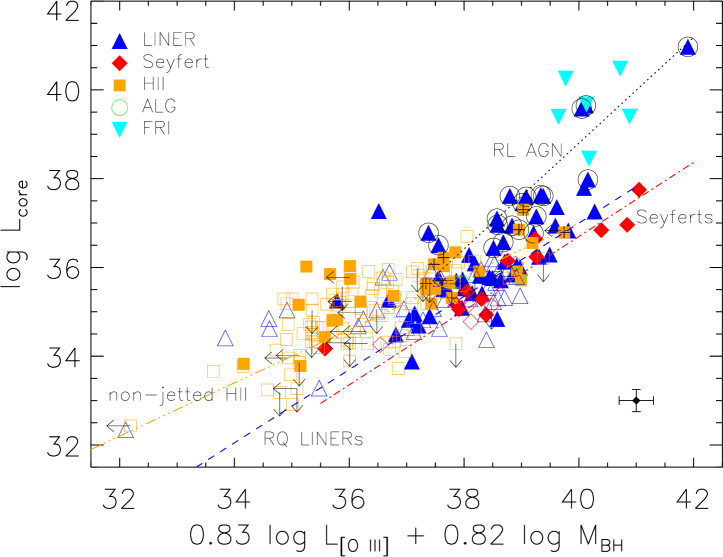
Figure 8 depicts the optical FPBHA of the LeMMINGs galaxies, by using the same parametrisation expressed by Saikia et al. (2015). Note that these authors used 15-GHz VLA observations at a resolution of 013, comparable with that of our e-MERLIN data. Yet, their observations are possibly less contaminated by SF and more sensitive to the nuclear optically-thick radio emission than our 1.5-GHz observations because of the higher radio frequency.
In Paper I, despite a limited number of sources, we noted that the active galaxies appear to broadly follow a common correlation in the optical FP, stretching their luminosities up to FR I RGs. Nevertheless, Paper I also noted the three classes are slightly stratified within the FP scatter across the radio luminosities, possibly reminiscent of the different accretion states for each optical class. Here, thanks to the sample completeness, we are able to recognise that different optical classes move separately along the plane. LINERs still appear to follow the FR Is at lower luminosities. The RL (FR I, Parma et al. 1986) jetted Hii, NGC 3665, lies on the RL AGN relation and the rest of the jetted Hii galaxies agrees with the FPBHA of RQ LINERs. Seyferts, on the other hand, seem to cover a different sequence in the plane because of their lower radio core luminosities. Non-jetted star forming galaxies stand out from the rest of the sample because of their smaller BH masses and lower [O iii] and radio luminosities. Therefore, similar to the approach taken in Paper I, we prefer to fit the FPBHA for the different classes, by using the parametrisation introduced by Saikia et al. (2015) (in units of erg s-1 for luminosities and M⊙ for BH masses)777We refrain from providing a new optical FPBHA parametrisation independent of that of Saikia et al. because of the presence of a large fraction of upper limits in radio and [O iii] data and the fact that [O iii] luminosity is not an absolute estimator of the AGN activity. We will dedicate an accurate analysis on the X-ray-based FPBHA, by using the state-of-the-art censored-data statistics (Williams et al., in prep.).:
where Saikia et al. found = 1.0 and = 3.08 for their sample. Table 2 collects all the statistical results obtained from fitting the FP for different classes. Seyferts exhibit a tight linear correlation even evident to the naked eye, with a slope of =0.840.21. The generalised Kendall’s coefficient of the Seyfert FP is 1.072 which indicates that two axis quantities do not correlate with a probability of 0.0007. The whole LINER population shows a large scatter in the FP. A better understanding of this population is possible by separating RL and RQ LINERs, which follow different tracks in Fig. 8: RL LINERs extend the FR Is to lower regimes, whereas RQ in general tend towards the locus of Seyferts. We search for linear correlations separately for the two LINER classes. For RL AGN (RL LINERs + FR Is), the fit clearly appears steeper than the Seyfert plane, with a slope of =1.200.15 (Pearson’s P value = 3.810-9). For the RQ LINERs, the plane is statistically consistent with the one defined by Seyfert galaxies but it extends to lower luminosities with a larger scatter, bridging the gap between RL LINERs and Seyferts: = 0.830.19 with a (Spearman’s) P value 0.0001. The non-jetted Hii galaxies break the generic FP of the active galaxies with a flatter slope ( = 0.600.25, Spearman’s P value 0.0001) extending to the lowest luminosities and BH masses of the sample.
Although has been found to correlate with both and for the LeMMINGs sample (Sect. 3.1 and 3.2), a mutual dependence could stretch the optical FPs we observe. The scatters of the FPs of the optical classes (FWHM 0.8 dex) are typically smaller than the scatters of the relations defined for each class in the radio- and the radio-[O iii] planes (FWHM 1 dex). This suggests that the observed FPs are not stretched by any particular dependence on one of the three quantities (, , ) which establish the plane, as it has been also confirmed by other studies (e.g. Saikia et al. 2018a). Nevertheless, the large number of upper limits in the radio and line measurements may undermine the reliability of the fitted FPs. To test the accuracy of the established FPs, in the cases of non-detected Seyfert and LINER galaxies in the radio band, if we assign a core luminosity extrapolated by the - relation found for active galaxies, the corresponding data-points would lie on the plane of their corresponding class. Analogously, non-detected ALGs (in [O iii], but detected in radio) would sit between RL and RQ LINERs. Conversely, non-jetted Hii galaxies would follow the plane of the RQ LINERs if they had the core luminosities assigned by the - relation valid for AGN at their BH masses. This result reinforces the discrepancies of the observed FPs and their physical meanings for the different optical classes. In summary, star forming and active galaxies follow different FPs, as also evident in the radio-[O iii] plane (Fig. 6), which are likely a consequence of different origins of their radio emission in relation to their main source of energy (stellar or BH accretion).
4 Discussion
The LeMMINGs survey has unveiled radio cores at the centre in around half of our sample of local Palomar galaxies. Here we investigate the origin of the nuclear 1.5-GHz emission and discuss the optical–radio association in the context of physical models of disc–jet coupling888Disc–jet coupling refers to the connection between the inflowing accretion mode and the outflowing mode, in the form of e.g., jets, winds, or slow outflows (Panessa et al., 2019). and SF for each optical class (see Table 3 for a simple summarising sketch, see also Panessa et al. 2019).
4.1 LINERs
LINERs are amongst the most frequently detected and most luminous sources in the LeMMINGs sample. They are mostly detected in ETGs and feature bright radio cores and jets.
Near-infrared, optical and X-ray nuclear emission in LINERs has generally been interpreted as related to an active SMBH (Terashima et al., 2002; Balmaverde et al., 2006; González-Martín et al., 2006; Flohic et al., 2006; Kharb et al., 2012), although reservations have been raised in the past (e.g., stellar-dominated optical nuclei, Capetti 2011). In contrast, several pieces of evidence convincingly argue in favour of an AGN origin of the radio emission in LINERs. First, their high brightness temperatures measured with e-MERLIN and VLBI (107 K, Papers I and II, Falcke et al. 2000) suggest synchrotron emission from (mildly to highly) relativistic jets. Second, core luminosities for LINERs correlate with their BH masses up to the classical RL regime with , suggesting that the mass of the SMBH plays a major role in the production of radio emission. Third, LINERs are often associated with either symmetric or asymmetric pc/kpc-scale jets with luminosities of 1036 erg s-1, similar to low-power RGs (Fanti et al., 1987). Such morphologies and powers cannot easily be explained by SF, as the latter resides in the sub-mJy regime below 1034 erg s-1 (Bonzini et al., 2013; Mascoop et al., 2021). Fourth, the jets tend to be core-brightened, similar to small FR Is (Capetti et al., 2017), suggesting that the jets are probably collimated and launched relativistically on parsec scales, but rapidly slow down along the jet propagation axis on kpc scales. These characteristics are similar to what is seen and modelled in nearby low-luminosity RGs (Morganti et al., 1987; Giovannini et al., 2005; Massaglia et al., 2016; Rossi et al., 2020).
The analysis of LINERs in this work has led to rather different results compared to what we found in Paper I, probably due to the inhomogeneous population of LINERs in the latter. Here we identify two sub-classes, RL and RQ. A group of eighteen RL LINERs have the lowest Eddington ratios (10-4) and are the brightest sources of the sample. They typically reveal core–jet and twin jet morphologies, reside in ETGs and extend the relations of 3C/FR Is to low radio and [O iii] luminosities. The complementary RQ group of LINERs have slightly higher accretion rates than the RLs (Eddington ratios mostly 10-4–10-3) and form an intermediate optical–radio relation between RL AGN and Seyferts.
Similarities in the correlations of RL LINERs and FR Is support the idea that they likely share the same central engine, capable of launching relativistic jets. The correlation between radio and optical (continuum) emission found for FR Is is best explained as the result of a single emission process in the two bands (i.e. non-thermal synchrotron emission from the base of the relativistic jet, Chiaberge et al. 1999). Analogously, an [O iii]-radio correlation found for FR Is and low-luminosity RL LINERs (Balmaverde & Capetti, 2006) suggests a similar ionising central source. Therefore, this interpretation is plausibly also valid for the RL LINERs in our sample, indicating that they represent the scaled-down version of FR Is with lower luminosities and accretion rates, as also reported in previous studies (Falcke et al., 2004; Allen et al., 2006; Balmaverde et al., 2008). Multiple theoretical and analytical studies of FR Is (e.g. Meier 2001; Begelman 2012; McKinney et al. 2012) suggest that they are powered by a RIAF disc, usually as an advection-dominated accretion flow (ADAF, see reviews by Narayan & Yi 1994; Narayan & McClintock 2008), which can efficiently produce jets. As LINERs are usually radio-louder than the other optical classes and similar to low-power RGs (Capetti & Balmaverde, 2006; Kharb et al., 2012), a model of an ADAF disc with a low-power jet (jet-dominated accretion flows, JDAF, Falcke et al. 2004) has been used as well to describe the disc–jet coupling of LINER-like AGN.
Conversely, the RQ LINERs appear to deviate from the RL AGN correlations, pointing to a different interpretation for their central engine. A possible truncated disc with an optically thick disc at larger radii (Chen et al., 1989; Maoz, 2007; Narayan & McClintock, 2008; Nemmen et al., 2014) could represent an intermediate regime between the low- JDAF model for RL LINERs and high- SAD models for luminous Seyferts. The accretion flow may begin as a thin SAD but, at a certain transition radius, gradually switches from a cold to a hot ADAF mode, resulting in composite characteristics with weaker sub-relativistic jets and slightly higher accretion rates. This result is broadly consistent with what has been found for a general dual population of RL and RQ LINERs in the local Universe (e.g., Chiaberge et al. 2005; Balmaverde & Capetti 2006).
| class | radio | disc | ||
| RL LINER | relativistic jets | RIAF | ||
| RQ LINER | sub-relativistic jets | truncated thick disc | ||
| (RQ) Seyfert | \rdelim {220pt | sub-relativistic jets | JED/truncated slim disc | |
| disc/corona wind | SAD | |||
| ALG | (sub-)relativistic jets | recurrent/starving RIAF | ||
| jetted H II | sub-relativistic jets and SF | RIAF? | ||
| non-jetted H II | SF | |||
4.2 Seyferts
Seyfert galaxies show the highest radio detection fraction in the LeMMINGs sample. Two thirds of the detected Seyferts are found in spiral galaxies and one third in ETGs. The Seyferts with the highest Eddington ratios and BH masses are the most luminous at 1.5 GHz, featuring edge-brightened radio morphologies.
Seyfert nuclei lie in a different region of the optical–radio plane with respect to RL LINERs and FR Is: for a similar radio luminosity, they show a significant optical excess (2–3 dex). On the one hand, their optical line excess is qualitatively similar to that observed in luminous type-I QSO, where their high-energy output is interpreted as a result of thermal emission from a radiatively efficient accretion disc (SAD, Panessa et al. 2006; Cappi et al. 2006; Singh et al. 2011). On the other hand, a large variety of radio characteristics observed in local Seyferts (e.g. morphologies, radio SED in relation to accretion properties, Laor et al. 2019) prevents a complete comprehension of the origin of their radio emission (Panessa et al., 2019; Silpa et al., 2020), although a non-thermal synchrotron origin for compact cores in Seyferts has been clearly established (Kukula et al., 1999; Mundell et al., 2000; Nagar et al., 2000; Ho & Ulvestad, 2001).
As a first approximation, the radio and optical properties observed in our sample of Seyferts are consistent with the general properties of SADs: higher accretion rates (10-3 Eddington rate) and lower efficiency at launching and collimating jets than ADAF-dominated LINERs. In fact, diffuse lobe-like radio structures are observed more frequently in Seyferts than in LINERs in LeMMINGs and in other samples of local Seyferts (e.g. Kukula et al. 1993, 1995; Morganti et al. 1999; Kharb et al. 2006; Gallimore et al. 2006). These lobes999We cannot fully rule out SF-driven super-winds as the cause of the observed lobes in Seyferts (Pedlar et al., 1985; Heckman et al., 1993). However, such a scenario is unlikely because these structures are primarily observed in star forming galaxies at low radio luminosities (1034 erg s-1), where other than radio bubbles, extended SF in the galactic disc is observed. have been interpreted as sub-relativistic outflows at the core, which inflate bubbles and produce bow shocks in the ISM (Middelberg et al., 2004; Yuan & Narayan, 2014).
To complete the puzzle, Seyferts are clearly radio-quieter than RQ LINERs, suggesting a different disc–jet coupling. Their strikingly distinct correlation between the radio core and disc luminosity, and the lack of continuity between Seyferts and other AGN classes, rule out the possibility that Seyfert jets are just the scaled-down versions of RG relativistic flows (Talbot et al., 2021). Our study also reveals a moderate increase of the radio luminosity and jetted structure fraction at higher Eddington ratios, which can be interpreted as increasing jet luminosity with higher ( = where is the jet production efficiency). This is different from the literature where there are reports of a tendency of an increased jet production () as the system goes fainter from QSOs to low-luminosity Seyferts (e.g. Trippe 2014; Wójtowicz et al. 2020), which is consistent with the anti-correlation between radio loudness and bolometric luminosity in AGN (e.g. Terashima & Wilson 2003; Panessa et al. 2007; Ho 2008) and in XRB (Fender et al., 2009). Such an effect could be caused by an incomplete separation between RQ and RL Seyferts and a lack of angular resolution to resolve jets. Previous studies were based on more heterogeneous samples of radio-emitting Seyferts/QSOs than our sample which consists of a complete sample of resolved jetted RQ Seyferts. In fact, recent studies (Rusinek et al. 2020; Chang et al. 2021) which separate RQ and RL AGN, show a slight increment to small Eddington ratios for RQ Seyferts, an effect that is enhanced by including RL Seyferts. Therefore, considering a differential dependence on for each radio-emitting physical mechanism competing in the total radio production (= + + ) could solve the tension (Laor et al., 2019). At low , a (core-brightened) sub-relativistic jet ( + ) might dominate over a (edge-brightened) radio-emitting disc/corona wind, which, in turn, becomes important at high ( or ) (see Sect. 4.5 for discussion and comparison with XRBs). Such scenario would account for both the heterogeneous radio properties of Seyferts and the general tendency of low-luminosity Seyferts to expel more compact jets than QSOs over a large range of Eddington ratios, covering the gap between two extreme classes: almost-radio-silent high- QSOs and jetted low- LINERs. In addition, the role of the BH parameters (e.g. mass, spin) is to sustain and reinforce the jet/wind launch (Yang et al., 2021).
To accommodate the disc and radio similarities respectively with QSOs and LINERs, several scenarios have been proposed within the large breadth of SAD models. At small Eddington ratios, a solution could be the model of Jet Emitting Discs (JED, Ferreira et al. 2010) which are much less dense than an optically-thick disc and arise at larger magnetisation, where magneto-centrifugally driven jets are launched (Ferreira, 1997). Another scenario is the presence of a truncated slim disc whose inner radius, where the jet is anchored, shrinks, by dragging higher poloidal magnetic flux strength closer to a spinning SMBH. This condition favours the launch of strong radio outflows (Tchekhovskoy et al., 2011), and leads to an increase of the jet Lorentz factor , similar to what is seen in the hard-state XRBs (e.g. Fender et al. 2004). At higher Eddington ratios, a quasar-driven uncollimated wind is favoured, able to shock the ISM and accelerate relativistic electrons producing synchrotron radio emission (Faucher-Giguère & Quataert, 2012; Zakamska & Greene, 2014). An alternative scenario is an outflow of coronal plasma above the accretion disc, which slightly collimates within a narrow nozzle near the SMBH and then fans out to form a diffuse radio morphology (Donea & Biermann, 2002; Markoff et al., 2005; King et al., 2011; Raginski & Laor, 2016).
4.3 Absorption line galaxies
The ALGs lack evidence of BH-accretion activity in the optical band but may still conceal a weak AGN at their centres, since they show bright radio cores and jets.
Apart from a few irregular/dwarf ALGs which are probably powered by stellar processes (Paudel & Yoon, 2020), when detected in radio, ALGs appear indistinguishable from LINERs: massive ETGs hosting SMBHs with masses 108 M⊙ and core-brightened radio morphologies. In addition, the radio-detected ALGs are potential RL AGN, since their optical counterparts are not detected. This scenario is supported by a multi-band study of local line-less RL AGN whose nuclei and hosts are similar to those of LINER-like RGs (Best et al., 2005b; Baldi & Capetti, 2010), although at slightly higher luminosities than those of LeMMINGs sample (1039–1041 erg s-1). The radio detection of ALGs in this survey, and in previous studies, argue for the presence of an active SMBH in at least a quarter of ALGs. In this scenario, the optically weak characteristics of ALGs could also be reconciled with the picture of low- RGs, where nuclear conditions (i.e. low ionising source, poor gas availability) do not favour optical emission from a compact NLR. This picture has been observed in particularly faint FR Is (Buttiglione et al., 2009) and relic RGs (Capetti et al., 2013).
Even under favourable conditions, local SMBHs are known to exhibit levels of activity much lower than those expected from gas supplying rates onto the galactic nuclei, and only a small fraction of silent SMBHs can turn into AGN. Dynamic stability of gas reservoirs and particular conditions of magnetic field loops, which trap stars and gas in orbits, could lead to a fuel-starved SMBH (Inayoshi et al., 2020), thus resulting in ALGs. The problem of dormant massive BHs has much been discussed in the last decades (e.g Fabian & Canizares 1988; Kormendy & Ho 2001; Herpich et al. 2018) and the inactivity of ALGs falls in this investigation.
Another possible interpretation of the apparent absence of nuclear activity in ALGs is intermittent accretion (Czerny et al., 2009). For example, the currently quiescent Sgr A* was recently found to have undergone a period of activity a few million years ago, which created a radio outflow as a consequence of an accretion event (Heywood et al., 2019). Around 30 per cent of fading AGN have been found to feature jets (Esparza-Arredondo et al., 2020). The large fraction of non-detected ALGs suggests that if they have intermittent periods of accretion activity, they are short-lived (104–105 years, Reynolds & Begelman 1997). This is supported by estimates based on their radio jet lengths (Papers I and II). Any intermittent activity could be caused by occasional accretion events lasting a few Myr, where X-ray emitting hot-gas atmosphere, typical of ETGs (Forman et al., 1985), feeds the strangulated SMBH at a very low , and establishes a quasi-spherical accretion regime which supports the jet launching (Ho, 2002; Allen et al., 2006).
In summary, unfavourable nuclear conditions, SMBH dormancy and nuclear recurrence can account for the optical and radio detections (or lack thereof) in ALGs. However, once the accretion is set, the activity phases visible in the two bands are not necessarily synchronised: the jet production can possibly lag the disc activity by a few 102-104 yr (depending on and jet length and power) as expected by disc–jet evolution models (e.g. Czerny et al. 2009).
4.4 Hii galaxies
The Hii galaxies are generally interpreted as SF-dominated nuclei, based on the emission line ratios in BPT diagrams, but this does not preclude them from having a weak AGN. Hii galaxies show mostly compact single cores and extended complex structures.
The analysis of the full LeMMINGs sample confirm the results from Paper I: the presence of a dual population of Hii galaxies, i.e. jetted and non-jetted, which are probably related to different origins of the core emission. In general, jetted Hii galaxies are found to have larger (106.5 M⊙) than their non-jetted companions.
The vast majority of radio-detected Hii galaxies are non-jetted. They are less [O iii] luminous by a factor 30 than active galaxies, and typically have a large radio excess with respect to the [O iii]–radio correlation found for LINERs at low . All these characteristics are consistent with a scenario of a nuclear starburst on a scale of 1 kpc, producing stellar emission at 1.5 GHz. To corroborate this picture of a stellar origin, Paper I concluded that thermal/non-thermal and free-free radio emission predicted from supernova (SN) progenitors, SN explosions and SN remnants and Hii regions (Ulvestad et al., 1981; Condon, 1992) are sufficient to account for radio luminosities of non-jetted Hii galaxies. In addition, a population of SNe expected from high SFR (30–50 M⊙ yr-1) might be able to blow bubble-like super-winds (Weaver et al., 1977; Heckman et al., 2015), which would match the extended irregular morphologies (E class) observed in some sources.
In contrast, three aspects of the (seven) jetted Hii sources point to the presence of an active SMBH, powering their radio emission: i) larger BH masses than the non-jetted companions; ii) core-brightened and elongated radio morphologies, ii) similar line-radio correlation and FPBHA to those found for RQ/RL LINERs. As an example, the well-known FR I (NGC 3665, Parma et al. 1986) belongs to this sub-sample. We conclude that it is likely that this population of jetted Hii galaxies does host weak AGN, whose output is too dim to significantly contribute to the optical emission, dominated by nuclear SF. The possible LLAGN signatures found in jetted Hii galaxies are similar to those of sub-Eddington LINERs (likely powered by a RIAF), rather than the efficiently accreting Seyferts, and could represent the tip of the iceberg of a large population of weakly-active sub-mJy star forming galaxies at low powers (Padovani, 2016; Muxlow et al., 2020). Another scenario to account for their radio-optical properties is the combination of both SF and an active BH in the event of a jet shocking a dense ISM and triggering in-situ SF (Gaibler et al., 2012; Dugan et al., 2014). The SF–AGN co-existence underlines the symbiotic relationship between these two types of activity, particularly in LTGs (e.g. Santini et al. 2012).
4.5 Low-luminosity AGN and disc–jet coupling
Almost half (45 per cent) of the LeMMINGs galaxies are not radio silent, but are characterized by low radio powers ( 1017.6 W Hz-1). Our survey has revealed that local galaxies can show evidence of weak AGN-driven activity, in the form of sub-galactic jets (B, C, D classes) or optical line ratios (LINER or Seyfert) down to 1018.7 W Hz-1. By binning the sample by radio luminosity and BH mass, the fraction of radio detections reaches 100 per cent for galaxies with 1019.8 W Hz-1 (twice than the survey sensitivity limit) and with 107 M⊙, regardless of optical type. This limit represents the lowest luminosity for which the most massive BHs hosted by local (Palomar) galaxies are ‘always’ switched on. This limit is lower than what has been obtained from previous radio surveys, 1020–1021 W Hz-1 for the most massive galaxies (Mauch & Sadler, 2007; Cattaneo & Best, 2009; Sabater et al., 2019).
Assuming that some (if not all) of the radio emission in LLAGN comes from jets, the jet fraction is expected to increase with decreasing Eddington ratios, and consequently the radio loudness should increase with increasing BH mass (Ho, 2008). However, the jet/radio properties of nearby galaxies have been shown to be more complicated than a simple bimodality (presence or lack of jet in relation of low- or high- disc), suggesting specific modes of accretion and jet launching mechanisms for different optical AGN classes (Best & Heckman, 2012; Hardcastle, 2018). The high sensitivity and resolution of our survey casts light on the entanglement between radio/jet and optical/disc properties in LLAGN. Further help in disentangling this complexity comes from the comparison with the analogous disc–jet coupling observed in XRBs (Remillard & McClintock, 2006; Fernández-Ontiveros & Muñoz-Darias, 2021). Within the low/hard XRB state, there are indications that the transition radius between an inner ADAF and an outer thin disc decreases with increasing luminosity (Narayan, 2005) and a short-lived strong radio outburst occurs where highly relativistic jets are launched (e.g., Fender et al. 2004). Conversely, clear jets are never seen in high-soft XRBs, while our survey and other studies demonstrate that their putative AGN-equivalent (low-luminosity) Seyferts can produce jets as much as LINERs do. While jetted AGN and low/hard XRBs clearly lie on the same FPBHA (Merloni et al., 2003; Falcke et al., 2004), Gültekin et al. (2019), by including radio-active high/soft state XRBs, cannot rule out that the latter and Seyferts are inconsistent with the FP made up of low/hard state XRBs and LINERs. Furthermore, Fischer et al. (2021) has recently shown that, Seyferts, once resolved with the VLBI on sub-parsec scales, can have corresponding upper limits that are systematically below the predictions from the FPBHA. The tension with the analogies between stellar mass BHs and active SMBHs probably rests on attempting to use the optical class to set the association. The Eddington-ratio argument could partially resolve this tension. For XRBs, sources are almost entirely in hard states below 2 per cent of (Maccarone, 2003; Vahdat Motlagh et al., 2019), while above that value both states are present. For AGN classes, LINER and Seyfert distributions usually roughly break up at 0.1 per cent of . Therefore, the global properties of LINERs (e.g. low Eddington ratios; weak or strong, persistent radio jets; hard X-ray spectra) make this class similar to hard-state XRBs. Conversely, Seyferts show more heterogeneous radio and disc properties and consists of a mixture of hard and soft states (Fernández-Ontiveros & Muñoz-Darias, 2021). Low- Seyferts (between 0.1 and 2 per cent of ) could be more similar to hard XRBs, able to launch compact jets, while the high- Seyferts are more similar to soft XRBs. However, as disclosed in Sect. 4.2, the current status of results on Seyferts based on radio observations reveals a higher level of complexity than this scenario. In fact, we would expect a larger fraction of jetted structures at low , similar to hard XRBs, which is opposite to what we observe in our sample, but in agreement if we consider a larger population which includes luminous Seyferts and QSOs. A possible explanation to this apparent contradiction is that different physical mechanisms of radio production co-exist in Seyferts, which makes the comparison with XRBs even more challenging. At higher accretion rates (), disc and corona wind are expected to play an important role in the radio emission (Laor et al., 2019) and could account for the observed tendency to display edge-brightened structures. At lower , a sub-relativistic compact jet, more similar to RQ LINERs, could dominate over the other radio-emitting physical processes (Table 3).
Although (simultaneous) high-frequency radio (e.g. mm-band) and X-ray observations would be ideal to isolate the pc-scale emission and its link to the disc (see Bell et al. 2011; Behar et al. 2020), in our 1.5-GHz survey, we observed a significant dependence of radio-optical properties (i.e. disc–jet coupling) with . The small range of stellar BH masses of XRBs does not enable a straightforward comparison of radio models valid for XRBs with the results from the LeMMINGs survey. Instead, this is possible for AGN in general. In fact, AGN disc models predict different mass dependencies for the radio emission. The similar slopes found for RL and RQ AGN () despite the large scatter, can be interpreted as a single strong connection between the radio output and the BH mass, regardless of the type of the radio product (i.e. relativistic or sub-relativistic jets, winds, etc). In the observed range of – slopes, a degeneracy of models exists: for jet-dominated sources (e.g., JDAF, Falcke et al. 2004) (where is the BH spin), ADAF models which predict radio emission (Yi & Boughn, 1999), while relativistic jets can be described by the Blandford–Znajek (BZ, Blandford & Znajek 1977) process as (where is the magnetic field). Across the different AGN classes, a large range of BH spins, accretion rates and magnetic field strengths could account for the significant but scattered relations we observe. The transition from RQ AGN (jetted Hii galaxies, RQ LINERs and Seyferts) to RL AGN (RL LINERs and FR Is) could be caused by an increment of BH or disc parameter values, which result in a boost of the radio emission (Blandford et al., 2019; Chen et al., 2021).
The radio emission production in XRBs is related to accretion rate and high-energy-band luminosity (from optical to X-ray, produced by physical processes in disc and/or corona). Their jet contribution to the observed high-energy flux is largely debatable (e.g. Fender 2001; Markoff et al. 2003). Despite the problematic comparison between states of SMBHs and stellar BHs, radio and disc emission models of XRBs could still help to understand the physical processes involved in active SMBHs. For the jet-mode inefficient discs in XRBs, , whereas for disc-dominated sources (see Coriat et al. 2011). In our LeMMINGs sample, assuming that [O iii] is a good indicator of the bolometric AGN power which scales with the X-ray output, LINERs show a steeper radio-disc luminosity dependence ( for RL and RQ LINERs) than Seyferts ( ). This is opposite to the equivalent relationship observed in hard/soft XRBs. Furthermore, the absence of a clear dependence of the radio luminosity on Eddington ratios in LINERs casts new light on a possible disparity between jetted accreting compact objects, since hard-state XRBs show (e.g. Körding et al. 2006), unless scales as for LINERs (Netzer, 2009).
In the context of AGN models, for SAD-dominated sources the ratio / (Yi & Boughn, 1999) is expected to be constant and limited to a narrow range of values, as we find for our Seyferts, if the range is finite. Conversely, for LINERs, that are powered by RIAF discs, the relation between bolometric AGN and jet power is difficult to model because jet emission can dominate their entire SED (Körding et al., 2008) and [O iii]-line contamination from jet photoionising shocks can overpredict the bolometric AGN power (Capetti et al., 2005; Netzer, 2009). However, in a simplistic scenario of a disc origin of the radio emission, ADAF discs would predict much shallower relations ( with 0.6 depending on bremsstrahlung-dominated and multiple Compton scattering regimes, Yi & Boughn 1998) than the observed slopes for LINERs (1.2-1.3). Furthermore, the observed radio-[O iii] relation found for LINERs is even steeper (despite the large scatter) than any previous relations between the kinetic jet power and the bolometric AGN luminosities found for LINER-like RL AGN (slopes 1, e.g. Capetti & Balmaverde 2006; Merloni & Heinz 2007; Baldi et al. 2019b). Therefore, assuming that RL LINERs are the scaled-down version of RGs and normalising the / comparison with previous studies based on this assumption, the steeper slopes might be the consequence of a closer view of jet launching mechanism even in RQ LINERs. The high sensitivity and sub-arcsec resolution (crucially intermediate between VLA and VLBI) provided by our survey allowed us to probe the parsec scale region near the core where the jet is launched and reveal the relevant role of and BH spin/mass in the jet production. These parameters could eventually induce much steeper relations than those established with shallower radio observations.
Although, the reliability of the [O iii]–X-ray conversion could affect this comparison, the difference between AGN and XRBs is stark. In conclusion, the apparent disparity between AGN and XRB states suggests that LLAGN show different disc–jet couplings and more complicated mechanisms of radio production than the XRBs (without considering transition phases). However, a more detailed (radio/X-ray) study and comparison between LLAGN and XRBs is needed and is not the goal of this work.
Another variable which can increase the scatter of the observed radio-optical relations and complicate our comprehension of the disc–jet connection, is the core variability. Radio flickering and transient events have been documented in the nuclei of some LLAGN, particularly Seyferts (e.g. Wrobel 2000; Mundell et al. 2009; Giannios & Metzger 2011; Baldi et al. 2015a; Mattila et al. 2018; Williams et al. 2019; Nyland et al. 2020).
4.6 Black hole – host connection
The LeMMINGs survey detected nuclear radio activity from high- down to low-mass galaxies ( , Nagar et al. 2005), which harbour SMBHs with masses 106.5 M⊙. SF- and BH-driven radio emission are the two main mechanisms responsible for the Jy-level radio core emission (Padovani et al., 2015) with several pieces of evidence pointing to an increment of AGN contribution to radio emission as increases. In fact, the radio detection and jet fraction increase with BH mass for 106.5 M⊙ and the ‘bulgeness’ of the host (i.e. favouring ETGs, see Paper II).
One of the main results of our survey is the presence of a break of the empirical relations (radio, [O iii], , optical FPBHA) between the star forming and active galaxies at 106.5 M⊙ (conservatively, between 106 and 107 M⊙). A BH mass of 106.5 M⊙ seems to represent the turnover from a SF to an AGN regime as the BH mass increases. Such a break corresponds to the which roughly separates the BH mass function of local LTGs and ETGs (Davis et al., 2014; Greene et al., 2020), i.e. pseudo-bulges and bulges (Yesuf et al., 2020) and SF- and AGN-dominated sources respectively (see Kelly & Merloni 2012, Appendix A and Fig. 9). Both the fraction of galaxies which host a radio AGN and the radio core powers correlate with with different relations at the two sides of this BH mass turnover. These relationships possibly agree with galaxy evolution models which predict that high-mass galaxies evolve faster and host a radio-AGN which suppresses SF more effectively than low-mass galaxies (Fabian, 2012), which instead form stars in the current Universe (e.g. Lapi et al. 2011; Behroozi et al. 2019). However, it is important to point out that such a break could also be the consequence of an intrinsic - relation which flattens out at low BH masses (Mezcua, 2017; Shankar et al., 2019).
Substantial progress in understanding the process of radio AGN phenomena in the nearby Universe has recently been made by combining optical and radio surveys to determine the statistical relationships between radio activity and galaxy/BH mass. It has been found that the fraction of galaxies that host RL AGN (with 1021 W Hz-1) is a strong function of stellar mass and BH mass (Best et al., 2005b; Mauch & Sadler, 2007; Sabater et al., 2019; Hardcastle et al., 2019) with the most massive ETGs ‘always’ switched on at low radio powers ( W Hz-1). In our statistically-complete heterogeneous sample of local galaxies, mostly consisting of LTGs, we find a flatter dependence between the radio-AGN fraction and BH mass for the active galaxies, (), independent of the radio properties. The different slopes between our work and previous studies could be ascribed to three aspects: the higher angular resolution and higher sensitivity of our survey, crucial to identifying jets, the identification of genuine ‘jetted’ RQ AGN with respect to RL AGN, and a possible presence of a break in the radio luminosity function at 1019.5–1020 W Hz-1 (Nagar et al., 2005). This results in the inclusion of SMBHs with masses lower than those of standard RL AGN (108 M⊙), which can often emanate low-power jets on sub-kpc scale, despite their nominal radio-quietness definition, differently from the rarer powerful RGs. This selection eventually induces a much shallower dependence with BH mass. Janssen et al. (2012) also noted a shallower - relation than previous studies, scaling as , for Seyfert-like radio sources, that remains still steeper than what we found for RQ AGN. Moreover, in our survey, we do not find a clear separation (within the large scatter) between LINERs and Seyferts in the radio– plane. This likely indicates that accretion rate, which largely differs between the two classes, plays a more complicate role in the radio production, together with BH mass/spin (see Sect. 4.5).
The observed correlation between and BH mass or host type can also be an indirect consequence of a more fundamental relationship between radio luminosity and optical bulge luminosity (or mass) (Falcke et al., 2001; Ho, 2002; Nagar et al., 2002): ETGs show larger radio luminosities than LTGs (Laor, 2000; Decarli et al., 2007; Mauch & Sadler, 2007; Gallo et al., 2008). The more massive elliptical galaxies or bulge-dominated systems are more efficient at producing radio emission as they have larger SMBHs, and hence, are more likely to be highly RL than spiral galaxies for 108 M⊙ (Chiaberge & Marconi, 2011). The high bulge-to-disc ratio is achieved in more evolved galaxies, where spheroids and pseudo-bulges dominate the central gravitational well. At their centres the extended jets expelled from accreting SMBHs can more easily plough through the more rarefied ISM than in discy (spiral) galaxies. Furthermore, according to the spin and gap paradigm (e.g. Moderski et al. 1998; Garofalo et al. 2010; Meier 2012), a higher BH spin and a larger gap region between the inner edge of the accretion disc, typically achieved in ETGs, can cause a larger magnetic flux accumulation on the SMBH, and consequently a maximisation of the BF jet mechanism. Such a condition is reached with retrograde accretion. Typically in LTG, a low-spinning SMBH and prograde disc have been suggested to account for their limited jet production compared to the different RL AGN classes, found commonly in ETGs (RQ AGN against FR classes, see, e.g. Tchekhovskoy & McKinney 2012; Garofalo et al. 2014; Garofalo & Bishop 2020).
4.7 Star formation
Non-jetted Hii galaxies clearly depart from the AGN classes in the optical–radio plane and FPBHA at low and 106.5 M⊙, showing a clear break likely caused by the increased SF contributions to the pc-scale radio emission. Such a sub-sample represents a much larger population of low-luminosity star-forming galaxies, which dominate the local Universe at 106.5 M⊙ (Appendix A, Greene & Ho 2007; Greene et al. 2020), where stellar processes are generally the main source of energy.
Assuming that non-jetted Hii galaxies are powered by SF, the relation between radio luminosities in such galaxies and can be deciphered as a link between thermal/non-thermal SF luminosity and BH mass, in the form , which has the largest scatter of the observed linear regressions, due to the large uncertainties of estimates at low values and numerous radio non-detections. This unprecedented relation is likely the result of the observed link found between SF indicators such as radio, far-infrared, optical or line luminosities, and galaxy mass (e.g. Mauch & Sadler 2007; Gürkan et al. 2018). Moreover, the SF contribution in the radio band with respect to the AGN activity is expected to increase with galaxy mass (Aird et al., 2019). In fact the observed correlation suggests that the radio production due to SF broadly increases with BH mass, as the latter quantity is approximately a constant proportion of the galaxy mass (from a third down to a fifth in the lowest 105 M⊙, Häring & Rix 2004; Reines & Volonteri 2015; Martín-Navarro & Mezcua 2018), i.e. the stellar content: more stars likely produce more radio emission. This is consistent with the idea that SF, although mostly included in the disc (Bluck et al., 2020) and known to scale with galaxy mass (Speagle et al., 2014), would possibly also scale with . More precisely, the nuclear starburst is plausibly set by the available gas mass present in the NSC (, Fernández-Ontiveros et al. 2009; Neumayer et al. 2020), which scales with the galaxy dynamical mass (, Scott & Graham 2013), which in turn respond to the SMBH gravitational well (Cen, 2015; Pitchford et al., 2016). Such a sequence of links eventually enacts the radio- and radio-optical relations observed for star-forming galaxies, e.g setting the fraction of radio emission with respect to the photoionising energy from young stellar populations and SN products.
Using the [O iii] as a SF indicator (Suzuki et al., 2016), the observed optical luminosities of non-jetted Hii galaxies can be interpreted by a SFR up to 101.1±0.5 M⊙ yr-1 in a nuclear starburst. The [O iii]-radio correlation valid for non-jetted Hii galaxies also represents an empirical method to predict the nuclear radio emission in star forming galaxies based on the ubiquitous [O iii] line data. The best fit approximately agrees with the [O iii]–radio relation estimated from Herschel, LOFAR and VLA data ( = [0.830.10] + [7.92.0], Best et al. 2005a; Gürkan et al. 2015, 2018), although our observations are at a higher resolution than any previous study on large samples of star forming galaxies.
5 Reviewing the radio properties of local galaxies
5.1 The LeMMINGs view
The 1.5-GHz LeMMINGs survey has revealed pc-scale cores and jet-like structures in more than a third of local optically active and inactive Palomar galaxies (Papers I and II). Such nuclei are part of a large population of radio LLAGN and faint nuclear starbursts (1017.6 W Hz-1). This result adds observational evidence that a large fraction of LLAGN (even RQ AGN) feature low-power galactic-scale jets (Webster et al., 2021), which may have a tremendous impact on their hosts by continuously injecting energy, a fundamental ingredient for galaxy feedback (Morganti, 2017; Jarvis et al., 2019; Hardcastle & Croston, 2020; Smith et al., 2020b; Venturi et al., 2021; Jarvis et al., 2021), as supported by the state-of-the-art jet simulations (Massaglia et al., 2016; Mukherjee et al., 2018, 2020).
In this work we have investigated the nature of the pc-scale nuclear radio components of LINERs, Seyferts, ALG and Hii galaxies. The emission-line [O iii] luminosity, available for the entire sample, gives the optical nuclear counterpart of the 1.5-GHz cores we detected. The optical–radio connection and the optical FPBHA (Saikia et al., 2015) probe the different physical processes involved at the centre of galaxies. In these diagnostic diagrams we have found that optical classes follow distinct tracks: this is indicative of different physical processes responsible for the radio emission and broadly agrees with previous multi-band studies of LLAGN and star-forming galaxies (e.g. Körding et al. 2006; Vitale et al. 2015; Tadhunter 2016; Mancuso et al. 2017; Smith et al. 2020a). Nonetheless, we have set more robust constraints on these trends with respect to previous studies and Paper I, especially in the thus far poorly explored regime of low luminosities and BH masses, by leveraging the unprecedented completeness and depth of the LeMMINGs survey.
.
LINERs are divided into two classes: RQ and RL. The RL LINERs (19 per cent of LINERs) appear to represent the scaled-down version of FR Is at lower radio and [O iii] luminosities and BH masses down to 107.5 M⊙. Our results indicate that the class of RL LINERs belong to a large homogeneous population of RL LLAGN ( 1042 erg s-1), characterized by a broad and continuous distribution of parameters of relativistic jets (e.g. sizes, luminosities, ), powered by a sub-Eddington, RIAF-like disc, and hosted in ETGs (Heckman & Best, 2014). This picture, in turn, suggests that a common jet-launching mechanism operates in all RL LINERs which smoothly connects low-power (sub)kpc-scale jetted LINERs to more powerful compact RGs (named FR 0s, Baldi et al. 2015b) and full-fledged FR Is and FR IIs (Kharb et al., 2014; Mingo et al., 2019; Grandi et al., 2021). Conversely, RQ LINERs consist of a more heterogeneous population of LLAGN, which can reside in either LTGs or ETGs. An intermediate disc between low- ADAF and high- SAD may be consistent with the observed characteristics of RQ LINERs, where radio emission is due to a low-power non-relativistic uncollimated jet (Gallimore et al., 2006).
Seyfert nuclei radiate at a larger fraction of Eddington luminosity than LINERs. The common picture is that Seyferts are powered by a radiatively efficient SAD with higher accretion rates (Eddington ratios 10-3) than seen in LINERs. Nevertheless, Seyferts are not radio-silent at all, and can show compact or edge-brightened jetted morphologies. In order to reconcile their radio and optical properties, different disc–jet models, intermediate between jetted LINERs and the ‘radio-silent’ near-Eddington QSOs (Balick & Heckman, 1982; Liu et al., 2020) have been proposed. Low- Seyferts are possibly the scaled-down version of the so-called red QSOs, which have intermediate radio loudness and have been found to have a higher incidence of compact and extended radio morphologies than blue QSOs (e.g. Klindt et al. 2019; Rosario et al. 2020), which instead are more similar to high- Seyferts. We conclude that the change of disc–jet coupling from low-power Seyferts to powerful QSOs and the predominance of a specific radio-emitting physical process may depend on different factors (Garofalo & Bishop, 2020): the jet efficiency with respect to the disc- or corona-wind radio production decreases with Eddington ratio and increases with BH mass, ‘bulgeness’ of the host (favouring ETGs), and SMBH/disc spin.
Apart from a few irregular galaxies, the vast majority of ALGs are hosted by massive ETGs with 107 M⊙, which lack of significant optical emission from the nucleus. They have been interpreted as part of a large population of evolved massive galaxies (Salucci et al., 1999), which occasionally or recurrently go through periods of LINER-like low- activity, during which they launch pc-scale jets. However, during this low-activity phenomenon, the optical line nucleus remains quiescent due to the combination of a low ionising radiation field produced by the disc (and jet) and the rarefaction of cold gas to photoionise (Capetti et al., 2005).
A dual population of Hii galaxies has been found in our sample. On one hand, the majority of the Hii galaxies are hosted in LTGs with 106.5 M⊙ and their optical–radio properties reconcile with a SF origin. A SF rate of 10 M⊙ yr-1 in the central region can account for their compact cores, with SN-driven winds (Heckman et al., 2015) or extended Hii regions possibly causing their complex radio structures. On the other hand, 5 per cent of Hii galaxies exhibit jet-like radio structures. These sources follow the diagnostic optical–radio sequence of AGN-classed sources with 106.5 M⊙. The co-existence of a LINER-like sub-Eddington accreting SMBH and a nuclear starburst, which are responsible for the radio/jet and the optical properties, respectively, is the simplest way to solve their puzzling nature (Padovani, 2016).
5.2 Conclusions
The LeMMINGs survey characterises radio activity (either from SF or AGN) from a complete sample of local galaxies, by reaching a 100 per cent detection rate for galaxies with 107 M⊙ down to luminosities 1019.8 W Hz-1. This limit represents the lowest luminosity for which galaxies appear to host a radio-active SMBH in the local Universe. The fraction of radio-active galaxies scales as , a relation that is flatter than what has been found in previous radio surveys (e.g. Best et al. 2005b), probably because of higher angular resolution and the inclusion of RQ AGN.
One of the main results of our survey is the presence of a break at M⊙ moving from the SF to AGN regime with increasing BH mass. Such a value roughly separates the star-forming galaxy and (LL)AGN populations in the local Universe. At larger BH masses, mostly in ETGs, a link between SMBH activity and jet production is well established (e.g Cen 2012; Heckman & Best 2014). In contrast, in less-massive (late-type) galaxies, SF makes a proportionally larger contribution to radio luminosity causing a flattening of the relations valid for AGN at lower .
For galaxies with small BH masses, 106.5 M⊙, thermal/non-thermal emission from stellar processes in star forming galaxies is the most plausible scenario of the origin of their radio emission. An unprecedented empirical relation between their nuclear radio emission and BH masses, , has been inferred in our sample (although with large scatter). This relation between the nuclear SF and the SMBH was found as a result of the e-MERLIN array, able to resolve out smooth, extended emission, and reveal the radio emission at the nuclear scale, where the central starburst is more likely to respond to the influence of the central SMBH.
The steepening of the empirical correlations found for galaxies with BH masses 106.5 M⊙ ( and radio-AGN fraction ) with respect to those at lower BH masses (valid for star-forming galaxies) strongly invoke an active SMBH as the main driver of their radio emission. The link between radio activity, SMBH properties, and local conditions (e.g. host type, gas availability) appears more complicated than the standard BH–disc bimodality deduced from galaxy–SMBH models (Heckman & Best, 2014), or direct analogies with XRBs states (Remillard & McClintock, 2006; Fender et al., 2009): low-/jet vs high-/no-jet. As a first approximation, the Eddington-scaled accretion rates () of the sample correspond to two extreme radio and host categories. The most massive and bulged galaxies, which are the radio loudest with the (optically) faintest nuclei (LINERs, ALGs, and jetted Hii galaxies), are powered by sub-Eddington () RIAF-like discs and launch the most core-brightened jets. In contrast, LTGs can host high- () standard disc and occasionally support sub-relativistic edge-brightened jets. As a second-order approximation, a closer inspection of the data reveal that optical classifications do not simply map the accretion states and this can further complicate the comparison with XRBs. Therefore, to break the degeneracy between radio-loudness, accretion modes and host types, distinct disc–jet couplings (accretion/ejection states) that are observed among the various optical–radio classes (RL/RQ, LINER/Seyfert, SF/AGN-dominated) are required. The connection between disc and jet is probably determined by a combination of several factors (some not directly observable at present), including BH spin, magnetic field strength, accretion rotation, gas supply, small and large-scale environment, and host location within the environment (e.g. distance from cluster centre). These parameters play a significant role in setting the generic disc configuration (e.g. accretion mode, rate and radiative efficiency) and the radio production mechanism (e.g. jet, outflow, wind) for each optical/radio class. Variation of these factors could favour the increase of the jet production efficiency and/or jet bulk speed (Lagos et al., 2009). This picture would account for the continuous, rather than dichotomous, radio properties observed in LLAGN which are characterised by a broad distribution of sizes and luminosities of their extended radio emission, from weak RQ LINER (even ALG) to RGs and from jetted low-power Seyferts to extremely-RQ high- QSOs (Brown et al., 2011; Kharb et al., 2014; Garofalo et al., 2014; Baldi et al., 2019a; Garofalo & Singh, 2019). A time-dependent evolution among different radio/optical states would add a further level of complexity to this picture, probably in analogy to XRB intermediate states (Fernández-Ontiveros & Muñoz-Darias, 2021). An exhaustive comparison between LLAGN and XRBs will be addressed in a future work by using X-day data.
A complete census of the local SMBH population, offered by the forthcoming deep follow-up 5-GHz e-MERLIN observations along with complete Chandra X-ray and HST optical data, pushing to the rather unexplored regime of very low luminosities, 1016 W Hz-1 (comparable to Sgr A*), will allow an unbiased view of the multi-band SMBH activity of the local Universe and provide even more robust constraints on disc–jet coupling in LLAGN.
Acknowledgements
We thank the referee for her/his comments, which helped to improve the paper. This research was supported by a Newton Fund project, DARA (Development in Africa with Radio Astronomy), and awarded by the UK’s Science and Technology Facilities Council (STFC) - grant reference ST/R001103/1. This research was supported by European Commission Horizon 2020 Research and Innovation Programme under grant agreement No. 730884 (JUMPING JIVE). FS acknowledges support from a Leverhulme Trust Research Fellowship. J.H.K. acknowledges support from the European Union’s Horizon 2020 research and innovation programme under Marie Skłodowska-Curie grant agreement No 721463 to the SUNDIAL ITN network, from the State Research Agency (AEI) of the Spanish Ministry of Science and Innovation and the European Regional Development Fund (FEDER) under the grant with reference PID2019-105602GB-I00, and from IAC project P/300724, financed by the Ministry of Science and Innovation, through the State Budget and by the Canary Islands Department of Economy, Knowledge and Employment, through the Regional Budget of the Autonomous Community. IMV thanks the Generalitat Valenciana (funding from the GenT Project CIDEGENT/2018/021) and the MICINN (funding from the Research Project PID2019-108995GB-C22). AA and MAPT acknowledge support from the Spanish MCIU through grant PGC2018-098915-B-C21 and from the State Agency for Research of the Spanish MCIU through the “Center of Excellence Severo Ochoa” award for the Instituto de Astrofìsica de Andalucìa (SEV-2017-0709). B.T.D. acknowledges financial support from grant “Ayudas para la realización de proyectos de I+D para jóvenes doctores 2019.” funded by Comunidad de Madrid and Universidad Complutense de Madrid under grant No. PR65/19-22417.’
DATA AVAILABILITY
The data on which this paper is based are publicly available from the e-MERLIN archive. Calibrated image products are available upon reasonable request to the corresponding author. These, along with other LeMMINGs advanced survey products, will be publicly hosted on upcoming project web-page which is being developed (http://lemmingslegacy.pbworks.com).
References
- Abazajian et al. (2009) Abazajian K. N., et al., 2009, ApJS, 182, 543
- Aird et al. (2019) Aird J., Coil A. L., Georgakakis A., 2019, MNRAS, 484, 4360
- Akritas (1989) Akritas M., 1989, Aligned Rank Tests for Regression With Censored Data. Penn State Dept. of Statistics Technical Report, 1989
- Akritas & Siebert (1996) Akritas M. G., Siebert J., 1996, MNRAS, 278, 919
- Alexander et al. (2003) Alexander D. M., et al., 2003, AJ, 126, 539
- Allen et al. (2006) Allen S. W., Dunn R. J. H., Fabian A. C., Taylor G. B., Reynolds C. S., 2006, MNRAS, 372, 21
- Allen et al. (2008) Allen M. G., Groves B. A., Dopita M. A., Sutherland R. S., Kewley L. J., 2008, ApJS, 178, 20
- Aller & Richstone (2002) Aller M. C., Richstone D., 2002, AJ, 124, 3035
- Baldi & Capetti (2010) Baldi R. D., Capetti A., 2010, A&A, 519, A48
- Baldi et al. (2015a) Baldi R. D., Behar E., Laor A., Horesh A., 2015a, MNRAS, 454, 4277
- Baldi et al. (2015b) Baldi R. D., Capetti A., Giovannini G., 2015b, A&A, 576, A38
- Baldi et al. (2018) Baldi R. D., et al., 2018, MNRAS, 476, 3478
- Baldi et al. (2019a) Baldi R. D., Torresi E., Migliori G., Balmaverde B., 2019a, Galaxies, 7, 76
- Baldi et al. (2019b) Baldi R. D., Rodríguez Zaurín J., Chiaberge M., Capetti A., Sparks W. B., McHardy I. M., 2019b, ApJ, 870, 53
- Baldi et al. (2021) Baldi R. D., et al., 2021, MNRAS, 500, 4749
- Baldwin et al. (1981) Baldwin J. A., Phillips M. M., Terlevich R., 1981, PASP, 93, 5
- Balick & Heckman (1982) Balick B., Heckman T. M., 1982, ARA&A, 20, 431
- Balmaverde & Capetti (2006) Balmaverde B., Capetti A., 2006, A&A, 447, 97
- Balmaverde et al. (2006) Balmaverde B., Capetti A., Grandi P., 2006, A&A, 451, 35
- Balmaverde et al. (2008) Balmaverde B., Baldi R. D., Capetti A., 2008, A&A, 486, 119
- Barausse et al. (2017) Barausse E., Shankar F., Bernardi M., Dubois Y., Sheth R. K., 2017, MNRAS, 468, 4782
- Begelman (2012) Begelman M. C., 2012, MNRAS, 420, 2912
- Behar et al. (2020) Behar E., et al., 2020, MNRAS, 491, 3523
- Behroozi et al. (2019) Behroozi P., Wechsler R. H., Hearin A. P., Conroy C., 2019, MNRAS, 488, 3143
- Bell et al. (2011) Bell M. E., et al., 2011, MNRAS, 411, 402
- Bennett (1962) Bennett A. S., 1962, Mem. RAS, 68, 163
- Bernardi et al. (2003) Bernardi M., et al., 2003, AJ, 125, 1849
- Best & Heckman (2012) Best P. N., Heckman T. M., 2012, MNRAS, 421, 1569
- Best et al. (2005a) Best P. N., Kauffmann G., Heckman T. M., Ivezić Ž., 2005a, MNRAS, 362, 9
- Best et al. (2005b) Best P. N., Kauffmann G., Heckman T. M., Brinchmann J., Charlot S., Ivezić Ž., White S. D. M., 2005b, MNRAS, 362, 25
- Beswick et al. (2014) Beswick R., Argo M. K., Evans R., McHardy I., Williams D. R. A., Westcott J., 2014, in Proceedings of the 12th European VLBI Network Symposium and Users Meeting (EVN 2014). 7-10 October 2014. Cagliari, Italy. p. 10
- Binette et al. (1994) Binette L., Magris C. G., Stasińska G., Bruzual A. G., 1994, A&A, 292, 13
- Bisogni et al. (2017) Bisogni S., Marconi A., Risaliti G., 2017, MNRAS, 464, 385
- Blandford & Znajek (1977) Blandford R. D., Znajek R. L., 1977, MNRAS, 179, 433
- Blandford et al. (2019) Blandford R., Meier D., Readhead A., 2019, ARA&A, 57, 467
- Bluck et al. (2020) Bluck A. F. L., et al., 2020, MNRAS, 499, 230
- Bonchi et al. (2013) Bonchi A., La Franca F., Melini G., Bongiorno A., Fiore F., 2013, MNRAS, 429, 1970
- Bonzini et al. (2013) Bonzini M., Padovani P., Mainieri V., Kellermann K. I., Miller N., Rosati P., Tozzi P., Vattakunnel S., 2013, MNRAS, 436, 3759
- Brinchmann et al. (2004) Brinchmann J., Charlot S., White S. D. M., Tremonti C., Kauffmann G., Heckman T., Brinkmann J., 2004, MNRAS, 351, 1151
- Brown et al. (2011) Brown M. J. I., Jannuzi B. T., Floyd D. J. E., Mould J. R., 2011, ApJ, 731, L41
- Bundy et al. (2015) Bundy K., et al., 2015, ApJ, 798, 7
- Buttiglione et al. (2009) Buttiglione S., Capetti A., Celotti A., Axon D. J., Chiaberge M., Macchetto F. D., Sparks W. B., 2009, A&A, 495, 1033
- Buttiglione et al. (2010) Buttiglione S., Capetti A., Celotti A., Axon D. J., Chiaberge M., Macchetto F. D., Sparks W. B., 2010, A&A, 509, A6
- Cao (2007) Cao X., 2007, ApJ, 659, 950
- Capetti (2011) Capetti A., 2011, A&A, 535, A28
- Capetti & Baldi (2011) Capetti A., Baldi R. D., 2011, A&A, 529, A126
- Capetti & Balmaverde (2006) Capetti A., Balmaverde B., 2006, A&A, 453, 27
- Capetti & Balmaverde (2007) Capetti A., Balmaverde B., 2007, A&A, 469, 75
- Capetti et al. (2005) Capetti A., Verdoes Kleijn G. A., Chiaberge M., 2005, A&A, 439, 935
- Capetti et al. (2013) Capetti A., Robinson A., Baldi R. D., Buttiglione S., Axon D. J., Celotti A., Chiaberge M., 2013, A&A, 551, A55
- Capetti et al. (2017) Capetti A., Massaro F., Baldi R. D., 2017, A&A, 598, A49
- Cappi et al. (2006) Cappi M., et al., 2006, A&A, 446, 459
- Cattaneo & Best (2009) Cattaneo A., Best P. N., 2009, MNRAS, 395, 518
- Cen (2012) Cen R., 2012, ApJ, 755, 28
- Cen (2015) Cen R., 2015, ApJ, 805, L9
- Chang et al. (2021) Chang N., Xie F. G., Liu X., Ho L. C., Dong A. J., Han Z. H., Wang X., 2021, MNRAS, 503, 1987
- Chen et al. (1989) Chen K., Halpern J. P., Filippenko A. V., 1989, ApJ, 339, 742
- Chen et al. (2021) Chen Y., et al., 2021, ApJ, 913, 93
- Chiaberge & Marconi (2011) Chiaberge M., Marconi A., 2011, MNRAS, 416, 917
- Chiaberge et al. (1999) Chiaberge M., Capetti A., Celotti A., 1999, A&A, 349, 77
- Chiaberge et al. (2005) Chiaberge M., Capetti A., Macchetto F. D., 2005, ApJ, 625, 716
- Cirasuolo et al. (2003) Cirasuolo M., Magliocchetti M., Celotti A., Danese L., 2003, MNRAS, 341, 993
- Condon (1992) Condon J. J., 1992, ARA&A, 30, 575
- Coriat et al. (2011) Coriat M., et al., 2011, MNRAS, 414, 677
- Czerny et al. (2009) Czerny B., Siemiginowska A., Janiuk A., Nikiel-Wroczyński B., Stawarz Ł., 2009, ApJ, 698, 840
- Davis & Tchekhovskoy (2020) Davis S. W., Tchekhovskoy A., 2020, ARA&A, 58, 407
- Davis et al. (2014) Davis B. L., et al., 2014, ApJ, 789, 124
- Decarli et al. (2007) Decarli R., Gavazzi G., Arosio I., Cortese L., Boselli A., Bonfanti C., Colpi M., 2007, MNRAS, 381, 136
- Dickson et al. (1995) Dickson R., Tadhunter C., Shaw M., Clark N., Morganti R., 1995, MNRAS, 273, L29
- Donea & Biermann (2002) Donea A.-C., Biermann P. L., 2002, Publ. Astron. Soc. Australia, 19, 125
- Dopita et al. (1997) Dopita M. A., Koratkar A. P., Allen M. G., Tsvetanov Z. I., Ford H. C., Bicknell G. V., Sutherland R. S., 1997, ApJ, 490, 202
- Drappeau et al. (2017) Drappeau S., et al., 2017, MNRAS, 466, 4272
- Dugan et al. (2014) Dugan Z., Bryan S., Gaibler V., Silk J., Haas M., 2014, ApJ, 796, 113
- Dullo et al. (2020) Dullo B. T., Bouquin A. Y. K., Gil de Paz A., Knapen J. H., Gorgas J., 2020, ApJ, 898, 83
- Dunn & Fabian (2006) Dunn R. J. H., Fabian A. C., 2006, MNRAS, 373, 959
- Esin et al. (1997) Esin A. A., McClintock J. E., Narayan R., 1997, ApJ, 489, 865
- Esparza-Arredondo et al. (2020) Esparza-Arredondo D., Osorio-Clavijo N., González-Martín O., Victoria-Ceballos C., Haro-Corzo S. A. R., Reyes-Amador O. U., López-Sánchez J., Pasetto A., 2020, ApJ, 905, 29
- Fabian (2012) Fabian A. C., 2012, ARA&A, 50, 455
- Fabian & Canizares (1988) Fabian A. C., Canizares C. R., 1988, Nature, 333, 829
- Falcke et al. (2000) Falcke H., Nagar N. M., Wilson A. S., Ulvestad J. S., 2000, ApJ, 542, 197
- Falcke et al. (2001) Falcke H., Nagar N. M., Wilson A. S., Ho L. C., Ulvestad J. S., 2001, in Kaper L., Heuvel E. P. J. V. D., Woudt P. A., eds, Black Holes in Binaries and Galactic Nuclei. Springer-Verlag, p. 218, doi:10.1007/10720995_45
- Falcke et al. (2004) Falcke H., Körding E., Markoff S., 2004, A&A, 414, 895
- Fanaroff & Riley (1974) Fanaroff B. L., Riley J. M., 1974, MNRAS, 167, 31P
- Fanti et al. (1987) Fanti C., Fanti R., de Ruiter H. R., Parma P., 1987, A&AS, 69, 57
- Faucher-Giguère & Quataert (2012) Faucher-Giguère C.-A., Quataert E., 2012, MNRAS, 425, 605
- Feigelson & Nelson (1985) Feigelson E. D., Nelson P. I., 1985, ApJ, 293, 192
- Fender (2001) Fender R. P., 2001, MNRAS, 322, 31
- Fender et al. (2003) Fender R. P., Gallo E., Jonker P. G., 2003, MNRAS, 343, L99
- Fender et al. (2004) Fender R. P., Belloni T. M., Gallo E., 2004, MNRAS, 355, 1105
- Fender et al. (2009) Fender R. P., Homan J., Belloni T. M., 2009, MNRAS, 396, 1370
- Fernández-Ontiveros & Muñoz-Darias (2021) Fernández-Ontiveros J. A., Muñoz-Darias T., 2021, MNRAS, 504, 5726
- Fernández-Ontiveros et al. (2009) Fernández-Ontiveros J. A., Prieto M. A., Acosta-Pulido J. A., 2009, MNRAS, 392, L16
- Ferreira (1997) Ferreira J., 1997, A&A, 319, 340
- Ferreira et al. (2010) Ferreira J., Petrucci P. O., Murphy G., Zanni C., Henri G., 2010, Jet Emitting Discs: a New Accretion Flow Solution. p. 49
- Filho et al. (2006) Filho M. E., Barthel P. D., Ho L. C., 2006, A&A, 451, 71
- Fischer et al. (2021) Fischer T. C., et al., 2021, ApJ, 906, 88
- Flohic et al. (2006) Flohic H. M. L. G., Eracleous M., Chartas G., Shields J. C., Moran E. C., 2006, ApJ, 647, 140
- Forman et al. (1985) Forman W., Jones C., Tucker W., 1985, ApJ, 293, 102
- Gaibler et al. (2012) Gaibler V., Khochfar S., Krause M., Silk J., 2012, MNRAS, 425, 438
- Gallimore et al. (2006) Gallimore J. F., Axon D. J., O’Dea C. P., Baum S. A., Pedlar A., 2006, AJ, 132, 546
- Gallo & Sesana (2019) Gallo E., Sesana A., 2019, ApJ, 883, L18
- Gallo et al. (2008) Gallo E., Treu T., Jacob J., Woo J.-H., Marshall P. J., Antonucci R., 2008, ApJ, 680, 154
- Garofalo & Bishop (2020) Garofalo D., Bishop K., 2020, PASP, 132, 114103
- Garofalo & Singh (2019) Garofalo D., Singh C. B., 2019, ApJ, 871, 259
- Garofalo et al. (2010) Garofalo D., Evans D. A., Sambruna R. M., 2010, MNRAS, 406, 975
- Garofalo et al. (2014) Garofalo D., Kim M. I., Christian D. J., 2014, MNRAS, 442, 3097
- Gebhardt et al. (2000) Gebhardt K., et al., 2000, ApJL, 539, L13
- Giannios & Metzger (2011) Giannios D., Metzger B. D., 2011, MNRAS, 416, 2102
- Giovannini (2003) Giovannini G., 2003, New Astron. Rev., 47, 551
- Giovannini (2004) Giovannini G., 2004, Ap&SS, 293, 1
- Giovannini et al. (2005) Giovannini G., Taylor G. B., Feretti L., Cotton W. D., Lara L., Venturi T., 2005, ApJ, 618, 635
- Giroletti & Panessa (2009) Giroletti M., Panessa F., 2009, ApJ, 706, L260
- González-Martín et al. (2006) González-Martín O., Masegosa J., Márquez I., Guerrero M. A., Dultzin-Hacyan D., 2006, A&A, 460, 45
- Grandi et al. (2021) Grandi P., Torresi E., Macconi D., Boccardi B., Capetti A., 2021, ApJ, 911, 17
- Greene (2012) Greene J. E., 2012, Nature Communications, 3, 1304
- Greene & Ho (2007) Greene J. E., Ho L. C., 2007, ApJ, 667, 131
- Greene et al. (2020) Greene J. E., Strader J., Ho L. C., 2020, ARA&A, 58, 257
- Gültekin et al. (2019) Gültekin K., King A. L., Cackett E. M., Nyland K., Miller J. M., Di Matteo T., Markoff S., Rupen M. P., 2019, ApJ, 871, 80
- Gürkan et al. (2015) Gürkan G., et al., 2015, MNRAS, 452, 3776
- Gürkan et al. (2018) Gürkan G., et al., 2018, MNRAS, 475, 3010
- Hardcastle (2018) Hardcastle M., 2018, Nature Astronomy, 2, 273
- Hardcastle & Croston (2020) Hardcastle M., Croston J., 2020, New Astronomy Reviews, 88, 101539
- Hardcastle et al. (2019) Hardcastle M. J., et al., 2019, A&A, 622, A12
- Häring & Rix (2004) Häring N., Rix H.-W., 2004, ApJ, 604, L89
- Heckman (1980) Heckman T. M., 1980, A&A, 500, 187
- Heckman & Best (2014) Heckman T. M., Best P. N., 2014, ARA&A, 52, 589
- Heckman et al. (1993) Heckman T. M., Lehnert M. D., Armus L., 1993, in Shull J. M., Thronson H. A., eds, Astrophysics and Space Science Library Vol. 188, The Environment and Evolution of Galaxies. p. 455, doi:10.1007/978-94-011-1882-8_25
- Heckman et al. (2004) Heckman T. M., Kauffmann G., Brinchmann J., Charlot S., Tremonti C., White S. D. M., 2004, ApJ, 613, 109
- Heckman et al. (2015) Heckman T. M., Alexandroff R. M., Borthakur S., Overzier R., Leitherer C., 2015, ApJ, 809, 147
- Heinz & Sunyaev (2003) Heinz S., Sunyaev R. A., 2003, MNRAS, 343, L59
- Heinz et al. (2007) Heinz S., Merloni A., Schwab J., 2007, ApJ, 658, L9
- Herpich et al. (2018) Herpich F., Stasińska G., Mateus A., Vale Asari N., Cid Fernandes R., 2018, MNRAS, 481, 1774
- Heywood et al. (2019) Heywood I., et al., 2019, Nature, 573, 235
- Ho (1999) Ho L. C., 1999, ApJ, 516, 672
- Ho (2002) Ho L. C., 2002, ApJ, 564, 120
- Ho (2008) Ho L. C., 2008, ARA&A, 46, 475
- Ho & Ulvestad (2001) Ho L. C., Ulvestad J. S., 2001, ApJS, 133, 77
- Ho et al. (1995) Ho L. C., Filippenko A. V., Sargent W. L., 1995, ApJS, 98, 477
- Ho et al. (1997a) Ho L. C., Filippenko A. V., Sargent W. L. W., 1997a, ApJS, 112, 315
- Ho et al. (1997b) Ho L. C., Filippenko A. V., Sargent W. L. W., 1997b, ApJ, 487, 568
- Ho et al. (2009) Ho L. C., Greene J. E., Filippenko A. V., Sargent W. L. W., 2009, ApJS, 183, 1
- Huchra & Burg (1992) Huchra J., Burg R., 1992, ApJ, 393, 90
- Inayoshi et al. (2020) Inayoshi K., Ichikawa K., Ho L. C., 2020, ApJ, 894, 141
- Ishibashi et al. (2014) Ishibashi W., Auger M. W., Zhang D., Fabian A. C., 2014, MNRAS, 443, 1339
- Janssen et al. (2012) Janssen R. M. J., Röttgering H. J. A., Best P. N., Brinchmann J., 2012, A&A, 541, A62
- Jarvis et al. (2019) Jarvis M. E., et al., 2019, MNRAS, 485, 2710
- Jarvis et al. (2021) Jarvis M. E., et al., 2021, MNRAS, 503, 1780
- Jiang et al. (2007) Jiang L., Fan X., Ivezić Ž., Richards G. T., Schneider D. P., Strauss M. A., Kelly B. C., 2007, ApJ, 656, 680
- Kauffmann et al. (2003) Kauffmann G., et al., 2003, MNRAS, 346, 1055
- Kauffmann et al. (2008) Kauffmann G., Heckman T. M., Best P. N., 2008, MNRAS, 384, 953
- Kellermann et al. (1989) Kellermann K. I., Sramek R., Schmidt M., Shaffer D. B., Green R., 1989, AJ, 98, 1195
- Kelly & Merloni (2012) Kelly B. C., Merloni A., 2012, Advances in Astronomy, 2012, 970858
- Kendall (1938) Kendall M., 1938, Biometrika, 30, 81
- Kennicutt (1998) Kennicutt Jr. R. C., 1998, ARA&A, 36, 189
- Kewley et al. (2006) Kewley L. J., Groves B., Kauffmann G., Heckman T., 2006, MNRAS, 372, 961
- Kewley et al. (2019) Kewley L. J., Nicholls D. C., Sutherland R. S., 2019, ARA&A, 57, 511
- Kharb et al. (2006) Kharb P., O’Dea C. P., Baum S. A., Colbert E. J. M., Xu C., 2006, ApJ, 652, 177
- Kharb et al. (2012) Kharb P., et al., 2012, AJ, 143, 78
- Kharb et al. (2014) Kharb P., O’Dea C. P., Baum S. A., Hardcastle M. J., Dicken D., Croston J. H., Mingo B., Noel-Storr J., 2014, MNRAS, 440, 2976
- Kharb et al. (2017) Kharb P., Subramanian S., Vaddi S., Das M., Paragi Z., 2017, ApJ, 846, 12
- King et al. (2011) King A. L., et al., 2011, ApJ, 729, 19
- Klindt et al. (2019) Klindt L., Alexander D. M., Rosario D. J., Lusso E., Fotopoulou S., 2019, MNRAS, 488, 3109
- Körding et al. (2006) Körding E. G., Fender R. P., Migliari S., 2006, MNRAS, 369, 1451
- Körding et al. (2008) Körding E. G., Jester S., Fender R., 2008, MNRAS, 383, 277
- Kormendy & Ho (2001) Kormendy J., Ho L., 2001, Supermassive Black Holes in Inactive Galaxies, doi:10.1888/0333750888/2635.
- Kozieł-Wierzbowska et al. (2017) Kozieł-Wierzbowska D., Stasińska G., Vale Asari N., Sikora M., Goettems E., Wójtowicz A., 2017, Frontiers in Astronomy and Space Sciences, 4, 39
- Kukula et al. (1993) Kukula M. J., Ghosh T., Pedlar A., Schilizzi R. T., Miley G. K., de Bruyn A. G., Saikia D. J., 1993, MNRAS, 264, 893
- Kukula et al. (1995) Kukula M. J., Pedlar A., Baum S. A., O’Dea C. P., 1995, MNRAS, 276, 1262
- Kukula et al. (1999) Kukula M. J., Ghosh T., Pedlar A., Schilizzi R. T., 1999, ApJ, 518, 117
- Lagos et al. (2009) Lagos C. D. P., Padilla N. D., Cora S. A., 2009, MNRAS, 395, 625
- Lamastra et al. (2009) Lamastra A., Bianchi S., Matt G., Perola G. C., Barcons X., Carrera F. J., 2009, A&A, 504, 73
- Laor (2000) Laor A., 2000, ApJ, 543, L111
- Laor & Behar (2008) Laor A., Behar E., 2008, MNRAS, 390, 847
- Laor et al. (2019) Laor A., Baldi R. D., Behar E., 2019, MNRAS, 482, 5513
- Lapi et al. (2011) Lapi A., et al., 2011, ApJ, 742, 24
- Lavalley et al. (1992) Lavalley M., Isobe T., Feigelson E., 1992, ASURV: Astronomy Survival Analysis Package. Astronomical Society of the Pacific Conference Series, p. 245
- Liu et al. (2020) Liu X., Chang N., Han Z., Wang X., 2020, Universe, 6, 68
- Maccarone (2003) Maccarone T. J., 2003, A&A, 409, 697
- Macfarlane et al. (2021) Macfarlane C., et al., 2021, MNRAS, 506, 5888
- Magorrian et al. (1998) Magorrian J., et al., 1998, AJ, 115, 2285
- Mancuso et al. (2017) Mancuso C., et al., 2017, ApJ, 842, 95
- Maoz (2007) Maoz D., 2007, MNRAS, 377, 1696
- Marconi et al. (2004) Marconi A., Risaliti G., Gilli R., Hunt L. K., Maiolino R., Salvati M., 2004, MNRAS, 351, 169
- Markoff et al. (2003) Markoff S., Nowak M., Corbel S., Fender R., Falcke H., 2003, New Astron. Rev., 47, 491
- Markoff et al. (2005) Markoff S., Nowak M. A., Wilms J., 2005, ApJ, 635, 1203
- Markowitz et al. (2003) Markowitz A., et al., 2003, ApJ, 593, 96
- Martín-Navarro & Mezcua (2018) Martín-Navarro I., Mezcua M., 2018, ApJ, 855, L20
- Mascoop et al. (2021) Mascoop J. L., Anderson L. D., Wenger T. V., Makai Z., Armentrout W. P., Balser D. S., Bania T. M., 2021, ApJ, 910, 159
- Massaglia et al. (2016) Massaglia S., Bodo G., Rossi P., Capetti S., Mignone A., 2016, A&A, 596, A12
- Mattila et al. (2018) Mattila S., et al., 2018, Science, 361, 482
- Mauch & Sadler (2007) Mauch T., Sadler E. M., 2007, MNRAS, 375, 931
- McKinney et al. (2012) McKinney J. C., Tchekhovskoy A., Blandford R. D., 2012, MNRAS, 423, 3083
- Meert et al. (2015) Meert A., Vikram V., Bernardi M., 2015, MNRAS, 446, 3943
- Meier (2001) Meier D. L., 2001, ApJ, 548, L9
- Meier (2012) Meier D. L., 2012, Black Hole Astrophysics: The Engine Paradigm. Springer-Verlag Berlin Heidelberg
- Mendel et al. (2014) Mendel J. T., Simard L., Palmer M., Ellison S. L., Patton D. R., 2014, ApJS, 210, 3
- Merloni & Heinz (2007) Merloni A., Heinz S., 2007, MNRAS, 381, 589
- Merloni et al. (2003) Merloni A., Heinz S., di Matteo T., 2003, MNRAS, 345, 1057
- Mezcua (2017) Mezcua M., 2017, International Journal of Modern Physics D, 26, 1730021
- Mezcua & Prieto (2014) Mezcua M., Prieto M. A., 2014, ApJ, 787, 62
- Middelberg et al. (2004) Middelberg E., et al., 2004, A&A, 417, 925
- Mingo et al. (2019) Mingo B., et al., 2019, MNRAS, 488, 2701
- Moderski et al. (1998) Moderski R., Sikora M., Lasota J. P., 1998, MNRAS, 301, 142
- Morganti (2017) Morganti R., 2017, Frontiers in Astronomy and Space Sciences, 4, 42
- Morganti et al. (1987) Morganti R., Fanti C., Fanti R., Parma P., de Ruiter H. R., 1987, A&A, 183, 203
- Morganti et al. (1999) Morganti R., Tsvetanov Z. I., Gallimore J., Allen M. G., 1999, A&AS, 137, 457
- Moustakas et al. (2006) Moustakas J., Kennicutt R. C. J., Tremonti C. A., 2006, ApJ, 642, 775
- Mukherjee et al. (2018) Mukherjee D., Bicknell G. V., Wagner A. Y., Sutherland R. S., Silk J., 2018, MNRAS, 479, 5544
- Mukherjee et al. (2020) Mukherjee D., Bodo G., Mignone A., Rossi P., Vaidya B., 2020, MNRAS, 499, 681
- Mundell et al. (2000) Mundell C. G., Wilson A. S., Ulvestad J. S., Roy A. L., 2000, ApJ, 529, 816
- Mundell et al. (2009) Mundell C. G., Ferruit P., Nagar N., Wilson A. S., 2009, ApJ, 703, 802
- Muxlow et al. (2020) Muxlow T. W. B., et al., 2020, MNRAS, 495, 1188
- Nagar et al. (2000) Nagar N. M., Falcke H., Wilson A. S., Ho L. C., 2000, ApJ, 542, 186
- Nagar et al. (2002) Nagar N. M., Falcke H., Wilson A. S., Ulvestad J. S., 2002, A&A, 392, 53
- Nagar et al. (2005) Nagar N. M., Falcke H., Wilson A. S., 2005, A&A, 435, 521
- Narayan (2005) Narayan R., 2005, Ap&SS, 300, 177
- Narayan & McClintock (2008) Narayan R., McClintock J. E., 2008, New Astron. Rev., 51, 733
- Narayan & Yi (1994) Narayan R., Yi I., 1994, ApJ, 428, L13
- Narayan & Yi (1995) Narayan R., Yi I., 1995, ApJ, 444, 231
- Nelson (2000) Nelson C. H., 2000, ApJ, 544, L91
- Nemmen et al. (2007) Nemmen R. S., Bower R. G., Babul A., Storchi-Bergmann T., 2007, MNRAS, 377, 1652
- Nemmen et al. (2014) Nemmen R. S., Storchi-Bergmann T., Eracleous M., 2014, MNRAS, 438, 2804
- Netzer (2009) Netzer H., 2009, MNRAS, 399, 1907
- Neumayer et al. (2020) Neumayer N., Seth A., Böker T., 2020, A&ARv, 28, 4
- Nyland et al. (2020) Nyland K., et al., 2020, ApJ, 905, 74
- Padovani (2016) Padovani P., 2016, A&ARv, 24, 13
- Padovani et al. (2015) Padovani P., Bonzini M., Kellermann K. I., Miller N., Mainieri V., Tozzi P., 2015, MNRAS, 452, 1263
- Panessa et al. (2006) Panessa F., Bassani L., Cappi M., Dadina M., Barcons X., Carrera F. J., Ho L. C., Iwasawa K., 2006, A&A, 455, 173
- Panessa et al. (2007) Panessa F., Barcons X., Bassani L., Cappi M., Carrera F. J., Ho L. C., Pellegrini S., 2007, A&A, 467, 519
- Panessa et al. (2019) Panessa F., Baldi R. D., Laor A., Padovani P., Behar E., McHardy I., 2019, Nature Astronomy, 3, 387
- Parma et al. (1986) Parma P., de Ruiter H. R., Fanti C., Fanti R., 1986, A&AS, 64, 135
- Paudel & Yoon (2020) Paudel S., Yoon S.-J., 2020, ApJ, 898, L47
- Pearson (1895) Pearson K., 1895, Proceedings of the Royal Society of London Series I, 58, 240
- Pedlar et al. (1985) Pedlar A., Unger S. W., Dyson J. E., 1985, MNRAS, 214, 463
- Perlman et al. (1999) Perlman E. S., Biretta J. A., Zhou F., Sparks W. B., Macchetto F. D., 1999, AJ, 117, 2185
- Pitchford et al. (2016) Pitchford L. K., et al., 2016, MNRAS, 462, 4067
- Plotkin et al. (2012) Plotkin R. M., Markoff S., Kelly B. C., Körding E., Anderson S. F., 2012, MNRAS, 419, 267
- Radcliffe et al. (2018) Radcliffe J. F., et al., 2018, A&A, 619, A48
- Raginski & Laor (2016) Raginski I., Laor A., 2016, MNRAS, 459, 2082
- Reines & Volonteri (2015) Reines A. E., Volonteri M., 2015, ApJ, 813, 82
- Remillard & McClintock (2006) Remillard R. A., McClintock J. E., 2006, ARA&A, 44, 49
- Reynolds & Begelman (1997) Reynolds C. S., Begelman M. C., 1997, ApJ, 487, L135
- Risaliti et al. (2011) Risaliti G., Salvati M., Marconi A., 2011, MNRAS, 411, 2223
- Rosario et al. (2020) Rosario D. J., Fawcett V. A., Klindt L., Alexander D. M., Morabito L. K., Fotopoulou S., Lusso E., Calistro Rivera G., 2020, MNRAS, 494, 3061
- Rossi et al. (2020) Rossi P., Bodo G., Massaglia S., Capetti A., 2020, A&A, 642, A69
- Roy et al. (2021) Roy N., et al., 2021, arXiv e-prints, p. arXiv:2109.02609
- Rushton et al. (2012) Rushton A., et al., 2012, MNRAS, 419, 3194
- Rusinek et al. (2020) Rusinek K., Sikora M., Kozieł-Wierzbowska D., Gupta M., 2020, ApJ, 900, 125
- Sabater et al. (2019) Sabater J., et al., 2019, A&A, 622, A17
- Saikia et al. (2015) Saikia P., Körding E., Falcke H., 2015, MNRAS, 450, 2317
- Saikia et al. (2018a) Saikia P., Körding E., Dibi S., 2018a, MNRAS, 477, 2119
- Saikia et al. (2018b) Saikia P., Körding E., Coppejans D. L., Falcke H., Williams D., Baldi R. D., McHardy I., Beswick R., 2018b, A&A, 616, A152
- Salucci et al. (1999) Salucci P., Szuszkiewicz E., Monaco P., Danese L., 1999, MNRAS, 307, 637
- Sandage & Tammann (1981) Sandage A., Tammann G. A., 1981, in Carnegie Inst. of Washington, Publ. 635.
- Santini et al. (2012) Santini P., et al., 2012, A&A, 540, A109
- Sarzi et al. (2010) Sarzi M., et al., 2010, MNRAS, 402, 2187
- Schmitt (1985) Schmitt J. H. M. M., 1985, ApJ, 293, 178
- Schulze & Wisotzki (2010) Schulze A., Wisotzki L., 2010, A&A, 516, A87
- Scott & Graham (2013) Scott N., Graham A. W., 2013, ApJ, 763, 76
- Shakura & Sunyaev (1973) Shakura N. I., Sunyaev R. A., 1973, A&A, 24, 337
- Shankar (2009) Shankar F., 2009, New Astron. Rev., 53, 57
- Shankar (2013) Shankar F., 2013, Classical and Quantum Gravity, 30, 244001
- Shankar et al. (2004) Shankar F., Salucci P., Granato G. L., De Zotti G., Danese L., 2004, MNRAS, 354, 1020
- Shankar et al. (2019) Shankar F., et al., 2019, MNRAS, 485, 1278
- Shankar et al. (2020) Shankar F., et al., 2020, Nature Astronomy, 4, 282
- Silpa et al. (2020) Silpa S., Kharb P., Ho L. C., Ishwara-Chandra C. H., Jarvis M. E., Harrison C., 2020, MNRAS,
- Singh et al. (2011) Singh V., Shastri P., Risaliti G., 2011, A&A, 532, A84
- Singh et al. (2013) Singh R., et al., 2013, A&A, 558, A43
- Smith et al. (2020a) Smith K. L., et al., 2020a, MNRAS, 492, 4216
- Smith et al. (2020b) Smith K. L., Koss M., Mushotzky R., Wong O. I., Shimizu T. T., Ricci C., Ricci F., 2020b, ApJ, 904, 83
- Smolčić et al. (2008) Smolčić V., et al., 2008, ApJS, 177, 14
- Soltan (1982) Soltan A., 1982, MNRAS, 200, 115
- Speagle et al. (2014) Speagle J. S., Steinhardt C. L., Capak P. L., Silverman J. D., 2014, ApJS, 214, 15
- Suzuki et al. (2016) Suzuki T. L., et al., 2016, MNRAS, 462, 181
- Tadhunter (2016) Tadhunter C., 2016, A&ARv, 24, 10
- Talbot et al. (2021) Talbot R. Y., Bourne M. A., Sijacki D., 2021, MNRAS, 504, 3619
- Tchekhovskoy & McKinney (2012) Tchekhovskoy A., McKinney J. C., 2012, MNRAS, 423, L55
- Tchekhovskoy et al. (2011) Tchekhovskoy A., Narayan R., McKinney J. C., 2011, MNRAS, 418, L79
- Terashima & Wilson (2003) Terashima Y., Wilson A. S., 2003, ApJ, 583, 145
- Terashima et al. (2002) Terashima Y., Iyomoto N., Ho L. C., Ptak A. F., 2002, ApJS, 139, 1
- Thean et al. (2000) Thean A., Pedlar A., Kukula M. J., Baum S. A., O’Dea C. P., 2000, MNRAS, 314, 573
- Tremaine et al. (2002) Tremaine S., et al., 2002, ApJ, 574, 740
- Trippe (2014) Trippe S., 2014, Journal of Korean Astronomical Society, 47, 159
- Ulvestad et al. (1981) Ulvestad J. S., Wilson A. S., Sramek R. A., 1981, ApJ, 247, 419
- Vahdat Motlagh et al. (2019) Vahdat Motlagh A., Kalemci E., Maccarone T. J., 2019, MNRAS, 485, 2744
- Vaughan et al. (2005) Vaughan S., Iwasawa K., Fabian A. C., Hayashida K., 2005, MNRAS, 356, 524
- Venturi et al. (2021) Venturi G., et al., 2021, A&A, 648, A17
- Vitale et al. (2015) Vitale M., Fuhrmann L., García-Marín M., Eckart A., Zuther J., Hopkins A. M., 2015, A&A, 573, A93
- Walker et al. (1994) Walker R. C., Romney J. D., Benson J. M., 1994, ApJ, 430, L45
- Weaver et al. (1977) Weaver R., McCray R., Castor J., Shapiro P., Moore R., 1977, ApJ, 218, 377
- Webster et al. (2021) Webster B., et al., 2021, MNRAS, 500, 4921
- Werner et al. (2019) Werner N., McNamara B. R., Churazov E., Scannapieco E., 2019, Space Sci. Rev., 215, 5
- White et al. (2020) White C. J., Quataert E., Gammie C. F., 2020, ApJ, 891, 63
- Williams et al. (2019) Williams D. R. A., et al., 2019, MNRAS, 486, 4962
- Wójtowicz et al. (2020) Wójtowicz A., Stawarz Ł., Cheung C. C., Ostorero L., Kosmaczewski E., Siemiginowska A., 2020, ApJ, 892, 116
- Wrobel (2000) Wrobel J. M., 2000, ApJ, 531, 716
- Yang et al. (2020) Yang X., et al., 2020, ApJ, 904, 200
- Yang et al. (2021) Yang H., Yuan F., Yuan Y.-F., White C. J., 2021, ApJ, 914, 131
- Yesuf et al. (2020) Yesuf H. M., Faber S. M., Koo D. C., Woo J., Primack J. R., Luo Y., 2020, ApJ, 889, 14
- Yi & Boughn (1998) Yi I., Boughn S. P., 1998, ApJ, 499, 198
- Yi & Boughn (1999) Yi I., Boughn S. P., 1999, ApJ, 515, 576
- York et al. (2000) York D. G., et al., 2000, AJ, 120, 1579
- Yuan & Narayan (2014) Yuan F., Narayan R., 2014, ARA&A, 52, 529
- Yuan et al. (2012a) Yuan F., Bu D., Wu M., 2012a, ApJ, 761, 130
- Yuan et al. (2012b) Yuan F., Wu M., Bu D., 2012b, ApJ, 761, 129
- Zakamska & Greene (2014) Zakamska N. L., Greene J. E., 2014, MNRAS, 442, 784
- de Vaucouleurs et al. (1991) de Vaucouleurs G., de Vaucouleurs A., Corwin Jr. H. G., Buta R. J., Paturel G., Fouqué P., 1991, Third Reference Catalogue of Bright Galaxies. Volume I–III. Springer, New York
- van den Bosch (2016) van den Bosch R. C. E., 2016, ApJ, 831, 134
1 Istituto di Radioastronomia - INAF, Via P. Gobetti 101, I-40129 Bologna, Italy
2 School of Physics and Astronomy, University of Southampton, Southampton, SO17 1BJ, UK
3 Jodrell Bank Centre for Astrophysics, School of Physics and Astronomy, The University of Manchester, Manchester, M13 9PL, UK
4 Departamento de Física de la Tierra y Astrofísica, Instituto de Física de Partículas y del Cosmos IPARCOS, Universidad Complutense de Madrid, E-28040 Madrid, Spain
5 Instituto de Astrofísica de Canarias, Via Láctea S/N, E-38205, La Laguna, Tenerife, Spain
6 Departamento de Astrofísica, Universidad de La Laguna, E-38206, La Laguna, Tenerife, Spain
7 Jeremiah Horrocks Institute, University of Central Lancashire, Preston PR1 2HE, UK
8 Department of Space, Earth and Environment
Chalmers University of Technology
SE-412 96 Gothenburg, Sweden
9 Instituto de Astrofìsica de Andalucía (IAA, CSIC), Glorieta de la Astronomía s/n, 18008-Granada, Spain
10 Netherlands Institute for Radio Astronomy, ASTRON, Dwingeloo, The Netherlands
11 UK ALMA Regional Centre Node, Jodrell Bank Centre for Astrophysics
12 Department of Physics & Astronomy, University College London, Gower Street, London WC1E 6BT, UK
13 Astrophysics Group, Cavendish Laboratory, 19 J. J. Thomson Avenue, Cambridge CB3 0HE, UK
14 Max-Planck-Institut f’́ur Radioastronomie, Auf dem H’́ugel 69, 53121 Bonn, Germany
15 Department of Astrophysics/IMAPP, Radboud University, P.O. Box 9010, 6500 GL Nijmegen, The Netherlands
16 Department of Physics, Box 41051, Science Building, Texas Tech University, Lubbock, TX 79409-1051, US
17 Real Academia de Ciencias, C/ Valverde 22, 28004 Madrid
18 Technical University of Kenya, P.O. Box 52428 - 00200, Nairobi- Kenya
19 INAF - Istituto di Astrofisica e Planetologia Spaziali, via Fosso del Cavaliere 100, I-00133 Roma, Italy
20 Institute of Astronomy and Astrophysics, Academia Sinica, 11F of Astronomy-Mathematics Building,AS/NTU No. 1, Sec. 4, Roosevelt Rd, Taipei 10617, Taiwan, R.O.C
21 Inter-University Centre for Astronomy and Astrophysics (IUCAA), Ganeshkhind P.O., Pune 411007, India
22 Center for Astro, Particle and Planetary Physics, New York University Abu Dhabi, PO Box 129188, Abu Dhabi, UAE
23 School of Physics and Astronomy, University of Birmingham, Edgbaston, Birmingham B15 2TT, UK
24 Anton Pannekoek Institute for Astronomy, University of Amsterdam, Science Park 904, 1098 XH Amsterdam, the Netherlands
25 Centre for Astrophysics Research, University of Hertfordshire, College Lane, Hatfield, AL10 9AB, UK
26 Station de Radioastronomie de Nançay, Observatoire de Paris, PSL Research University, CNRS,Université Orléans, 18330 Nançay, France
27 AIM, CEA, CNRS, Université de Paris, Université Paris Saclay, F-91191 Gif-sur-Yvette, France
28 Dpt. Astronomia i Astrofísica, Unversitat de València, C/Dr. Moliner 50, 46100 Burjassot (Valencia, Spain)
29 Department of Physics, University of Bath, Claverton Down, Bath, BA2 7AY, UK
30 Department of Physics, Indian Institute of Technology, Hyderabad 502285, India
31 Centre for Extragalactic Astronomy, Department of Physics, Durham University, Durham DH1 3LE.
Appendix A Local black hole mass function
One of the main results of our present work is the presence of a break in the radio and accretion properties of local galaxies at , which correspond to a 70 km-1 according to the scaling relation used in this work from Tremaine et al. (2002). More precisely, we note an increasing AGN contribution to the radio core emission and a steepening of the radio-optical relations associated with AGN-dominated galaxies with respect to those relative to SF-dominated galaxies at larger BH masses.
If such a break is real, on the assumption of an underlying universal – relation, we would expect to witness a similar transition occurring in the local BH mass function (BHMF), with a predominance of active galaxies in more massive BHs progressively turning into more star-forming galaxies at less massive BHs. Unfortunately, the lack of samples of local star-forming galaxies statistically complete at low severely limits the computation of the BHMF at lower BH masses (see, e.g., Bernardi et al. 2003 and also Shankar 2013; Shankar et al. 2020 on the low mass-end of the BHMF). Therefore, to overcome this problem, we have focused on the SFR- scaling relation rather than on the BHMF of star-forming galaxies, by using the local galaxy population taken from Sloan Digital Sky survey (SDSS, York et al. 2000) Data Release 7 (Abazajian et al., 2009) at 0.3, as presented in Meert et al. (2015). The scaling relations of galaxies should still hold even at lower velocity dispersions irrespective of the degree of incompleteness in SDSS, as long as no strong biases are expected in the subsample of galaxies with measured velocity dispersions. Stellar masses are computed using the best-fitting Sérsic-Exponential or Sérsic photometry of -band observations, and by adopting the mass-to-light ratios by Mendel et al. (2014). We further adopt the SFR estimates from Brinchmann et al. (2004) and compute the specific star formation rate sSFR SFR/. We convert the available measurements of the velocity dispersion to BH mass, , by using the mean relation from Tremaine et al. (2002), as used throughout this work.
In Figure 9 we plot sSFR versus for star-forming galaxies and the local BHMF of active galaxies from Greene & Ho (2007) and Schulze & Wisotzki (2010). We note that sSFR steeply decreases at larger BH masses, with a clear break at 106-7 M⊙, where the BHMF of active galaxies peaks. In agreement, Dullo et al. (2020) reported that more massive BHs are hosted by galaxies with redder UV–[3.6 m]) color (i.e., lower sSFR). They also revealed that the –sSFR relations are morphology dependent where the SMBH masses for LTGs exhibit a steeper dependence on sSFR than those for ETGs. In conclusion, the observed break in the sSFR- relation (Fig. 9), consistent with the one found in our optical-radio relations (Sect. 3), provides independent support to our result in the present work: the action/energetics of the central SMBH becomes progressively more important in more massive BHs (and galaxies), . A detailed analysis of this study and the possible consequences of this result (e.g. hypothesis of a gradually more efficient role of radio AGN feedback at ) will be subject of a forthcoming work.
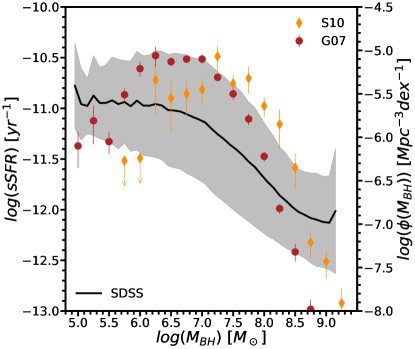
| Name | Hubble | class | log | log | log Edd | det | morph | log | log | |
|---|---|---|---|---|---|---|---|---|---|---|
| BPT | km s-1 | M⊙ | erg s-1 | ratio | erg s-1 | erg s-1 | ||||
| (1) | (2) | (3) | (4) | (5) | (6) | (7) | (8) | (9) | (10) | (11) |
| NGC 7817 | SAbc | H | 66.7 | 6.21 | 39.29 | 1.51 | U | 35.64 | ||
| IC 10 | IBm? | H | 35.5 | 5.11 | 37.13 | 2.57 | U | 32.91 | ||
| NGC 147 | dE5 pec | ALG | 22.0 | 4.28 | U | 32.39 | ||||
| NGC 185 | dE3 pec | L | 19.9 | 4.10 | 34.63 | 4.06 | U | 32.33 | ||
| NGC 205 | dE5 pec | ALG | 23.3 | 4.34∗ | U | 32.36 | ||||
| NGC 221 | E2 | ALG | 72.1 | 6.36 | U | 32.33 | ||||
| NGC 224 | SAb | ALG | 169.8 | 7.84 | U | 32.32 | ||||
| NGC 266 | SBab | L | 229.6 | 8.37 | 39.43 | 3.53 | I | A | 36.94 | 37.02 |
| NGC 278 | SABb | H | 47.6 | 5.62 | 37.47 | 2.74 | I | A | 34.81 | 35.83 |
| NGC 315 | E+ | LRL | 303.7 | 8.92∗ | 39.43 | 4.02 | I | A | 39.58 | 39.61 |
| NGC 404 | SA0 | L | 40.0 | 5.65∗ | 37.16 | 3.08 | U | 33.28 | ||
| NGC 410 | E+ | L | 299.7 | 8.84 | 39.32 | -4.11 | I | A | 37.26 | 37.53 |
| NGC 507 | SA0 | ALG | 307.7 | 8.88 | I | A | 36.86 | 37.07 | ||
| NGC 598 | SAcd | H | 21.0 | 4.20 | 34.63 | 4.16 | U | 32.43 | ||
| IC 1727 | SBM | L | 136.8 | 7.47 | 37.34 | 4.72 | U | 34.55 | ||
| NGC 672 | SBcd | H | 64.3 | 6.15 | 37.66 | 3.08 | U | 34.55 | ||
| NGC 697 | SABc | H | 75.0 | 6.42 | 37.86 | 3.15 | U | 35.95 | ||
| NGC 777 | E1 | LRL | 324.1 | 8.97 | 38.38 | 5.18 | I | A | 36.77 | 36.98 |
| NGC 783 | SAc | H | 101.4 | 6.94 | 38.81 | 2.68 | U | 36.12 | ||
| NGC 784 | SBdm | H | 35.5 | 5.11 | 37.68 | 2.02 | U | 34.19 | ||
| NGC 812 | SAB0/a pec | H | 120.9 | 7.25 | 38.68 | 3.16 | U | 36.70 | ||
| NGC 818 | SABc | H | 151.3 | 7.64 | 38.46 | 3.77 | U | 36.14 | ||
| NGC 841 | SABab | L | 159.2 | 7.73 | 38.74 | 3.58 | U | 36.19 | ||
| NGC 890 | SAB0 | ALG | 210.9 | 8.22 | U | 36.06 | ||||
| NGC 891 | SAb? | H | 73.1 | 6.37 | 36.29 | 4.66 | unI | 34.65 | ||
| NGC 925 | SABd | H | 71.9 | 6.34 | 37.21 | 3.72 | U | 34.55 | ||
| NGC 959 | SAdm | H | 43.6 | 5.47 | 37.40 | 2.66 | U | 34.65 | ||
| NGC 972 | SAab | j H | 102.8 | 6.97 | 38.64 | 2.92 | I | B | 35.31 | 36.06 |
| IC 239 | SAB(rs)cd | H | 92.3 | 6.78 | 36.93 | 4.40 | U | 34.98 | ||
| NGC 1003 | SA(s)cd | H | 37.23 | U | 34.58 | |||||
| NGC 1023 | SB(rs)0- | ALG | 204.5 | 7.62∗ | U | 34.57 | ||||
| NGC 1058 | SA(rs)c | L | 31.0 | 4.88 | 35.95 | 3.48 | U | 34.41 | ||
| NGC 1156 | IB(s)m | H | 35.9 | 5.13 | 39.15 | 0.53 | U | 34.15 | ||
| NGC 1161 | SA0 | LRL | 258.4 | 8.58 | 38.13 | 5.00 | I | A | 36.57 | 36.69 |
| NGC 1167 | SA0- | LRL | 216.9 | 8.27 | 40.17 | 2.65 | I | A | 39.65 | 39.76 |
| NGC 1169 | SAB(r)b | L | 181.3 | 7.96 | 38.58 | 3.93 | U | 35.66 | ||
| NGC 1186 | SB(r)bc: | H | 119.8 | 7.24 | 38.95 | 2.84 | I | E | 35.91 | 36.78 |
| NGC 1275 | Pec | LRL | 258.9 | 8.98∗ | 41.61 | 1.92 | I | A | 40.97 | 41.62 |
| IC 342 | SAB(rs)cd | H | 74.0 | 6.41∗ | 35.99 | 4.97 | unI | 33.86 | ||
| IC 356 | SA(s)ab pec | H | 156.6 | 7.70 | 37.57 | 4.68 | I | A | 35.52 | 35.74 |
| NGC 1569 | IBm | H | 44.0 | 5.49 | 36.49 | 3.55 | unI | 33.18 | ||
| NGC 1560 | SA(s)d spin | H | 33.9 | 5.03 | 37.38 | 2.20 | I | A | 33.78 | 34.12 |
| NGC 1961 | SAB(rs)c | LRL | 241.3 | 8.29∗ | 39.11 | 3.73 | I | A | 37.15 | 37.25 |
| NGC 2146 | SB(s)ab pec | H | 126.8 | 7.33 | 38.36 | 3.52 | I | E | 36.34 | 36.86 |
| NGC 2273 | SBa | S | 148.9 | 7.61 | 40.43 | 1.77 | I | E | 36.64 | 37.98 |
| NGC 2342 | S pec | H | 147.3 | 7.60 | 39.71 | 2.48 | I | E | 36.55 | 37.64 |
| UGC 3714 | S? pec | H | 104.0 | 6.99 | 38.49 | 3.05 | U | 35.90 | ||
| NGC 2268 | SABbc | H | 143.3 | 7.55 | 39.27 | 2.87 | U | 35.76 | ||
| UGC 3828 | SABb | j H | 73.9 | 6.39 | 38.84 | 2.14 | I | C | 36.63 | 38.84 |
| NGC 2336 | SAB(r)bc | L | 116.2 | 7.18 | 38.20 | 3.54 | U | 35.75 | ||
| NGC 2276 | SABc | H | 83.5 | 6.61 | 38.17 | 3.03 | U | 35.90 | ||
| NGC 2366 | IB(s)m | H | U | 33.64 | ||||||
| IC 467 | SAB(s)c: | H | 64.2 | 6.15 | 37.15 | 3.55 | unI | 35.56 | ||
| NGC 2300 | SA0 | ALG | 261.1 | 8.60 | I | A | 36.23 | 36.41 | ||
| NGC 2403 | SAB(s)cd | H | 68.4 | 6.26 | 35.91 | 4.90 | U | 33.96 | ||
| UGC 4028 | SABc? | j H | 80.5 | 6.54 | 38.88 | 2.25 | I | C | 36.22 | 36.70 |
| NGC 2500 | SBd | H | 47.1 | 5.61 | 36.55 | 3.65 | U | 34.71 | ||
| NGC 2543 | SBb | H | 112.4 | 7.12 | 38.55 | 3.16 | U | 35.65 | ||
| NGC 2537 | SBm pec | H | 63.0 | 6.11 | 38.72 | 1.98 | U | 34.60 | ||
| NGC 2541 | SAcd | H | 53.0 | 5.81 | 36.80 | 3.60 | U | 34.72 | ||
| NGC 2549 | SA(r)0 spin | ALG | 142.6 | 7.16∗ | U | 35.26 | ||||
| NGC 2639 | SAa? | LRL | 179.3 | 7.94 | 39.60 | 2.93 | I | C | 37.61 | 38.50 |
| NGC 2634 | E1 | ALG | 181.1 | 7.96 | I | A | 35.81 | 35.87 | ||
| NGC 2683 | SA(rs)b | L | 130.2 | 7.38 | 37.06 | 4.87 | I | A | 34.49 | 34.65 |
| NGC 2681 | SAB0/a | L | 109.1 | 7.07 | 38.37 | 3.29 | I | C | 35.51 | 35.99 |
| IC 520 | SABab? | L | 138.1 | 7.48 | 39.03 | 3.04 | U | 36.08 | ||
| NGC 2685 | (R)SB0+pec | L | 93.8 | 6.59∗ | 38.41 | 2.73 | U | 34.82 | ||
| NGC 2655 | SAB0/a | LRL | 159.8 | 7.74 | 39.44 | 2.89 | I | E | 37.59 | 37.97 |
| NGC 2750 | SABc | H | 52.4 | 5.79 | 39.20 | 1.14 | unI | 35.76 | ||
| NGC 2742 | SA(s)c: | H | 65.6 | 6.18 | 37.73 | 3.00 | U | 35.37 | ||
| NGC 2715 | SABc | H | 84.6 | 6.63 | 37.79 | 3.43 | U | 35.32 | ||
| NGC 2770 | SA(s)c: | H | 81.0 | 6.55 | 37.56 | 3.54 | U | 35.46 | ||
| NGC 2768 | E6: | LRL | 181.8 | 7.96 | 38.61 | 3.90 | I | A | 37.10 | 37.19 |
| NGC 2776 | SAB(rs)c | H | 47.7 | 5.63 | 38.32 | 1.86 | U | 35.61 | ||
| NGC 2748 | SAbc | H | 83.0 | 7.65∗ | 37.83 | 4.41 | U | 35.44 | ||
| NGC 2782 | SAB(rs)a pec | j H | 183.1 | 7.98 | 40.00 | 2.53 | I | A | 36.79 | 37.16 |
| NGC 2787 | SB(r)0+ | L | 202.0 | 7.61∗ | 38.37 | 3.79 | I | A | 36.28 | 36.41 |
| NGC 2832 | E+2: | L | 334.0 | 9.03 | 39.05 | 4.53 | I+unI | A | 36.83 | 37.05 |
| NGC 2841 | SAb | L | 222.0 | 8.31 | 38.19 | 4.63 | I | C | 34.84 | 35.47 |
| NGC 2859 | (R)SB(r)0+ | L | 188.2 | 8.02 | 38.57 | 4.00 | U | 35.31 | ||
| NGC 2903 | SAB(rs)bc | H | 89.0 | 7.06∗ | 37.35 | 4.26 | U | 34.32 | ||
| NGC 2950 | (R)SB(r)0 | ALG | 163.0 | 7.77 | U | 35.47 | ||||
| NGC 2964 | SAB(r)bc: | H | 109.4 | 6.73∗ | 38.71 | 2.57 | I | E | 36.03 | 36.97 |
| NGC 2977 | SAb: | H | 104.5 | 7.00 | 38.20 | 3.35 | U | 35.91 | ||
| NGC 2976 | SAc pec | H | 36.0 | 5.14 | 36.58 | 3.11 | U | 33.24 | ||
| NGC 3003 | SAbc? | H | 44.1 | 5.49 | 38.90 | 1.14 | U | 35.28 | ||
| NGC 2985 | R’)SA(rs)ab | L | 140.8 | 7.52 | 38.69 | 3.38 | I | A | 35.81 | 36.03 |
| NGC 3031 | SA(s)ab | L | 161.6 | 7.81∗ | 37.72 | 4.64 | I | A | 35.50 | 35.54 |
| NGC 3027 | SB(rs)d: | H | 25.6 | 4.54 | 37.69 | 1.40 | U | 35.29 | ||
| NGC 3034 | IAO spin | H | 129.5 | 7.37 | 38.33 | 3.59 | unI | 34.28 | ||
| NGC 3043 | SAb: spin | H | 51.9 | 5.77 | 38.08 | 2.24 | U | 35.91 | ||
| NGC 3073 | SAB0- | H | 35.6 | 5.12 | 38.02 | 1.65 | U | 35.26 | ||
| NGC 3077 | AO pec | H | 32.4 | 4.95 | 37.15 | 2.35 | I+unI | A | 33.32 | 34.35 |
| NGC 3079 | SB(s)c spin | L | 182.3 | 6.40∗ | 37.67 | 3.28 | I | C | 37.27 | 37.75 |
| NGC 3162 | SAB(rs)bc | H | 89.0 | 6.72 | 38.04 | 3.23 | U | 35.19 | ||
| NGC 3147 | SA(rs)bc | L | 219.8 | 8.29 | 39.54 | 3.30 | I | A | 37.36 | 37.51 |
| NGC 3185 | (R)SB(r)0/a | S | 79.3 | 6.51 | 39.44 | 1.62 | U | 35.15 | ||
| NGC 3190 | SA(s)a pec spin | L | 188.1 | 8.02 | 38.71 | 3.86 | U | 35.32 | ||
| NGC 3184 | SABcd | H | 43.3 | 5.46 | 37.31 | 2.74 | U | 34.64 | ||
| NGC 3193 | E2 | L | 194.3 | 8.08 | 38.42 | 4.21 | U | 35.23 | ||
| NGC 3198 | SBc | H | 46.1 | 5.57 | 36.97 | 3.19 | I | A | 35.02 | 35.19 |
| NGC 3245 | SA(r)0? | H | 209.9 | 8.38∗ | 38.70 | 4.23 | I | E | 35.71 | 36.36 |
| IC 2574 | SAB(s)m | H | 33.9 | 5.03 | 35.55 | 4.03 | U | 33.66 | ||
| NGC 3254 | SA(s)bc | S | 117.8 | 7.21 | 38.60 | 3.16 | U | 35.27 | ||
| NGC 3294 | SAc | H | 56.4 | 5.92 | 38.33 | 2.18 | U | 35.66 | ||
| NGC 3301 | (R’)SB(rs)0/a | L | 132.3 | 7.41 | 38.30 | 3.66 | I | A | 35.70 | 35.86 |
| NGC 3310 | SAB(r)bc pec | H | 84.0 | 6.70∗ | 38.43 | 2.82 | I | A | 35.60 | 36.20 |
| NGC 3319 | SBcd | L | 87.4 | 6.68 | 37.07 | 4.20 | U | 34.84 | ||
| NGC 3344 | (R)SAB(r)bc | H | 73.6 | 6.38 | 38.24 | 2.69 | U | 34.11 | ||
| NGC 3359 | SAB(rs)cd: pec | H | 96.5 | 6.86 | 37.93 | 3.48 | U | 35.21 | ||
| NGC 3348 | E0 | ALG | 236.4 | 8.42 | I | C | 36.59 | 36.73 | ||
| NGC 3395 | SAB(rs)cd: pec | H | 96.5 | 6.86 | 37.93 | 3.48 | U | 35.32 | ||
| NGC 3414 | SA0 pec | L | 236.8 | 8.40∗ | 39.06 | 3.95 | I | C | 36.20 | 36.33 |
| NGC 3430 | SABc | H | 50.4 | 5.72 | 37.74 | 2.57 | I | E | 35.74 | 36.19 |
| NGC 3432 | SBm | H | 37.0 | 5.18 | 38.00 | 1.77 | I | A | 34.82 | 34.83 |
| NGC 3448 | IAO | H | 50.7 | 5.73 | 39.48 | 0.80 | I | A | 35.55 | 36.35 |
| NGC 3486 | SAB(r)c | S | 65.0 | 6.17 | 37.93 | 2.79 | U | 34.26 | ||
| NGC 3504 | (R)SAB(s)ab | j H | 119.3 | 7.23 | 39.88 | 1.90 | I | A | 37.30 | 37.65 |
| NGC 3516 | (R)SB(s)0: | S | 181.0 | 7.96 | 40.80 | 1.71 | I | C | 36.84 | 36.95 |
| NGC 3556 | SB(s)cd spin | H | 79.4 | 6.52 | 37.62 | 3.45 | U | 34.92 | ||
| NGC 3583 | SBb | H | 131.7 | 7.40 | 38.26 | 3.73 | U | 35.69 | ||
| NGC 3600 | SAa? | H | 49.8 | 5.70 | 38.21 | 2.08 | U | 34.66 | ||
| NGC 3610 | E5: | ALG | 161.2 | 7.75 | U | 35.56 | ||||
| NGC 3613 | E6 | ALG | 220.1 | 8.30 | U | 35.69 | ||||
| NGC 3631 | SA(s)c | H | 43.9 | 5.48 | 38.01 | 2.02 | U | 35.23 | ||
| NGC 3646 | Ring | L | 153.1 | 7.66 | 39.15 | 3.06 | U | 35.98 | ||
| NGC 3642 | SA(r)bc: | L | 85.0 | 7.42∗ | 38.96 | 3.01 | U | 35.55 | ||
| NGC 3652 | SAcd? | H | 56.4 | 5.92 | 38.51 | 2.00 | U | 35.73 | ||
| NGC 3665 | SA0 | j HRL | 236.8 | 8.76∗ | 38.28 | 4.73 | I | B | 36.85 | 37.67 |
| NGC 3675 | SAb | L | 108.0 | 7.26∗ | 37.79 | 3.85 | I | A | 34.96 | 35.17 |
| NGC 3690 | IBm pec | H | 47.6 | 5.62 | 37.04 | 3.13 | unI | 36.21 | ||
| UGC 6484 | SB(rs)c | H | 61.1 | 6.06 | 37.47 | 3.14 | U | 35.67 | ||
| NGC 3718 | SB(s)a pec | LRL | 158.1 | 7.72 | 37.41 | 4.86 | I | A | 36.78 | 36.78 |
| NGC 3726 | SBa pec | H | 41.5 | 5.38 | 37.80 | 2.17 | U | 34.99 | ||
| NGC 3729 | SB(r)a pec | H | 76.2 | 6.45 | 36.60 | 4.40 | I | A | 35.85 | 36.34 |
| NGC 3738 | IAm | H | 49.1 | 5.68 | 37.77 | 2.46 | U | 33.89 | ||
| NGC 3735 | SAc: spin | S | 140.6 | 7.51 | 39.88 | 2.18 | I | A | 36.24 | 36.50 |
| NGC 3756 | SAB(rs)bc | H | 47.6 | 5.62 | 37.04 | 3.13 | U | 35.29 | ||
| NGC 3780 | SA(s)c: | L | 89.8 | 6.73 | 37.43 | 3.85 | U | 35.78 | ||
| NGC 3813 | SA(rs)b: | H | 72.1 | 6.35 | 37.59 | 3.31 | U | 35.53 | ||
| NGC 3838 | SA0/a? | ALG | 141.4 | 7.52 | unI | 35.44 | ||||
| NGC 3877 | SAc | H | 86.1 | 6.66 | 37.86 | 3.39 | U | 36.47 | ||
| NGC 3884 | SA(r)0/a | L | 208.3 | 8.20 | 40.20 | 2.55 | I | A | 37.79 | 37.80 |
| NGC 3893 | SABc | H | 85.3 | 6.64 | 37.44 | 3.79 | U | 34.96 | ||
| NGC 3900 | SA(r)0+ | ALG | 139.2 | 7.50 | 38.35 | 3.70 | U | 35.63 | ||
| NGC 3898 | SA(s)ab | L | 206.5 | 8.19 | 38.52 | 4.03 | I | A | 35.84 | 36.11 |
| NGC 3917 | SA(s)ab | L | 38.0 | 5.23 | 36.90 | 2.88 | U | 35.04 | ||
| NGC 3938 | SAc | H | 29.1 | 4.76 | 37.61 | 1.74 | I | A | 35.16 | 35.49 |
| NGC 3941 | SB(s)0 | S | 133.0 | 7.42 | 38.52 | 3.45 | I | A | 35.46 | 35.70 |
| NGC 3945 | (R)SB(rs)0+ | L | 191.5 | 6.94∗ | 38.39 | 3.10 | I | C | 35.77 | 35.86 |
| NGC 3949 | SAbc | H | 82.0 | 6.57 | 37.44 | 3.72 | U | 35.05 | ||
| NGC 3953 | SB(r)bc | L | 116.0 | 7.33∗ | 37.90 | 3.98 | U | 35.07 | ||
| NGC 3963 | SAB(rs)bc | H | 40.9 | 5.36 | 38.09 | 1.82 | I | A | 36.03 | 36.09 |
| NGC 3982 | SAB(r)b: | S | 73.0 | 6.95∗ | 39.83 | 1.67 | I | A | 36.15 | 36.36 |
| NGC 3992 | SB(rs)bc | L | 148.4 | 7.51∗ | 37.10 | 4.96 | U | 35.07 | ||
| NGC 3998 | SA(r)0? | LRL | 304.6 | 8.93∗ | 39.56 | 3.92 | I | A | 37.98 | 37.98 |
| NGC 4013 | SAb | L | 86.5 | 6.67 | 37.36 | 3.90 | unI | 35.10 | ||
| NGC 4026 | SA0 spin | L | 177.2 | 8.26∗ | U | 35.11 | ||||
| NGC 4036 | SA0- | L | 215.1 | 7.89∗ | 39.16 | 3.28 | I | C | 35.99 | 36.94 |
| NGC 4041 | SA(rs)bc: | H | 95.0 | 6.83 | 38.24 | 3.14 | I | E | 35.50 | 36.51 |
| NGC 4051 | SABbc | S | 89.0 | 6.10∗ | 40.17 | 1.14 | I | C | 35.29 | 36.92 |
| NGC 4062 | SA(s)c | H | 93.2 | 6.80 | 36.51 | 4.84 | U | 34.63 | ||
| NGC 4088 | SAB(rs)bc | H | 77.0 | 6.79∗ | 37.48 | 3.86 | U | 35.10 | ||
| NGC 4096 | SAB(rs)c | H | 79.5 | 6.52 | 36.15 | 4.92 | U | 34.53 | ||
| NGC 4100 | (R’)SA(rs)bc | H | 75.5 | 6.43 | 37.95 | 3.03 | I | A | 35.36 | 35.76 |
| NGC 4102 | SAB(s)b? | H | 174.3 | 7.89 | 39.10 | 3.34 | I | E | 35.91 | 37.55 |
| NGC 4111 | SA(r)0+: spin | L | 147.9 | 7.60 | 38.65 | 3.50 | I+unI | A | 35.41 | 35.83 |
| NGC 4125 | E6 pec | L | 226.7 | 8.35 | 38.71 | 4.19 | U | 35.36 | ||
| NGC 4136 | E6 pec | H | 38.4 | 5.25 | 37.39 | 2.41 | U | 34.66 | ||
| NGC 4138 | SA(r)0+ | L | 120.9 | 7.25 | 38.75 | 3.05 | U | 35.29 | ||
| NGC 4143 | SAB(s)0 | L | 204.9 | 7.92∗ | 38.81 | 3.66 | I | B | 36.13 | 36.22 |
| NGC 4144 | SAB(s)cd? spin | H | 64.3 | 6.15 | 36.26 | 4.44 | U | 34.02 | ||
| NGC 4145 | SAB(rs)d | H | 5.33∗ | 36.80 | 3.08 | U | 35.18 | |||
| NGC 4151 | (R’)SAB(rs)ab: | S | 97.0 | 7.81∗ | 41.74 | 0.62 | I | C | 37.75 | 38.35 |
| NGC 4150 | SA(r)0? | L | 87.0 | 5.94∗ | 35.83 | 4.66 | U | 34.62 | ||
| NGC 4157 | SAB(s)b? spin | H | 90.1 | 6.74 | 36.96 | 4.33 | U | 35.07 | ||
| NGC 4162 | (R)SA(rs)bc | H | 76.1 | 6.44 | 38.44 | 2.55 | unI | 35.98 | ||
| NGC 4169 | SA0 | S | 183 | 7.97 | 38.99 | 3.53 | U | 36.08 | ||
| NGC 4183 | SA(s)cd? spin | H | 34.4 | 5.06 | 37.90 | 1.71 | U | 35.17 | ||
| NGC 4203 | SAB0-: | L | 167.0 | 7.82∗ | 38.28 | 4.09 | I | A | 36.09 | 36.11 |
| NGC 4214 | IAB(s)m | H | 51.6 | 5.76 | 38.71 | 1.60 | U | 33.72 | ||
| NGC 4217 | SAb spin | H | 91.3 | 6.76 | 36.93 | 4.38 | I | C | 35.23 | 35.96 |
| NGC 4220 | SA(r)0+ | L | 105.5 | 7.01 | 36.19 | 5.37 | I | A | 35.25 | 35.72 |
| NGC 4236 | SB(s)dm | H | 62.8 | 6.11 | 36.24 | 4.42 | unI | 33.27 | ||
| NGC 4244 | SA(s)cd: spin | H | 36.8 | 5.17 | 36.05 | 3.67 | I | A | 33.83 | 33.94 |
| NGC 4242 | SAB(s)dm | H | 36.30 | unI | 34.42 | |||||
| NGC 4245 | SB(r)0/a: | H | 82.7 | 7.19∗ | 37.36 | 4.38 | U | 34.64 | ||
| NGC 4251 | SB0? spin | ALG | 119.4 | 7.23 | U | 34.66 | ||||
| NGC 4258 | SAB(s)bc | S | 148.0 | 7.58∗ | 38.76 | 3.37 | I | A | 34.93 | 35.06 |
| NGC 4274 | (R)SB(r)ab | L | 96.6 | 6.86 | 38.49 | 2.92 | U | 34.62 | ||
| NGC 4278 | E1+ | LRL | 261.0 | 7.96∗ | 38.88 | 3.63 | I | A | 37.61 | 37.63 |
| NGC 4291 | E | ALG | 285.3 | 8.99∗ | U | 35.50 | ||||
| NGC 4314 | SB(rs)a | L | 117.0 | 6.91∗ | 37.75 | 3.71 | U | 34.65 | ||
| NGC 4346 | SA0 spin | L | 146.5 | 7.59 | 37.88 | 4.26 | U | 35.28 | ||
| NGC 4369 | (R)SA(rs)a | H | 71.6 | 6.34 | 38.83 | 2.06 | I | A | 35.18 | 35.40 |
| NGC 4395 | SA(s)m: | S | 26.0 | 4.57 | 38.35 | 0.77 | I | A | 34.17 | 34.39 |
| NGC 4414 | SA(rs)c? | L | 117.0 | 7.19 | 36.46 | 5.28 | U | 34.68 | ||
| NGC 4449 | IBm | H | 17.8 | 3.91 | 38.28 | 0.18 | U | 33.58 | ||
| NGC 4448 | SB(r)ab | H | 119.8 | 7.24 | 37.34 | 4.45 | U | 34.47 | ||
| NGC 4460 | SB(s)0+? spin | H | 39.8 | 5.31 | 38.09 | 1.77 | U | 34.36 | ||
| NGC 4485 | IB(s)m pec | H | 52.2 | 5.78 | 36.95 | 3.38 | U | 34.32 | ||
| NGC 4490 | SB(s)d pec | H | 45.1 | 5.53 | 37.12 | 2.96 | U | 34.33 | ||
| NGC 4494 | E1+ | L | 145.0 | 7.57 | 37.35 | 4.77 | I | A | 34.69 | 34.92 |
| NGC 4559 | SAB(rs)cd | H | 49.2 | 5.68 | 37.01 | 3.22 | U | 34.49 | ||
| NGC 4565 | SA(s)b? spin | S | 136.0 | 7.46 | 38.22 | 3.79 | I | A | 35.20 | 35.31 |
| NGC 4589 | E2 | LRL | 224.3 | 8.33 | 38.78 | 4.10 | I | C | 37.45 | 37.60 |
| NGC 4605 | SB(s)c pec | H | 26.1 | 4.57 | 36.63 | 2.49 | U | 33.77 | ||
| NGC 4618 | SB(rs)m | H | 54.6 | 5.86 | 37.97 | 2.44 | U | 34.28 | ||
| NGC 4648 | E3 | ALG | 224.5 | 8.33 | U | 35.45 | ||||
| NGC 4631 | SB(s)d spin | H | 71.9 | 6.34 | 37.12 | 3.77 | unI | 34.30 | ||
| NGC 4656 | SB(s)m pec | H | 70.4 | 6.31 | 37.93 | 2.93 | U | 34.32 | ||
| NGC 4750 | (R)SA(rs)ab | L | 136.0 | 7.46 | 38.76 | 3.25 | I | A | 35.84 | 36.17 |
| NGC 4725 | SAB(r)ab pec | S | 140.0 | 7.51 | 38.51 | 3.55 | U | 34.78 | ||
| NGC 4736 | (R)SA(r)ab | L | 112.0 | 7.12 | 37.33 | 4.08 | I | A | 34.82 | 35.29 |
| NGC 4800 | SA(rs)b | H | 111.0 | 7.02∗ | 37.62 | 3.95 | U | 34.91 | ||
| NGC 4793 | SAB(rs)c | H | 26.6 | 4.61 | 38.84 | 0.32 | U | 35.78 | ||
| NGC 4826 | (R)SA(rs)ab | L | 96.0 | 6.85 | 37.92 | 3.48 | I | A | 33.88 | 34.93 |
| NGC 4914 | E | ALG | 224.7 | 8.33 | U | 36.17 | ||||
| NGC 5005 | SABbc | L | 172.0 | 8.27∗ | 39.41 | 3.05 | I | D | 36.29 | 37.54 |
| NGC 5012 | SAB(rs)c | L | 141.4 | 7.52 | 38.58 | 3.49 | unI | 35.84 | ||
| NGC 5033 | SA(s)c | L | 151.0 | 7.64 | 39.34 | 2.85 | I | A | 36.04 | 36.42 |
| NGC 5055 | SAbc | L | 117.0 | 8.92∗ | 37.44 | 6.07 | U | 34.37 | ||
| NGC 5112 | SBcd | H | 60.8 | 6.05 | 37.42 | 3.22 | U | 35.40 | ||
| NGC 5204 | SA(s)m | H | 39.9 | 5.32 | 36.58 | 3.29 | U | 34.14 | ||
| NGC 5194 | SAbc pec | S | 96.0 | 6.85 | 38.91 | 2.53 | I | D | 35.06 | 36.14 |
| NGC 5195 | IA0 pec | L | 124.8 | 7.31 | 37.84 | 4.06 | I | C | 34.90 | 35.59 |
| NGC 5273 | SA0 | S | 71.0 | 6.61∗ | 39.82 | 1.38 | unI | 35.31 | ||
| NGC 5297 | SABc | L | 61.3 | 6.07 | 38.22 | 2.44 | U | 35.89 | ||
| NGC 5308 | SA0- spin | ALG | 249.0 | 8.51 | U | 35.82 | ||||
| NGC 5322 | E3+ | LRL | 232.2 | 8.39 | 38.20 | 4.74 | I | B | 36.96 | 37.51 |
| NGC 5353 | SA0 | LRL | 286.4 | 8.76 | 38.73 | 4.62 | I | A | 37.63 | 37.66 |
| NGC 5354 | SA0 spin | LRL | 217.4 | 8.28 | 38.61 | 4.22 | I | A | 36.94 | 36.97 |
| NGC 5371 | SABbc | L | 179.8 | 7.94 | 39.03 | 3.50 | U | 35.79 | ||
| NGC 5377 | SBa | L | 169.7 | 7.84 | 38.81 | 3.62 | I | C | 35.71 | 36.35 |
| NGC 5383 | SBb pec | H | 96.5 | 6.86 | 38.07 | 3.38 | U | 35.82 | ||
| NGC 5395 | SAb pec | L | 145.5 | 7.57 | 38.66 | 3.50 | U | 35.96 | ||
| NGC 5448 | SABa | L | 124.5 | 7.30 | 38.55 | 3.34 | I | C | 35.73 | 36.46 |
| NGC 5457 | SAB(rs)cd | H | 23.6 | 6.41∗ | 36.99 | 3.97 | U | 34.28 | ||
| NGC 5473 | SAB(s)0-: | ALG | 220.5 | 8.30 | U | 35.82 | ||||
| NGC 5474 | SA(s)cd pec | H | 29.0 | 4.76 | 37.35 | 1.96 | U | 34.38 | ||
| NGC 5485 | SA0 pec | LRL | 207.5 | 8.19 | 38.31 | 4.43 | I | A | 36.44 | 36.44 |
| NGC 5523 | SAcd | H | 30.1 | 4.82 | 37.25 | 2.16 | U | 35.29 | ||
| NGC 5548 | (R’)SA(s)0/a | S | 291 | 7.70∗ | 41.60 | 0.65 | I | B | 36.96 | 37.61 |
| NGC 5557 | E1 | ALG | 295.3 | 8.81 | U | 35.94 | ||||
| NGC 5585 | SAB(s)d | H | 42.0 | 5.41 | 37.68 | 2.28 | U | 34.53 | ||
| NGC 5631 | SA(s)0 | L | 168.1 | 7.83 | 38.76 | 3.62 | U | 35.89 | ||
| NGC 5660 | SABc | H | 60.7 | 6.05 | 38.10 | 2.54 | U | 35.76 | ||
| NGC 5656 | SAab | L | 116.7 | 7.19 | 37.99 | 3.79 | U | 35.92 | ||
| NGC 5678 | SAB(rs)b | H | 132.8 | 7.42 | 38.27 | 3.70 | U | 35.93 | ||
| NGC 5676 | SAbc | H | 116.7 | 7.19 | 37.96 | 3.82 | unI | 35.74 | ||
| NGC 5866 | SA0 | LRL | 169.1 | 7.84 | 37.50 | 4.93 | I | D | 36.50 | 36.76 |
| NGC 5879 | SAbc | L | 73.9 | 6.62∗ | 37.89 | 3.09 | I | A | 35.27 | 35.39 |
| NGC 5905 | SBb | H | 174.6 | 7.89 | 39.03 | 3.45 | U | 35.90 | ||
| NGC 5907 | SAc | H | 120.2 | 7.24 | 36.88 | 4.94 | unI | 35.03 | ||
| NGC 5982 | E3 | ALG | 239.4 | 8.44 | 38.55 | 4.48 | U | 35.80 | ||
| NGC 5985 | SABb | L | 157.6 | 7.71 | 38.76 | 3.54 | I | D | 35.76 | 36.30 |
| NGC 6015 | SAcd | H | 43.5 | 5.47 | 37.18 | 2.88 | unI | 35.04 | ||
| NGC 6140 | SBcd pec | H | 49.4 | 5.69 | 37.52 | 2.76 | U | 35.15 | ||
| NGC 6217 | (R)SB(rs)bc | H | 70.3 | 6.30 | 39.25 | 1.60 | I | A | 35.66 | 36.59 |
| NGC 6207 | SA(s)c | H | 92.1 | 6.78 | 38.30 | 3.03 | U | 35.19 | ||
| NGC 6236 | SAB(s)cd | H | 46.1 | 5.57 | 37.93 | 2.19 | U | 35.40 | ||
| NGC 6340 | SA(s)0/a | L | 143.9 | 7.56 | 38.31 | 3.80 | I | A | 35.53 | 36.03 |
| NGC 6412 | SA(s)c | H | 49.9 | 5.71 | 37.59 | 2.67 | U | 35.40 | ||
| NGC 6503 | SA(s)cd | L | 46.0 | 6.30∗ | U | 34.30 | ||||
| NGC 6482 | E: | L | 310.4 | 8.90 | I | A | 36.37 | 36.74 | ||
| NGC 6643 | SA(rs)c | H | 95.4 | 6.84 | 37.52 | 3.87 | U | 35.47 | ||
| NGC 6654 | (R’)SB(s)0/a | ALG | 172.2 | 7.87 | U | 35.61 | ||||
| NGC 6689 | SAd? spin | L | 26.0 | 4.57 | 37.17 | 1.95 | U | 34.85 | ||
| NGC 6702 | E | ALG | 173.6 | 7.88 | I | C | 36.19 | 36.85 | ||
| NGC 6703 | SA0 | L | 179.9 | 7.95 | 38.46 | 4.08 | I | A | 35.78 | 35.91 |
| NGC 6946 | SABcd | H | 55.8 | 5.90 | 37.03 | 3.46 | I | E | 34.43 | 35.73 |
| NGC 6951 | SABbc | L | 127.8 | 6.93∗ | 38.69 | 3.25 | I | C | 35.42 | 36.02 |
| NGC 7080 | SB(r)b | H | 95.3 | 6.84 | I | A | 36.50 | 36.91 | ||
| NGC 7217 | SAab | L | 141.4 | 7.52 | 38.31 | 3.80 | I | C | 35.09 | 35.87 |
| NGC 7331 | SAb | L | 137.2 | 8.02∗ | 38.30 | 3.76 | U | 34.95 | ||
| NGC 7332 | SA0 pec | ALG | 124.1 | 7.08∗ | U | 35.18 | ||||
| NGC 7457 | SA0? | ALG | 69.4 | 6.95∗ | U | 34.88 | ||||
| NGC 7640 | H | H | 48.1 | 5.64 | 36.84 | 3.39 | U | 34.51 | ||
| NGC 7741 | SBcd | H | 29.4 | 4.78 | 37.91 | 1.46 | U | 34.70 | ||
| NGC 7798 | S | j H | 75.1 | 6.42 | 38.64 | 2.37 | I | C | 35.64 | 36.54 |
Column description: (1) source name; (2) morphological galaxy type taken from RC3 (de Vaucouleurs et al., 1991); (3) optical spectroscopic classification based on BPT diagrams and from the literature. H=Hii, S=Seyfert, L=LINER, and ALG=Absorption line galaxy. ‘j H’ marks the jetted Hii galaxies and ‘RL’ identifies the RL AGN; (4) stellar velocity dispersion () from Ho et al. (2009); (5) logarithm of BH mass () determined from (Tremaine et al., 2002) or from direct BH mass measurements (galaxies marked with ∗, van den Bosch 2016) ; (6) logarithm of [O iii] luminosities from Ho et al. (1997a) or from the literature (non corrected for extinction, see Paper II for references); (7) logarithm of Eddington ratio (/); (8) radio detection status: ‘I’ = detected and core identified; ‘U’ = undetected; ‘unI’ = detected but core unidentified; ‘I+unI’ = detected and core identified with additional unknown source(s) in the field; (9) radio morphological class: A = core/core–jet; B = one-sided jet; C = triple; D = doubled-lobed ; E = complex; (10)–(11) logarithm of radio core and total luminosities at 1.5 GHz (erg s-1). To convert the radio luminosities in erg s-1 to W Hz-1 at 1.5 GHz, an amount of +16.18 should be subtracted from log and log .