Modeling of CO ro-vibrational line emission of HD 141569
Abstract
HD 141569 is a Herbig Ae/Be star that straddles the boundary between the transition disks and debris disks. It is a low dust mass disk that reveals numerous structural elements (e.g. gaps and rings) that may point to young planets. It also exhibits a reservoir of CO gas observed at both millimeter and IR wavelengths. Previous observations (Goto et al., 2006) reported a possible asymmetry in the CO gas emission. Herein the IR ro-vibrational emission lines are analyzed and modeled both spectroscopically and spectroastrometrically. We find emission features from both 12CO and 13CO isotopologues heated to a temperature of approximately 200 K in the radial extent of 13 to 60 au. We do not see evidence of the previously reported asymmetry in CO emission, our results being consistent with a Keplerian, axisymmetric emitting region. This raises the question of whether the emission profile may be evolving in time, possibly as a result of an orbiting feature in the inner disk such as a planet.
1. Introduction
During the early stages of formation, stars are frequently surrounded by protoplanetary disks. These disk are shaped by a variety of factors, such as their host stars or planets that may form within them. Planets in the process of forming can affect the disk in potentially dramatic and observable ways, such as inducing gaps, spiral arms, and disk eccentricities (e.g. Kley & Dirksen 2006; Dong et al. 2015a, b). Observations of the gas and dust within these disks can give insight into the kind of processes at work in this early stage of stellar and planetary development.
Transition disks in particular are a subclass of interest. While protoplanetary disks create an IR excess, resulting from emission of the dust, transition disks lack a NIR excess. This is understood as a gap or cavity in the extent of the dust near the central star. It may also be the case, though it is not strictly necessary, that gas also is lacking in these regions. The cause of such observed gaps is the subject of ongoing research, both generally and for specific systems, with the most exciting explanation being a planet or planets in the act of formation (e.g. Strom et al. 1989; Najita et al. 2007, 2015; Espaillat et al. 2014; van der Marel et al. 2016).
Definitively detecting planets within disks has proven difficult, although recently a companion of PDS 70 was detected by Keppler et al. (2018) using the VLT instrument SPHERE. In general, direct imaging to identify high-mass planets and their circumplanetary disk (CPD) or envelope has been less successful than expected. As a result, there is a need for alternatives such as potential signposts that are more readily observable. Possible alternatives are indirect signatures of planet-disk interaction, such as the aforementioned gaps/holes in disks or spiral structure. However, these signposts can be generated by other mechanisms (e.g. photoevaporation and gravitational instability, respectively), so the direct detection of a massive companion is crucial in order to validate these signposts.
A complementary approach to detecting forming planets is through the line emission formed in their circimplanetary disks. Circumplanetary disks are intrinsically three-dimensional structures with complicated flow patterns (e.g., Tanigawa et al., 2012; Ayliffe & Bate, 2012; Gressel et al., 2013; Szulágyi et al., 2017). Simulations indicate the size of the disk can be anywhere from one-third to the full extent of the Hill sphere Quillen et al. (2004); Ayliffe & Bate (2009b, a); Martin & Lubow (2011); Szulágyi et al. (2014, 2016) with temperatures K in steady state (Szulágyi, 2017) and perhaps much higher during an outburst (Zhu, 2015). At these sizes and temperatures, ro-vibrational emission of CO in the NIR is detectable (e.g., Najita et al., 2003). An example of the potential of this method comes from HD 100546 (Brittain et al., 2019), where we have inferred the presence of the inner companion from a component of the ro-vibrational CO emission that varies relative to the stable hot band (i.e., , where is the upper vibrational state) emission. The variation of the observed Doppler shift and the spectroastrometric signal can be explained by an emission source in a Keplerian orbit near the edge of the disk gap. Here we present a similar study of the ro-vibrational CO emission emerging from HD 141569.
HD 141569 is a 5.9 Myr old (Wichittanakom et al., 2020) Herbig Ae/Be star 110.60.54 parsecs away (Gaia Collaboration et al., 2016, 2018). A low-mass transition disk on the cusp of becoming a debris disk, the disk in the system is a few hundred au in total extent (Weinberger et al., 1999; Wyatt et al., 2015). Observations in the (sub)millimeter show the gas extending to 270 au through rotational 12CO lines and dust to nearly 400 au using continuum emission (Di Folco et al., 2020). It also shows signs of belonging to the Boö group of stars in its photospheric abundances (Gray & Corbally, 1998). This group is marked by a depletion in refractory elements, indicating accretion of the surrounding disk material, which has undergone some degree of gas-dust separation, onto the star (e.g. King 1994; Murphy et al. 2015).
Various structural aspects have been observed, some of which show asymmetries. Marsh et al. (2002) noted a decrease in optical depth inside of 30 au based on mid-infrared imaging. The SED of HD 141569 indicates that the inner 10 au has been cleared (Malfait et al., 1998). Tightly wound, large-scale spirals with radii of a few hundred au were observed with the ACS on HST by Clampin et al. (2003), with both planets and tidal interactions from HD 141569’s stellar companions being put forth as possible causes. More recently Perrot et al. (2016) observed ring-like structures within 40 and 100 au using SPHERE. Observations with the STIS instrument on HST by Konishi et al. (2016) detected an additional component of the disk inward of, and separated by a gap from, those seen by Clampin et al. (2003). This component partially overlaps the inner region discussed by Marsh et al. (2002) and shows spiral structure at 120 au.
CO is one of the most abundant molecules in protoplanetary disks. While millimeter emission lines result from pure rotational transitions of CO which are sensitive to the cool gas, observations of the near infrared lines from ro-vibrational CO transitions are sensitive to the warm gas in the inner disk regions. Within the disk, the rotational population is determined by thermal excitation, while the vibration population is due to UV fluorescence from stellar irradiation (e.g. Brittain et al. 2007). These infrared emission features can provide useful information as to the distribution and physical properties of the gas within the disk. Previous studies of HD 141569 have observed the infrared CO ro-vibration emission to investigate the physical conditions and extent of the disk, such as inner/outer radii and temperature (e.g. Brittain & Rettig 2002; Brittain et al. 2003; Goto et al. 2006; Brittain et al. 2007; Thi et al. 2014; van der Plas et al. 2015).
More recent ALMA observations by Flaherty et al. (2016) using CO(3-2) and CO(1-0) emission determined an inner radius of 29 au. Imaging by Miley et al. (2018) of the midplane with ALMA using 13CO (2-1) emission found the gas to be asymmetrically distributed. They also found a midplane counterpart to a ring previously discovered in scattered light (Biller et al., 2015) at 220 au, and found the CO gas, particularly 13CO, extends to approximately the same region. Thus the size of the gas disk is smaller than the radial extent of the dust, which extends to 400 au (Clampin et al., 2003). This is highly unusual as the dust component of most disks is smaller than the gas disk. This is generally understood to be the result of the inward migration of dust due to gas drag. This population of dust that extends beyond the gas may indicate that it is second generation dust in keeping with the suggestion that HD 141569 bridges the transition from transition disk to debris disk.
The derived inclination of the disk of HD 141569 has varied somewhat with different observations. Near-infrared observations with the Hubble Space Telescope (HST) instrument NICMOS by Weinberger et al. (1999) found an inclination of . Optical images taken with HST instrument STIS by Mouillet et al. (2001) found . Observations using sub-millimeter facilities also found differing inclinations of (Submillimeter Array, CARMA; Flaherty et al. 2016) and (ALMA; White et al. 2016).
Investigations of the double-peaked CO ro-vibration lines in the disk of HD 141569 have shown a region deficient or entirely devoid of gas inside of 9-15 au (Goto et al., 2006; Brittain et al., 2007) and the CO emission likely results from a population of gas beyond 17 au with a rotational temperature 200 K (Brittain & Rettig, 2002; Brittain et al., 2003). Thi et al. (2014) found the gas of the inner region of the disk to be in the range of 100 to 300 K. This is cooler than is found for the near-infrared CO emission from many other transition disks such as HD 100546 (1000 K, Brittain et al. 2009), HD 97058 (1300, van der Plas et al. 2015), and HD 179218 (600-700 K, Brittain et al. 2018). An example of a disk with a more similar rotational temperature is Oph IRS 48 at 260 K (Brown et al., 2012).
A possible north-south asymmetry is observed in the spatially resolved ro-vibrational spectrum of CO. Goto et al. (2006) reported an inner hole size of 112 au using a distance of 108 pc based on Merín et al. (2004). Correcting for the current Gaia distance of 110 pc makes a marginal difference to the cavity radius (11.25 au). Such asymmetries may be caused by, for instance, giant planets which induce vortices (Hammer et al., 2017) or by an eccentric disk induced by a massive planet (Kley & Dirksen, 2006). These features may be useful in the discovery of planets as a way to differentiate from a transition disk cavity that is created by photoevaporation or grain growth. In the case of an eccentric disk induced by a massive planet, the orientation will precess very slowly ( 1∘ per 100 orbits, Kley & Dirksen 2006), and thus a resulting line asymmetry will be observable over decadal timescales.
In this paper we present high resolution (/ 75,000) M-band spectroscopy of HD 141569. We also measure the spectroastrometric signal of the emission lines. Spectroastrometry is a technique for determining spatial information via spectroscopic observations originally described by Beckers (1982) and Christy et al. (1983). Specifically it involves the measurement of the centroid of the PSF of the spectrum on the detector as a way of determining the center of light (in analogy to, for instance, center of mass) of the observed object. The presence of a close companion or rotating disk around a point-like star will shift the centroid away from the position of the central object in a characteristic pattern as a function of velocity. On longer timescales and with multiple observations, this technique can be used to identify variable features, including potential (proto-) planetary companions (Brittain et al., 2014, 2015, 2019) or disk winds (Whelan & Garcia, 2008; Pontoppidan et al., 2008, 2011). We compare the CO line profiles and CO temperature to previous observations, and use the spectroastrometric signal to test whether the emission is consistent with gas arising in Keplerian orbit.
2. Observations and Reductions
The data were obtained on April 19, 2017 between 11:59 and 16:05 UT with the iSHELL cross-dispersion echelle spectrograph at the Infrared Telescope Facility (IRTF) (Rayner et al., 2016). The date was chosen to ensure that the target CO emission lines would be shifted out of corresponding telluric absorption features. Observations used the M2 mode (16 orders with wavelength range 4.52-5.25 m; roughly 1910-2220 cm-1) with an ABBA nodding pattern which allowed us to combine the images in an A-B-B+A pattern so as to remove sky emission to first order. Seeing for the night was approximately 0′′.8-0′′.9. Targets included the science star HD 141569 in three sets, each of which was further separated into position angles (PAs) of 356∘ and 176∘ along the semi-major axis of the disk, and additional standard stars HR 6556 and HR 5793, the former standard associated with the first science set and the latter for the other two. Observations for HD 141569 were taken in 15 second exposures with four coadds at two position angles, 356∘ and 176∘, in each of the three sets for a total integration time of 180 minutes. The two position angles are necessary in order to correct any instrumental artifacts that may affect the spectroastrometric centroid measurement. Both standards were also observed with 15 second exposures and 4 coadds. Flats were taken after observations were completed for each target. The slit width in all cases was 0′′.375 providing a spectral resolution of 75,000. Information regarding the details of the observations are summarized in Table 1.
The obtained data were reduced using a standard procedure, described in Brittain et al. (2018). General reductions were carried out order-by-order using custom IDL code. The ABBA nodding in addition to removing sky emission also resulted in an A and B beam spectrum in each order. The A and B beams were individually fit to polynomials to rectify the order. After rectification, dispersion correction was applied using the Spectrum Synthesis Program (SSP) telluric atmospheric radiance model (Kunde & Maguire, 1974). Then the spectrum was extracted from a rectangular region by selecting high-signal rows of each beam and summing columns into new single-row elements to form each beam’s spectrum. Following this, the resulting A and B beams were combined. After reductions were complete for both the science target and the telluric standard to this point, the ratio of the two was taken to remove telluric features from the science target.
The wavelength calibration was refined after combining beams (using SSP) and after ratioing (using the standard) as necessary. In the event that any large scale variation in the continuum remained after telluric correction, a low-order polynomial was used to flatten the continuum.
In order to compare the fully reduced data with the model (described in section 4), which generates flux in physical units erg/s/cm2/cm-1, the data continuum level must be properly converted from the relative flux of the science-to-standard ratio. This requires knowledge of the continuum level of the star in the relevant wavelength range. For the case here, 4.6 m ALLWISE photometry (Wright et al., 2010; Cutri et al., 2013) was used, obtained through the VizieR database (Ochsenbein et al., 2000), yielding a continuum value of 1.86 erg/s/cm2/cm-1.
Centroid measurements were performed using the rectified orders generated before spectral extraction with MPFITEXPR, a part of the IDL code MPFIT (Markwardt, 2009), iteratively for each column of each beam. Here, a skewed Moffat function was used, of the form below:
| (1) |
| (2) |
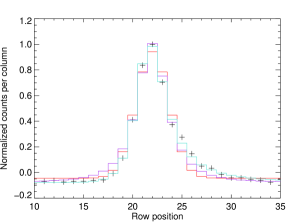
Where is the amplitude, is the center, is the half-width at half-maximum (HWHM), is the skew parameter, is controls with broadness of the wings, and is the zero-level of the function. The skewed Moffat function was used because a Gaussian was determined to not be as accurate a description of the shape of the point spread function (PSF; see Fig. 1 for comparison). An average PSF was determined using the regions of the continuum identified during the reduction process. The PSF was used to determine a “typical” fit as a basis for the fitting of the individual columns. Once the typical fit was found, all parameters were fixed except for those pertaining to the height and centroid position. The PSF for each column was then fit across the entirety of each beam. This was repeated for each position angle and order. An additional attempt was made to look for variation in the width of the PSF across the continnum and the emission features. However, no consistent variation across the spectrum was found. Any underlying variation requires higher signal-to-noise and resolution than were obtained here.
Artifacts that affect the measurement of the centroid of the spectrum may result from the instrument itself and must be corrected. This is accomplished by the rotation of the slit position during observations. Since the observed position angles have a 180∘ difference, the spectroastrometric signal is inverted in one compared to the other while any instrumental artifacts should remain unchanged. Thus averaging one position angle with the negative of the other removes these artifacts. (e.g. Whelan & Garcia 2008; Pontoppidan et al. 2008)
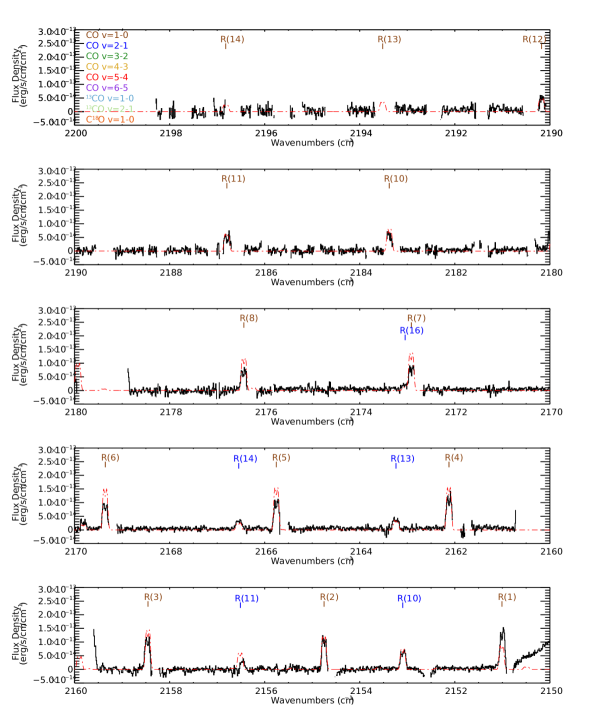
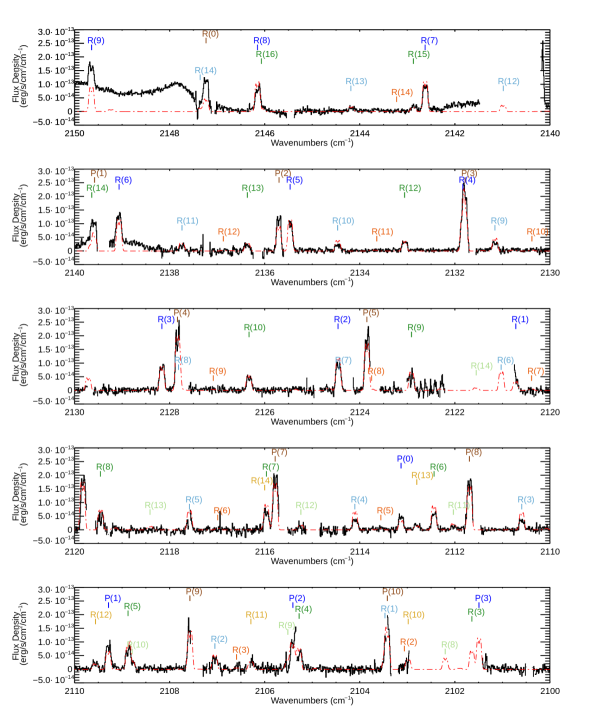
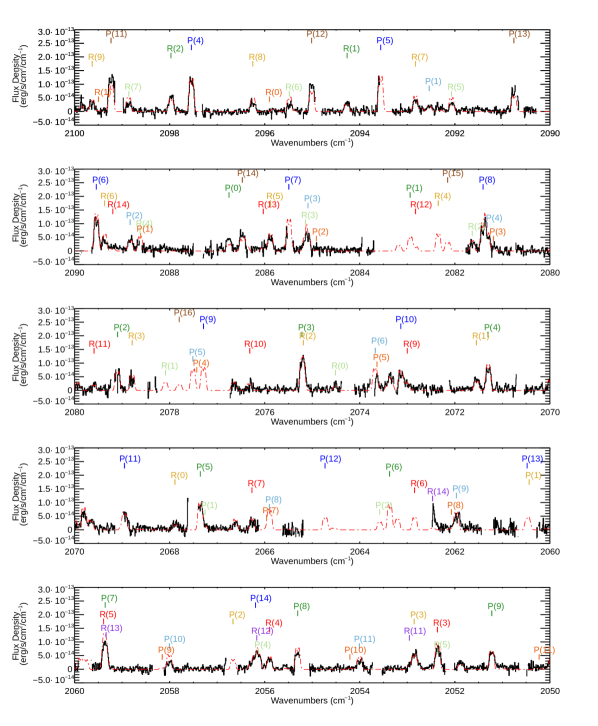
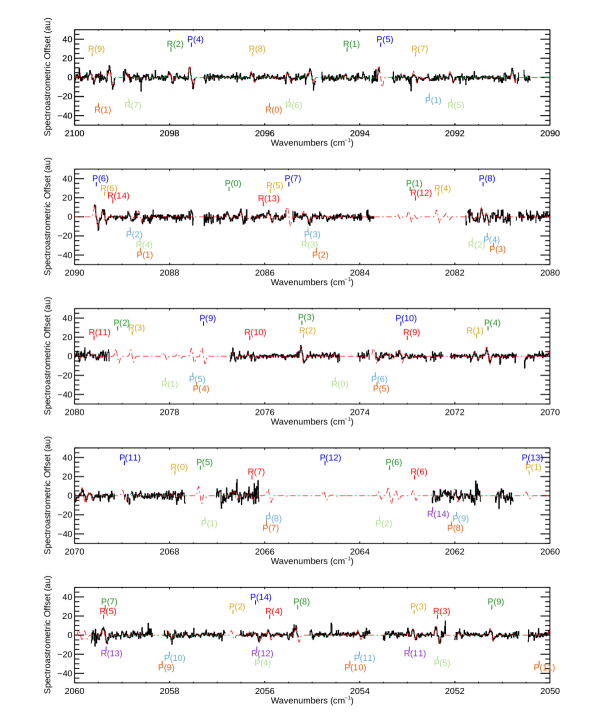
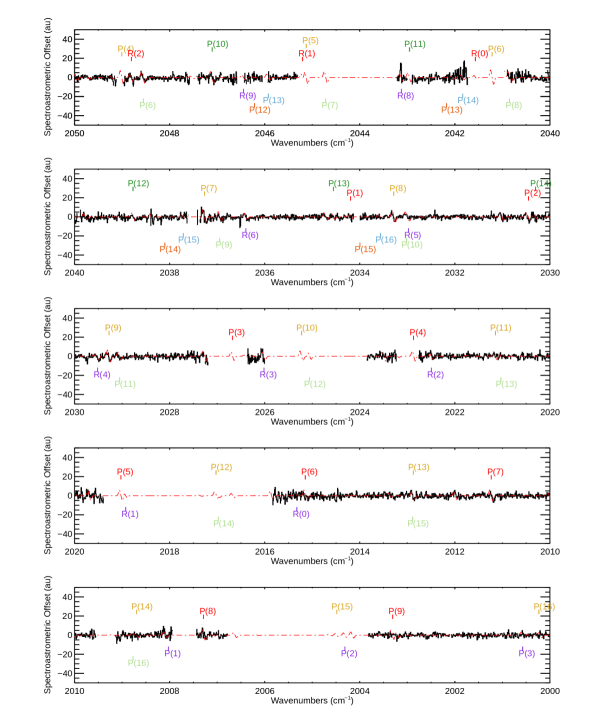
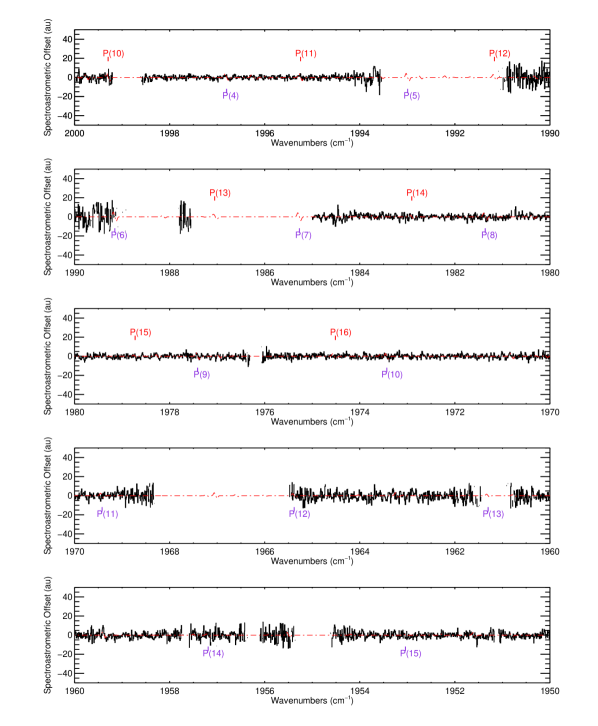
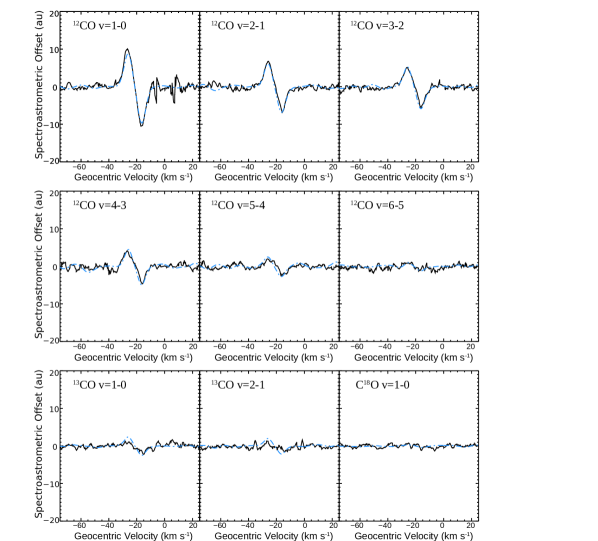
Once all three sets of data were reduced as described, the spectra and centroids were averaged together to create the final versions (Figs. 2, 3, 4, 5, 6, 7, 8, 9, 10, and 11).
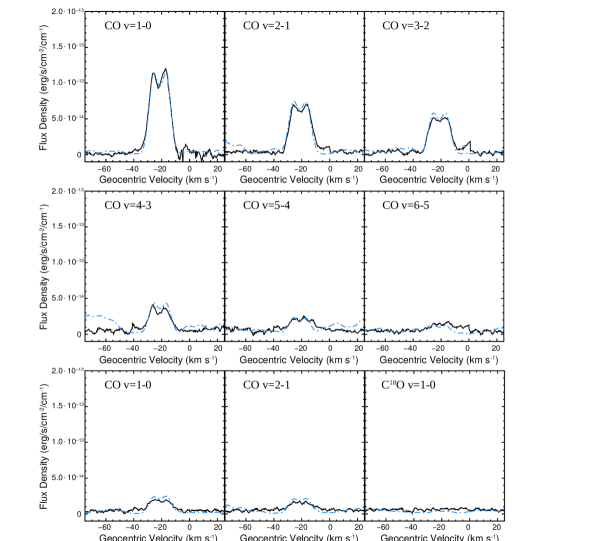
Spectral and spectroastrometric CO line profiles were created by stacking individual lines within each vibrational band in order to improve the signal-to-noise ratio. Figures 12 and 13 show the spectroscopic and spectroastrometric average profiles along with a model to be elaborated on in section 4.
3. Results
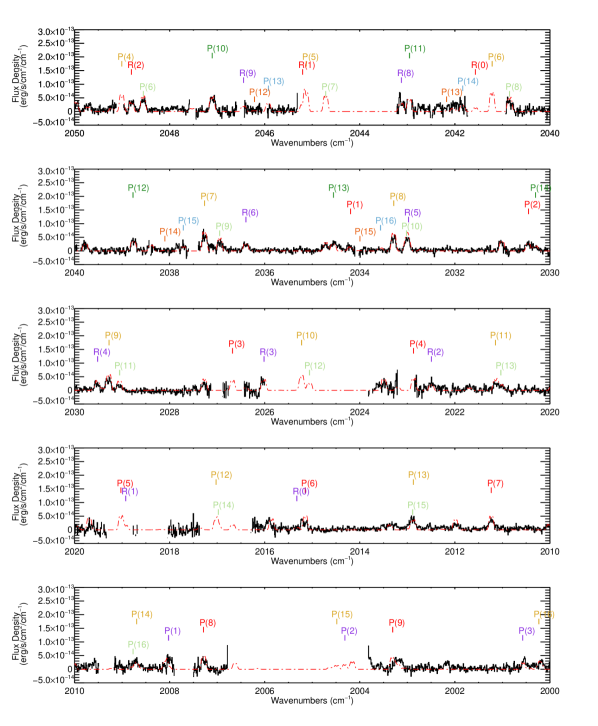
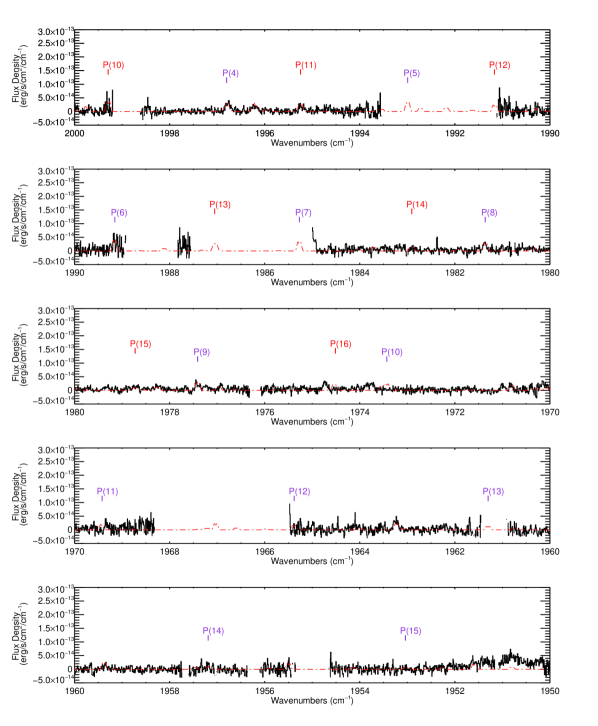
The wavenumber range from 1950 to 2200 cm-1 (approximately 4.5 to 5.1 m) was examined, which provides ample access to numerous CO ro-vibrational lines. This includes coverage of isotopolgues such as 13CO and C18O, though the latter was not observed here. The non-detection of C18O has previously been noted in ALMA observations by Miley et al. (2018), who suggested selective photodissociation for the isotopologue as a possible cause. Figures 2, 3, 4, 5, 6, 7, 8 9, 10, and 11 show the spectrum and centroid for HD 141569. The stronger 12CO v=1-0 and v=2-1 emission features show a clear double-peaked profile. 12CO lines from up to v=5-4 vibrational transitions are readily visible in the spectrum. A few v=6-5 and v=7-6 lines were found as well, though often with confounding aspects such as high local noise and possible blending with weak lines. Additional lines are also evident from 13CO v=1-0 and v=2-1 transitions. Any possible lines from additional CO isotopologues or vibrational bands are either too weak to identify reliably or are blended with much stronger features. When measuring the equivalent widths, lines were ignored if they showed signs of being strongly blended, or having lost significant portions to telluric absorption. The measured equivalent widths are shown in Table LABEL:tab:eqw_long.
The line profiles obtained by line stacking provide some immediate insight. These can be seen in Figure 12 for the spetroscopic profiles, and Figure 13 for the spectroastrometric profiles. The 12CO v=1-0 profile is symmetric. Depending on the adopted stellar mass, here the assumed range varies from 2 to 2.4 M⊙ in line with previous results such as those from Merín et al. (2004) and White et al. (2016), respectively, the wings at HWZI (10 km s-1) imply an inner edge to the emitting region of approximately 12-15 au, and the two peaks an outer edge of 50-90 au for Keplerian orbits.
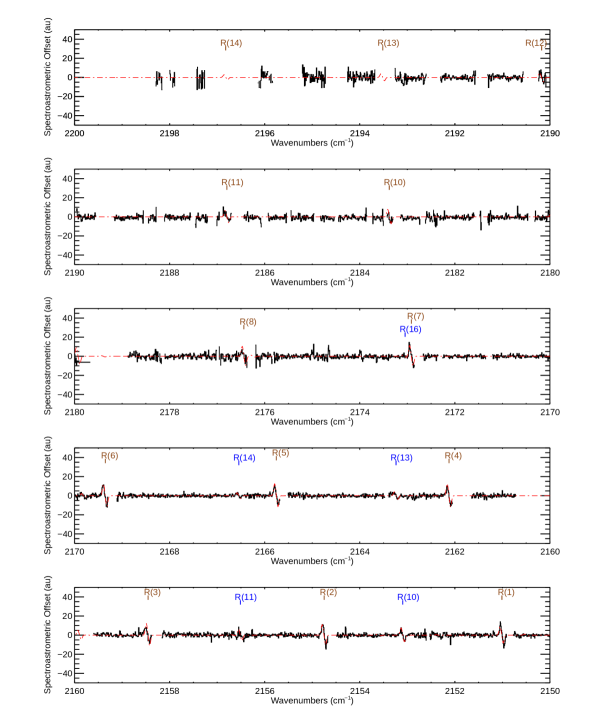
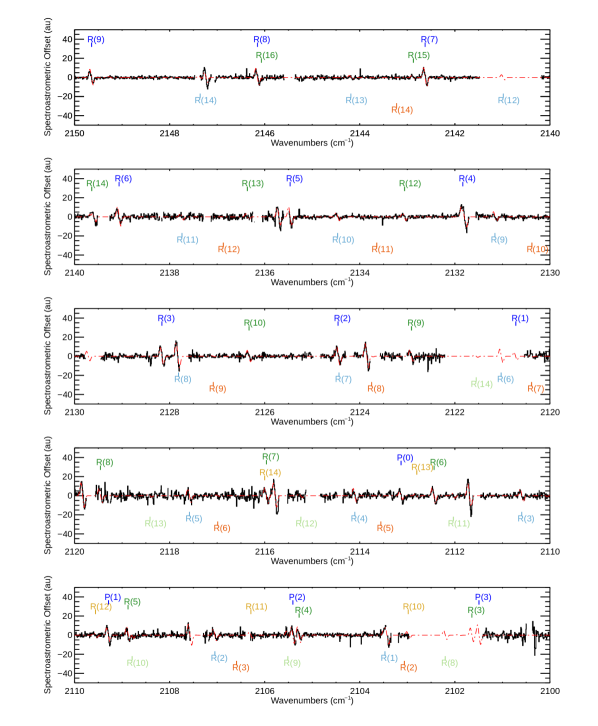
The spectroastrometric signal, from by-eye inspection of individual lines (Figures 7, 8, 9, 10, and 11), seems indicative of primarily or solely axisymmetric Keplerian rotation of the disk. This is reinforced, again through by-eye inspection, in the line stacking (Figure 13) which also produces the characteristic ”s”-shaped curve of differential rotation by an axisymmetric Keplerian disk.
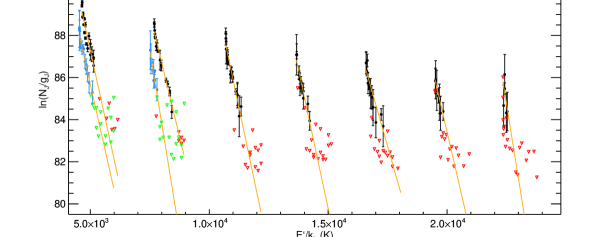
Assuming that the gas responsible for the observed emission is optically thin, the population of each level is related to the line flux by
| (3) |
where is the Planck constant, the speed of light, the wavenumber of the transition between states and , the Einstein coefficient, the population of state , and is the distance to the object. The relative population of the rotational levels is
| (4) |
where is the degeneracy of state , is the source population, is the energy of the upper level, is the Boltzmann constant, is the temperature, and is the partition function. This can be rearranged into a linear form such that
| (5) |
The vibrational lines follow a similar form.
For the linear fitting, we adopt the likelihood-based method of Kelly (2007) through the IDL code LINMIX_ERR due to its treatment of both measurement errors and upper limits. The results for majority of the vibrational bands observed for 12CO are consistent at approximately 200 K. However, the derived rotational temperature from the upper-limit-dominated v=7-6 band is highly uncertain. The results from all the fits are summarized in Table 3. The rotational fits are likewise shown in Figure 14.
The vibrational temperature, using simple linear regression with the results of the method of Kelly (2007), is 4540440 K. The high vibrational temperature compared to its rotational counterpart is indicative of UV fluorescence and consistent with the value of 5600800 K found by Brittain et al. (2007). The new result incorporates more lines at a higher resolution, which allows for better line separation and thus a smaller uncertainty in the vibrational temperature.
4. Modeling
In examining the spectrum of HD 141569, two separates models were used. The first is a 1+1D slab fluorescence model, of the kind used by Brittain et al. (2009), that generates CO emission features from a disk of given parameters. The disk itself is assumed to be Keplerian and axisymmetric in nature as well as vertically isothermal. The radial rotational temperature is described by a power law. A constant turbulent velocity was included for the material in the disk. The UV luminosity parameter, which determines the amount of ultraviolet emission from the star illuminating the disk, was also included to account for UV fluorescence in the disk. The relative fluxes of the isotopologues considered (12CO, 13CO, and C18O) are determined by scaling factors rather than explicitly taking into account effects such as selective dissociation or dust opacity (see, e.g., Brittain et al. 2007, 2009 for more details).
Parameters for the fluorescence model were iteratively determined by individual single-model runs as well as by minimization through running multiple models. Single-model instances were primarily used for rough determination of parameter space and incremental adjustments between automated runs. The minimization runs generated random combinations within the parameter space, compared the model results with the data, and returned the values and the best fit model spectrum and centroid. These results were used to inform parameter space adjustments and the process repeated.
Each minimization run allowed for variation of multiple parameters. Free parameters included inner and outer radii of emitting region, fiducial rotational temperature, the slope of the radial rotational temperature dependence , fiducial hydrogen density, slope of the radial hydrogen density dependence , UV luminosity, turbulence velocity, and number of layers, where fiducial parameters were taken as the relevant parameter value at 1 au and the -values are the power law indices for the radial distribution of the respective quantities. The UV luminosity is based on extinction corrected data from the International Ultraviolet Explorer (IUE) (Brittain et al. (2007) and references therein). The original data assumed a distance of 99 pc. In this paper, we adopt the distance inferred from Gaia measurements 110.6 pc (Gaia Collaboration et al., 2016, 2018) and the flux increased by twenty percent.
The number of layers was set to 7000, corresponding to a total column density of cm-2, at which point the gas grows optically thick to the UV radiation, for the material excited by UV emission along the star-disk line of sight. Accounting for the inclination of the disk, the column density along the observed line of sight is cm-2. Additional parameters were occasionally included, such as stellar mass, inclination, inner wall area, and disk PA relative to slit. These latter parameters were typically informed by various literature values or to assess their effect on the fit. The stellar mass was ultimately set at 2.39 M⊙, consistent with White et al. (2016), and the disk PA was set as aligned with the slit. The final inclination was fixed to 51∘, in line with Weinberger et al. (1999). In the case of minimization runs, the parameters were generated randomly within ranges based on values found in the literature, results of individual model iteration, and results of other minimization runs.
The final parameters include an emission region with 132 au and 605 au for the inner-outer radii, respectively, a fiducial rotational temperature of 4955 K at 1 au, and a temperature value of 0.2750.020. The full line list can be found in Table LABEL:tab:eqw_long. Average profiles for both the spectrum and spectroastrometric signal of the 12CO, 13CO, and C18O lines can be seen in Figs. 12 and 13.
The fluorescence model’s temperature profile as a function of radius dips below the average rotational temperature of 200 K, as can be seen in Fig. 16. This likewise would bring the annulus-averaged temperature well below that established temperature. However, as can be seen in Figs. 17 and 18 the majority of the emission is coming from the inner regions. When the temperature is weighted by the annuli luminosity, the average temperature is found to be 202 K.
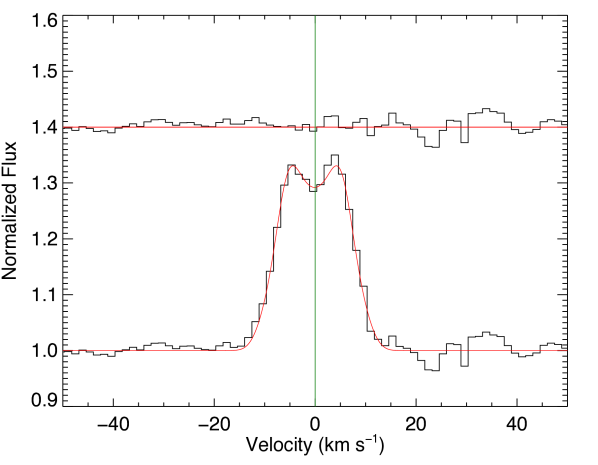
The line profiles of warm gas in a disk may be asymmetric for various reasons, including emission from a circumplanetary disk or emission from an eccentric disk (e.g. Kley & Dirksen 2006; Regály et al. 2011; Liskowsky et al. 2012). In order to further verify that there is no evidence of asymmetry in the line profile, a second model for eccentric disks was used. The eccentric disk model is much simpler than the fluorescence model previously described. The disk in this model has an eccentric inner rim, with the azimuthally averaged eccentricity decreasing with radius. The geometry of the disk (eccentricity profile, inner and outer radii), stellar mass, and radial intensity profile are the free parameters. Rather than generating an entire spectrum as in the fluorescence model only a single line profile in velocity space was produced per run. This profile was compared with the average profile from observations, with the final fit determined through minimization.
While the model itself does not capture the finer details of the physics of molecular emission, the resulting line profile is sufficient for investigating the possibility of disk eccentricity and allows for a more rapid exploration of the parameter space (hundreds of thousands or millions of runs compared to hundreds or thousands in the same time for the fluorescence model). From this we find an eccentricity upper limit of 0.02, while a sample model fit with eccentricity of 0 can be found in Figure 15. The disk geometry parameters are consistent with those found using the fluorescence model.
5. Discussion and Conclusions
The results presented here do not confirm the possible asymmetry noted by Goto et al. (2006). Our data indicates that any asymmetry at the time of the observations would be less than 5%. There are a few possibilities as to why an asymmetry may have been evident in previous data but not here. The first is that the previous asymmetry was not real. The cause may have been, for instance, artifacts in the original data.
Alternatively, it is possible that a source of asymmetric emission may have rotated in the disk over time. An eccentric disk induced by a giant planet has the ability to create an asymmetric emission profile. Though this is not consistent with the presented data as the precession of an eccentric disk is slow, on the order of 1∘ per 1000 orbits (Kley & Dirksen, 2006). There simply is not enough time for multiple orbits between the two observations.
If instead the original asymmetry were caused by the circumplanetary disk of a forming planet, then it would evolve on the planet’s orbital timescale. At the inner rim with a 12 year difference, such a feature would move more than 100∘. In principle this would allow it to become hidden behind the inner rim of the circumstellar disk, similar to the case of HD 100546. However, that the gas in the disk of HD 141569 is optically thin (with emission arising from an extended, tenuous upper layer, Brittain et al. 2007) renders this unlikely as it would still be visible. For instance, Thi et al. (2014) notes that the continuum emission is optically thin in both vertical and radial directions over a range of wavelengths, to the point that the SED was not dependent on the inclination. As such, it does not seem tenable that the molecular emission from a circumplanetary disk would be hidden by the inner edge of the circumstellar disk.
An additional possibility is that the asymmetry was caused by a vortex. Vortices can be created from something as simple as perturbations within the disk (e.g. Barranco & Marcus 2005) or may be induced by a planet near the inner rim of the disk (e.g. Espaillat et al. 2014). Additionally, these features can be dispersed fairly rapidly due to various factors such as elliptical instability (Lesur & Papaloizou, 2009; Barge et al., 2016), vertical shear (Barranco & Marcus, 2005), and dust feedback (Fu et al., 2014; Crnkovic-Rubsamen et al., 2015). The mechanism or mechanisms of dispersal will vary depending on the local conditions within the disk, as well as the vortex’s radial and vertical position and structure. A deteriorating or now-destroyed vortex could result in a loss of asymmetry as observed here. The rapidity of dissipation is a key point, and there is a wide range of lifetimes for vortices. One parameter that can affect this is the aspect ratio, a measure of elongation. For vortices with aspect ratios less than 4, dissipation can occur in less than an orbit. More elongated (aspect ratios larger than 10) can survive for hundreds of orbits. (e.g. Lesur & Papaloizou 2009). The formation of a vortex with the correct aspect ratio is a problem in and of itself. One might be created as a result of the influence of a massive planet, however it may also imply that the planet formed rapidly (Hammer et al., 2019).
It should be noted that a lack of direct evidence for a CPD does not imply the absence of a planet, as it may have finished accreting or entered a period of quiescence and thus be too dim to observe. A hypothetical planet may also be too small, or the surrounding disk may be too tenuous, for it to support a full CPD. Indeed, Di Folco et al. (2020) infer that the total mass of the circumstellar disk of HD 141569 is . However, inferences of disk masses are highly uncertain (e.g., Dong et al., 2018).
We have confirmed that the rotational temperature of CO gas is 200 K and a rotational temperature of 4500, consistent with previous results Brittain & Rettig (2002); Brittain et al. (2003, 2007); Thi et al. (2014). The difference in the two temperatures implies that the gas is UV fluoresced. The spectral and spectroastrometric profiles of the CO emission is consistent with Keplerian material in an axisymmetric disk. The possibility of non-axisymmetric structure is testable by additional observations at different position angles.
Acknowledgements
This publication makes use of data products from the Wide-field Infrared Survey Explorer, which is a joint project of the University of California, Los Angeles, and the Jet Propulsion Laboratory/California Institute of Technology, funded by the National Aeronautics and Space Administration.
This work has made use of data from the European Space Agency (ESA) mission Gaia (https://www.cosmos.esa.int/gaia), processed by the Gaia Data Processing and Analysis Consortium (DPAC, https://www.cosmos.esa.int/web/gaia/dpac/consortium). Funding for the DPAC has been provided by national institutions, in particular the institutions participating in the Gaia Multilateral Agreement.
These observations were obtained as visiting astronomers at the Infrared Telescope Facility, which is operated by the University of Hawaii under contract 80HQTR19D0030 with the National Aeronautics and Space Administration.
The authors would like to thank Jeffery Fung for his assistance and advice regarding the creation and destruction of vortices in disks.
References
- Ayliffe & Bate (2009a) Ayliffe, B. A., & Bate, M. R. 2009a, MNRAS, 397, 657
- Ayliffe & Bate (2009b) —. 2009b, MNRAS, 393, 49
- Ayliffe & Bate (2012) —. 2012, MNRAS, 427, 2597
- Barge et al. (2016) Barge, P., Richard, S., & Le Dizès, S. 2016, A&A, 592, A136
- Barranco & Marcus (2005) Barranco, J. A., & Marcus, P. S. 2005, ApJ, 623, 1157
- Beckers (1982) Beckers, J. M. 1982, Optica Acta, 29, 361
- Biller et al. (2015) Biller, B. A., Liu, M. C., Rice, K., et al. 2015, MNRAS, 450, 4446
- Brittain et al. (2018) Brittain, S. D., Carr, J. S., & Najita, J. R. 2018, PASP, 130, 074505
- Brittain et al. (2014) Brittain, S. D., Carr, J. S., Najita, J. R., Quanz, S. P., & Meyer, M. R. 2014, ApJ, 791, 136
- Brittain et al. (2009) Brittain, S. D., Najita, J. R., & Carr, J. S. 2009, ApJ, 702, 85
- Brittain et al. (2015) —. 2015, Ap&SS, 357, 54
- Brittain et al. (2019) —. 2019, ApJ, 883, 37
- Brittain & Rettig (2002) Brittain, S. D., & Rettig, T. W. 2002, Nature, 418, 57
- Brittain et al. (2003) Brittain, S. D., Rettig, T. W., Simon, T., et al. 2003, ApJ, 588, 535
- Brittain et al. (2007) Brittain, S. D., Simon, T., Najita, J. R., & Rettig, T. W. 2007, ApJ, 659, 685
- Brown et al. (2012) Brown, J. M., Herczeg, G. J., Pontoppidan, K. M., & van Dishoeck, E. F. 2012, ApJ, 744, 116
- Christy et al. (1983) Christy, J. W., Wellnitz, D. D., & Currie, D. G. 1983, Lowell Observatory Bulletin, 9, 28
- Clampin et al. (2003) Clampin, M., Krist, J. E., Ardila, D. R., et al. 2003, AJ, 126, 385
- Crnkovic-Rubsamen et al. (2015) Crnkovic-Rubsamen, I., Zhu, Z., & Stone, J. M. 2015, MNRAS, 450, 4285
- Cutri et al. (2013) Cutri, R. M., Wright, E. L., Conrow, T., et al. 2013, Explanatory Supplement to the AllWISE Data Release Products, Tech. rep.
- Di Folco et al. (2020) Di Folco, E., Péricaud, J., Dutrey, A., et al. 2020, A&A, 635, A94
- Dong et al. (2018) Dong, R., Najita, J. R., & Brittain, S. 2018, ApJ, 862, 103
- Dong et al. (2015a) Dong, R., Zhu, Z., Rafikov, R. R., & Stone, J. M. 2015a, ApJ, 809, L5
- Dong et al. (2015b) Dong, R., Zhu, Z., & Whitney, B. 2015b, ApJ, 809, 93
- Espaillat et al. (2014) Espaillat, C., Muzerolle, J., Najita, J., et al. 2014, in Protostars and Planets VI, ed. H. Beuther, R. S. Klessen, C. P. Dullemond, & T. Henning, 497
- Flaherty et al. (2016) Flaherty, K. M., Hughes, A. M., Andrews, S. M., et al. 2016, ApJ, 818, 97
- Fu et al. (2014) Fu, W., Li, H., Lubow, S., Li, S., & Liang, E. 2014, ApJ, 795, L39
- Gaia Collaboration et al. (2016) Gaia Collaboration, Prusti, T., de Bruijne, J. H. J., et al. 2016, A&A, 595, A1
- Gaia Collaboration et al. (2018) Gaia Collaboration, Brown, A. G. A., Vallenari, A., et al. 2018, A&A, 616, A1
- Goto et al. (2006) Goto, M., Usuda, T., Dullemond, C. P., et al. 2006, ApJ, 652, 758
- Gray & Corbally (1998) Gray, R. O., & Corbally, C. J. 1998, AJ, 116, 2530
- Gressel et al. (2013) Gressel, O., Nelson, R. P., Turner, N. J., & Ziegler, U. 2013, ApJ, 779, 59
- Hammer et al. (2017) Hammer, M., Kratter, K. M., & Lin, M.-K. 2017, MNRAS, 466, 3533
- Hammer et al. (2019) Hammer, M., Pinilla, P., Kratter, K. M., & Lin, M.-K. 2019, MNRAS, 482, 3609
- Kelly (2007) Kelly, B. C. 2007, ApJ, 665, 1489
- Keppler et al. (2018) Keppler, M., Benisty, M., Müller, A., et al. 2018, A&A, 617, A44
- King (1994) King, J. R. 1994, MNRAS, 269, 209
- Kley & Dirksen (2006) Kley, W., & Dirksen, G. 2006, A&A, 447, 369
- Konishi et al. (2016) Konishi, M., Grady, C. A., Schneider, G., et al. 2016, ApJ, 818, L23
- Kunde & Maguire (1974) Kunde, V. R., & Maguire, W. C. 1974, J. Quant. Spec. Radiat. Transf., 14, 803
- Lesur & Papaloizou (2009) Lesur, G., & Papaloizou, J. C. B. 2009, A&A, 498, 1
- Liskowsky et al. (2012) Liskowsky, J. P., Brittain, S. D., Najita, J. R., et al. 2012, ApJ, 760, 153
- Malfait et al. (1998) Malfait, K., Bogaert, E., & Waelkens, C. 1998, A&A, 331, 211
- Markwardt (2009) Markwardt, C. B. 2009, in Astronomical Society of the Pacific Conference Series, Vol. 411, Astronomical Data Analysis Software and Systems XVIII, ed. D. A. Bohlender, D. Durand, & P. Dowler, 251
- Marsh et al. (2002) Marsh, K. A., Silverstone, M. D., Becklin, E. E., et al. 2002, ApJ, 573, 425
- Martin & Lubow (2011) Martin, R. G., & Lubow, S. H. 2011, ApJ, 740, L6
- Merín et al. (2004) Merín, B., Montesinos, B., Eiroa, C., et al. 2004, A&A, 419, 301
- Miley et al. (2018) Miley, J. M., Panić, O., Wyatt, M., & Kennedy, G. M. 2018, A&A, 615, L10
- Mouillet et al. (2001) Mouillet, D., Lagrange, A. M., Augereau, J. C., & Ménard, F. 2001, A&A, 372, L61
- Murphy et al. (2015) Murphy, S. J., Corbally, C. J., Gray, R. O., et al. 2015, Publications of the Astronomical Society of Australia, 32, e036
- Najita et al. (2003) Najita, J., Carr, J. S., & Mathieu, R. D. 2003, ApJ, 589, 931
- Najita et al. (2015) Najita, J. R., Andrews, S. M., & Muzerolle, J. 2015, MNRAS, 450, 3559
- Najita et al. (2007) Najita, J. R., Strom, S. E., & Muzerolle, J. 2007, MNRAS, 378, 369
- Ochsenbein et al. (2000) Ochsenbein, F., Bauer, P., & Marcout, J. 2000, A&AS, 143, 23
- Perrot et al. (2016) Perrot, C., Boccaletti, A., Pantin, E., et al. 2016, A&A, 590, L7
- Pontoppidan et al. (2011) Pontoppidan, K. M., Blake, G. A., & Smette, A. 2011, ApJ, 733, 84
- Pontoppidan et al. (2008) Pontoppidan, K. M., Blake, G. A., van Dishoeck, E. F., et al. 2008, ApJ, 684, 1323
- Quillen et al. (2004) Quillen, A. C., Blackman, E. G., Frank, A., & Varnière, P. 2004, ApJ, 612, L137
- Rayner et al. (2016) Rayner, J., Tokunaga, A., Jaffe, D., et al. 2016, in Society of Photo-Optical Instrumentation Engineers (SPIE) Conference Series, Vol. 9908, Ground-based and Airborne Instrumentation for Astronomy VI, 990884
- Regály et al. (2011) Regály, Z., Sándor, Z., Dullemond, C. P., & Kiss, L. L. 2011, A&A, 528, A93
- Strom et al. (1989) Strom, K. M., Strom, S. E., Edwards, S., Cabrit, S., & Skrutskie, M. F. 1989, AJ, 97, 1451
- Szulágyi (2017) Szulágyi, J. 2017, ApJ, 842, 103
- Szulágyi et al. (2016) Szulágyi, J., Masset, F., Lega, E., et al. 2016, MNRAS, 460, 2853
- Szulágyi et al. (2017) Szulágyi, J., Mayer, L., & Quinn, T. 2017, MNRAS, 464, 3158
- Szulágyi et al. (2014) Szulágyi, J., Morbidelli, A., Crida, A., & Masset, F. 2014, ApJ, 782, 65
- Tanigawa et al. (2012) Tanigawa, T., Ohtsuki, K., & Machida, M. N. 2012, ApJ, 747, 47
- Thi et al. (2014) Thi, W. F., Pinte, C., Pantin, E., et al. 2014, A&A, 561, A50
- van der Marel et al. (2016) van der Marel, N., Verhaar, B. W., van Terwisga, S., et al. 2016, A&A, 592, A126
- van der Plas et al. (2015) van der Plas, G., van den Ancker, M. E., Waters, L. B. F. M., & Dominik, C. 2015, A&A, 574, A75
- Weinberger et al. (1999) Weinberger, A. J., Becklin, E. E., Schneider, G., et al. 1999, ApJ, 525, L53
- Whelan & Garcia (2008) Whelan, E., & Garcia, P. 2008, Spectro-astrometry: The Method, its Limitations, and Applications, ed. F. Bacciotti, L. Testi, & E. Whelan, 123
- White et al. (2016) White, J. A., Boley, A. C., Hughes, A. M., et al. 2016, ApJ, 829, 6
- Wichittanakom et al. (2020) Wichittanakom, C., Oudmaijer, R. D., Fairlamb, J. R., et al. 2020, MNRAS, 493, 234
- Wright et al. (2010) Wright, E. L., Eisenhardt, P. R. M., Mainzer, A. K., et al. 2010, AJ, 140, 1868
- Wyatt et al. (2015) Wyatt, M. C., Panić, O., Kennedy, G. M., & Matrà, L. 2015, Ap&SS, 357, 103
- Zhu (2015) Zhu, Z. 2015, ApJ, 799, 16


| Date | April 19, 2017 |
|---|---|
| Seeing | 0.8-0.9″ |
| Position angles | 356∘, 176∘ |
| Int. time (HD 141569) | 180 min |
| Int. time (HR 6556) | 6 min |
| Int. time (HR 5793) | 10 min |
| Line ID | Wavenumber | Equivalent width |
|---|---|---|
| (cm-1) | (cm-1) | |
| 1-0 R(12) | 2190.02 | |
| 1-0 R(10) | 2183.22 | |
| 1-0 R(8) | 2176.28 | |
| 1-0 R(7) | 2172.76 | |
| 1-0 R(6) | 2169.20 | |
| 1-0 R(5) | 2165.60 | |
| 1-0 R(4) | 2161.97 | |
| 1-0 R(2) | 2154.60 | |
| 1-0 R(1) | 2150.86 | |
| 1-0 P(2) | 2135.55 | |
| 1-0 P(5) | 2123.70 | |
| 1-0 P(6) | 2119.68 | |
| 1-0 P(7) | 2115.63 | |
| 1-0 P(8) | 2111.54 | |
| 1-0 P(11) | 2099.08 | |
| 1-0 P(12) | 2094.86 | |
| 1-0 P(13) | 2090.61 | |
| 1-0 P(14) | 2086.32 | |
| 1-0 P(17) | 2073.26 | |
| 1-0 P(20) | 2059.91 | |
| 1-0 P(21) | 2055.40 | |
| 1-0 P(22) | 2050.85 | |
| 1-0 P(23) | 2046.28 | |
| 1-0 P(24) | 2041.67 | |
| 2-1 R(20) | 2188.49 | |
| 2-1 R(19) | 2185.45 | |
| 2-1 R(18) | 2182.36 | |
| 2-1 R(15) | 2172.89 | |
| 2-1 R(14) | 2169.66 | |
| 2-1 R(13) | 2166.39 | |
| 2-1 R(12) | 2163.08 | |
| 2-1 R(9) | 2152.94 | |
| 2-1 R(8) | 2149.49 | |
| 2-1 R(6) | 2142.47 | |
| 2-1 R(5) | 2138.91 | |
| 2-1 R(4) | 2135.31 | |
| 2-1 R(2) | 2128.01 | |
| 2-1 R(0) | 2120.57 | |
| 2-1 P(1) | 2112.98 | |
| 2-1 P(2) | 2109.14 | |
| 2-1 P(3) | 2105.26 | |
| 2-1 P(5) | 2097.39 | |
| 2-1 P(6) | 2093.41 | |
| 2-1 P(7) | 2089.39 | |
| 2-1 P(11) | 2072.99 | |
| 2-1 P(16) | 2051.73 | |
| 2-1 P(20) | 2034.14 | |
| 2-1 P(21) | 2029.66 | |
| 3-2 R(22) | 2167.25 | |
| 3-2 R(21) | 2164.31 | |
| 3-2 R(20) | 2161.34 | |
| 3-2 R(18) | 2155.28 | |
| 3-2 R(17) | 2152.20 | |
| 3-2 R(16) | 2149.08 | |
| 3-2 R(14) | 2142.72 | |
| 3-2 R(12) | 2136.21 | |
| 3-2 R(11) | 2132.91 | |
| 3-2 R(10) | 2129.56 | |
| 3-2 R(9) | 2126.18 | |
| 3-2 R(8) | 2122.76 | |
| 3-2 R(7) | 2119.30 | |
| 3-2 R(5) | 2112.29 | |
| 3-2 R(4) | 2108.72 | |
| 3-2 R(3) | 2105.13 | |
| 3-2 R(1) | 2097.82 | |
| 3-2 R(0) | 2094.12 | |
| 3-2 P(1) | 2086.60 | |
| 3-2 P(3) | 2078.95 | |
| 3-2 P(5) | 2071.15 | |
| 3-2 P(6) | 2067.21 | |
| 3-2 P(9) | 2055.16 | |
| 3-2 P(10) | 2051.08 | |
| 3-2 P(11) | 2046.96 | |
| 3-2 P(14) | 2034.41 | |
| 3-2 P(15) | 2030.16 | |
| 3-2 P(17) | 2021.56 | |
| 3-2 P(20) | 2008.42 | |
| 3-2 P(21) | 2003.98 | |
| 3-2 P(22) | 1999.50 | |
| 3-2 P(23) | 1994.99 | |
| 3-2 P(24) | 1990.45 | |
| 4-3 R(21) | 2137.20 | |
| 4-3 R(19) | 2131.29 | |
| 4-3 R(18) | 2128.27 | |
| 4-3 R(17) | 2125.22 | |
| 4-3 R(16) | 2122.14 | |
| 4-3 R(15) | 2119.01 | |
| 4-3 R(13) | 2112.65 | |
| 4-3 R(12) | 2109.41 | |
| 4-3 R(11) | 2106.14 | |
| 4-3 R(10) | 2102.83 | |
| 4-3 R(9) | 2099.48 | |
| 4-3 R(8) | 2096.10 | |
| 4-3 R(7) | 2092.68 | |
| 4-3 R(6) | 2089.22 | |
| 4-3 R(5) | 2085.73 | |
| 4-3 R(3) | 2078.64 | |
| 4-3 R(1) | 2071.40 | |
| 4-3 R(0) | 2067.74 | |
| 4-3 P(3) | 2052.71 | |
| 4-3 P(7) | 2037.12 | |
| 4-3 P(8) | 2033.14 | |
| 4-3 P(9) | 2029.13 | |
| 4-3 P(11) | 2021.00 | |
| 4-3 P(15) | 2004.34 | |
| 4-3 P(16) | 2000.09 | |
| 4-3 P(17) | 1995.81 | |
| 4-3 P(20) | 1982.78 | |
| 4-3 P(21) | 1978.37 | |
| 4-3 P(22) | 1973.93 | |
| 4-3 P(23) | 1969.45 | |
| 4-3 P(24) | 1964.95 | |
| 5-4 R(21) | 2110.15 | |
| 5-4 R(19) | 2104.31 | |
| 5-4 R(17) | 2098.32 | |
| 5-4 R(16) | 2095.26 | |
| 5-4 R(15) | 2092.17 | |
| 5-4 R(14) | 2089.05 | |
| 5-4 R(13) | 2085.88 | |
| 5-4 R(11) | 2079.44 | |
| 5-4 R(10) | 2076.17 | |
| 5-4 R(9) | 2072.85 | |
| 5-4 R(8) | 2069.51 | |
| 5-4 R(7) | 2066.12 | |
| 5-4 R(4) | 2055.75 | |
| 5-4 R(3) | 2052.22 | |
| 5-4 R(2) | 2048.66 | |
| 5-4 P(1) | 2034.05 | |
| 5-4 P(2) | 2030.31 | |
| 5-4 P(6) | 2015.00 | |
| 5-4 P(7) | 2011.09 | |
| 5-4 P(8) | 2007.14 | |
| 5-4 P(9) | 2003.17 | |
| 5-4 P(10) | 1999.15 | |
| 5-4 P(11) | 1995.10 | |
| 5-4 P(14) | 1982.76 | |
| 5-4 P(15) | 1978.58 | |
| 5-4 P(16) | 1974.37 | |
| 5-4 P(17) | 1970.13 | |
| 5-4 P(19) | 1961.54 | |
| 5-4 P(20) | 1957.20 | |
| 5-4 P(21) | 1952.82 | |
| 6-5 R(22) | 2086.00 | |
| 6-5 R(20) | 2080.31 | |
| 6-5 R(18) | 2074.46 | |
| 6-5 R(17) | 2071.48 | |
| 6-5 R(16) | 2068.46 | |
| 6-5 R(15) | 2065.41 | |
| 6-5 R(14) | 2062.32 | |
| 6-5 R(11) | 2052.81 | |
| 6-5 R(10) | 2049.57 | |
| 6-5 R(8) | 2042.98 | |
| 6-5 R(7) | 2039.63 | |
| 6-5 R(6) | 2036.25 | |
| 6-5 R(2) | 2022.35 | |
| 6-5 R(0) | 2015.18 | |
| 6-5 P(2) | 2004.17 | |
| 6-5 P(3) | 2000.43 | |
| 6-5 P(4) | 1996.66 | |
| 6-5 P(6) | 1989.01 | |
| 6-5 P(9) | 1977.27 | |
| 6-5 P(10) | 1973.29 | |
| 6-5 P(11) | 1969.28 | |
| 6-5 P(12) | 1965.24 | |
| 6-5 P(14) | 1957.05 | |
| 6-5 P(15) | 1952.90 | |
| 7-6 R(22) | 2059.06 | |
| 7-6 R(21) | 2056.27 | |
| 7-6 R(19) | 2050.57 | |
| 7-6 R(18) | 2047.66 | |
| 7-6 R(16) | 2041.73 | |
| 7-6 R(15) | 2038.71 | |
| 7-6 R(14) | 2035.66 | |
| 7-6 R(13) | 2032.56 | |
| 7-6 R(11) | 2026.26 | |
| 7-6 R(9) | 2019.81 | |
| 7-6 R(7) | 2013.22 | |
| 7-6 R(6) | 2009.87 | |
| 7-6 R(4) | 2003.06 | |
| 7-6 R(3) | 1999.60 | |
| 7-6 R(2) | 1996.11 | |
| 7-6 R(0) | 1989.01 | |
| 7-6 P(1) | 1981.78 | |
| 7-6 P(2) | 1978.11 | |
| 7-6 P(3) | 1974.40 | |
| 7-6 P(4) | 1970.66 | |
| 7-6 P(6) | 1963.08 | |
| 7-6 P(7) | 1959.24 | |
| 7-6 P(8) | 1955.36 | |
| 7-6 P(9) | 1951.45 | |
| (13)1-0 R(22) | 2171.31 | |
| (13)1-0 R(21) | 2168.42 | |
| (13)1-0 R(19) | 2162.54 | |
| (13)1-0 R(17) | 2156.51 | |
| (13)1-0 R(16) | 2153.44 | |
| (13)1-0 R(15) | 2150.34 | |
| (13)1-0 R(13) | 2144.03 | |
| (13)1-0 R(11) | 2137.59 | |
| (13)1-0 R(9) | 2131.00 | |
| (13)1-0 R(5) | 2117.43 | |
| (13)1-0 R(4) | 2113.95 | |
| (13)1-0 R(3) | 2110.44 | |
| (13)1-0 R(2) | 2106.90 | |
| (13)1-0 R(0) | 2099.71 | |
| (13)1-0 P(1) | 2092.39 | |
| (13)1-0 P(2) | 2088.68 | |
| (13)1-0 P(7) | 2069.66 | |
| (13)1-0 P(9) | 2061.82 | |
| (13)1-0 P(10) | 2057.86 | |
| (13)1-0 P(11) | 2053.86 | |
| (13)1-0 P(12) | 2049.83 | |
| (13)1-0 P(14) | 2041.69 | |
| (13)1-0 P(15) | 2037.57 | |
| (13)1-0 P(16) | 2033.42 | |
| (13)1-0 P(17) | 2029.24 | |
| (13)1-0 P(19) | 2020.78 | |
| (13)1-0 P(21) | 2012.21 | |
| (13)1-0 P(22) | 2007.88 | |
| (13)1-0 P(23) | 2003.51 | |
| (13)1-0 P(24) | 1999.12 | |
| (13)2-1 R(21) | 2142.39 | |
| (13)2-1 R(19) | 2136.57 | |
| (13)2-1 R(18) | 2133.60 | |
| (13)2-1 R(17) | 2130.61 | |
| (13)2-1 R(15) | 2124.50 | |
| (13)2-1 R(13) | 2118.26 | |
| (13)2-1 R(12) | 2115.09 | |
| (13)2-1 R(11) | 2111.88 | |
| (13)2-1 R(9) | 2105.36 | |
| (13)2-1 R(7) | 2098.71 | |
| (13)2-1 R(6) | 2095.33 | |
| (13)2-1 R(5) | 2091.92 | |
| (13)2-1 R(2) | 2081.49 | |
| (13)2-1 R(0) | 2074.36 | |
| (13)2-1 P(6) | 2048.41 | |
| (13)2-1 P(8) | 2040.70 | |
| (13)2-1 P(9) | 2036.80 | |
| (13)2-1 P(11) | 2028.91 | |
| (13)2-1 P(13) | 2020.89 | |
| (13)2-1 P(18) | 2000.30 | |
| (13)2-1 P(19) | 1996.09 | |
| (13)2-1 P(21) | 1987.58 | |
| (13)2-1 P(22) | 1983.28 | |
| (13)2-1 P(23) | 1978.95 | |
| (13)2-1 P(24) | 1974.59 |
| Ro-vibrational | Temperature |
|---|---|
| band | (K) |
| 12CO v=1-0 | 19525 |
| 12CO v=2-1 | 21713 |
| 12CO v=3-2 | 19316 |
| 12CO v=4-3 | 19630 |
| 12CO v=5-4 | 25147 |
| 12CO v=6-5 | 219116 |
| 12CO v=7-6 | 149587 |
| 13CO v=1-0 | 20928 |
| 13CO v=2-1 | 14442 |
| 12CO Vibrational | 4537436 |
| Parameter | Value |
|---|---|
| Fixed | |
| M⋆ | 2.39 M⊙ |
| Lrel | 1.2 |
| 51∘ | |
| -21.4 km/s | |
| Varied | |
| Rin | 132 au |
| Rout | 605 au |
| Trot,0 | 4955 K |
| 0.2750.020 | |
| vturb | 2.5 0.5 km/s |
| Flare angle |