The effect of elastic strains on the adsorption energy of H, O, and OH in transition metals
Abstract
The influence of elastic strains on the adsorption of H, O, and OH on the (111) surfaces of 8 fcc (Ni, Cu, Pd, Ag, Pt, Au, Rh, Ir) and on the (0001) surfaces of 3 hcp (Co, Zn, Cd) transition metals was analyzed by means of density functional theory calculations. To this end, surface slabs were subjected to different strain states (uniaxial, biaxial, shear, and a combination of them) up to strains dictated by the mechanical stability limits indicated by phonon calculations. It was found that the adsorption energy followed the predictions of the d-band theory but -surprisingly- the variations in the adsorption energy only depended on the area of the adsorption hole and not on the particular elastic strain tensor applied to achieve this area. The analysis of the electronic structure showed that the applied strains did not modify the shape of Projected Density of State (PDOS) of the d-orbitals of the transition metals but only led to a shift in the energy levels. Moreover, the presence of the adsorbates on the surfaces led to negligible changes in the PDOS. Thus, the adsorption energies were a function of the Fermi energy which in turn was associated to the change of the area of the adsorption through a general linear law that was valid for all metals. The information in this paper allows the immediate and accurate estimation of the effect of any elastic strain on the adsorption energies of H, O, and OH in 11 transition metals with more than half-filled d-orbitals.
keywords:
Adsorption energy , Elastic strain engineering , Materials engineering , DFT , Catalysis.1 Introduction
The development of efficient and selective catalysts has been one of the keystones of technological progress in the last century [1]. Currently, most fossil fuels used in transportation are refined using catalytic processes [2, 3, 4], while a substantial fraction of chemical products are manufactured through technologies based on catalysis [5, 6, 7]. Additionally, catalysis is critical for the electrochemical processes necessary to generate clean energy or/and to produce clean fuels, such as hydrogen [8, 9]. In particular, hydrogen economy is based in two critical reactions that are account for the production of hydrogen and the generation of clean energy, the hydrogen evolution reaction (HER) and the oxygen reduction reaction (ORR), respectively [10, 11]. So far, Pt stands as the best catalyst for these reactions but its high cost and limited availability hinders the industrial application of this technology, leading to a search for cheaper and more widely available catalysts [12].
It is known that the rate limiting steps for both HER and ORR reactions are associated with the adsorption of intermediate species (H, O, and OH) onto the surface of the catalyst [13, 14]. These processes are controlled by the electronic structure of the catalysts, that can be modified using different techniques, e.g. addition of alloying elements, introduction of defects and/or surface orientation [15, 16, 17]. Another effective mechanism to modify the electronic structure is through the introduction of large elastic strains (1-3%) in the lattice [18, 19]. This strategy - denominated elastic strain engineering - opens the possibility to modify the electronic, optical, magnetic, and catalytic properties of solids through the systematic application of elastic strains [20, 21, 22, 23]. Moreover, recent experimental work has shown that much larger tensile elastic strains (close to the theoretical limit of 10%) can be attained in particular nanomaterials (such as nanoneedle diamond structures as well as carbon nanotubes) [24, 25] and metallization of diamond has been predicted at this strain level by means of first principles calculations [26]. It is obvious that dramatic changes in both the electronic structure and the catalytic properties of materials could be expected when the elastic strains approach the instability limit. However, this territory is unexplored due to the experimental difficulties associated with the application of such large elastic strains.
The effect of mechanical strains on the electronic properties of transition metals, which are the most important for the HER and ORR reactions, has been qualitatively analyzed by many authors [27, 28, 29, 30, 31, 32]. Their findings can be summarized in the so-called d-band center model [33, 34, 35], developed more than two decades ago. This model is based on the effective medium theory [36, 37] and the Newns-Anderson model [38, 39], and relates the adsorption energy to the change in the local electron density of the surface. The changes in the adsorption energy with mechanical strain in the d-band model are related to the change of the energy of the d-band center, , and the variation in the adsorption energy from one transition metal surface to another correlates with the upward shift of with respect to the Fermi level. A shift towards higher energies allows the formation of a larger number of empty anti-bonding states, leading to a stronger (more negative) binding energy. Even though the d-band model can be used to rationalize the influence of elastic strains in the catalytic activity, there is not a model to predict directly the adsorption energy as a function of the applied strain using .
In this investigation, the relationship between the applied elastic strain tensor and the adsorption energy of H, O, and OH on the surface of eleven transition metals is determined by means of density functional theory (DFT) calculations. A simple relationship between the area of the deformed surface hole where the adsorbates lay and the energy associated with the adsorption process is found for all metals. It was also determined that the adsorption energy only depends on the deformed area of the hole and is independent of the elastic strain tensor applied to achieve this area. Thus, variations in the adsorption energy with elastic strain could be obtained with very limited computational effort. Moreover, a linear relationship between the adsorption energy and the Fermi energy was also found for all metals, the slope indicating the sensitivity of each metal to change the catalytic properties through elastic strain engineering. This information is relevant as a first approach to provide a quantitative understanding of the application of elastic strain engineering to modulate the adsorption energy of transition metals and support the search for better catalysts.
2 Computational details
The DFT plane wave simulations were performed using the Quantum Espresso package [40]. The electron exchange-correlation was described using the generalized gradient approximation (GGA) with the Perdew-Burke-Ernzerhof (PBE) exchange-correlation functional [41] and the calculations were carried out using ultrasoft pseudopotentials. Brillouin zone calculations were performed using a Marzari-Vanderbit-DeVita-Payne cold smearing of 0.015 Ry [42]. The planewave basis was expanded to a cutoff energy of 80 Ry, and the Monkhorst-Pack k-points were sized () for the unit cells of all metals, and () for all slabs supercells. DFT calculations were performed for 11 transition metals from the groups 9th to 12th in the periodic table with either fcc (Rh, Ir, Ni, Pd, Pt, Cu, Ag, Au) or hcp (Co, Zn, Cd) structure. The corresponding equilibrium bulk lattice constants are shown in Tables S1 and S2 of the supporting information for fcc and hcp metals, respectively.
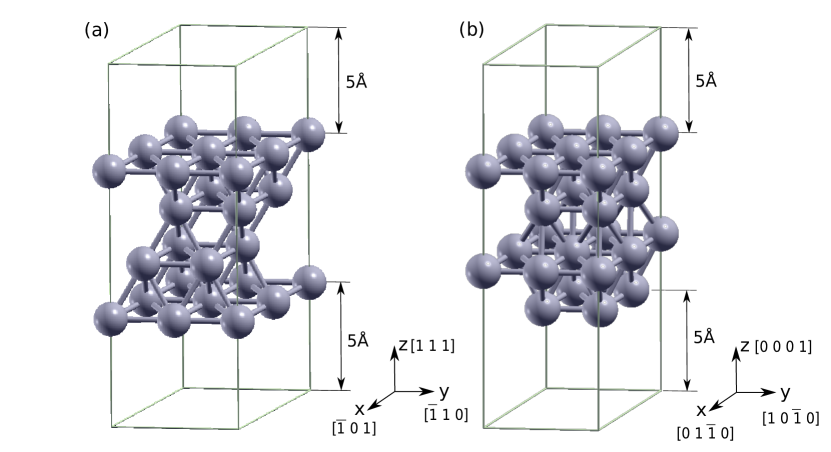
The adsorption of H, O, and OH was modeled on four-layer slabs with the (111) surface facet in the fcc metals and the (0001) surface facet in the hcp metals. These surfaces were selected because they present the lowest surface energy – and, thus, stand for the most stable ones – for each lattice [43]. The (2x2) slab supercells with four layers of atoms perpendicular to the surface were generated with the Atomic Simulation Environment (ASE) [44] from the equilibrium lattice parameters. The periodic slabs were separated by 10 Å of vacuum (Figure 1) in the direction perpendicular to the surface. Adsorption energies were calculated of each chemical specie assuming a coverage of 1/4 monolayers. All metal atoms in the top two layers of the slab and all adsorbed H, O, and OH were fully relaxed, while the positions of metal atoms in the bottom two layers were fixed. The adsorption energies of H in the case of Pt (111) surfaces were evaluated for slabs including 3, 4, and 5 atomic layers perpendicular to the surface and the results obtained with 4 and 5 layers were very close, indicating that 4 layers were enough to reach convergence. Moreover, simulations of H adsorption on Pt (111) surfaces carried with ultrasoft pseudopotentials were compared with those obtained using the projector augmented-wave method (PAW), which provides more accurate results [45, 46, 47, 48, 49] with higher computational cost. The differences in adsorption energies between both simulations were negligible. Thus, it was concluded that the combination of the PBE functional with an ultrasoft pseudopotential in four-layer surface slabs offered the best balance between accuracy and computational time.
The adsorption energy of atomic H and O was calculated as
| (1) |
where and stand for the total energies of the slab without and with the absorbate X which represents H and O, respectively. accounts for the total energy of the hydrogen and oxygen molecule in the gaseous state. It should be noted that the adsorption of O2 from a molecule of H2O (instead from O2) should be used to calculate the catalytic activity but the difference from both adsorption energies is given by constant that depends only on the formation energies of O2, H2 and H2O and is independent of the material of the slab and of the applied strain. Thus, isolated molecules of H2 and O2 were assumed to calculate the adsorption energies in this investigation.
The adsorption energy of OH was calculated as
| (2) |
where stands for the total energy of the slab with OH, and and account for the total energies of the hydrogen and water molecules in the gaseous state, respectively.
The metal surfaces in Figure 1 were subjected to normal and shear stresses in the surface plane. Mixed boundary conditions are imposed to solve the elastic problem in the DFT calculations. They include imposed strains in the slab plane and zero stresses on the free surface. The deformation gradient applied to the supercell was
| (3) |
where and stand for the normal strains along and directions while and for the shear distortion in the plane. Uniaxial deformation was applied when and = 0, while and for biaxial deformation.
In addition, the mechanical stability of surface slab supercells under strain was analyzed from the harmonic phonon spectrum using the Phonopy code [50]. To calculate the phonon spectrum, the atomic forces after perturbing slightly the atomic positions from the equilibrium positions were calculated for different strains in large slab supercells. They were obtained by repeating the basic slab supercells in Figure 1 by 2 times in the direction and two times in the direction, leading to supercells with 64 atoms. The number of perturbations to obtain the phonon spectrum depends on the symmetries of the supercell which in turn depend on the applied strain and can vary from 4 (no strain applied) to 24 (15% biaxial deformation). It should be noted that the phonon calculations are computationally very expensive and they were used to assess the maximum strain levels that should be explored in the adsorption calculations under normal and shear strains because mechanical instabilities are likely to appear well before these limits.
3 Results
3.1 Adsorption energies of H, O, and OH
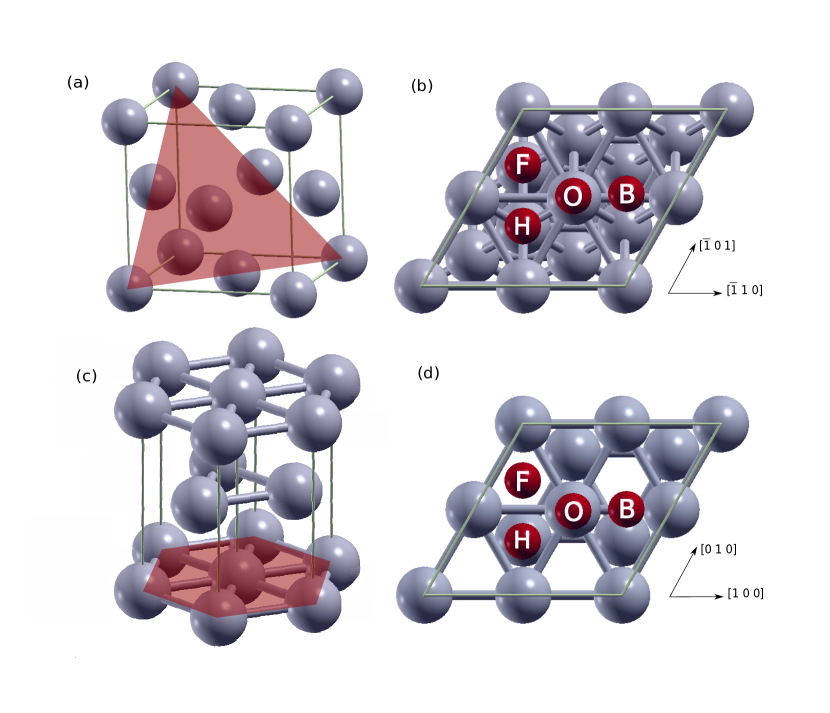
Adsorption energies were calculated in the absence of applied strains in all the available positions for all studied metals. The four possible positions in which H, O, and OH can be adsorbed onto the (111) fcc and the (0001) hcp surfaces are shown in figure 2(a-b) and (c-d), respectively. They are labeled H, F, O, and B in the figure and stand for the HCP, FCC, ONTOP, and BRIGDE positions on the surfaces, respectively. It was found that adsorbates at BRIDGE position diffused towards more favorable positions and they were omitted from this study. In the case of OH adsorption, the molecule was placed perpendicularly to the adsorption plane with the O atom closer to the surface.
The adsorption energies for H, O, and OH onto the surfaces are shown in Table 1 for the different adsorption sites. There are very large differences between the strongest (FCC) and the weakest (ONTOP) adsorption sites in many cases. For instance, the adsorption of oxygen onto nickel is associated with an energy of -3.13 eV in the FCC position but is reduced to -1.20 eV on the ONTOP site. On the contrary, the differences in adsorption energies between the FCC and HCP positions are much smaller. These trends are in agreement with previous experimental and theoretical results [13, 51, 52, 53]. For instance, the difference with the calculated adsorption energy of H/Co in [51] was only 0.03 eV and 0.23 eV in the case of OH/Cu adsorption [13]. Moreover, The FCC position was found to be the most favorable adsorption site (most negative energy) in the fcc metals while the FCC and HCP positions had very similar adsorption energies in the hcp metals. The ONTOP site presented the least favorable adsorption energy in all cases, except for Ir.
Regarding the different adsorbates, the adsorption process of O is always exothermic for the FCC and HCP positions whereas the adsorption of OH is an endothermic process in most cases (with the exception of Co) with positive adsorption energies. The adsorption energies for H are, in general, smaller in absolute values and can be endothermic or exothermic depending on the transition metal.
| System | FCC | HCP | ONTOP | System | FCC | HCP | ONTOP | System | FCC | HCP | ONTOP |
|---|---|---|---|---|---|---|---|---|---|---|---|
| H/Ni | -0.52 | -0.50 | 0.06 | O/Ni | -3.13 | -3.03 | -1.29 | OH/Ni | 0.03 | 0.57 | 1.04 |
| H/Cu | -0.25 | -0.23 | 0.39 | O/Cu | -2.68 | -2.54 | -0.82 | OH/Cu | 0.14 | 0.18 | 1.05 |
| H/Pd | -0.54 | -0.51 | -0.01 | O/Pd | -2.16 | -1.99 | -0.58 | OH/Pd | 0.71 | 0.85 | 1.64 |
| H/Ag | 0.17 | 0.18 | 0.73 | O/Ag | -1.38 | -1.27 | 0.13 | OH/Ag | 0.72 | 0.75 | 1.57 |
| H/Pt | -0.49 | -0.43 | -0.42 | O/Pt | -2.16 | -1.75 | -0.73 | OH/Pt | 1.19 | 1.50 | 1.91 |
| H/Au | 0.09 | 0.14 | 0.39 | O/Au | -0.98 | -0.72 | 0.50 | OH/Au | 1.52 | 1.58 | 2.22 |
| H/Rh | -0.53 | -0.53 | -0.25 | O/Rh | -2.96 | -2.84 | -1.55 | OH/Rh | 0.27 | 0.45 | 1.15 |
| H/Ir | -0.39 | -0.36 | -0.47 | O/Ir | -2.62 | -2.40 | -1.52 | OH/Ir | 0.76 | 0.98 | 1.29 |
| H/Co | -0.54 | -0.51 | 0.11 | O/Co | -3.34 | -3.42 | -1.97 | OH/Co | -0.13 | -0.2 | 0.55 |
| H/Zn | 0.70 | 0.67 | 0.81 | O/Zn | -2.53 | -2.62 | -2.59 | OH/Zn | 0.46 | 0.37 | — |
| H/Cd | 0.80 | 0.81 | 0.79 | O/Cd | -2.19 | -2.24 | -2.22 | OH/Cd | 0.36 | 0.31 | — |
3.2 Effect of elastic strain on the adsorption energies of H, O, and OH
3.2.1 Stability limits
The mechanical stability limits of fcc Cu and Pt slabs under biaxial tension and compression as well as pure shear were determined from the harmonic phonon spectra. Calculations were limited to 5%, 10%, and 15% biaxial strains in tension, -5% and -10% biaxial strains in compression, and 10% strain in shear because of the high computational cost. The phonon density of states spectra for the Pt and Cu slabs can be found in the supporting information (Figures S1 and S2). Negative frequencies appeared in the fcc slabs subjected to 15% biaxial tension in Pt and to 10% biaxial tension in Cu. Similarly, negative frequencies appeared in both metal surfaces at -10% biaxial compression or shear. In the case of the (0001) slabs of the hcp metals, it was found that that the order in the supercell was lost for small strains, indicating that the mechanical instabilities triggered by compressive or shear strains in (0001) hcp slabs develop sooner than in (111) fcc slabs.
Taking into account the theoretical values of the stability limits obtained with the phonon calculations, it was decided to explore the effect of elastic strains on the adsorption energies in the (111) fcc slabs up to 8% tensile strain, -5% compressive strain, and 4% shear strain. In the case of (0001) hcp slabs, only the effect of tensile strains (and of small compressive strains in particular cases) on the adsorption energy was analyzed.
3.2.2 Influence of mechanical strains on the optimum adsorption site
The effect of mechanical strains (either uniaxial, biaxial or shear) on the adsorption energies of H and O onto the different adsorption sites (FCC, HCP, ONTOP) were determined by DFT calculations in Pt. The results are plotted in Figure 3 for either uniaxial (, = 0) or biaxial (, = 0) deformations in the range -3% up to 8%, and for shear strains in the range 0% to 4% ( =0), in agreement with the limits indicated above.
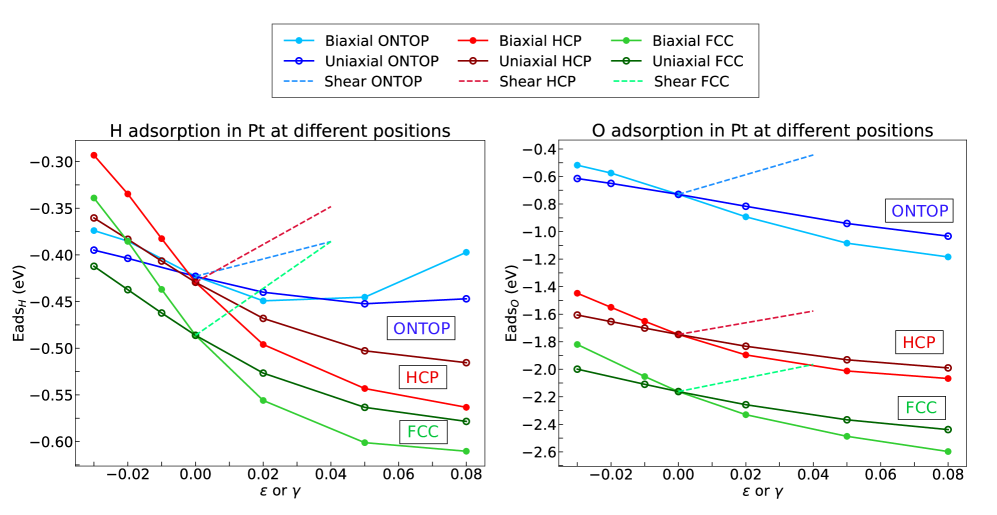
The same behavior can be observed for all the adsorption sites and adsorbates: compressive strains increase the adsorption energy (less negative and, therefore, adsorption is less favorable) while tensile strains lead to the opposite behavior. Moreover, the variation in adsorption energy with strain is always higher in the case of biaxial deformation. In addition, shear deformations behave as compressive deformations and increase the adsorption energy. The only exception to these trends is found in the adsorption energy of H onto the ONTOP position subjected to very large biaxial tensile strains ( 5%), which lead to a slight increase in the adsorption energy. This difference may be caused by the proximity to the instability limits of the slab at this strain.
The effect of mechanical strains on the adsorption energy of O is higher than that of H but it should be noted that the absolute values of the adsorption energies are also much higher in the former. In addition, the effect of mechanical strains is similar for all the adsorption sites for a given adsorbate. Thus, application of mechanical strains does not change the most favorable adsorption site for H and O in Pt, which is always FCC. Similar results were obtained for the (111) surfaces of other fcc metals, while the optimum adsorption site for (0001) surfaces of hcp metals is the HCP and it is also independent of the strain state.
3.2.3 Influence of mechanical strains on the adsorption energy of H, O and OH
The analysis of the influence of mechanical strains on the adsorption energy of H, O, and OH was focussed in the FCC sites of (111) fcc surfaces and in the HCP sites of the (0001) hcp surfaces, which are the most favorable locations for adsorption.
The effect of mechanical strain (either uniaxial, biaxial or shear) on the adsorption energies of H, O, and OH on the FCC sites of the (111) surfaces of eight fcc transition metals (Cu, Pt, Ni, Au, Ir, Rh, Pd, and Ag) is plotted in Figure 4. The corresponding results on the HCP sites of the (0001) surfaces are plotted for Co, Zn, and Cd in Figure 5. As indicated above, application of compressive and shear strains was restricted in hcp metals because of the development of instabilities in the supercell.
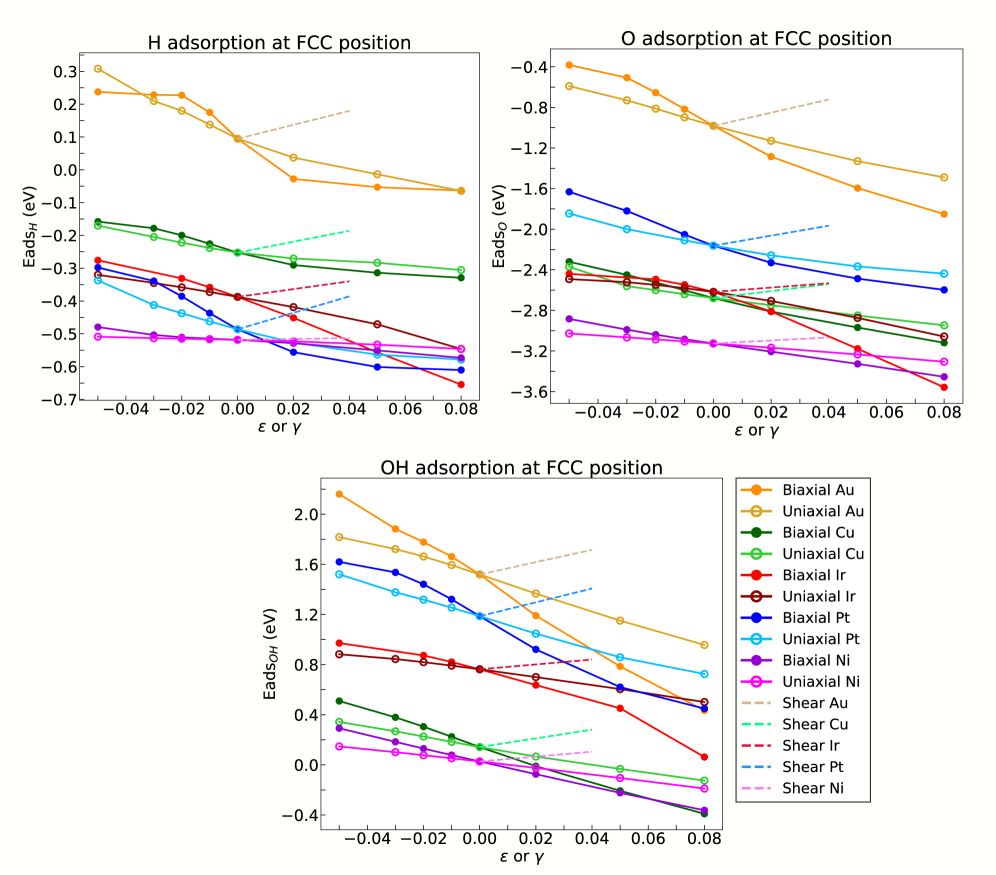
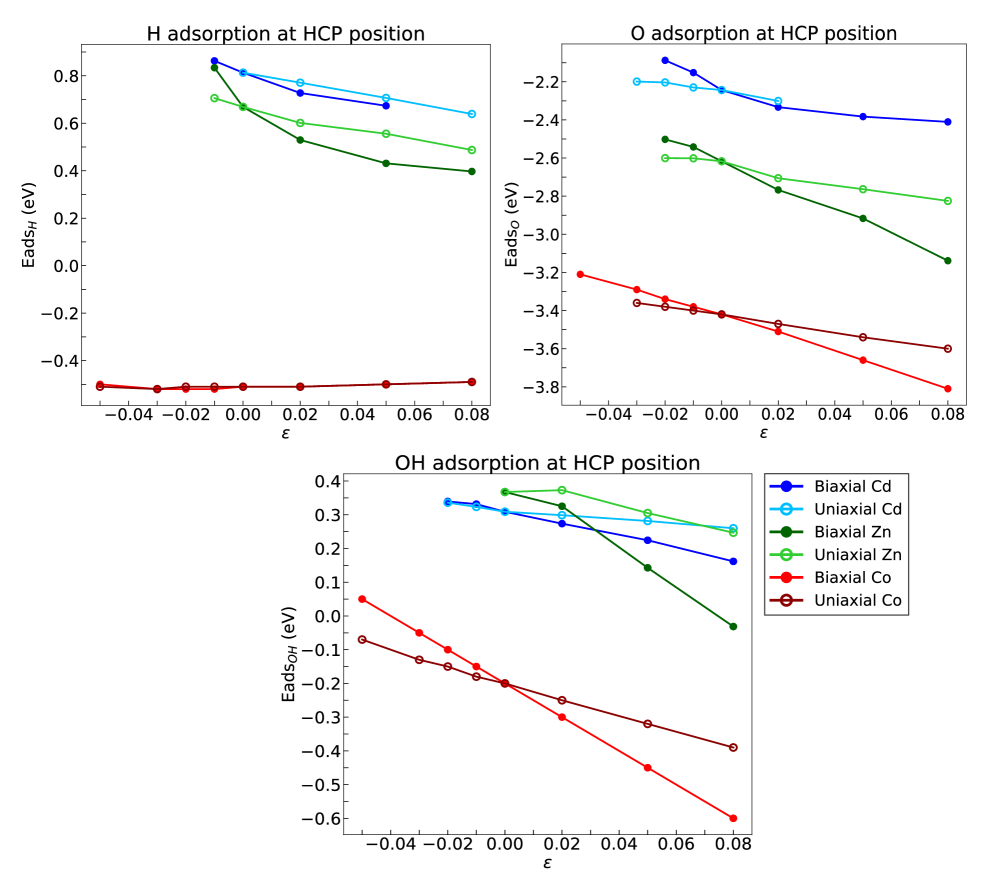
The highest (less favorable) adsorption energies are always found for OH while the lowest (more favorable) are reported for O. Adsorption energies for H are smaller (in absolute values) than those calculated for O and OH in all metals, following the trends reported above for Pt. In addition, the adsorption energies increase (become less negative) with compressive strains and decrease (become more negative) with tensile strains, while biaxial deformations have stronger influence than uniaxial deformation on the adsorption energy for the same strain. Shear strains increase slightly the adsorption energies in all cases. For a given metal, the effect of mechanical strains on the adsorption energy of O and OH quite similar, very likely because adsorption is dominated by the larger O atom.
The variation in adsorption of energy of O and OH with strain is significantly higher than that of H and these differences can be attributed to the larger atomic radius of the O atom. The additional p-orbitals increase the size of the electronic environment and, therefore, the overlap with the d-band structure of the metals. The presence of p-electrons further apart from the nucleus favors the interaction with the d-electrons of the surfaces.
Indeed, the effect of mechanical strains on the adsorption energies depends on the metal. Noble metals, such as Au and Pt, show the highest sensitivity to the strain while Ni shows much lower sensitivity. It is also worth noting that the adsorption of H onto Co is not affected by either uniaxial or biaxial strains in the range - 5% to 8% but the largest changes in the adsorption energy of O and OH ( 0.5 eV) are found in Co for the same strain range.
The trends observed for the adsorption energies in this work are in agreement with the predictions of the d-band theory. This theory states that the more favorable adsorption energies related with tensile and the less favorable ones corresponding to compressive and shear strains can be explained in terms of displacements in the d-band center [33, 34, 52, 54]. Indeed, the d-band theory indicates that tensile strains shift the d-band center towards higher energies for transition metals with more than half-filled d-bands. A higher d-band center results in stronger bonding and leads to more favorable adsorption energies, while compression and shear strains produce a shift towards a lower d-band center and lead to less favorable interactions.
3.3 Relationship between adsorption energy and hole area
While the d-band model provides a qualitative explanation of the trends reported in Figures 4 and 5, models that are able to quantify the effect of mechanical strains on the adsorption energy are lacking. In this respect, the adsorption energies of H, O, and OH in each fcc transitions metals and in three hcp transitions metals are plotted in Figures 6 and 7, respectively, as a function of the area of hole (either FCC or HCP) at which adsorption takes place. The area of the hole was calculated from the length of the sides of the triangle which conform the FCC and the HCP adsorption sites (Figure 2(b) and (d)), which depends on the deformation gradient applied to the supercell. After relaxation, the area of the hole was measured again using the code XCrysDen[55] and it was found that the differences in the hole area between the unrelaxed and relaxed structure are negligible.
The adsorption energies under biaxial strains (solid circles), uniaxial strains (open circles) and a combination of shear and axial strains (open triangles) are plotted for each metal in these figures. They show that the actual adsorption energy only depends on the area of the hole and that the effect of different strains can be superposed, i.e. different combinations of normal and shear strains that lead to the same in hole area have the same effect of the adsorption energy. Moreover, the relationship between the adsorption energy and the hole area is fairly linear in most cases (although the DFT results are better approximated by a parabola in several cases). Finally, the data in Figures 6 and 7 allow to make a fast and accurate estimation of the effect of mechanical strains on the adsorption energies of H, O, and OH for any of these transition metals from the geometrical analysis of the change in either FCC or HCP hole area under the application of a deformation gradient . Because the hole area does not change during relaxation, it is not necessary to perform the DFT simulations to determine the adsorption energy.
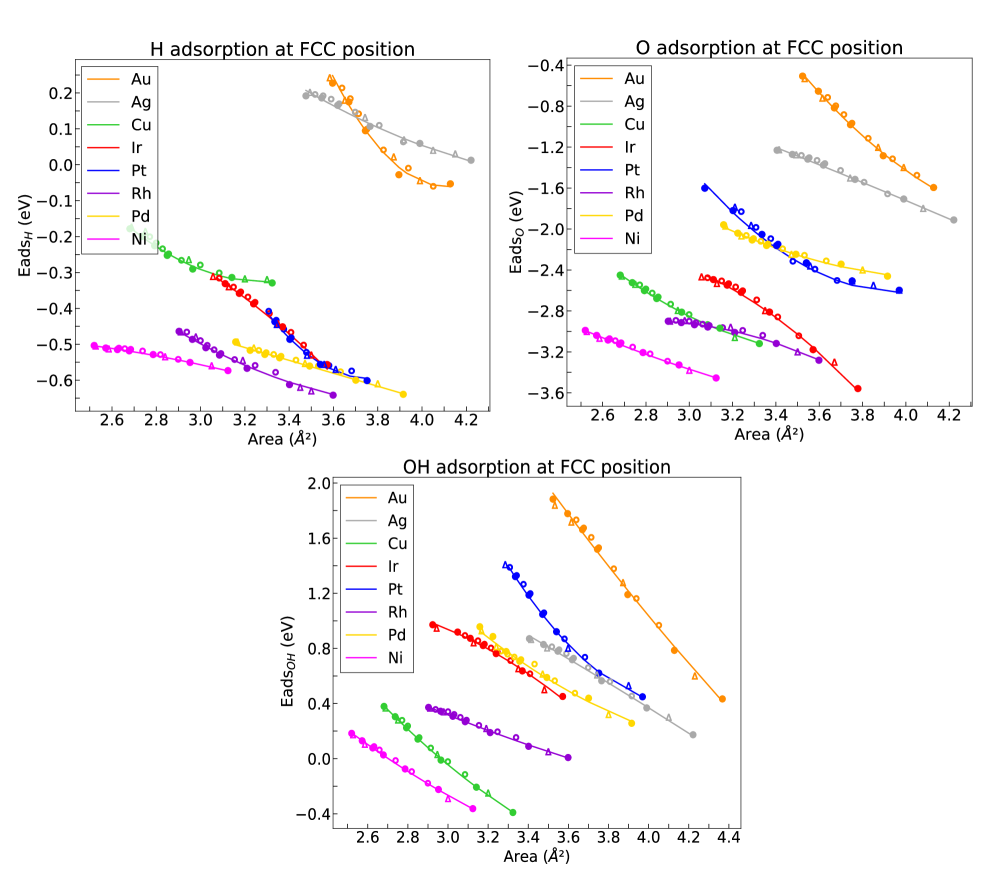
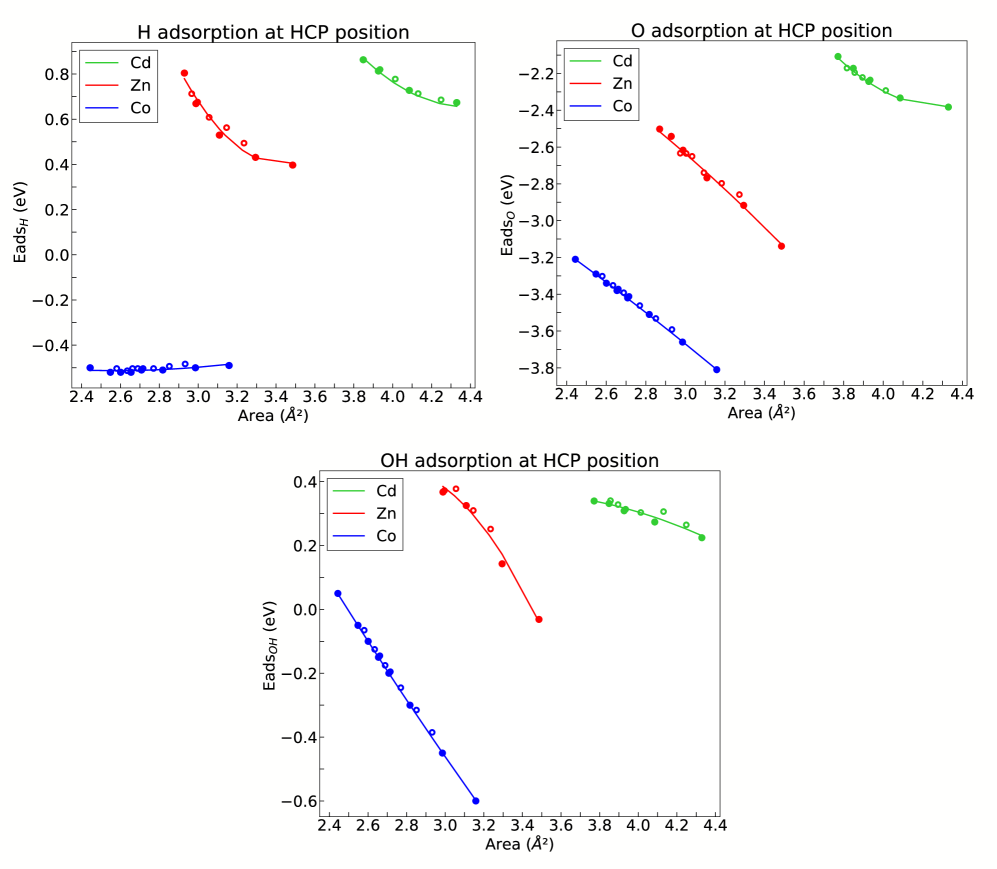
The curves corresponding to the 1st row transition metals (Cu, Ni, Zn, and Co) in Figures 6 and 7 are located in the region with smaller hole areas because of the smaller size of these atoms. In addition, Ni and Co also show very low adsorption energies, which can be attributed to magnetism, while the adsorption energies of Cu and Zn are much higher for similar hole areas. The curves corresponding to the 2nd and 3rd row transition metals (Au, Ag, Ir, Pt, Rh, Pd, and Cd) are spread towards the right in Figures 6 and 7 as a result of the larger atom size. In general, the adsorption energies becomes more positive (less favorable) when going from left to right in the periodic table periods. This tendency is related with the electronic density of the metals, whose d-bands become more populated as atomic number of the metal increases in a period. Thus, as a general rule, the adsorption process is favored by a reduction in the number of valence electrons in the metal.
In most cases, the relationship between the adsorption energy and the hole area is linear, although a parabola is more appropriate in several cases. Moreover, the slope of the linear fit is similar for most transition metals and large differences are only found in the case of H adsorption on Ni, which is almost insensitive to the applied strains. These results indicate that the mechanisms that control the adsorption of H, O, and OH are very similar and the differences that appear in these figures are ultimately related to the particularities of d-orbitals of each metal and to magnetic effects.
Finally, the adsorption energies of H and O onto the HCP position of (111) Pt surfaces were determined for different magnitudes of axial strains to check whether the relationship between adsorption energy and hole area could be extrapolated to other adsorption sites. They are plotted in Figure S9 in the supporting information, together with the adsorption energies onto the FCC positions of (111) Pt surfaces, support the previous findings: for a given adsorption site, the effect of mechanical strains on the adsorption energy of transition metals only depends on the area of adsorption hole.
4 Discussion
4.1 Electronic structure
It is known that changes in the surface geometry are accompanied by changes in the surface electronic structure [33]. To quantify these effects, the projected density of the states (PDOS) on the d-band onto the surface of all metals and adsorbates was analyzed to explore the electronic origin of the adsorption energy - hole area relationship. The PDOS corresponding to the (111) fcc Pt slab subjected to biaxial tensile ( = 2% and 8%) or compressive ( = -2%) strains are plotted in Figure 8(a) and compared with the PDOS at . The overlap of metal d-states at neighboring sites will either increase or decrease when a surface undergoes compressive or tensile strains, and so will the d-bandwidths in order to maintain a constant filling. Thus, compressive or tensile strains lead to downshifts or up-shifts of the d-band centers, respectively [56], as shown in figure 8(a).

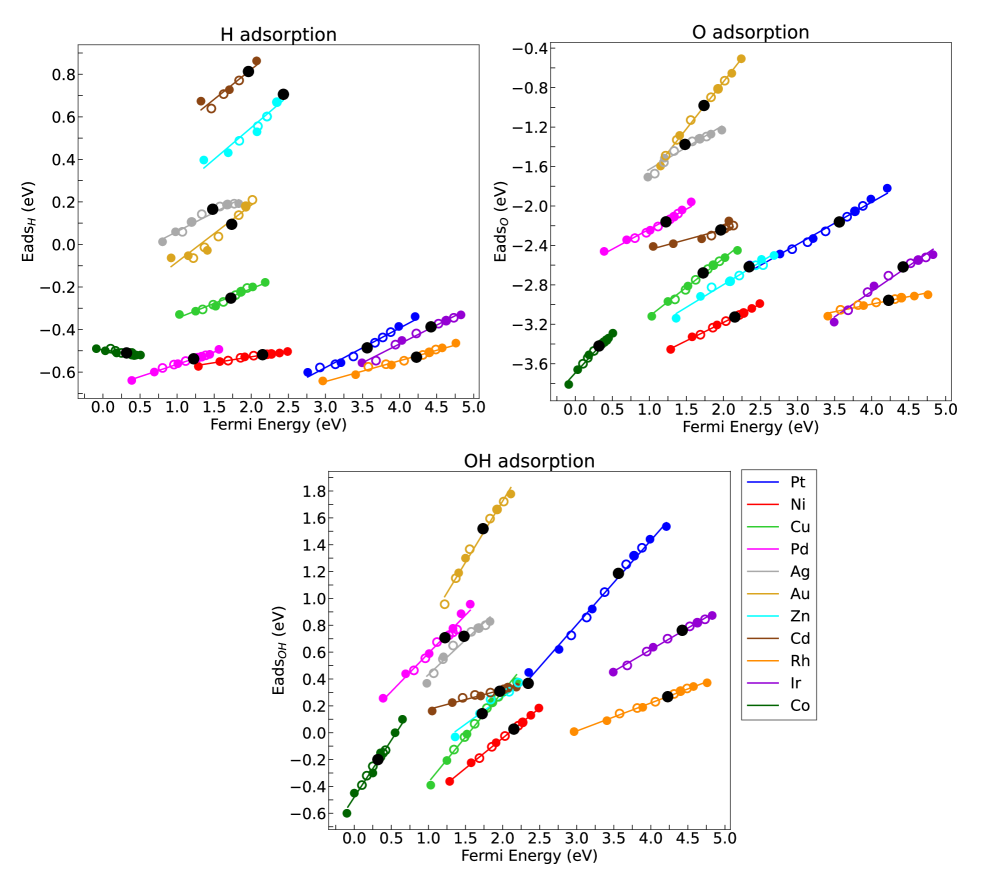
The PDOS onto the 5d orbitals of a (111) fcc Pt surface after the adsorption of a H atom onto the FCC site and the ONTOP site are plotted in Figure 8(b), together with the PDOS of a hydrogen molecule and of the clean (111) fcc Pt slab. The adsorption of a H atom on the ONTOP position generates strong electronic changes, which in turn are reflected in the PDOS. In contrast, the PDOS when adsorption takes place onto the FCC site remains practically identical to the one corresponding to the clean (111) Pt slab, with the only difference being a small shoulder at 2 eV. This variation in the PDOS can be considered negligible, as compared with the electronic changes produced by the application of strain and, therefore, allows to establish a direct link between the adsorption energy with the geometrical changes induced at the FCC adsorption site by the application of strain. The PDOS of a (111) fcc Pt surface after the adsorption of an O atom onto the FCC site and the ONTOP site together with the PDOS of an oxygen molecule, and of the clean (111) fcc Pt slab are plotted in Figure 8(c) and very similar trends are observed. The PDOS is localized in a single peak on the left after the adsorption of the O atom on the ONTOP position, whereas the PDOS become broader but maintains its original shape after the adsorption of the O atom onto the FCC position. Similarly, the PDOS of a (111) fcc Pt surface after the adsorption of OH onto the FCC site and the ONTOP site are plotted in Figure 8(d) together with the PDOS of a hydrogen and a water molecule, and of the clean (111) fcc Pt slab. The trends are equivalent to those observed in Figs. 8(b) and (c). While the adsorption of OH at ONTOP position produces significant changes in the PDOS, the adsorption of OH at FCC position leads to negligible changes in the PDOS as compared with that of the clean (111) Pt slab. The above results suggest that the analysis the electronic structure of the clean surface slabs may be enough to determine the effect of strain on the adsorption energy of H, O, and OH in the transition metals studied in this investigation. Moreover, the application of strain does not modify the shape of the PDOS curves but only leads to a shift of the energy levels (Figure 8(a)). Thus, the Fermi level could be used as a metric of the electronic changes in the slabs upon the application of mechanical strains and, eventually, of the adsorption energies. This hypothesis is supported by the results in Figures 9(a), (b), and (c) in which the adsorption energies as a function of the mechanical strains are plotted as a function of the Fermi level of the clean, strained surface slabs for H, O, and OH adsorbates, respectively. The linear correlation between both magnitudes is obvious for all metals and adsorbates and can be represented by
| (4) |
where X = H, O or OH and the coefficients and for each pair of adsorbate and transition metal can be found in Table S3 in the supporting information. It should be noted that in eq. (4) stands for the Fermi energy of the clean, strained slab. Obviously, these similarities indicate that the underlying adsorption processes are governed by the same physical mechanisms.
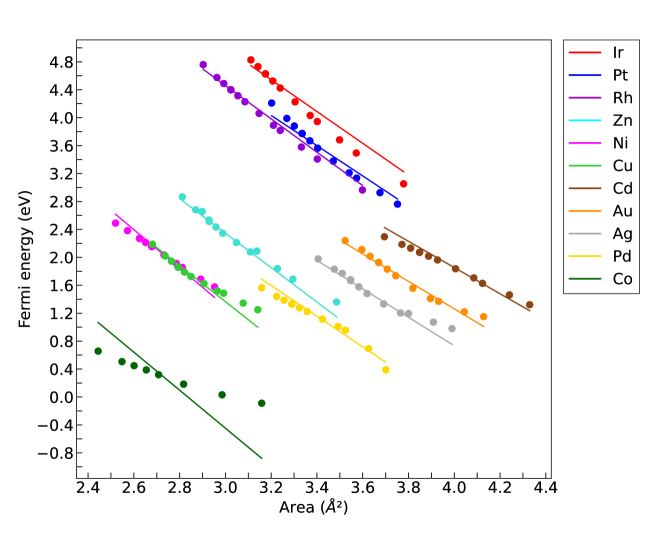
The last step to link the adsorption energy with the area of adsorption site is to find the relationship between the latter and the Fermi energy. The values of both magnitudes obtained by DFT calculations on clean, strained slabs of the 11 transition metals are plotted in Figure 10. The straight lines in this figure are given by
| (5) |
where is the Fermi energy (in eV), and the area of the adsorption site in the surface subjected to a given strain state. is the Fermi energy of the surface corresponding to the undeformed state, which is given in Table S4 in the supporting information for each transition metal. This equation captures the independent contribution of the metal ligand (expressed by ) and of the mechanical strain (given by ) to the Fermi energy and, thus, through eq. (9) to the adsorption energy for each adsorbate. It should be noted the excellent agreement of this simple linear equation with the DFT calculations for most transition metals indicates that changes in the local electronic environment as a result of strain are better represented by the area of the hole than by the distance between one atom and the different neighbours. Moreover, eq. (5) provides the explanation of the link between the adsorption energy and the area of the adsorption site in Figures 6 and 7. The different behavior of Co -that does not follow equation (5)- may be due to the magnetic properties of this metal but further research is needed to clarify this point. Moreover, it should be noted that preliminary studies on (110) bcc Cr and (100) bcc V surfaces did not find a clear relationship between adsorption energy, Fermi energies, and area of the adsorption site. These differences may be attributed to the nature of the d-orbitals in these metals, that are less than half or half filled in metals on the left side of the periodic table. Thus, further research is needed to reach a full understanding of the effect of mechanical strains on the adsorption properties of transition metals.
Conclusions
The influence of elastic strains on the adsorption of H, O, and OH on the (111) surfaces of 8 fcc (Ni, Cu, Pd, Ag, Pt, Au, Rh, Ir) and on the (0001) surfaces of 3 hcp (Co, Zn, Cd) transition metals was analyzed by means of DFT calculations. The surface slabs were subjected to different strain states (uniaxial, biaxial, shear, and a combination of them) up to strains dictated by the mechanical stability limits indicated by the phonon calculations. It was found that tensile strains favored the adsorption of the three adsorbates while compressive and shear strains increased the adsorption energy (less negative) and, thus, hindered the adsorption, in agreement with the d-band theory. Adsorption energies for H were smaller in absolute values than those calculated for O and OH in all cases. Moreover, the optimum adsorption (lowest energy) of the three species was found onto the FCC sites of the (111) fcc surfaces and onto the HCP sites of the (0001) hcp surfaces and did not change with strain.
It was found that the variation of the adsorption energy in all metals due to the application of mechanical strains was only a function of the change in the area of the adsorption site and the relationship between both magnitudes was fairly linear in most cases. Thus, different combinations of normal and shear strains that lead to the same change in the area of the adsorption site have identical effect on the adsorption energy. This general behavior indicated that the physical mechanisms of adsorption were equivalent in all metals. The analysis of the electronic structure showed that the application of strains did not modify the shape of PDOS of the d-orbitals of the transition metals but only led to a shift in the energy levels. Moreover, the adsorption of H and O on the surfaces led to negligible changes in the PDOS. Thus, the adsorption energies of all adsorbates in all metals were a function of the Fermi energy which in turn was associated to the change of the area of the adsorption through linear law that was valid for all metals.
As the change in the area of the adsorption site due to the application of strain can be accurately determined by purely geometrical considerations, the information in this paper allows the immediate and accurate estimation of the effect of any elastic strain on the adsorption energies of H, O, and OH on 11 transition metals with more than half-filled d-orbitals. This information can be used to predict the activation free energies of the different intermediates in the HER and ORR (as well as in other catalytic reactions) as a function of the applied strain for different transition metals with very limited computational cost, indicating the optimum combination of material and strain to enhance the catalytic activity. Moreover, the results in this paper can spur the search for correlations between geometrical descriptors of the elastic deformation and adsorption energies that can be used to make accurate predictions of the latter with minimum computational cost for other compounds and adsorbates.
Acknowledgments
This investigation was supported by the MAT4.0-CM project funded by the Madrid region under program S2018/NMT-4381 and by the HexaGB project of the Spanish Ministry of Science (reference RTI2018-098245). Computer resources and technical assistance provided by the Centro de Supercomputación y Visualización de Madrid (CeSViMa) are gratefully acknowledged. Additionally, the authors thankfully acknowledge the computer resources at CTE-Power and Minotauro in the Barcelona Supercomputing Center (project QS-2021-1-0013). Finally, use of the computational resources of the Center for Nanoscale Materials, an Office of Science user facility, supported by the U.S. Department of Energy, Office of Science, Office of Basic Energy Sciences, under Project No. 73377, is gratefully acknowledged. CMA also acknowledges the support from the Spanish Ministry of Education through the Fellowship FPU19/02031.
References
- [1] J. R. Anderson, M. Boudart, Catalysis: science and technology, 1987.
- [2] A. F. Lee, J. A. Bennett, J. C. Manayil, K. Wilson, Chem. Soc. Rev. 2014, 43, 7887–7916.
- [3] H. de Lasa, E. Salaices, J. Mazumder, R. Lucky, Chem. Rev. 2011, 111, 5404–5433.
- [4] A. Primo, H. Garcia, Chem. Soc. Rev. 2014, 43, 7548–7561.
- [5] P. G. Jessop, Y. Hsiao, T. Ikariya, R. Noyori, J. Am. Chem. Soc. 1994, 116, 8851–8852.
- [6] G. Busca, Chem. Rev. 2007, 107, 5366–5410.
- [7] B. H. R. Suryanto, H.-L. Du, D. Wang, J. Chen, A. N. Simonov, D. R. MacFarlane, Nat. Catal. 2019, 2, 290–296.
- [8] J. K. Norskov, C. H. Christensen, Science 2006, 312, 1322–1323.
- [9] M. Koper, E. Bouwman, Angew. Chem. Int. Ed. 2010, 49, 3723–3725.
- [10] P. C. K. Vesborg, B. Seger, I. Chorkendorff, J. Phys. Chem. Lett. 2015, 6, 951–957.
- [11] M. Shao, Q. Chang, J.-P. Dodelet, R. Chenitz, Chem. Rev. 2016, 116, 3594–3657.
- [12] J. N. Hansen, H. Prats, K. K. Toudahl, N. M. Secher, K. Chan, J. Kibsgaard, I. Chorkendorff, ACS Energy Letters 2021, 6, 1175–1180.
- [13] J. K. Nørskov, J. Rossmeisl, A. Logadottir, L. Lindqvist, J. R. Kitchin, T. Bligaard, H. Jónsson, The Journal of Physical Chemistry B 2004, 108, 17886–17892.
- [14] N. Dubouis, A. Grimaud, Chem. Sci. 2019, 10, 9165–9181.
- [15] M. Escudero-Escribano, P. Malacrida, M. H. Hansen, U. G. Vej-Hansen, A. Velazquez-Palenzuela, V. Tripkovic, J. Schiotz, J. Rossmeisl, I. E. L. Stephens, I. Chorkendorff, Science 2016, 352, 73–76.
- [16] C. Fu, C. Liu, T. Li, X. Zhang, F. Wang, J. Yang, Y. Jiang, P. Cui, H. Li, Computational Materials Science 2019, 170, 109202.
- [17] J. A. Z. Zeledón, M. B. Stevens, G. T. K. K. Gunasooriya, A. Gallo, A. T. Landers, M. E. Kreider, C. Hahn, J. K. Nørskov, T. F. Jaramillo, Nature Communications 2021, 12.
- [18] I. Shuttleworth, Applied Surface Science 2016, 378, 286–292.
- [19] I. Shuttleworth, Surface Science 2017, 661, 49–59.
- [20] Q. Feng, S. Zhao, D. He, S. Tian, L. Gu, X. Wen, C. Chen, Q. Peng, D. Wang, Y. Li, Journal of the American Chemical Society 2018, 140, 2773–2776.
- [21] X. Wang, Y. Zhu, A. Vasileff, Y. Jiao, S. Chen, L. Song, B. Zheng, Y. Zheng, S.-Z. Qiao, ACS Energy Letters 2018, 3, 1198–1204.
- [22] J. Kong, W. Cheng, Chinese Journal of Catalysis 2017, 38, 951–969.
- [23] S. Rudi, X. Tuaev, P. Strasser, Electrocatalysis 2012, 3, 265–273.
- [24] J. LLorca, Science 2018, 360, 264–265.
- [25] A. Banerjee, D. Bernoulli, H. Zhang, M.-F. Yuen, J. Liu, J. Dong, F. Ding, J. Lu, M. Dao, W. Zhang, Y. Lu, S. Suresh, Science 2018, 360, 300–302.
- [26] Z. Shi, E. Tsymbalov, M. Dao, S. Suresh, A. Shapeev, J. Li, Proceedings of the National Academy of Sciences 2019, 116, 4117–4122.
- [27] S. Bhattacharjee, U. V. Waghmare, S.-C. Lee, Scientific Reports 2016, 6.
- [28] M. Grunze, C. Brundle, D. Tománek, Surface Science 1982, 119, 133–149.
- [29] C. Rao, G. R. Rao, Surface Science Reports 1991, 13, 223–263.
- [30] A. Ruban, B. Hammer, P. Stoltze, H. Skriver, J. Nørskov, Journal of Molecular Catalysis A: Chemical 1997, 115, 421–429.
- [31] H. Cheng, D. B. Reiser, P. M. Mathias, K. Baumert, S. W. Dean, The Journal of Physical Chemistry 1995, 99, 3715–3722.
- [32] H. Xin, A. Vojvodic, J. Voss, J. K. Nørskov, F. Abild-Pedersen, Physical Review B 2014, 89.
- [33] B. Hammer, J. Nørskov in Advances in Catalysis, Elsevier, 2000, pp. 71–129.
- [34] B. Hammer, J. Nørskov, Surface Science 1995, 343, 211–220.
- [35] B. Hammer, J. K. Norskov, Nature 1995, 376, 238–240.
- [36] K. W. Jacobsen, J. K. Norskov, M. J. Puska, Phys. Rev. B 1987, 35, 7423–7442.
- [37] K. Jacobsen, P. Stoltze, J. Nørskov, Surface Science 1996, 366, 394–402.
- [38] D. M. NEWNS, Physical Review 1969, 178, 1123–1135.
- [39] P. W. Anderson, Physical Review 1961, 124, 41–53.
- [40] P. Giannozzi, S. Baroni, N. Bonini, M. Calandra, R. Car, C. Cavazzoni, D. Ceresoli, G. L. Chiarotti, M. Cococcioni, I. Dabo, A. D. Corso, S. de Gironcoli, S. Fabris, G. Fratesi, R. Gebauer, U. Gerstmann, C. Gougoussis, A. Kokalj, M. Lazzeri, L. Martin-Samos, N. Marzari, F. Mauri, R. Mazzarello, S. Paolini, A. Pasquarello, L. Paulatto, C. Sbraccia, S. Scandolo, G. Sclauzero, A. P. Seitsonen, A. Smogunov, P. Umari, R. M. Wentzcovitch, Journal of Physics: Condensed Matter 2009, 21, 395502.
- [41] J. P. Perdew, K. Burke, M. Ernzerhof, Physical Review Letters 1996, 77, 3865–3868.
- [42] N. Marzari, D. Vanderbilt, A. D. Vita, M. C. Payne, Physical Review Letters 1999, 82, 3296–3299.
- [43] A. Jain, S. P. Ong, G. Hautier, W. Chen, W. D. Richards, S. Dacek, S. Cholia, D. Gunter, D. Skinner, G. Ceder, K. a. Persson, APL Materials 2013, 1, 011002.
- [44] S. Bahn, K. Jacobsen, Computing in Science Engineering 2002, 4, 56–66.
- [45] P. E. Blöchl, Physical Review B 1994, 50, 17953–17979.
- [46] G. Prandini, A. Marrazzo, I. E. Castelli, N. Mounet, N. Marzari, npj Computational Materials 2018, 4.
- [47] J. Fearon, G. W. Watson, Journal of Materials Chemistry 2006, 16, 1989.
- [48] T. T. T. Hanh, Y. Takimoto, O. Sugino, Surface Science 2014, 625, 104–111.
- [49] M. J. Kolb, F. Calle-Vallejo, L. B. F. Juurlink, M. T. M. Koper, The Journal of Chemical Physics 2014, 140, 134708.
- [50] A. Togo, I. Tanaka, Scr. Mater. 2015, 108, 1–5.
- [51] J. K. Nørskov, T. Bligaard, A. Logadottir, J. R. Kitchin, J. G. Chen, S. Pandelov, U. Stimming, Journal of The Electrochemical Society 2005, 152, J23.
- [52] Q. Pang, Y. Zhang, J.-M. Zhang, K.-W. Xu, Applied Surface Science 2011, 257, 3047–3054.
- [53] O. M. Løvvik, R. A. Olsen, Physical Review B 1998, 58, 10890–10898.
- [54] M. Mavrikakis, B. Hammer, J. K. Nørskov, Physical Review Letters 1998, 81, 2819–2822.
- [55] A. Kokalj, Journal of Molecular Graphics and Modelling 1999, 17, 176–179.
- [56] S. Kattel, G. Wang, J. Chem. Phys. 2014, 141, 124713.