Gold nanoparticle supracrystals mechanics under pressure: the role of the soft matrix
1 Abstract
Nanocrystals, used as building blocks, may self-assemble in long-range ordered assemblies so-called supracrystals. Different structures FCC, BCC but also Frank-Kasper phases have been observed and the roles of the soft ligands surrounding the rigid crystalline cores in the self-assembly process is not yet well understood and need further study. The mechanical behavior under hydrostatic pressure of 3D single FCC crystals built by gold nanoparticles has been investigated using HP-SAXS and compared with pure alkane, corresponding to the ligand chain. No structural transition has been observed up to 12 GPa, but a large increase of the supracrystals bulk modulus has been measured.
2 Introduction
Nanocrystals, used as building blocks, may self-assemble in long-range ordered assemblies so-called supracrystals. They are a good example of a meta-material, as their structural architectures induce collective properties and make them an emerging material. Gold nanoparticles have original optical plasmonic properties and the optical properties of gold supracrystals are expected to depend both on the structure and the distance between the particles with potential applications in optical devices. The cohesion of these supracrystals are related to the interaction between the gold cores, mainly van der Waals attraction but also to the soft matrix formed by the ligands grafted on their surface. Different structures FCC, BCC but also Frank-Kasper phases have been observed and the roles of these soft ligands in the self-assembly process is not yet perfectly understood and need further study. Investigating the mechanical properties of gold supracrystals can give precious informations on the soft matrix; this is the main goal of this paper. The elastic properties of supracrystals can be deduced from nanoindentation measurements performed with an atomic force microscope either on films or on bulk domains 1, 2. Another way to apply stress is using diamond-anvil cells (DAC) that are standard devices to apply high pressure (several GPa) on classical or geoscience materials but have also been used in soft matter 3 . The ordered structures can be investigated by in situ High-Pressure Small-Angle X-ray Scattering (HP-SAXS) measurements. Due to the thickness of the diamond windows, short X-ray wavelengths and large intensities are required as those provided by synchrotron facilities 4. Such experiments have been performed mainly on ordered films of spherical gold nanoparticles organized in a face-centered cubic (FCC) phase that have been compressed with a diamond anvil cell (DAC) 5, 6. In situ high-pressure small-angle X-ray scattering (HP SAXS) measurements showed that gradual elevation of the external pressure from ambient pressure to 8.9 GPa caused reversible shrinkage of the dimensions of the lattice unit cell and thus enabled the fine-tuning of interparticle spacing. Pressures between 8.9 and 13 GPa drove the nanoparticles to coalesce to form 1D nanostructures (nanorods or nanowires) and ordered hexagonal arrays of the nanostructures with P6mm symmetry . Such mechanical behavior has been seen for other types of particules 7, 8, 9. Simulations have also been performed 10 to understand the mechanism that induces this structural change and has emphasized the role of the ligands. HP-SAXS has been performed on bulk PbS nanocrystal 11 stabilized with oleic acid, revealing nearly perfect structural stability of the SCs, with face-centered cubic organization of the nanoparticules, in the pressure range from ambient to 12.5 GPa.
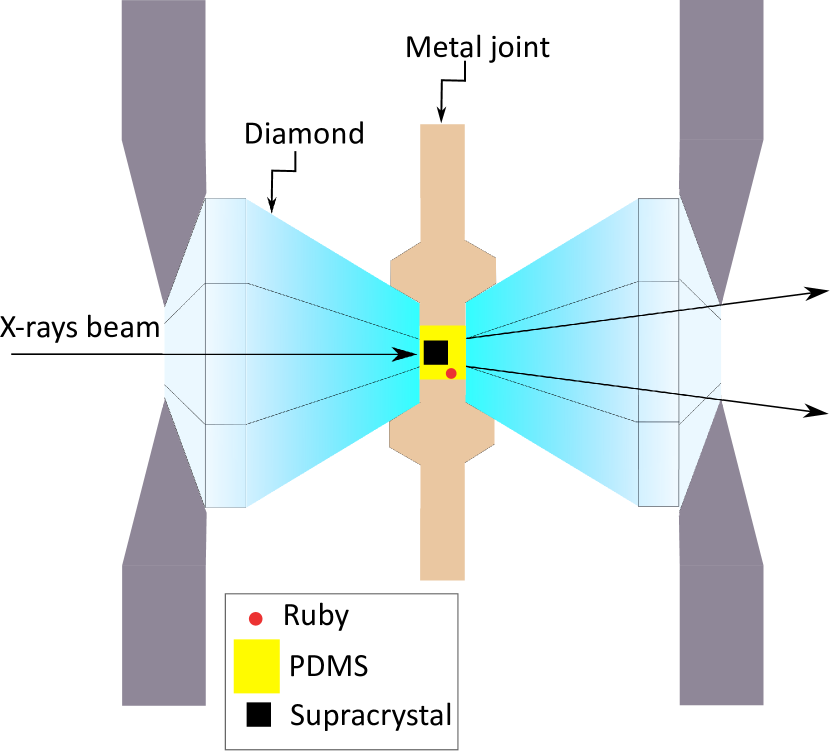
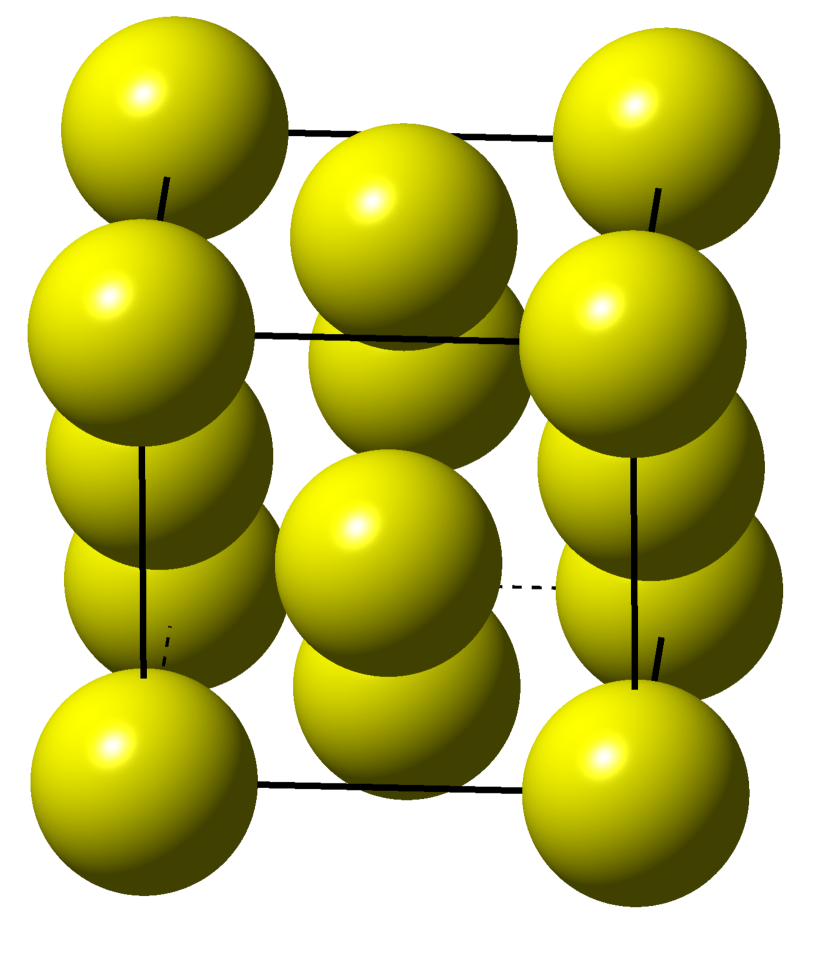
This letter presents experimental results on the mechanical behavior under hydrostatic pressure of single FCC crystals built by gold nanoparticules (Fig. 1) similar to those used in simulation study 10. These nanoparticules are made of a gold core with diameter nm grafted with dodecane thiols. These particules self assemble into a FCC structure. Large FCC single supracrystals could be grown by slow evaporation of volatile oil and were inserted in a DAC cell. Synchrotron-based HP-SAXS measurements were performed to monitor directly the in situ structural evolution. When applying a pressure up to 12 GPa, X-ray scattering has revealed a continuous decrease of the FCC cell but no coalescence. The bulk modulus of the matrix surrounding the gold cores has been measured, showing a large increase upon pressure. Comparison with the bulk modulus of pure dodecane, with the same chain as that of the ligands, will also be discussed.
|
|
|---|---|
| a) | b) |
3 Results and discussion
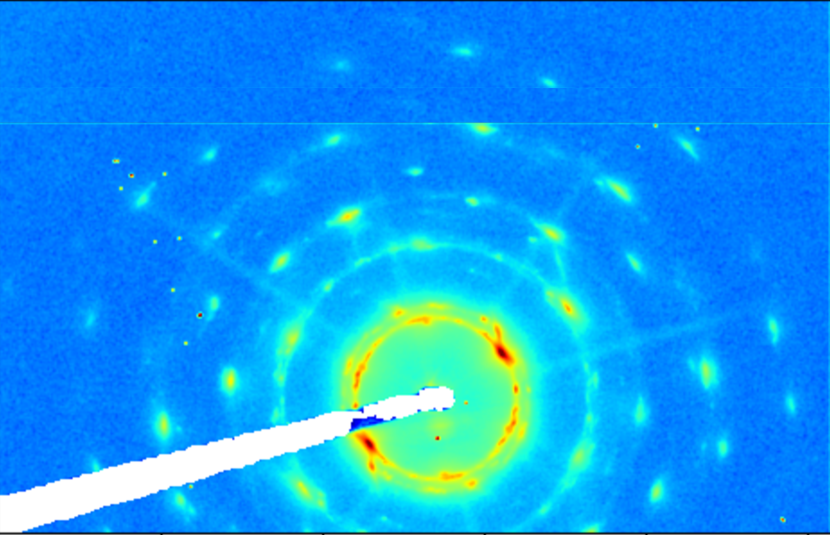
For the nanoparticules that have been used, the expected structure without any solvant is FCC 12. The scattered pattern shown in Fig. 2 a confirms this structure. When applying the pressure a shift of the peaks towards larger is clearly observed (see Movie in ESI). In Fig. 2a, four domains with different orientations (see ESI) have been detected all containing a three fold axis (111). The domains slightly rotate at least at the beginning as revealed by the change of the relative intensity of spots belonging to different domains. The determination of the structure and of the cell parameter value have been performed from the radial integration of the scattered intensity
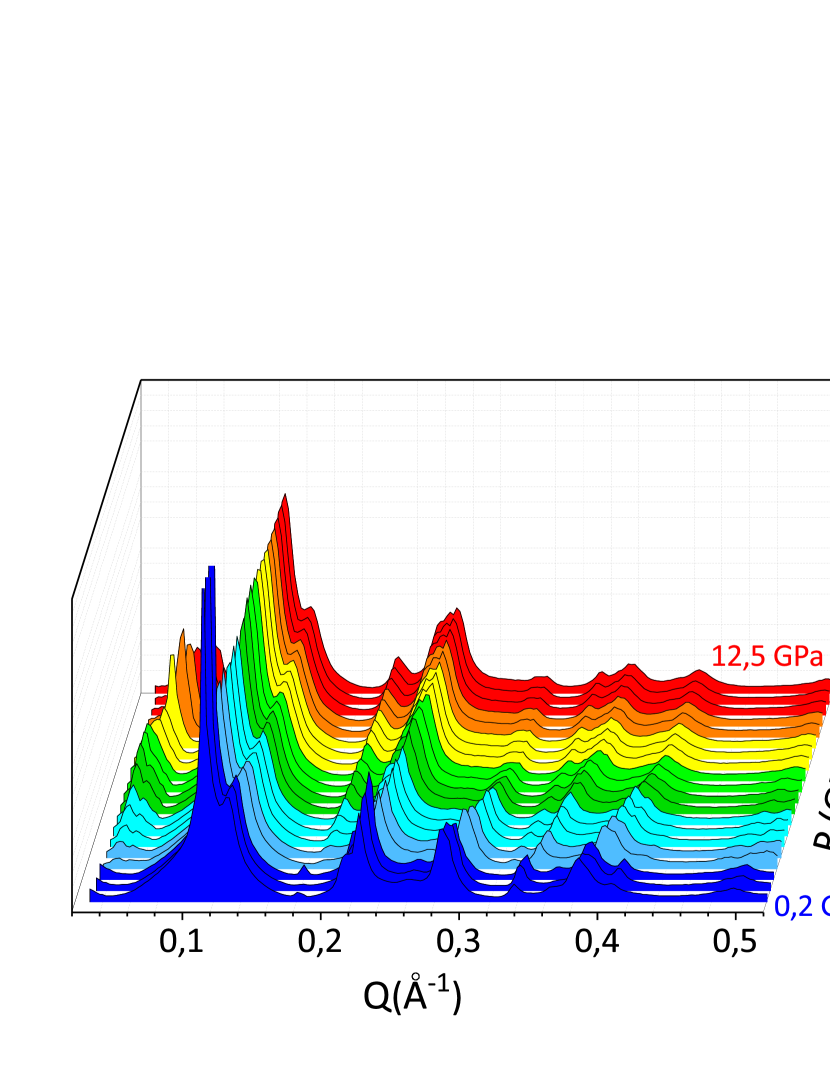
Fig. 2b reports the radially integrated intensity as a function of the wave vector for different pressures. One recovers the typic al peaks of a FCC phase: 111, 200, 220, 311, 222, 400, 331, 420,… . Upon pressure, all the peaks shift towards larger indicating a decrease of the cell parameter . No phase transition has been observed in this pressure range, neither coalescence.
|
|
|---|---|
| a) | b) |
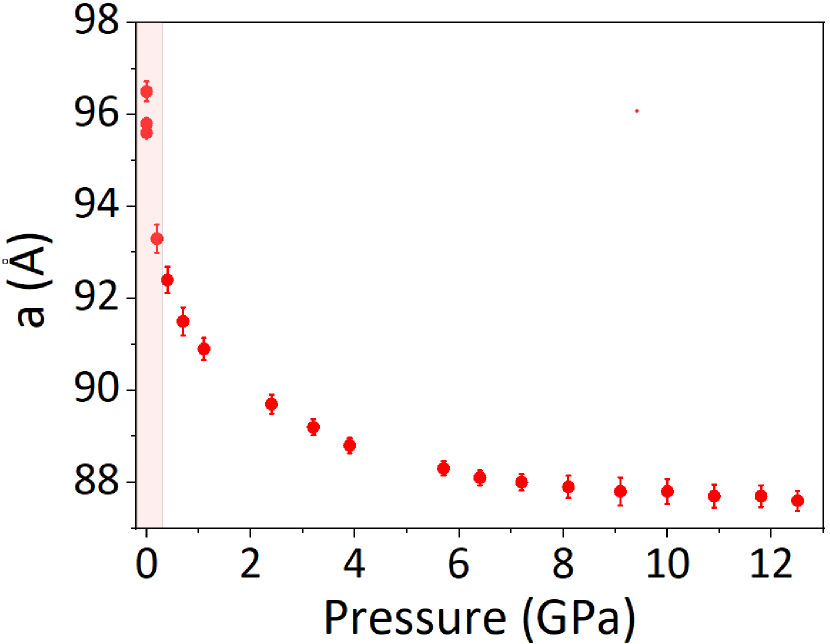
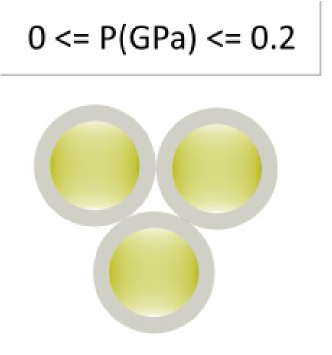
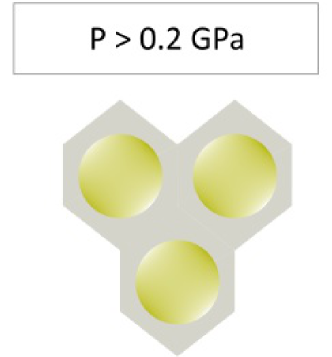
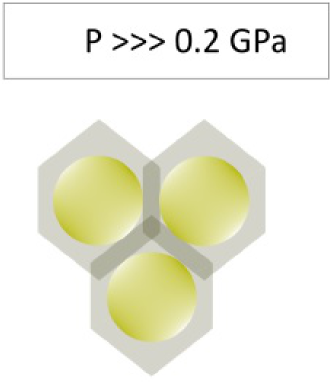
The variation of the FCC cell parameter as function of the increasing pressure is shown in Fig. 3a. When the PDMS is introduced in the cell, a minimum of pressure is applied to fix it in the cell. When the pressure is increased, a sharp decrease of the cell parameter from 96.5 to about 94 is first observed. In a second stage, above 0.2 GPa, the cell parameter decreases more slowly. Fig. 3b gives a crude interpretation of this behavior. At the beginning, there is void in between the nanoparticules. When the pressure is applied, the soft shell is deformed and the voids collapse: this is the first stage. However, below 0.2 GPa, the pressure control is not precise enough in order to measure the bulk modulus in this first stage.
At the end of this first stage, the void between the particles vanishes. In a second stage, the variation of the cell parameter is associated to the compression of the nanoparticules. However, since the bulk modulus of gold core is large (typically 300 GPa 13), the compression is expected to be supported mainly by the soft shell. Thus, in the second stage, the contraction of the cell is related to the bulk modulus of the ligand shell. This behavior implying two stages was clearly predicted 10.
To estimate the value of the cell parameter at the transition between the first and the second stage one can estimate the volume occupied by a particle (core plus ligands) at room pressure and assume that the cell parameter is given by . The volume fraction occupied by the soft particles is then 100%. The core volume is 61.6 nm3. The number of ligands per particule, assuming a grafting density equal to 5.2nm-2, is 392. The volume per ligand can be estimated to 0.4 nm3. The volume per particle (core plus ligand) can thus be estimated to =208 nm3 leading to nm in good agreement with the experimental observation. Nevertheless this model is too crude. Indeed since for nm, there is certainly still some void. In a FCC structure, the particles build octahedral cages. The distance between the cage center and the surface of the surrounding gold cores is nm, distance that is larger than the extended length of the ligands nm. That means that the distribution of the ligands in the matrix surrounding the gold cores cannot be considered as a homogeneous medium.
|
|
Extracting the bulk modulus above 0.2 GPa from the data requires some model. The behaviour and properties of earth materials at high pressure and temperatures have been described by different theoretical equation of state (EOS) , such as the Vinet model. These models are based on the interaction between atoms in solids. Several parameters are introduced: the volume at vanishing pressure , the bulk modulus at vanishing pressure and its derivative with respect to pressure . Even if soft matter systems behave as classical solids, the interaction may be quite different. For polymeric and glass systems, J. Rault 14 has proposed another EOS based on three parameters , and . is the limit volume at high pressure and is related to the bulk modulus at vanishing pressure:
The EOS established by J. Rault is the following:
| (1) |
The bulk modulus at pressure is
| (2) |
One can deduce from this expression that:
.
Both models have been tested and the Rault’s model clearly gives the better results over the whole pressure range applied in this experiment. This model has been applied on the volume per particule to extract the supracrystal bulk modulus. The matrix volume per particule, where the matrix is defined as the medium in between the gold cores (ligands + possible void) is clearly an important variable in order to investigate the ligand behavior. The matrix volume per particule is obtained by substracting the core volume to the volume per particule. But the core volume depends on pressure even if this variation is small. Assuming that the core volume upon pressure is similar to the atomic gold volume upon pressure 13, can be estimated using a linear decrease upon pressure: even if the elastic modulus is expected elastic constant of gold nanoparticles could be larger than the bulk one 15 . The bulk modulus of the matrix can be determined in the same way as the supracrystal bulk modulus. The two fits are shown in Fig: 4.
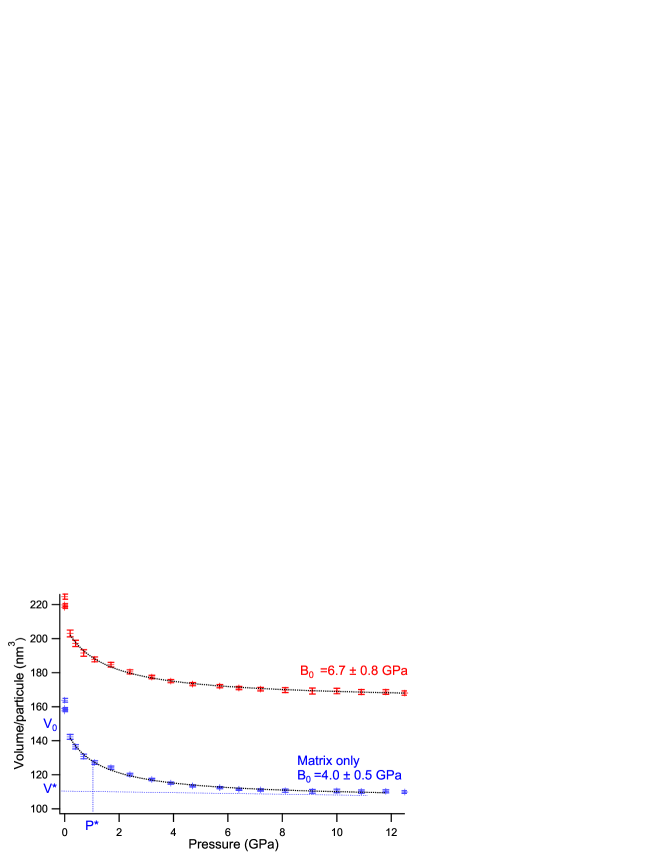
The different parameters extracted from the fits are detailed in Table 1
| (nm3) | (nm3) | (GPa) | (GPa) | ||
|---|---|---|---|---|---|
| bulk | 2081 | 163.50.5 | 11.40.1 | 6.70.8 | 8.50.3 |
| matrix | 1481 | 105.80.5 | 1.150.1 | 4.00.5 | 6.00.3 |
Assuming that the gold bulk modulus is very large, the relashionship between the two bulk modulus, for the supracrystal, for the matrix, is given par , where is the volume fraction occupied by the matrix at room pressure, .
Mechanics of supracrystals have already been investigated mainly by AFM either with standard AFM-tips or colloidal probe or nano-indentor 1. The bulk modulus measured in this paper is in full agreement with previous experiments on supracrystals built by gold nanoparticules with roughly the same core diameter and covered with dodecane-thiol ligands.
For a better understanding of the ligand behavior (dodecanethiol), pure dodecane mechanics under isotropic pressure has been investigated in the same experimental conditions. Pure dodecane crystallizes under pressure at room temperature. The crystalline structure of dodecane is triclinic (see ESI). The six crystallographic parameters have been measured from the scattering patterns and the volume of the cell upon pressure has been computed. The Rault’s model has also been applied in order to determine the bulk modulus.
| at room T | (Å3) | (Å3) | (GPa) | (GPa) | |
|---|---|---|---|---|---|
| crystallized dodecane | 2972 | 2095 | 3.60.5 | 5.8 | |
| above 0.2 GPa | |||||
| liquid dodecane | 378.50.5 | 2967 | 0.230.03 | 8 | |
| below 0.2 GPa |
The mechanical behaviour of liquid dodecane below the crystallization pressure (0.2 GPa) has been investigated by 16. By fitting their results with the help of the Rault model, it is possible to compute the bulk modulus of liquid dodecane just before crystallization: (P=0.2GPa) 3 GPa. At ”low” pressure, close to 0.2 GPa, the matrix bulk modulus has an intermediate value between disordered dodecane and crystallized one. At this point, one can notice that no evidence of crystallization inside the ligand matrix has been detected in the scattering pattern.
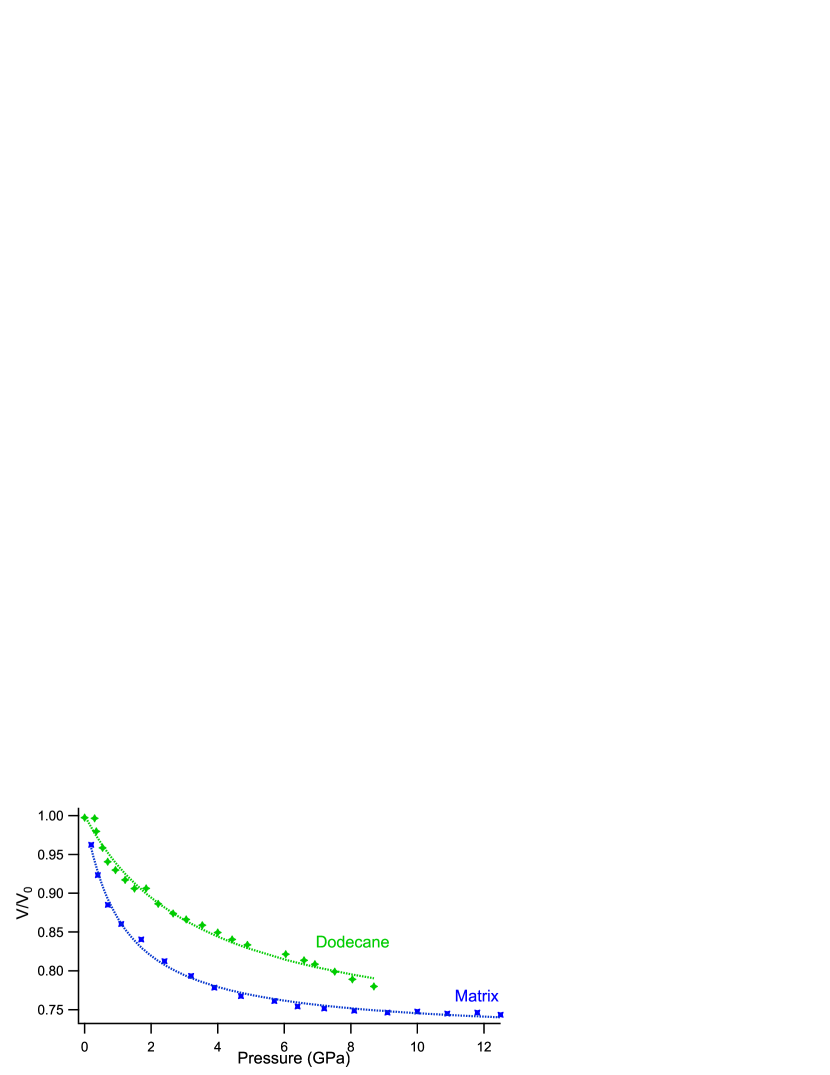
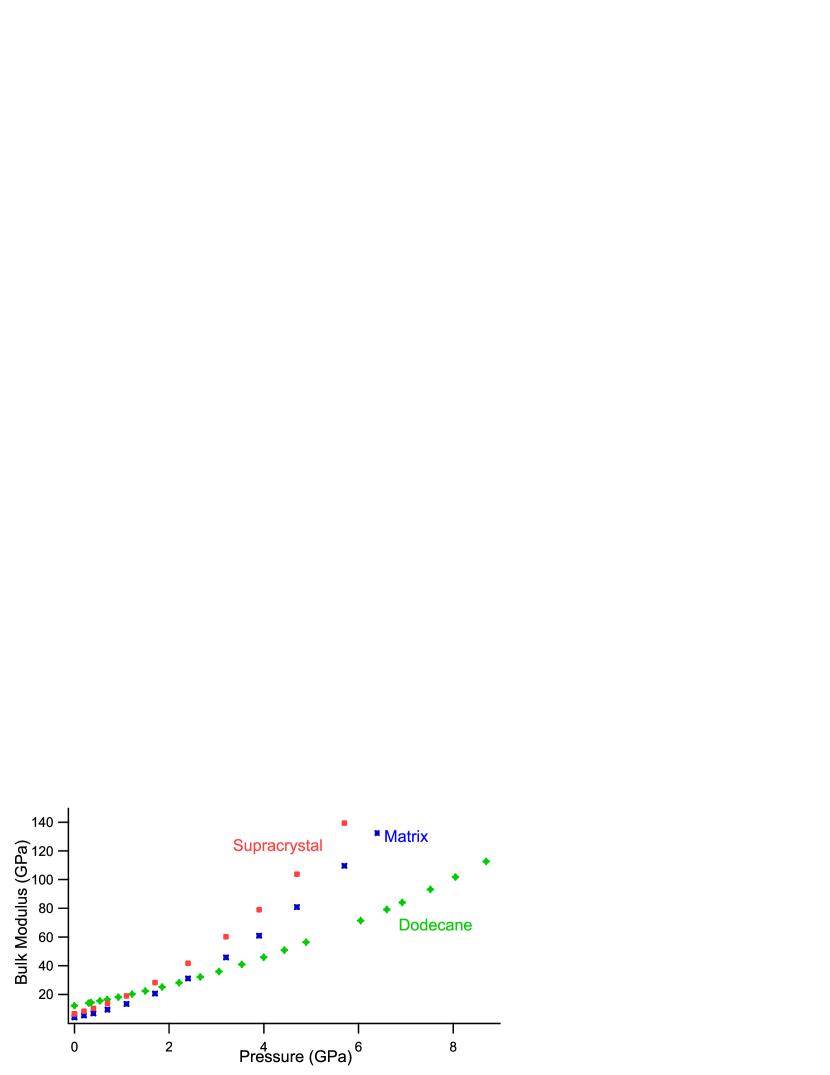
The behavior of the ligand matrix and pure dodecane bulk modulus upon hydrostatic pressure are compared in Figure 5. Two different graphs are shown either the ratio as a function of (Fig. 5a) or the bulk modulus computed with the Rault model (Fig. 5b) for both systems.
|
|
|---|---|
| a) | b) |
In Figure 5, the increase of the matrix bulk modulus upon pressure is larger than the increase of pure dodecane bulk modulus. The matrix is built by ligands that are grafted on the nanoparticle surface, confined between neighboring cores and not homogeneously filled. Upon high pressure, the matrix restructuration is more difficult than for crystallized dodecane. In the supracrystals, the ligands are grafted on the NP surface and cannot shift along the backbones. The ligands are also constrained in a confined zone in between the gold cores. This effect of confinement on the matrix bulk modulus is much studied at present 17. Ultrasonic experiments with a broader family of liquids are useful tools to explore how molecular properties affect the compressibility of confined fluids. Nevertheless experiments are needed for fluids that have practical importance for geophysics, i.e., water or hydrocarbons. HP-SAXS experiments on supracrystals give accesss to information on the solvent compressibility in another pressure range, closer to earth materials conditions.
This large value of the matrix bulk modulus at high pressure prevents from coalescence of the gold cores. From this point of view, the behavior of thin films with similar nanoparticles is totally different since coalescence has been experimentally proved. One can suspect that some ligands can unbind from the gold surface upon pressure and diffuse to the film surface that is not possible in a 3D crystal. Therefore higher pressure, over 12 GPa, should be applied in order to promote coalescence in 3D supracrystals.
4 Conclusion
The mechanical behavior under hydrostatic pressure of 3D single FCC crystals built by gold nanoparticles grafted with dodecane-thiol has been investigated using HP-SAXS and compared with pure dodecane. In a first stage, the void in between the particles collapses as predicted by 10 inducing a quick decrease of the cell parameter. In a second stage, the variation of the cell parameter is related to the compression of the matrix surrounding the gold cores. No structural transition has been observed up to 12 GPa, but a large increase of the matrix bulk modulus has been measured, larger that for pure dodecane. Indeed it is more difficult to optimize the chain packing under pressure when the chains are constrained by both grafting and confinement compared to free chains. Higher pressure, over 12 GPa, should be applied in order to promote either structural change or coalescence in 3D supracrystals.
References
- Pileni 2017 Pileni, M.-P. EPL (Europhysics Letters) 2017, 119, 37002
- Çolak et al. 2017 Çolak, A.; Wei, J.; Arfaoui, I.; Pileni, M.-P. Phys. Chem. Chem. Phys. 2017, 19, 23887–23897
- Pilar et al. 2018 Pilar, K.; Balédent, V.; Zeghal, M.; Judeinstein, P.; Jeong, S.; Passerini, S.; Greenbaum, S. Journal of Chemical Physics 2018, 148, 30–33
- Podsiadlo et al. 2011 Podsiadlo, P.; Lee, B.; Prakapenka, V. B.; Krylova, G. V.; Schaller, R. D.; Demortière, A.; Shevchenko, E. V. Nano Letters 2011, 11, 579–588, PMID: 21175220
- Wu et al. 2010 Wu, H.; Bai, F.; Sun, Z.; Haddad, R. E.; Boye, D. M.; Wang, Z.; Fan, H. Angewandte Chemie International Edition 2010, 49, 8431–8434
- Wu et al. 2010 Wu, H.; Bai, F.; Sun, Z.; Haddad, R. E.; Boye, D. M.; Wang, Z.; Huang, J. Y.; Fan, H. Journal of the American Chemical Society 2010, 132, 12826–12828, PMID: 20804208
- Li et al. 2014 Li, B.; Wen, X.; Li, R.; Wang, Z.; Clem, P. G.; Fan, H. Nature Communications 2014, 5, 4179
- Zhu et al. 2016 Zhu, J.; Quan, Z.; Wang, C.; Wen, X.; Jiang, Y.; Fang, J.; Wang, Z.; Zhao, Y.; Xu, H. Nanoscale 2016, 8, 5214–5218
- Li et al. 2017 Li, B.; Bian, K.; Zhou, X.; Lu, P.; Liu, S.; Brener, I.; Sinclair, M.; Luk, T.; Schunk, H.; Alarid, L.; Clem, P. G.; Wang, Z.; Fan, H. Science Advances 2017, 3
- Liu et al. 2020 Liu, X.; Wu, Y.; Li, G.; Zhang, Y.; Zhai, H. Journal of Applied Physics 2020, 128, 035109
- Podsiadlo et al. 2011 Podsiadlo, P.; Lee, B.; Prakapenka, V. B.; Krylova, G. V.; Schaller, R. D.; Demortière, A.; Shevchenko, E. V. Nano Letters 2011, 11, 579–588, PMID: 21175220
- Pansu et al. 2021 Pansu, B.; Goldmann, C.; Constantin, D.; Impéror-Clerc, M.; Sadoc, J.-F. Soft Matter 2021, 6461
- Dewaele et al. 2004 Dewaele, A.; Loubeyre, P.; Mezouar, M. Phys. Rev. B 2004, 70, 094112
- Rault 2014 Rault, J. The European Physical Journal E 2014, 37, 113
- Li et al. 2019 Li, H.; Han, Y.; Duan, T.; Leifer, K. Applied Physics Letters 2019, 115, 053104
- Regueira et al. 2018 Regueira, T.; Glykioti, M.-L.; Stenby, E. H.; Yan, W. Journal of Chemical & Engineering Data 2018, 63, 1072–1080
- Dobrzanski et al. 2021 Dobrzanski, C. D.; Gurevich, B.; Gor, G. Y. Applied Physics Reviews 2021, 8, 021317
We acknowledge SOLEIL for provision of synchrotron radiation facilities and we thank Thomas Bizien for assistance in using beamline SWING (Run20201484). The TEM images have been obtained by Claire Goldmann (LPS) and the MEB images by Wajdi Chaabani(LPS). This work is funded by the French National Research Agency (SoftQC project; https://softqc.wordpress.com/; ANR grant ANR-18-CE09-0025).
Author contribution: V.B. built the DAC cell and controlled the cell environment, B.P. manufactured the gold supracrystals; H.I., V.B. and B.P. performed the measurements, processed the experimental data, performed the analysis, and designed the figures. B.P. drafted the manuscript. M.I. aided in interpreting the results and worked on the manuscript. All authors discussed the results and commented on the manuscript.
Supplementary information
ESI available from the corresponding author.