Modeling age-specific incidence of colon cancer via niche
competition
Steffen Lange1,2*, Richard Mogwitz2, Denis Hünniger1,2, Anja Voß-Böhme1,2
1 DataMedAssist, HTW Dresden, 01069 Dresden, Germany
2 Faculty of Informatics/Mathematics, HTW Dresden - University of Applied Sciences, 01069 Dresden
* steffen.lange@tu-dresden.de
Abstract
Cancer development is a multistep process often starting with a single cell in which a number of epigenetic and genetic alterations have accumulated thus transforming it into a tumor cell. The progeny of such a single benign tumor cell expands in the tissue and can at some point progress to malignant tumor cells until a detectable tumor is formed. The dynamics from the early phase of a single cell to a detectable tumor with billions of tumor cells are complex and still not fully resolved, not even for the well-known prototype of multistage carcinogenesis, the adenoma-adenocarcinoma sequence of colorectal cancer. Mathematical models of such carcinogenesis are frequently tested and calibrated based on reported age-specific incidence rates of cancer, but they usually require calibration of four or more parameters due to the wide range of processes these models aim to reflect. We present a cell-based model, which focuses on the competition between wild-type and tumor cells in colonic crypts, with which we are able reproduce epidemiological incidence rates of colon cancer. Additionally, the fraction of cancerous tumors with precancerous lesions predicted by the model agree with clinical estimates. The correspondence between model and reported data suggests that the fate of tumor development is majorly determined by the early phase of tumor growth and progression long before a tumor becomes detectable. Due to the focus on the early phase of tumor development, the model has only a single fit parameter, the time scale set by an effective replacement rate of stem cells in the crypt. We find this effective rate to be considerable smaller than the actual replacement rate, which implies that the time scale is limited by the processes succeeding clonal conversion of crypts.
Introduction
Cancer development is a multistep process [1, 2] often originating from a single mutated cell [3]. Potential tumor progenitor cells in the tissue accumulate sequentially epigenetic and genetic alterations, which transform them into tumor cells [4]. Initially, these tumor cells can be benign [5, 6], meaning that they do not possess a proliferative fitness advantage, and consequently compete with the original wild-type cells within normal tissue homeostasis [7]. When the first tumor cell acquires a sufficient number of alterations and progresses to a malignant type, i.e., gains a considerable proliferative advantage to the original wild-type cells, a cancer develops [8]: The progeny of the malignant tumor cell spreads via clonal expansion until a sufficiently large cell population is reached to be clinically detectable [9]. A well-known prototype of such a multistage carcinogenesis is the adenoma-adenocarcinoma sequence of colorectal cancer [10, 11], whose intra-tumor heterogeneity suggests that this cancer particularly arises as a single expansion event [12].
Besides this general framework of carcinogenesis, the exact processes by which a tumor develops in the early phase are not known as a tumor is usually only detected after it consists of billions of cells. Mathematical models have been extensively used to elucidate fundamental mechanisms of cancer development and progression on the basis of biological data. One frequently employed interface to link these dynamical models to real-world observations are age-specific cancer incidences from cancer registries. Starting with the multistage Armitage-Doll model [13, 14, 15], suggesting that cancer generation is governed by a sequence of rate-limiting events, and multistage clonal expansion model (MSCE) [16, 15, 17, 18, 19, 20, 21], which are based on the initiation-promotion-malignant conversion paradigm in carcinogenesis, multitype branching process models [22, 23, 24], frailty models [25] as well as other stochastic or regression models [26, 27, 28, 29, 30] have been applied to age-specific incidences of various types of cancer. This includes colon [22, 23, 2, 17, 29, 24] and colorectal cancer [30, 18, 16, 22], pancreatic cancer [26, 21, 18, 16], gastric cancer [30, 18], esophageal adenocarcinomas (EAC) [18], oral squamous cell carcinomas (OSCCs) [20], prostate cancer [29], gonadal germ cell cancer (most common form of testicular cancer) [28], lung cancer [27], kidney cancer [26], thyroid cancer [19] as well as Hodgkin lymphoma (HL) [25]. Parameters of these models are determined by fitting the models hazard function to the age-specific incidences. A match of the fit and the data is considered to support the validity of the corresponding model. Furthermore, important parameter combinations, which quantify kinetics of malignant progression or clonal expansion before clinical detection, such as growth rates of adenoma, malignant transformation rates, extinction probabilities, as well as sojourn or dwell times, can be estimated via maximum likelihood methods from the fits. While the listed models fit the epidemiological data exquisitely well, they have at least two [30] but usually four [17, 27, 28, 29, 18, 20, 30] or more [2, 16, 25, 24] parameters. Thus, there may be issues of identifiability of the parameters from the data for many of these models [21], although the issue is well understood mathematically. The large amount of fit parameters results from the wide range of mechanisms these generic models aim to reflect, often incorporating both the early phase of tumor initiation and the early-to-late phase of clonal expansion. In contrast, the spatial structure of the tissue from which the tumor originates is often neglected, although tissue architecture is known to be crucial for tumor evolution [31]. A recent counter example is a model of colorectal cancer initiation [32], which did not infer the age-specific incidences rates, but recovered the lifetime risk of colorectal adenomacarcinoma, while setting all parameters by experimentally measured rates.
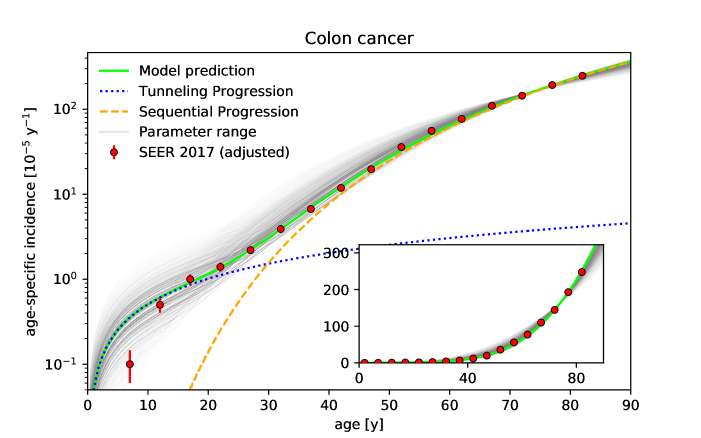
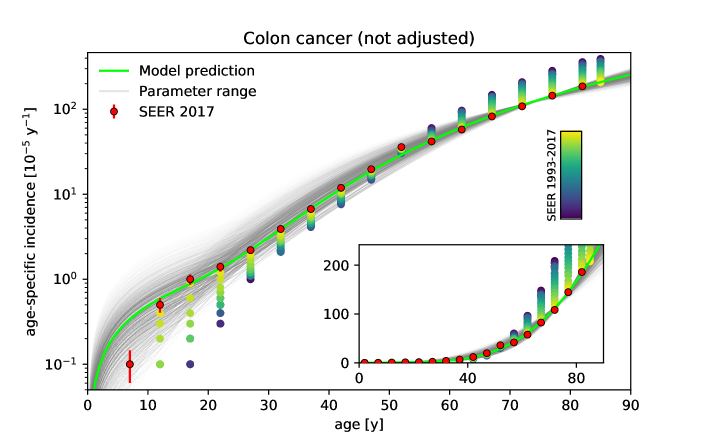
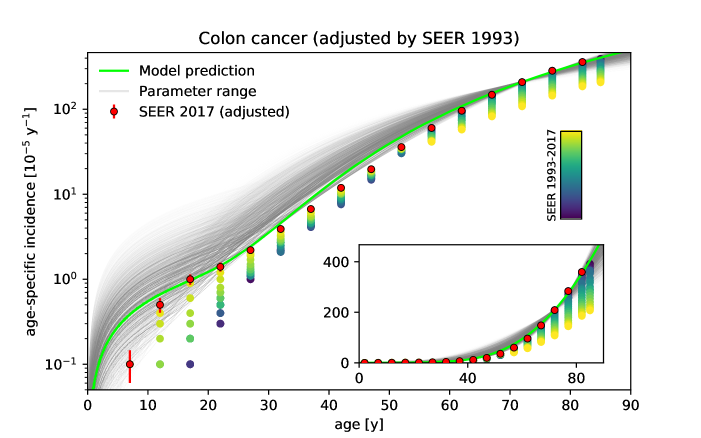
Our goal is to demonstrate that the competition between wild-type and tumor cells in niches in the early phase of tumor initiation may be a major mechanism for the fate of tumor development. For this, we develop a cell-based stochastic model which represents the pretumor competition between wild-type and tumor stem cells in colonic crypts and thus both focuses on the early-phase of tumor initiation as well as explicitly incorporates the spatial structure of the tissue. The model reproduces the age-specific incidences of colon cancer from the Surveillance Epidemiology and End Results (SEER) database quantitatively, see Fig. 1. The model predictions agree with the epidemiological data not only in the regime of older ages but also down to young ages, where incidences are several orders of magnitude smaller. This correspondence supports the recently proposed notion that the fate of tumor development may be determined in the early phase of tumor development long before a tumor becomes detectable [34]. Since the model explicitly distinguishes between (i) adenocarcinoma and (ii) adenoma, which progressed to adenocarcinoma, we additionally predict the fraction of incidences corresponding to either type. These fractions are in agreement with the common clinical estimates that more than of colon adenocarcinomas arise from colonic polyps and that the fraction of benign tumor is over [35]. In particular, we quantify how the fraction of incidences resulting from progressed adenoma increases with age, which supports the relevance of colorectal cancer screening at older age. We emphasize that all parameters of the model correspond directly to known physiological parameters and are consequently set by previously reported values. Only the effective stem cell replacement rate within a crypt is used as a single fit parameter to set the time scale. We find this effective replacement rate to be considerably smaller than the actual replacement rate, which implies that the time scale is limited by the processes succeeding clonal conversion of a crypt.
Materials and Methods
Cancer screening data
The Surveillance Epidemiology and End Results (SEER) research database comprises cancer incidences and at-risk population data in the US [33]. We consider age-specific incidence rates of colon cancer as reported in the most recent SEER dataset 2013-2017. For the age-specific incidence rates in the SEER report the number of diagnosed cancers, as a function of age, is compiled and then divided by the corresponding total population at risk. The incidence rates are reported in eighteen 5-year age groups and we assign rates to the midpoint of these groups. The last age group is excluded due to rapidly declining person-years after age . We estimate the confidence interval of the rates by assuming a Poisson distribution of the incidences and compute the range containing of the incidences based on the US Standard population 2000 [36] in each age group.
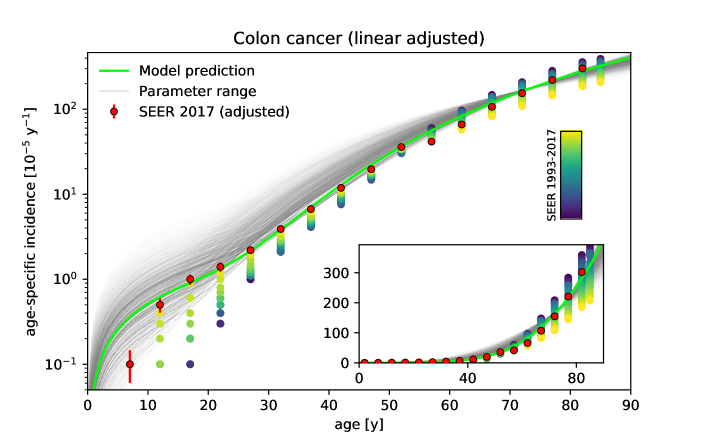
However, the main source of uncertainty is not the statistical error but the secular trends of incidence rates observed for colorectal cancer: While the overall incidence of colorectal cancer has been decreasing since 1998 due to a decrease in the age groups years, the incidence for men and women younger than has been rising, in particular for adolescents and young adults [37, 38]. The incidence rates exhibit these age-group-dependent trends both over calendar year and birth cohort, see also Fig. B. The decrease is attributed to the widespread uptake of colonoscopy screening (and consequent resections) for people above [39, 37, 40, 41]. To account for the effect of colorectal cancer screening, we consider several reasonable adjustments of the incidence rates from the SEER 2017 dataset. As representative case, we display the results for colon and rectum in Fig. 1 and Fig. 4, respectively, for which the rates of all age groups above years have been increased by a factor . This adjustment is based on estimates that the annual incidence of colorectal cancer at ages between 2000 and 2015 is reduced on average by due to screening [42, 40]. Results for other adjustments (including the case of the unaltered rates) are reported in SI Text C. For the colon, we find for each adjustment a similarly good correspondence between the epidemiological incidence rates and our model prediction. Mostly, the fitted effective replacement rate for a particular parameter set is modulated by the choice of the adjustment. Furthermore, we find agreement of our model predictions with incidence rates of gastric cancer, whose secular trends are far less pronounced.
At ages younger than colorectal screening occurs rarely. While the upward trend of the incidences at these younger ages is less understood, two opposing effects have been implicated: On the one hand, the apparent rise in incidences below years may be attributed to life-style changes [37, 43] an effect not incorporated in our biological model. On the other hand, recent results support the presence of a large undetected preclinical case burden years, which is not reflected in the rates of colorectal cancer observed in the SEER registries [44]. The latter is consistent with the fact, that people younger than are more likely to be diagnosed with late-stage disease, largely due to sometimes for years delayed follow-up of symptoms [43]. This implies that cancer incidences are either missed at younger ages or wrongfully assigned to older age groups, whose rates they barely impact as the age-specific rates increase significantly with age. Since the net impact of these two opposing effects is unknown, we do not adjust incidence rates below years, similar to Ref. [18]. Note that external factors, like life-style changes and screening effects, can be indirectly captured by adjustments of the observed incidence rates for age, birth cohort, and time period effects, for instance via age-period-cohort (APC) epidemiological models [45, 15, 17, 18, 20]. However, while such statistical adjustments compensate for secular trends, they do not allow to determine what the incidence rates would be in the absence of these external factors. Consequently, such adjustments are often not invoked when comparing incidence rates to biological models of cancer development, in particular for colon cancer [22, 23, 2, 29, 24, 32].
Note that incidences of colorectal cancer differ between sexes [45, 2, 16, 17, 18, 30], races [45] as well as left-(distal) and right(proximal)-sided cancers [17, 40]. Since we focus with our model on the net effect of basic biological processes and thus do not incorporate mechanisms accounting for these differences, e.g., screening differences which account for almost half of the disparity between colorectal incidences in white and black populations [37], we consider the total number of incidences regardless of sex, race or site, as previous model approaches [22, 24, 32].
Pretumor progression model based on niche competition
In order to test the hypothesis, that the fate of tumor development is determined by niche competition in the early phase of tumor development, we predict the incidence rates of colon cancer by a mathematical model based on the tumor initiation of the adenoma-adenocarcinoma sequence. The tumor-originating cells of colon cancer are known to be multipotential stem cells located in a niche at the base of intestinal crypts, also called intestinal glands, which are finger-like invaginations on the surface of the intestine [46, 11, 12]. On average such a stem cell divides asymmetrically, resulting in one daughter cell which remains as stem cell in the niche and another daughter cell, which is committed to differentiation and leaves the crypt, such that the number of stem cells in the niche is always roughly conserved. However, the progeny of one stem cell can effectively replace the progeny of another whenever symmetric divisions occur, that is one stem cell divides into two stem cells while another divides into two differentiated cells, which leave the crypt. During division stem cells can mutate and thus gradually accumulate alterations which turn them into tumor cells. Tumor cells compete with the original stem cells via replacement in the niche and thus may at some point dominate the entire niche (niche succession or clonal conversion). The so fixated tumor cells may then grow across the intestinal epithelium by crypt fission and clonal expansion of tumor cells from the converted crypt and consequently a tumor develops. If tumor cells are benign at that point, a premalignant lesion (adenoma) develops, which may advance to cancer (adenocarcinoma) given a tumor cell progresses to a malignant type (sequential progression). If tumor cells are already malignant during fixation in the niche, an adenocarcinoma grows directly (tunneling progression).
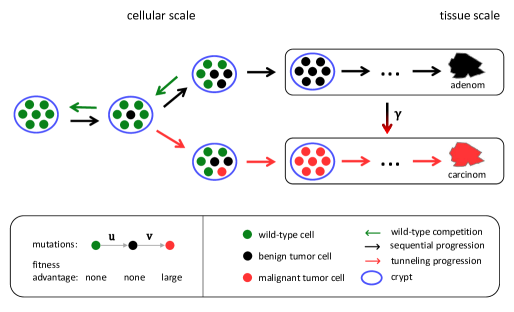
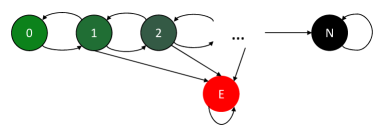
We emulate this multistep process using a cell-based Moran model representing the competition between wild-type stem cells and tumor cells in the niche [47, 34], see Fig. 2 for illustration and SI Text A for details: We consider a fixed number of cells in the niche, all of which are initially wild-type stem cells. During proliferation a wild-type cell can mutate with probability to a benign tumor cell, which in turn can mutate with probability to a malignant tumor cell. Wild-type cells and benign tumor cells compete by replacing each other in the niche with rate . Eventually, via this competition, existing benign tumor cells either go extinct or they replace every wild-type cell in the niche. In the latter case, the tumor cells are considered to spread and develop a clinically detectable adenoma. From the Moran model corresponding to these dynamics, we obtain the adenoma probability that an adenoma has developed from the crypt until age , see Eq. (S5). Alternatively, during competition in the niche, any benign tumor cell can acquire malignancy. Due to the proliferative fitness advantage thus acquired, a malignant tumor cell rapidly dominates the niche and consequently an adenocarcinoma develops directly. From the Moran model, we obtain the carcinoma probability that an adenocarcinoma has developed from the crypt until age , see Eq. (S6).
Thus, there are two possible origins of colon cancer in the model: (i) Firstly, tunneling progression, which means an adenocarcinoma develops directly from a single niche with probability . (ii) Secondly, an adenoma develops in a single niche with probability and progresses with probability to an adenocarcinoma during clonal expansion. Therefore, the probability that cancer has developed from the crypt until age via this sequential progression is . Consequently, the combined probability that an adenocarcinoma develops from a single crypt until age , either with benign precursor stage or directly, is . Inversely, the probability that a crypt has not given rise to a cancerous tumor until age is . Taking into account that there exist crypts in the colon and a single one suffices as origin of a tumor, the probability that a human has not contracted colon cancer until age is
| (1) |
From this survival function , the model’s age-specific incidence rate , or hazard function, is computed
| (2) | ||||
The six parameters , , , , and of the model are all directly measurable, independently of the emerging age-specific incidence rates, and their values have already been determined or estimated in previous experiments, see Tab. 1. Note that a simpler version of the model has already been used to estimate the competition range for several types of solid tumors from the fraction of observed benign tumors [34] and to evaluate the spontaneous tumor regression in pilocytic astrocytoma [47].
The model employs some reasonable simplifications: While colon cancer increases malignancy gradually in seven steps [48], we only regard the last benign alteration and the first malignant alteration. In particular for colon cancer, more than two steps or more than one type of genomic instability are not expected to enhance the agreement between a progression model and the epidemiological data [2]. Furthermore, we do not assume a particular spatial arrangement of the stem cells in the niche, but rather use two limiting cases of either space-free (all-to-all competition) or one-dimensional cell arrangement (competition only with two neighbors). Since the model’s probabilities and depend monotonously on the number of cells which can compete with each other [49], the incidence rates for any cell arrangement should lie in between these two limiting cases. Note that typically neighboring replacement is assumed, consistent with observations from genetic lineage tracing in mouse and recent observations of epidermal stem cells [50]. However, for the small number of stem cells in a colonic crypt these two limiting cases yield almost matching results. Furthermore, while the model allows explicitly for two different mutation probabilities , we use the same parameter range for both, see Tab. 1, although the benign mutation may allow the malignant mutation to occur more easily . Finally, the model neglects the growth kinetics after tumor cells fixate in a niche. The details of this growth may be very complex and the length of the adenoma-adenocarcinoma interval depends on size, morphology and pathological type of the adenoma [51] but the kinetics have been estimated by models with clonal expansion [18]. Note that a single converted crypt does not directly lead to a carcinoma but rather additional processes like crypt fission and evolutionary and adaptive processes that establish a tumor micro-environment and a permissive immune-ecology are critical for the spread and fixation of the mutation in the tissue. We take these processes only implicitly into account by using the replacement rate in the model as an effective parameter setting the time scale. Thus, this effective rate is expected to be smaller than the actual replacement rate, reflecting the additional time to fixation in the tissue and diagnosis. This smaller effective replacement rate also allows to compensate for the simplified competition after occurrence of a single malignant tumor cell within the niche. This is again reasonable due to the small number of cells a malignant cell has to outcompete in a colonic crypt. Finally, the model, while conceptually very different, produces age-specific incidence rates with features typically known from multistage clonal expansion models (MSCE) [17, 16, 21], that is incidence rates exhibit a power law at young age and transition with increasing age to an exponential increase, followed by a linear increase until asymptotically becoming constant, see SI Text A for details. Note that MSCE models include an early phase without expansion [18], resulting in a non-zero probability that cancer arises within a single crypt or from a very small number of initiated cells, which corresponds effectively to a fixation before proliferation of crypts.
Results
| Parameter | previously reported range | ||
|---|---|---|---|
| niche size | [52, 53, 54] | ||
| number of crypts | [55, 56] | ||
| mutation probabilities | [52] | ||
| fraction of adenomas progressing to carcinomas | [57, 58] | ||
| stem cell replacement rate | [59, 52, 54] |
We apply our pretumor progression model to age-specific incidence rates of colon cancer, see Fig. 1, adjusted for effects of colorectal screening, see SI Text C. We set the model’s parameters as reported for the colon in the literature, see expected values in Tab. 1, and calibrated the effective replacement rate by the epidemiological data, see SI Text B. The resulting prediction of the model agrees with the age-specific incidence rate of the most recent SEER data not only in the regime of older ages, see rates on linear scale in inset of Fig. 1, but also down to young ages, where incidences are more than two orders of magnitude smaller, see rates on logarithmic scale in the main panel of Fig. 1. The only exception is the single incidence rate at years, for which the prediction is about four times higher than the data. This discrepancy may result from the mentioned issue of delayed diagnosis, which may have a particular impact at this young age and small incidence (-times smaller than incidence in next age group ).
The robustness of the model prediction within the parameter ranges taken from the literature is checked by a coarse parameter variation: For all possible parameters sets, for which each of the parameters , , , , either assumes the lower or upper limit or expected value as reported in the literature, see Tab. 1, and for which assumes any integer , the effective replacement rate is fitted to the epidemiological data resulting in an ensemble of model predictions. For illustration, this ensemble is displayed by gray lines in Fig. 1, where for clarity the opacity of each line scales inversely with the goodness-of-fit. It turns out, that fixing any of the parameters , , , or to one of its three values while varying all other parameters, leads to an ensemble of model predictions whose average effective replacement rate, life-time fraction of benign tumor and goodness-of-fit is virtually the same in either case. In contrast, effective replacement rate and goodness-of-fit strongly depend on the niche size . In the following, we consider the parameter sets whose goodness-of-fit is less than hundred times bigger than the smallest occurring value, which corresponds roughly to the gray lines visible in Fig. 1. Within this ensemble, the niche sizes are predominantly with an average , meaning that the model fits better for the average or lower limit of the niche size. The fact that the niche size has such an impact on the predictions but not the number of crypts , which also affects the total number of stem cells, highlights the crucial role of the competition in the niche, which is only affected by but not .
Furthermore, we estimate from the model the life-time fraction of adenocarcinoma, which arise from colonic crypts, as ( y) and the life-time fraction of benign tumor as in agreement with the corresponding clinical estimates of and [35].
In the main panel of Fig. 1, the incidence rates from the model are additionally decomposed into the contribution from (i) tunneling progression without precancerous lesions and (ii) sequential progression . The incidences at younger age are dominated by the former type, while they result almost solely from the latter one for ages beyond . Furthermore, the incidence rates from the tunneling progression exhibit a linear slope while the sequential progression leads to a much steeper course, which resembles a Weibull distribution. These features of the model’s dynamics are consistent with the fact that early onset gastrointestinal cancers commonly arise without precancerous lesions while adenomatous lesions are more common in older patients and that carcinogenesis accelerates after the age of [60, 61, 30]. Note that the probability should be understood as an upper limit for sequential progression from a single crypt as some tumors may turn malignant during tumor growth or go extinct before the adenoma becomes detectable. Consequently, the probability is a lower limit of the fraction of tunneling progression. This implies that the age at which the contributions of both progressions match is underestimated by the model in Fig. 1.
The ensemble of model predictions covers a range of effective replacement rates per stem cell with an average per stem cell. While an effective rate smaller than the actual rate is in principle expected due to the neglected timescale between fixation in the crypt and clinical detection, this effective rate is considerably (factor ) smaller than the physiological replacement rates reported in the literature, see Tab. 1 [52, 54]. This suggests that, while the course and composition of the age-specific incidence rates seems to be determined by the competition in the crypt, the time scale is predominantly set by the processes succeeding the conversion of crypts. Note that the physiological replacement rate itself has been recently updated [52, 54] by two orders of magnitude compared to previous estimates, which puts the replacement rate close to the cell division rate [62, 53]. Finally, note that we adjusted the epidemiological incidence rates for effects of colorectal screening via different estimates and observe similar correspondence between model and data in all cases, see SI Text C.
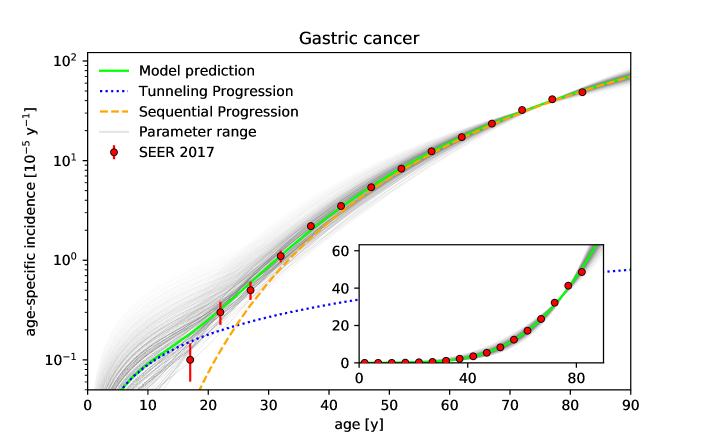
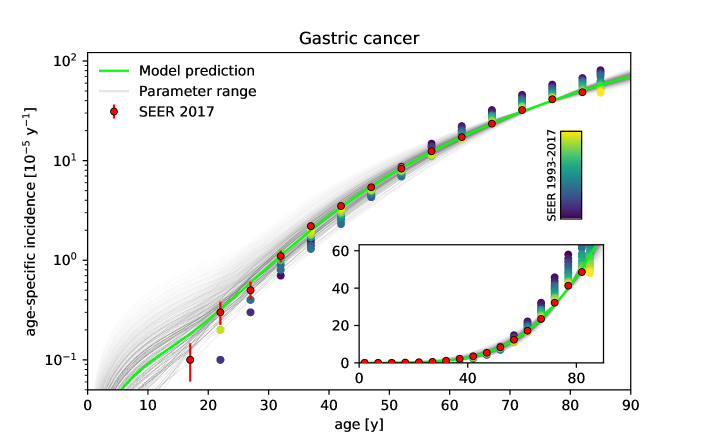
The model is additionally applied to gastric cancer, whose tumor-originating cells are proposed to be also compartmentalized into niches, see Fig. 3. In the context of gastric cancer, it is known that gastric corpus and antrum have distinct stem cells regarded as the tumor-originating cells, which are also structured in stem cell niches within gastric glands [63]. Since the corresponding parameters are not available as detailed as for the colon, the range of the parameters , , , and are assumed to match the ranges for the colon, see Tab. 1, while the number of gastric glands is estimated from the approximate surface of the stomach cm2 and the density of glands [64]. We find a good agreement between model prediction and epidemiological data, see Fig. 3. The obtained effective replacement rate is similar to the value obtained from the model for the colon, see Fig. 1.
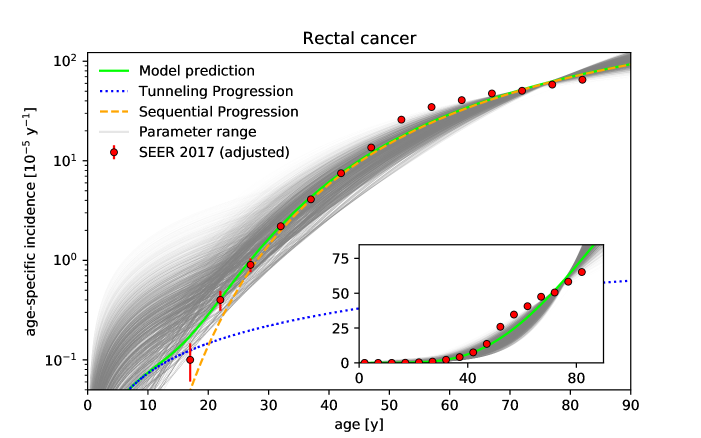
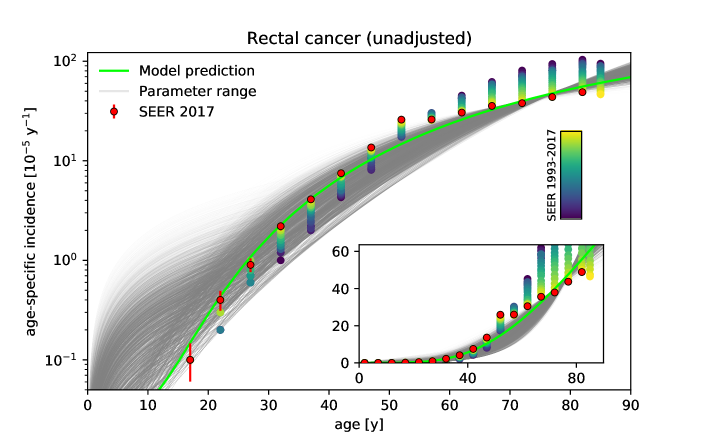
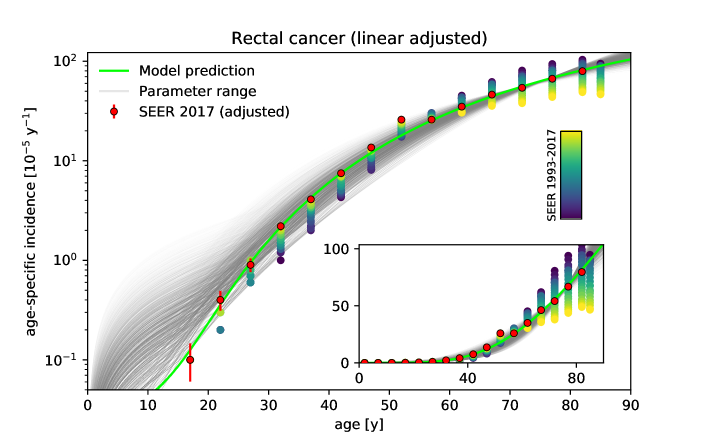
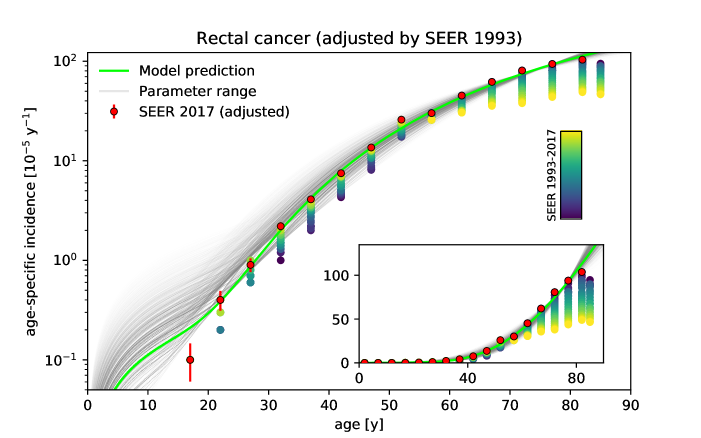
The model is additionally applied to rectal cancer, whose tumor-originating cells are also compartmentalized into niches, see Fig. 4. For rectal cancer, it is reasonable to assume the same parameters as for the colon, see Tab. 1, except for the number of crypts . Since the rectum is on average one order of magnitude shorter than the colon, the number of niches is assumed to be ten times smaller . The resulting prediction of the model displays a good qualitative correspondence for the age-groups below , see Fig. 4. However, there are considerable deviations in the age groups above years. Still, the model predictions displays a rough visual correspondence to the data, capturing essential, qualitative characteristics, which is not self-evident considering that only a single parameter has been fitted. In addition, the data points at older age groups may be problematic due to an underestimated impact of rectal screening. Risk reduction is known to vary by subsite of the colon and rectum [42] while the estimates of this risk reduction are for colorectal cancer [39, 42, 40], whose incidences are dominated by incidences of colon cancer. Indeed, assuming higher reduction of annual incidences for rectal cancer due to screening leads to substantially better correspondence between model and data, see Fig. G and Fig. H. In any case, according to our model prediction the incidences of the rectum are dominated by sequential progression even at small ages. The obtained effective replacement rate per stem cell is again considerable smaller than the range reported for the colon. In particular, the obtained effective replacement rates for both rectal and gastric cancer are similar to the one obtained for colon cancer. However, compared to colon cancer, contribution of tunneling progression to the incidence rates of rectal and gastric cancer result are much smaller with deviations from the sequential progression only visible below years.
Discussion
We employed a Moran model representing the pretumor competition between wild-type and tumor stem cells in colonic crypts to quantitatively reproduce age-specific incidences of colon cancer. Additionally, the model predicts the fraction of incidences corresponding to either (i) adenocarcinoma or (ii) benign polyps, which progressed to adenocarcinoma, and we find these fractions in agreement with common clinical estimates. Furthermore, the age-dependency of these fractions is consistent with the occurrence of precancerous lesions in different age regimes. In particular, this highlights the importance of cancer screening after the age of . Note that all growth and clonal expansion processes after the fixation of tumor cells in the tumor originating niche are not explicitly incorporated into the model, but only implicitly contained in an effective replacement rate. We find this effective rate to be substantially lower than the actual physiological replacement rate [52, 54]. Thus, the agreement between model and epidemiological data supports the notion that the fate of tumor development may be majorly determined by the early phase of tumor development, while the time scale of tumor development is primarily set by processes of clonal expansion and tumor growth.
We emphasize that our model does not suggest, that a single converted crypt results inevitably into a macroscopic carcinoma, which would be biologically untenable. Rather all processes between conversion of crypts and diagnosis of a macroscopic malignancy are omitted, since the purpose of the model is to estimate the impact of the earliest phase of tumor development and the architecture of the tissue containing the tumor originating cells. This does not mean that the omitted processes are negligible. Instead, the relatively small effective replacement rate obtained implies that the processes succeeding the clonal conversion of crypts set the time scale of the incidence rates. However, the results suggest that the shape and composition of the incidence rates may be determined by the structure of the tissue hosting the tumor-originating cells and the competition dynamics inside the crypts.
Note that in contrast to most previous pretumor models, which usually introduce four or more parameters that are calibrated using the epidemiological age-specific cancer incidences, both for colon [2, 17, 29, 24] or other types of cancer [27, 28, 18, 20, 30, 16, 25], our model is solely based on directly measurable parameters, which are already known from clinical and biological studies on the colon independent of the epidemiological incidence rates. Consequently, the model only requires a single fit parameter, the effective replacement rate, which both sets the time scale of the niche-competition as well as compensates for the neglected time-span between fixation in the niche and clinical detection.
The model is additionally applied to rectal and gastric cancer, whose tumor-originating cells are also proposed to be compartmentalized into niches, but exhibit incidence rates considerably smaller than for colon cancer. For this we only adapt the number of niches while assuming the same ranges as for the colon for all other parameters. Despite this simplification, we observe reasonable correspondence between predicted and epidemiological incidences rates. Furthermore, the obtained effective replacement rates are similar for all three cases. In combination, this points towards similar dynamics of tumor development for colon, rectum and stomach.
Note that for colorectal cancer, two-step models have been considered before to capture the dynamics of adenomatous and malignant tumor cells [22, 23, 2, 24]. Furthermore, the distribution of adenoma and adenomacarcinoma sizes at different ages has been inferred from a model [24], clonal expansion dynamics of colorectal cancer has been derived from intra-tumor heterogeneity [59] and even the competition in colonic crypts has been discussed [22, 23]. In contrast to these models, we explicitly incorporate competition of benign tumor cells with wild-type cells taking into account their spatial structure, while neglecting other processes considered in these models. The agreement of the prediction of our model and the epidemiological incidence rates emphasizes the dominant role that competition in niches may play in tumor development. This is interesting in the context of previous investigations of colorectal and gastric cancer using a multistage clonal expansion (MSCE) model, which suggest that the form of the age-specific incidence rates is determined by the dynamics until the fixation of tumor cells, while the growth dynamics after fixation only cause a slight time shift [18]. Future approaches could incorporate the model of crypt competition as process of tumor initiation into the MSCE model and examine how this affects the parameters of the model and their robustness.
Our model does not discern between patient subgroups such as sex, race, and cancer site. In principle, the model could be fitted to each of these subgroups, but note that there are considerable variations in the level of reporting across them, e.g., screening differences account for almost half of the disparity between colorectal incidences in white and black populations [37]. Moreover, the model assumes that all parameters are shared across the population, because the goal is not to predict individual cancer risks. For this, one would have to take into account individual predispositions regarding for instance genetics, immune system or lifestyle.
While the model is inspired by colonic crypts, it is potentially relevant for tumor development in a wide range of tissues. Firstly, the model can be applied to cancer types with similar spatial structure of the tumor-originating cells, as in the case of rectal or gastric cancer [63]. Secondly, the model may also apply to types of cancer whose tumor-originating cells are not explicitly compartmentalized into niches. The Moran model within the niche has already been used to estimate an upper limit for the number of cells competing with each other from the fraction of clinically observed benign tumors for several types of cancer [34]. This so called competition range is surprisingly small for a wide range of tumor types, less than cells, even for tumors in tissue without explicit stem cell compartments like the crypts. Note that for a large competition range the competition between the malignant tumor cells and the other cells in the niche may not be negligible anymore, but increase the time scale until clonal conversion in the niche. Thus, the model has to be extented in the future by this competition to be applicable to types of cancer with large competition ranges, such as hepatocellular carcinoma [65] or glioblastoma [66].
Application of the model of niche competition to cancer in tissues other than the colon is reasonable for two more reasons: Firstly, most other solid tumors have an age-specific incidence qualitatively very similar to colon carcinoma [29]. Secondly, incidence rates resulting from the model share typical features with incidence rates from multistage clonal expansion models [16, 21, 17], which already achieve good matches with epidemiological data for several types of cancer [16, 15, 17, 18, 19, 20, 21]. Note that for most tissues, much less is known about tumor initiation and development until detection than for the colon. Applying the model to such types of cancer may give additional insight into the hardly observable dynamics of early cancer development.
Acknowledgments
We acknowledge support by the EU, the European Social Fund (ESF) and by tax funds on the basis of the budget passed by the Saxon state: SAB-Nr. 100382145. The funding provided salary for (A.V.-B., S.L., D.H.). The funders had no role in study design, data collection and analysis, decision to publish, or preparation of the manuscript.
Supporting Information (SI)
A Moran Model of niche competition
We use a three-type Moran model with mutation to quantify the stem cell dynamics in the niche of a single colonic crypt as described in the main manuscript. The niche consists of cells, each of which may be wild-type, benign or malignant. A cell in the niche is replaced by the offspring of another cell with replacement rate , where is the replacement rate per stem cell. At replacement the offspring can additionally acquire mutations, i.e. a wild-type cells mutates with probability into a benign tumor cell and a benign tumor cell mutates with probability into malignant tumor cell. Formally, the model is a Markov process on the state space , see sketch in Fig. A for an illustration. Here, the states correspond to the number of benign tumor cells in the niche, while the remaining cells in the niche are wild-type stem cells, and the state represents the presence of a single malignant tumor cell in the niche. The dynamics is determined by a rate matrix . For the space-free limit, i.e., when every cell is able to replace any other cell in the niche, the rate matrix is given by
| (S1) |
The factors containing and result from combinatorics [67, 47, 34]. The other geometric limiting case is the model in which cells are considered to be ordered on a ring, i.e. each cell can only replace one of its two neighbors. Analogously, the rate matrix for this case is given by [67, 34]
| (S2) |
where, due to , we neglect the term , which describes an additional benign mutation of a wild type cell. This reasonable approximation implies that benign mutants only occur on a single connected interval of the ring of cells. A real crypt will have some geometric restrictions that lie in between these to limiting cases and .
For either rate matrix , the dynamics of the niche, i.e. the distribution on the state space at age which evolved from an initial state at age , is given by
| (S3) |
which yields the solution
| (S4) |
for , with the transition matrix given by a matrixexponential function. The initial state is set to , i.e. the niche starts at birth with only wild-type cells in the crypt. The probability that the complete niche consists of benign tumor cells until age is
| (S5) |
and the probability that the first malignant cells emerges until age is
| (S6) |
We further list some analytic and empiric properties of the model, which demonstrate that the incidence rates generated by the model display features typical for multistage clonal expansion models, whose incidence rates transition (from young to old age) from power-law to exponential to linear to constant asymptote [17, 16, 21]: Previously, an analytic expression for the asymptotic absorbtion probabilities and into state and state , respectively, has been derived [47, 34]. These asymptotic probabilities are predominantly determined by the relation of the niche size and the probability to progress from a benign tumor cell to a malignant one. A small niche ( for model) is primarily absorbed in the benign state, whereas a large niche ( for model) is primarily absorbed in the malignant state , while intermediate niche sizes lead to finite probabilities for both states. This property has already been exploited to estimate upper limits for the effective niche sizes of several types of cancer from their recored benign tumor fraction [34]. Furthermore, the probability to not be in either state or until time decreases exponentially for sufficiently large times , where the rate is the largest eigenvalue of the rate matrix that results from limiting the rate matrix only to the non-absorbing states . Since the probability is qualitatively very similar to the survival probability in Eq. (1), one may infer that the age-specific incidence rates generated by the model according to Eq. (2) should become constant asymptotically . Moreover, the probability of tunneling progression , whose contribution is maximal at young ages, follows a power law . This is in accordance with the argument of Armitage and Doll, that in a pure multistage model the incidence rates follow a power law , with the number of mutations necessary for a cell to become malignant [13, 14], which is in our model. In contrast, we observe numerically that the probability of sequential progression matches the cumulative distribution function of a Weibull distribution , which implies for barely changing survival probabilities , see Eq. (2),
| (S7) |
that the contribution of the sequential progression to the incidence rates follows a Weibull distribution. Note that it is common for models of cancer development that the predicted incidence rates (or hazard function) effectively represent a Weibull distribution [29, 27, 26, 22, 25, 28]. The assumption is reasonable, e.g., for colon cancer, since colon cancer is overall a relatively minor cause of death and has a low lifetime incidence.
B Fit of replacement rate
We determine the least known parameter, the effective replacement rate , by fitting the model to the epidemiological age-specific incidence rates . First, we compute for given set of parameters , and from the literature the survival probability of the model in dimensionless time , using Eq. (1), Eq. (S5), and Eq. (S6) up until a sufficient long time such that the probability is larger than the lifetime risk of colon cancer ( [33]) to ensure that the corresponding incidence rates , see Eq. (2), cover the range of ages of the epidemiological data.
When the predicted and epidemiological rates can be matched very close at all ages, the rate can be directly obtained by matching the corresponding survival probabilities , . Since the probabilities are monotonously decreasing with age , we can identify each data point to a simulated point with . Thus, each data point gives an estimate of the replacement rate and we fit the replacement rate as their mean . The standard deviation of the replacement rates may then serve as a measure of the quality of a single fit.
However, since deviations between predicted and epidemiological rates predicted and epidemiological rates may cancel out in the corresponding survival probabilities, it is better to fit the rates directly. We use non-linear least-square minimization provided by the python package lmfit [68] to obtain the effective rate by minimizing the residuum
| (S8) |
For a given parameter set the goodness-of-fit is quantified by the relative square deviation between the rescaled rate of the model and the data
| (S9) |
For the variation of the parameters the effective replacement rate is reported as average and standard deviation of the ensemble of fits.
C Adjustments for colorectal screening
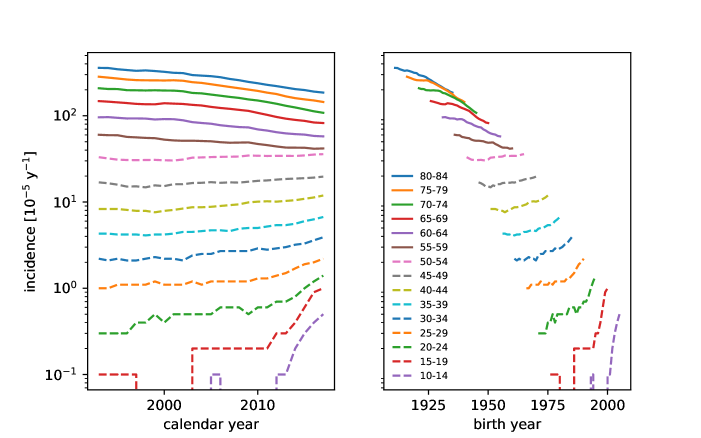
The SEER data for colorectal cancer is fraught with two important secular trends, i.e., a downward trend of incidences at ages above 55 due to widespread colorectal screening and resection [37, 38, 39, 40, 41] and an upward trend of incidences of early onset colorectal cancer for ages below 50, whose origin is less understood but has been attributed to both life-style changes [37, 43] as well as the detection of prevalent subclinical cases [43, 44]. The incidences exhibit these age-group-dependent trends both over calendar and birth year, see Fig. B, especially a strong birth cohort effect for younger ages. While these trends may be indirectly compensated for by age-period-cohort (APC) epidemiological models [45, 15, 17, 18, 20], such statistical adjustments do not allow to determine what the incidence rates would be without these external effects. Consequently, such adjustments are rarely invoked when comparing incidence rates to biological models of cancer development, in particular for colon cancer [22, 23, 2, 29, 24]. One approach could be to perform the APC adjustments, properly anchored for identifiability, on the relevant rates of the biological model, e.g., the replacement rate , to identify which parameters are most sensitive to the secular trends. Our approach is to directly incorporate independent estimates of the impact of colorectal screening.
While the exact quantification of the mentioned external effects is not possible, we consider several reasonable adjustments of the incidence rates from the SEER 2017 dataset to account for the effect of colorectal cancer screening. First of all we present the original incidences for colon and rectum from the SEER 2017 database in Fig. C and Fig. F along with the incidences from the previous years for illustration of the age-dependent secular trends. The first adjustment is based on estimates that the annual incidence of colorectal cancer at ages between 2000 and 2015 is reduced on average by due to screening [40]. Thus, the colon and rectal incidences displayed Fig. 1 and Fig. 4 correspond to the SEER database of 2017, for which the rates of all age groups above years have been increased by a factor . The second adjustment is based on the estimate that the impact of screening colonoscopy is modest in the age group and increases for older age groups [42]. From the predictions of Ref. [42] we obtain roughly an reduction of annual incidences for the age group , for age group , and for the age group . We assign these percentages to the ages , , and , respectively, and linearly interpolate the annual reductions between these ages, which we use to again adjust the results of the SEER database of 2017 in Fig. D and Fig. G. Finally, as a limit case we set the incidences above year to the ones reported in the SEER 1993 database, see Fig. E and Fig. H.
For the colon, we find for each adjustment (and without adjustment) a similar correspondence between the epidemiological incidence rates and our model prediction. Mostly, the fitted effective replacement rate for a particular parameter set is modulated by the choice of the adjustment. For the rectum, the model displays a better correspondence with the incidence rates strongly adjusted for screening effects, see Fig. G and Fig. H. Note that the risk reduction is known to vary by subsite of the colon and rectum [42] while our estimates of this risk reduction are based on colorectal cancer [39, 42, 40], whose incidences are dominated by incidences of colon cancer.
Note that at ages younger than colorectal screening occurs rarely and instead the rates may be subject to two opposing effects: On the one hand, the apparent rise in incidences below years may be attributed to life-style changes [37, 43] an effect not incorporated in our biological model. On the other hand, recent results support the presence of a large undetected preclinical case burden years, which is not reflected in the rates of colorectal cancer observed in the SEER registries [44]. The latter is consistent with the fact, that people younger than are more likely to be diagnosed with late-stage disease, largely due to sometimes for years delayed follow-up of symptoms [43]. This implies that cancer incidences are either missed at younger ages or wrongfully assigned to older age groups, whose rates they barely impact as the age-specific rates increase significantly with age. Since the net impact of these two opposing effects is unkown, we do not adjust incidence rates below years, similar to Ref. [18].
Note that the secular trends for gastric cancer are less pronounced compared to colorectal cancer, see Fig. I, and thus are used unadjusted from the SEER 2017 database.
References
- 1. Vogelstein B, Kinzler KW. The multistep nature of cancer. Trends in Genetics. 1993;9(4):138–141. doi:10.1016/0168-9525(93)90209-Z.
- 2. Little MP, Vineis P, Li G. A stochastic carcinogenesis model incorporating multiple types of genomic instability fitted to colon cancer data. J Theor Biol. 2008;254(2):229–238. doi:10.1016/j.jtbi.2008.05.027.
- 3. Fearon ER, Hamilton, Vogelstein B. Clonal analysis of human colorectal tumors. Science. 1987;238(4824):193–197. doi:10.1126/science.2889267.
- 4. Reya T, Morrison SJ, Clarke MF, Weissman IL. Stem cells, cancer, and cancer stem cells. Nature. 2001;414(6859):105–111. doi:10.1038/35102167.
- 5. Williams MJ, Werner B, Barnes CP, Graham TA, Sottoriva A. Identification of neutral tumor evolution across cancer types. Nature Genetics. 2016;48(3):238–244. doi:10.1038/ng.3489.
- 6. Wu CI, Wang HY, Ling S, Lu X. The Ecology and Evolution of Cancer: The Ultra-Microevolutionary Process. Annu Rev Genet. 2016;50(1):347–369. doi:10.1146/annurev-genet-112414-054842.
- 7. Amoyel M, Bach EA. Cell competition: how to eliminate your neighbours. Development. 2014;141(5):988–1000. doi:10.1242/dev.079129.
- 8. Lodish H, Berk A, Zipursky SL, Matsudaira P, Baltimore D, Darnell J. Tumor Cells and the Onset of Cancer. Molecular Cell Biology 4th edition. 2000;.
- 9. Kuang Y, Nagy JD, Eikenberry SE. Introduction to Mathematical Oncology. CRC Press; 2016.
- 10. Fox JG, Wang TC. Inflammation, atrophy, and gastric cancer. J Clin Invest. 2007;117(1):60–69. doi:10.1172/JCI30111.
- 11. Zeuner A, Todaro M, Stassi G, De Maria R. Colorectal Cancer Stem Cells: From the Crypt to the Clinic. Cell Stem Cell. 2014;15(6):692–705. doi:10.1016/j.stem.2014.11.012.
- 12. Sottoriva A, Kang H, Ma Z, Graham TA, Salomon MP, Zhao J, et al. A Big Bang model of human colorectal tumor growth. Nature Genetics. 2015;47(3):209–216. doi:10.1038/ng.3214.
- 13. Armitage P, Doll R. The Age Distribution of Cancer and a Multi-stage Theory of Carcinogenesis. Br J Cancer. 1954;8(1):1–12. doi:10.1038/bjc.1954.1.
- 14. Armitage P, Doll R. The age distribution of cancer and a multi-stage theory of carcinogenesis. Br J Cancer. 2004;91(12):1983–1989. doi:10.1038/sj.bjc.6602297.
- 15. Moolgavkar SH, Meza R, Turim J. Pleural and peritoneal mesotheliomas in SEER: age effects and temporal trends, 1973-2005. Cancer Causes Control. 2009;20(6):935–944. doi:10.1007/s10552-009-9328-9.
- 16. Meza R, Jeon J, Moolgavkar SH, Luebeck EG. Age-specific incidence of cancer: Phases, transitions, and biological implications. Proc Natl Acad Sci USA. 2008;105(42):16284–16289. doi:10.1073/pnas.0801151105.
- 17. Meza R, Jeon J, Renehan AG, Luebeck EG. Colorectal Cancer Incidence Trends in the United States and United Kingdom: Evidence of Right- to Left-Sided Biological Gradients with Implications for Screening. Cancer Res. 2010;70(13):5419–5429. doi:10.1158/0008-5472.CAN-09-4417.
- 18. Luebeck EG, Curtius K, Jeon J, Hazelton WD. Impact of Tumor Progression on Cancer Incidence Curves. Cancer Res. 2013;73(3):1086–1096. doi:10.1158/0008-5472.CAN-12-2198.
- 19. Meza R, Chang JT. Multistage carcinogenesis and the incidence of thyroid cancer in the US by sex, race, stage and histology. BMC Public Health. 2015;15(1):789. doi:10.1186/s12889-015-2108-4.
- 20. Brouwer AF, Eisenberg MC, Meza R. Age Effects and Temporal Trends in HPV-Related and HPV-Unrelated Oral Cancer in the United States: A Multistage Carcinogenesis Modeling Analysis. PLoS ONE. 2016;11(3):e0151098. doi:10.1371/journal.pone.0151098.
- 21. Brouwer AF, Meza R, Eisenberg MC. Parameter estimation for multistage clonal expansion models from cancer incidence data: A practical identifiability analysis. PLoS Comput Biol. 2017;13(3):e1005431. doi:10.1371/journal.pcbi.1005431.
- 22. Calabrese P, Tavaré S, Shibata D. Pretumor Progression: Clonal Evolution of Human Stem Cell Populations. Am J Pathol. 2004;164(4):1337–1346. doi:10.1016/S0002-9440(10)63220-8.
- 23. Kim KM, Calabrese P, Tavaré S, Shibata D. Enhanced Stem Cell Survival in Familial Adenomatous Polyposis. Am J Pathol. 2004;164(4):1369–1377. doi:10.1016/S0002-9440(10)63223-3.
- 24. Lang BM, Kuipers J, Misselwitz B, Beerenwinkel N. Predicting colorectal cancer risk from adenoma detection via a two-type branching process model. PLoS Comput Biol. 2020;16(2):e1007552. doi:10.1371/journal.pcbi.1007552.
- 25. Grotmol T, Bray F, Holte H, Haugen M, Kunz L, Tretli S, et al. Frailty Modeling of the Bimodal Age-Incidence of Hodgkin Lymphoma in the Nordic Countries. Cancer Epidem Biomar. 2011;20(7):1350–1357. doi:10.1158/1055-9965.EPI-10-1014.
- 26. Mdzinarishvili T, Gleason MX, Kinarsky L, Sherman S. A Generalized Beta Model for the Age Distribution of Cancers: Application to Pancreatic and Kidney Cancer. Cancer Inform. 2009;7:CIN.S3050. doi:10.4137/CIN.S3050.
- 27. Mdzinarishvili T, Sherman S. Weibull-like Model of Cancer Development in Aging. Cancer Inform. 2010;9:CIN.S5460. doi:10.4137/CIN.S5460.
- 28. Brody JP. Age-Specific Incidence Data Indicate Four Mutations Are Required for Human Testicular Cancers. PLoS ONE. 2011;6(10):e25978. doi:10.1371/journal.pone.0025978.
- 29. Soto-Ortiz L, Brody JP. A theory of the cancer age-specific incidence data based on extreme value distributions. AIP Adv. 2012;2(1):011205. doi:10.1063/1.3699050.
- 30. Rhyu MG, Oh JH, Kim TH, Kim JS, Rhyu YA, Hong SJ. Periodic Fluctuations in the Incidence of Gastrointestinal Cancer. Front Oncol. 2021;11. doi:10.3389/fonc.2021.558040.
- 31. Noble R, Burri D, Le Sueur C, Lemant J, Viossat Y, Kather JN, et al. Spatial structure governs the mode of tumour evolution. Nat Ecol Evol. 2022;6(2):207–217. doi:10.1038/s41559-021-01615-9.
- 32. Paterson C, Clevers H, Bozic I. Mathematical model of colorectal cancer initiation. Proc Natl Acad Sci USA. 2020;117(34):20681–20688. doi:10.1073/pnas.2003771117.
- 33. Surveillance, Epidemiology, and End Results (SEER) Program (www.seer.cancer.gov) Research Data (1975-2017), National Cancer Institute, DCCPS, Surveillance Research Program, released April 2020, based on the November 2019 submission. https://seer.cancer.gov/archive/csr/1975_2017/download_csr_datafile.php/sect_06_table.11.csv; https://seer.cancer.gov/archive/csr/1975_2017/download_csr_datafile.php/sect_24_table.07.csv;.
- 34. Buder T, Deutsch A, Klink B, Voss-Böhme A. Patterns of Tumor Progression Predict Small and Tissue-Specific Tumor-Originating Niches. Front Oncol. 2019;8. doi:10.3389/fonc.2018.00668.
- 35. Driman DK, Riddell RH. Flat adenomas and flat carcinomas: Do you see what I see? Gastrointest Endosc. 1994;40(1):106–109. doi:10.1016/S0016-5107(94)70028-1.
- 36. United States Standard Population 2000 used by SEER based on the Census P25-1130 https://seer.cancer.gov/csr/1975_2018/browse_csr.php?sectionSEL=6&pageSEL=sect_a_table.08 (Day, Jennifer Cheeseman, Population Projections of the United States by Age, Sex, Race, and Hispanic Origin: 1995 to 2050, U.S. Bureau of the Census, Current Population Reports, P25-1130, U.S. Government Printing Office, Washington, DC, 1996);.
- 37. Siegel R, DeSantis C, Jemal A. Colorectal cancer statistics, 2014. CA: Cancer J Clin. 2014;64(2):104–117. doi:10.3322/caac.21220.
- 38. Bailey CE, Hu CY, You YN, Bednarski BK, Rodriguez-Bigas MA, Skibber JM, et al. Increasing Disparities in the Age-Related Incidences of Colon and Rectal Cancers in the United States, 1975-2010. JAMA Surg. 2015;150(1):17–22. doi:10.1001/jamasurg.2014.1756.
- 39. Kahi CJ, Imperiale TF, Juliar BE, Rex DK. Effect of Screening Colonoscopy on Colorectal Cancer Incidence and Mortality. Clin Gastroenterol Hepatol. 2009;7(7):770–775. doi:10.1016/j.cgh.2008.12.030.
- 40. Levin TR, Corley DA, Jensen CD, Schottinger JE, Quinn VP, Zauber AG, et al. Effects of Organized Colorectal Cancer Screening on Cancer Incidence and Mortality in a Large Community-Based Population. Gastroenterology. 2018;155(5):1383–1391.e5. doi:10.1053/j.gastro.2018.07.017.
- 41. Cardoso R, Zhu A, Guo F, Heisser T, Hoffmeister M, Brenner H. Incidence and Mortality of Proximal and Distal Colorectal Cancer in Germany. Dtsch Arztebl Int. 2021;118(16):281–287. doi:10.3238/arztebl.m2021.0111.
- 42. Brenner H, Altenhofen L, Stock C, Hoffmeister M. Expected long-term impact of the German screening colonoscopy programme on colorectal cancer prevention: Analyses based on 4,407,971 screening colonoscopies. Eur J Cancer. 2015;51(10):1346–1353. doi:10.1016/j.ejca.2015.03.020.
- 43. Siegel RL, Fedewa SA, Anderson WF, Miller KD, Ma J, Rosenberg PS, et al. Colorectal Cancer Incidence Patterns in the United States, 1974-2013. J Natl Cancer Inst. 2017;109(8):djw322. doi:10.1093/jnci/djw322.
- 44. Abualkhair WH, Zhou M, Ahnen D, Yu Q, Wu XC, Karlitz JJ. Trends in Incidence of Early-Onset Colorectal Cancer in the United States Among Those Approaching Screening Age. JAMA Netw Open. 2020;3(1):e1920407. doi:10.1001/jamanetworkopen.2019.20407.
- 45. Luebeck EG, Moolgavkar SH. Multistage carcinogenesis and the incidence of colorectal cancer. Proc Natl Acad Sci USA. 2002;99(23):15095–15100. doi:10.1073/pnas.222118199.
- 46. Humphries A, Wright NA. Colonic crypt organization and tumorigenesis. Nat Rev Cancer. 2008;8(6):415–424. doi:10.1038/nrc2392.
- 47. Buder T, Deutsch A, Klink B, Voss-Böhme A. Model-Based Evaluation of Spontaneous Tumor Regression in Pilocytic Astrocytoma. PLoS Comput Biol. 2015;11(12):e1004662. doi:10.1371/journal.pcbi.1004662.
- 48. Vogelstein B, Kinzler KW. The Genetic Basis of Human Cancer. Subsequent edition ed. Mcgraw-Hill Professional; 2002.
- 49. Durrett R, Moseley S. Spatial Moran models I. Stochastic tunneling in the neutral case. Ann Appl Prob. 2015;25(1):104–115. doi:10.1214/13-AAP989.
- 50. Mesa KR, Kawaguchi K, Cockburn K, Gonzalez D, Boucher J, Xin T, et al. Homeostatic Epidermal Stem Cell Self-Renewal Is Driven by Local Differentiation. Cell Stem Cell. 2018;23(5):677–686.e4. doi:10.1016/j.stem.2018.09.005.
- 51. Paggi S, Radaelli F, Repici A, Hassan C. Advances in the removal of diminutive colorectal polyps. Expert Rev Gastroenterol Hepatol. 2015;9(2):237–244. doi:10.1586/17474124.2014.950955.
- 52. Nicholson AM, Olpe C, Hoyle A, Thorsen AS, Rus T, Colombé M, et al. Fixation and Spread of Somatic Mutations in Adult Human Colonic Epithelium. Cell Stem Cell. 2018;22(6):909–918.e8. doi:10.1016/j.stem.2018.04.020.
- 53. Baker AM, Cereser B, Melton S, Fletcher AG, Rodriguez-Justo M, Tadrous PJ, et al. Quantification of Crypt and Stem Cell Evolution in the Normal and Neoplastic Human Colon. Cell Rep. 2014;8(4):940–947. doi:10.1016/j.celrep.2014.07.019.
- 54. Gabbutt C, Schenck RO, Weisenberger DJ, Kimberley C, Berner A, Househam J, et al. Fluctuating methylation clocks for cell lineage tracing at high temporal resolution in human tissues. Nat Biotechnol. 2022; p. 1–11. doi:10.1038/s41587-021-01109-w.
- 55. Tomasetti C, Vogelstein B. Variation in cancer risk among tissues can be explained by the number of stem cell divisions. Science. 2015;347(6217):78–81. doi:10.1126/science.1260825.
- 56. Hounnou G, Destrieux C, Desmé J, Bertrand P, Velut S. Anatomical study of the length of the human intestine. Surg Radiol Anat. 2002;24(5):290–294. doi:10.1007/s00276-002-0057-y.
- 57. Grahn SW, Varma MG. Factors that increase risk of colon polyps. Clin Colon Rectal Surg. 2008;21(4):247–255. doi:10.1055/s-0028-1089939.
- 58. Steele SR, Johnson EK, Champagne B, Davis B, Lee S, Rivadeneira D, et al. Endoscopy and polyps-diagnostic and therapeutic advances in management. World Journal of Gastroenterology. 2013;19(27):4277–4288. doi:10.3748/wjg.v19.i27.4277.
- 59. Siegmund KD, Marjoram P, Woo YJ, Tavaré S, Shibata D. Inferring clonal expansion and cancer stem cell dynamics from DNA methylation patterns in colorectal cancers. Proc Natl Acad Sci USA. 2009;106(12):4828–4833. doi:10.1073/pnas.0810276106.
- 60. Bedenne L, Faivre J, Boutron MC, Piard F, Cauvin JM, Hillon P. Adenoma-carcinoma sequence or “de novo” Carcinogenesis?. A study of adenomatous remnants in a population-based series of large bowel cancers. Cancer. 1992;69(4):883–888. doi:https://doi.org/10.1002/1097-0142(19920215)69:4¡883::AID-CNCR2820690408¿3.0.CO;2-B.
- 61. Meining A, Morgner A, Miehlke S, Bayerdörffer E, Stolte M. Atrophy–metaplasia–dysplasia–carcinoma sequence in the stomach: a reality or merely an hypothesis? Best Pract Res Clin Gastroenterol. 2001;15(6):983–998. doi:10.1053/bega.2001.0253.
- 62. Lopez-Garcia C, Klein AM, Simons BD, Winton DJ. Intestinal Stem Cell Replacement Follows a Pattern of Neutral Drift. Science. 2010;330(6005):822–825. doi:10.1126/science.1196236.
- 63. Hayakawa Y, Fox JG, Wang TC. The Origins of Gastric Cancer From Gastric Stem Cells: Lessons From Mouse Models. Cell Mol Gastroenterol Hepatol. 2017;3(3):331–338. doi:10.1016/j.jcmgh.2017.01.013.
- 64. Kurbel S, Kurbel B, Dmitrović B, Včev A. A Model of the Gastric Gland Ejection Cycle: Low Ejection Fractions Require Reduction of the Glandular Dead Space. J Theor Biol. 2001;210(3):337–343. doi:10.1006/jtbi.2001.2313.
- 65. Ohgaki H, Kleihues P. The Definition of Primary and Secondary Glioblastoma. Clin Cancer Res. 2013;19(4):764–772. doi:10.1158/1078-0432.CCR-12-3002.
- 66. Vijay A, Elaffandi A, Khalaf H. Hepatocellular adenoma: An update. World J Hepatol. 2015;7(25):2603–2609. doi:10.4254/wjh.v7.i25.2603.
- 67. Komarova NL. Spatial Stochastic Models for Cancer Initiation and Progression. Bull Math Biol. 2006;68(7):1573–1599. doi:10.1007/s11538-005-9046-8.
- 68. Newville M, Stensitzki T, Allen DB, Ingargiola A. LMFIT: Non-Linear Least-Square Minimization and Curve-Fitting for Python; 2014. Available from: https://zenodo.org/record/11813.
- 69. Surveillance, Epidemiology, and End Results (SEER) Program (www.seer.cancer.gov) Cancer Statistics Review Archive (1993-2017), National Cancer Institute, DCCPS, Surveillance Research Program https://seer.cancer.gov/csr/previous.html;.