Formation of a solar filament by magnetic reconnection and coronal condensation
Abstract
In solar filament formation mechanisms, magnetic reconnection between two sets of sheared arcades forms helical structures of the filament with numerous magnetic dips, and cooling and condensation of plasma trapped inside the helical structures supply mass to the filament. Although each of these processes, namely, magnetic reconnection and coronal condensation have been separately reported, observations that show the whole process of filament formation are rare. In this Letter, we present the formation of a sigmoid via reconnection between two sets of coronal loops, and the subsequent formation of a filament through cooling and condensation of plasma inside the newly formed sigmoid. On 2014 August 27, a set of loops in the active region 12151 reconnected with another set of loops that are located to the east. A longer twisted sigmoidal structure and a set of shorter lower-lying loops then formed. The observations coincide well with the tether-cutting model. The newly formed sigmoid remains stable and does not erupt as a coronal mass ejection. From the eastern endpoint, signatures of injection of material into the sigmoid (as brightenings) are detected, which closely outline the features of increasing emission measure at these locations. This may indicate the chromospheric evaporation caused by reconnection, supplying heated plasma into the sigmoid. In the sigmoid, thermal instability occurs, and rapid cooling and condensation of plasma take place, forming a filament. The condensations then flow bi-directionally to the filament endpoints. Our results provide a clear observational evidence of the filament formation via magnetic reconnection and coronal condensation.
1 Introduction
Solar filaments (prominences) are composed of cooler and denser chromospheric material suspended in the hotter and rarer corona along magnetic polarity inversion lines (PILs) (Mackay et al., 2010; Chitta et al., 2019). They are observed as dark filaments on the disk, and bright prominences above the limb in H channel (Yan et al., 2015; Ouyang et al., 2017). In the formation of filaments, magnetic reconnection, rearranging the magnetic field topology, is considered to play a key role (Priest & Forbes, 2000). Based on reconnection theory, numerous models of filament formation have been developed (Pneuman, 1983; van Ballegooijen & Martens, 1989). In these models, shearing and converging motions of the photospheric magnetic fields, surrounding the PILs, result in reconnection between sheared arcades, forming the helical structures of a filament with numerous dips (van Ballegooijen & Martens, 1989). Subsequently, thermal instability within the helical structures leads to rapid cooling and condensation of plasma, supplying cooler and denser material to the filament (Pneuman, 1983). Here, the magnetic field evolution, e.g., magnetic reconnection, and the thermal evolution, e.g., coronal condensation, are treated separately. Recently, Kaneko & Yokoyama (2015, 2017) proposed a reconnection-condensation filament formation model, where reconnection can lead to flux rope formation and also to radiative condensation under some conditions.
Formation of the sigmoid or flux rope and the filament through reconnection has been widely investigated (e.g., Kim et al., 2008; Chen et al., 2014, 2018; Yang & Chen, 2019). Employing ultraviolet (UV) and extreme UV (EUV) images, reconnection between two sets of sheared arcades was evidently detected (Zheng et al., 2012; Chen et al., 2014, 2018). A longer sigmoid or flux rope then formed (Liu et al., 2010; Joshi et al., 2015). After the appearance, it erupted upward as a coronal mass ejection (CME). No filament, formed by cooling and condensation of plasma inside the sigmoid or flux rope, was detected (Liu et al., 2010). Using Atmospheric Imaging Assembly (AIA; Lemen et al., 2012) images on board the Solar Dynamics Observatory (SDO; Pesnell et al., 2012), filament formation through cooling and condensation of coronal plasma has been observed separately in a loop system (Liu et al., 2012) and a cavity (Berger et al., 2012). The magnetic structures are, however, pre-existing ones rather than the newly formed ones via reconnection. Moreover, filament formations through reconnection between two filaments (Joshi et al., 2014; Chen et al., 2015; Yang et al., 2017), two sets of chromospheric fibrils (Yang et al., 2016; Xue et al., 2017), and the filament and loops (Li et al., 2016) were reported. Subsequently, some of them erupted as CMEs (Joshi et al., 2014; Chen et al., 2015), while others evolved without eruption (Xue et al., 2017; Yang et al., 2016, 2017). No cooling and condensation of plasma was presented (Yang et al., 2016, 2017).
Recently, filament formation through cooling and condensation of plasma in magnetic dips of open structures facilitated by interchange reconnection was found (Li et al., 2018a, b, 2019, 2020, 2021a, 2021b). In EUV images, the higher-lying open structures move down toward the surface, and reconnect with the lower-lying closed loops (Li et al., 2018a). Magnetic dips then form in the former. Coronal plasma surrounding the dips converges into the dips, resulting in the enhancement of plasma density in the dips. Triggered by the density enhancement, thermal instability occurs, and rapid cooling and condensation of plasma take place in the dips. Cool condensation in magnetic dips indicates the formation of a filament (Pneuman, 1983; Karpen et al., 2001; Mackay et al., 2010). Along with the successive reconnection, the part of open structures, supporting the filament, take part in the reconnection with the lower-lying loops. Without support from the underlying structures, filament falls to the surface as coronal rain. It thus represents the transient filament. Moreover, repeated formations of the transient filament facilitated by repeated reconnection were reported, indicating that formation of the transient filament, and the subsequent coronal rain, along open structures facilitated by reconnection is common in the corona (Li et al., 2019, 2020, 2021a).
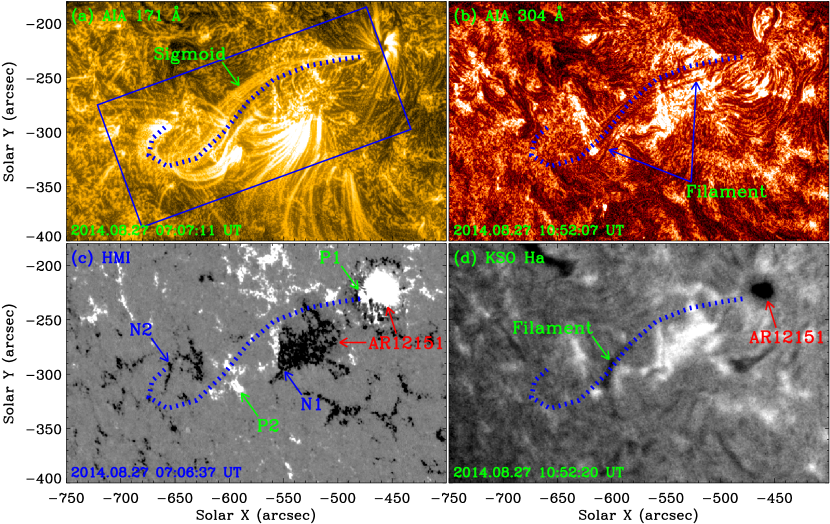
On 2014 August 27, SDO recorded the active region (AR) 12151 in the southern hemisphere, see an Helioseismic and Magnetic Imager (HMI; Schou et al., 2012) line-of-sight (LOS) magnetogram in Figure 1(c). In this AR, a sigmoid was formed in the east, see an AIA 171 Å image in Figure 1(a). Subsequently, a filament appeared in the sigmoid, see AIA 304 Å and Kanzelhöhe observatory (KSO) H images separately in Figures 1(b) and (d). In this Letter, we investigate the formation of the sigmoid and the subsequent formation of the filament. Our results suggest that the sigmoid is formed through reconnection between two sets of loops, and the filament is formed via cooling and condensation of plasma in the newly reconnected sigmoid. The observations are described in Section 2. The results and a summary and discussion are shown in Sections 3 and 4, respectively.
2 Observations
SDO/AIA is a set of normal-incidence imaging telescopes, acquiring solar atmospheric images in 10 wavelength channels. Different AIA channels show plasma at different temperatures, e.g., 94 Å peaks at 7.2 MK (Fe XVIII), 335 Å peaks at 2.5 MK (Fe XVI), 211 Å peaks at 1.9 MK (Fe XIV), 193 Å peaks at 1.5 MK (Fe XII), 171 Å peaks at 0.9 MK (Fe IX), 131 Å peaks at 0.6 MK (Fe VIII) and 10 MK (Fe XXI), and 304 Å peaks at 0.05 MK (He II). Among them, the 94 Å channel is contaminated by warm (mostly around 1 MK) plasma that also contributes to this channel from the 193 and 171 Å channels (Boerner et al., 2012; Li et al., 2015). In this Letter, we employ AIA 94, 335, 211, 193, 171, 131, and 304 Å images, with spatial sampling and time cadence of 0.6″ pixel-1 and 12 s, to study the formation of the sigmoid and the subsequent filament. To better show the evolution, the AIA images are enhanced by using the Multiscale Gaussian Normalization (MGN) technique (Morgan & Druckmüller, 2014). H images with spatial sampling of 1″ pixel-1, provided by the KSO, University of Graz, Austria, are utilized to analyze the evolution of the filament. HMI LOS magnetograms on board the SDO, with time cadence of 45 s and spatial sampling of 0.5″ pixel-1, are used to investigate the evolution of associated photospheric magnetic fields.
3 Results
AR 12151 was observed by the SDO at heliographic coordinates S08 E23 on 2014 August 27, containing a leading sunspot with positive magnetic fields, P1, and the trailing negative magnetic fields, N1, located to the southeast, see Figure 1(c). To the east of the AR, positive and negative magnetic fields, P2 and N2, are detected, see Figure 1(c). From 06:30 UT, a sigmoid appeared in AIA 171 Å images, outlined by the blue dotted line in Figure 1(a). It connects the positive and negative magnetic fields, P1 and N2, see the blue dotted line in Figure 1(c). From 07:00 UT, a filament in the sigmoid formed in AIA 304 Å images, see Figure 1(b). Part of this filament is also observed in H images, see Figure 1(d).
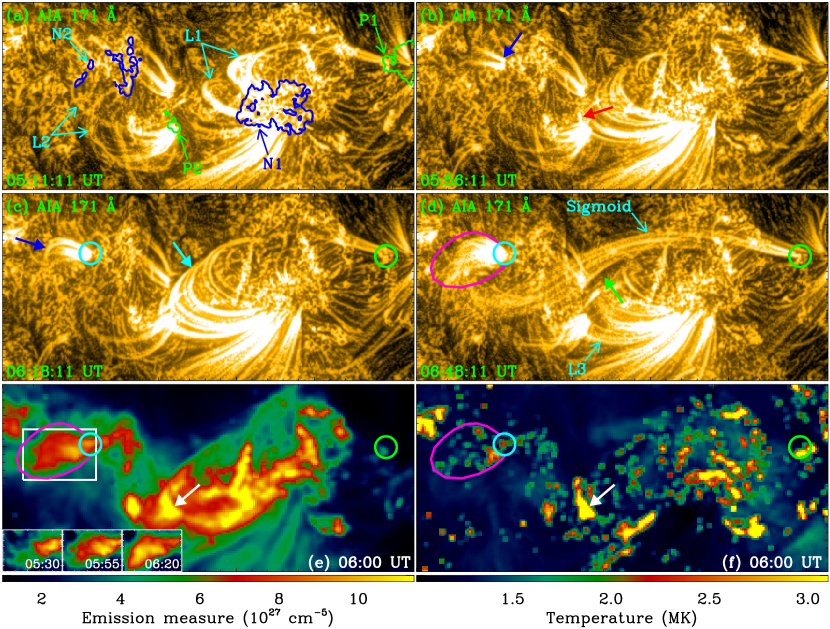
Before the sigmoid occurred in Figure 1(a), two sets of loops, L1 and L2, separately connecting the positive and negative magnetic fields P1 and N1, and P2 and N2, are identified, see Figure 2(a). More loops L1 then appeared, and extended toward the east, see Figure 2(b). A bright sheet-like structure formed at the interface of loops L1 and L2, marked by a red solid arrow in Figure 2(b). Brightenings occurred at the eastern footpoints of loops L2, rooting at the negative magnetic fields N2, and then moved upward along the loops, marked by blue solid arrows in Figures 2(b) and (c). The loops L1, indicated by a cyan solid arrow in Figure 2(c), disappeared, revealing the background below, denoted by a green solid arrow in Figure 2(d). Subsequently, a longer higher-lying twisted sigmoid formed, with a length of 240 Mm, connecting the positive and negative magnetic fields, P1 and N2, see Figure 1(c) and green and cyan circles in Figure 2(d). Several threads of the sigmoid are identified, see Figure 2(d), with a width of 2.4 Mm. Simultaneously, a set of lower-lying shorter loops, L3, connecting the positive and negative magnetic fields, P2 and N1, appeared, see Figure 2(d). Subsequently, more threads formed along the sigmoid, see the online animated version of Figure 3. All the results support that the sigmoid is formed via reconnection between loops L1 and L2.
Using six AIA EUV channels, including 94, 335, 211, 193, 171, and 131 Å, we analyze the evolution of emission measure (EM) and temperature of the studied loops. Here, we employ the differential EM (DEM) analysis using “xrt_dem_iterative2.pro” (Weber et al., 2004; Cheng et al., 2012). Figures 2(e) and (f) display the EM and temperature maps at 06:00 UT, respectively. In these figures, enhancements of the EM and temperature, marked by white solid arrows, are identified at the interface of loops L1 and L2 from 05:13 UT, where reconnection, lasting for more than 2 hr, occurred to heat the plasma. The EM and temperature also increased at both endpoints of the sigmoid (regions enclosed by cyan and green circles) from 05:15 UT. Moreover, we found that the region near the eastern endpoint exhibited increase in EM (region enclosed by pink lines; see insets in Figure 2(e)). At the same time, we did not observe a similar development or expansion of region with increasing EM at the site of reconnection. This provides evidence for the injection of material into the sigmoid from eastern endpoint after the reconnection.
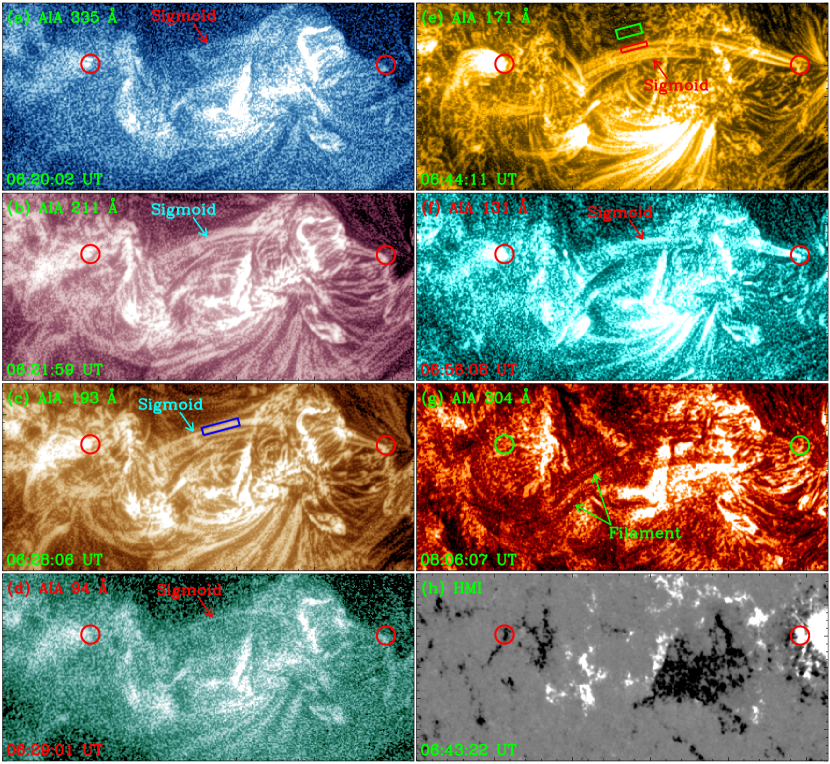
The sigmoid first appeared in AIA 335 Å images from 05:35 UT, and then appeared sequentially in AIA 211, 193, 94, 171, and 131 Å images, see Figures 3(a)-(f). In AIA 304 Å images, dark condensations formed in the sigmoid since 06:40 UT, see Figure 3(g). Cooling and condensation of plasma in the sigmoid are thus clearly identified. Condensations in the sigmoid indicate the formation of a filament, rooting at the positive and negative magnetic fields, P1 and N2, denoted by red and green circles in Figure 3. Those condensations then flow to the filament endpoints, with speeds of 50-80 km s-1. From 07:10 UT, more condensations formed in the left part of the sigmoid, see Figure 4(a). They also move to the filament endpoints bi-directionally, see Figure 4(b). The filament remains stable for over a day, and part of it appears in H images, see Figure 1(d).
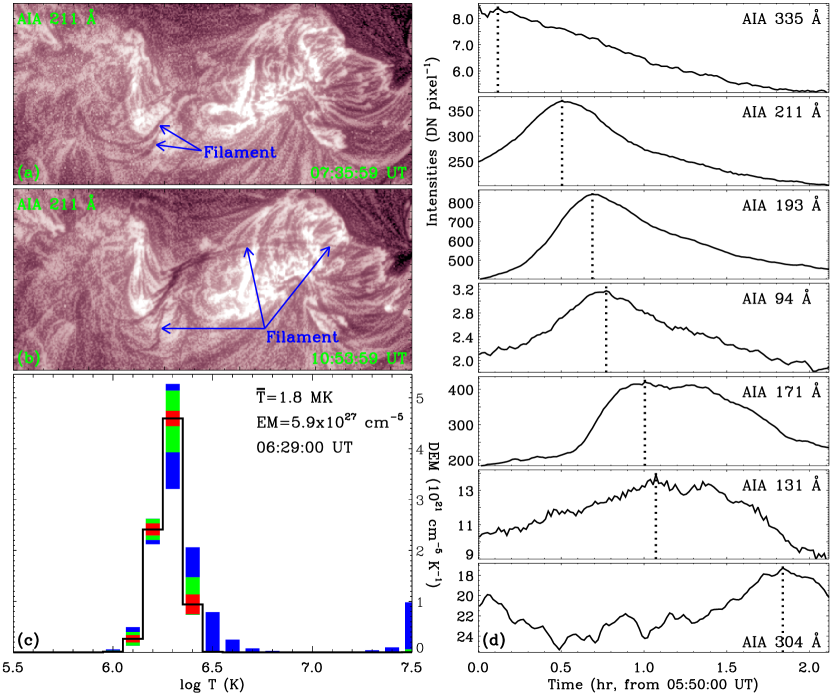
In the blue rectangle in Figure 3(c), light curves of the AIA 335, 211, 193, 94, 171, 131, and 304 Å channels are calculated, and displayed in Figure 4(d). Here, the original, rather than the enhanced, AIA images are employed. As condensations in AIA 304 Å images show dark absorption features, the inverse of the AIA 304 Å light curve is used. Intensity increases in all the AIA EUV light curves, reaches its peak separately at 05:57 (335 Å), 06:20 (211 Å), 06:31 (193 Å), 06:36 (94 Å), 06:50 (171 Å), 06:54 (131 Å), and 07:40 UT (304 Å), see dotted lines in Figure 4(d), and then decreases. This also shows the cooling process of the sigmoid evidently. Before the peak of the AIA 335 Å light curve, no peak is identified in the AIA 94 (131) Å light curve. The channel, that would otherwise be sensitive to hotter plasma under flaring conditions, reaches the peak after that of the AIA 193 (171) Å light curve. Thus the sigmoid in the AIA 94 and 131 Å channels, see Figures 3(d) and (f), is indicative of warm plasma feature. The sigmoid is heated up to 2.5 MK, the characteristic temperature of the AIA 335 Å channel, via reconnection. It then cools down sequentially to 1.9 MK, the characteristic temperature of the AIA 211 Å channel, in 23 minutes, to 1.5 MK, the characteristic temperature of the AIA 193 Å channel, in 34 minutes, to 0.9 MK, the characteristic temperature of the AIA 171 Å channel, in 53 minutes, to 0.6 MK, the lower characteristic temperature of the AIA 131 Å channel, in 57 minutes, and to 0.05 MK, the characteristic temperature of the AIA 304 Å channel, in 103 minutes.
When the sigmoid was clearly detected in AIA 94 Å images, see Figure 3(d), the sigmoid region, enclosed by the red rectangle in Figure 3(e), is chosen to compute the DEM. The region out of the sigmoid, enclosed by the green rectangle in Figure 3(e), is chosen for the background emission that is subtracted from the sigmoid region. In each region, the DN counts in each of the six AIA EUV channels are averaged spatially over all pixels and normalized temporally by the exposure time. The DEM curve of the sigmoid region is displayed in Figure 4(c). Consistent with the AIA imaging observations, the DEM illustrates a lack of hot plasma component in the sigmoid, see the black curve in Figure 4(c), supporting that the sigmoid shows warm plasma. The DEM-weighted temperature and EM are 1.8 MK and 5.91027 cm-5, respectively. Using the EM, electron number density () of the sigmoid is estimated employing , where D is the sigmoid LOS depth. Assuming that the depth D equals the width (W) of the sigmoid, then the density is . Employing EM=5.91027 cm-5 and W=2.4 Mm, we obtain the density to be 5109 cm-3.
4 Summary and discussion
Employing AIA EUV images and HMI LOS magnetograms, we investigate the formation of a sigmoid and the subsequent filament by reconnection and condensation in AR 12151 on 2014 August 27. In AIA images, two sets of loops L1 and L2, separately connecting the positive and negative magnetic fields P1 and N1, and P2 and N2, are observed. At their interface, a bright sheet-like structure appears. Brightenings and increasing EM then happen at the eastern endpoints of loops L2, and then propagate upward along the loops. Subsequently, part of the loops L1 disappears, revealing the background below. A sigmoid and a set of loops L3, respectively connecting the positive and negative magnetic fields P1 and N2, and P2 and N1, then form. These observations suggest that the sigmoid is formed through reconnection between loops L1 and L2. The sigmoid appears first in AIA 335 Å images, and then occurs in 211, 193, 94, 171, 131, and 304 Å images sequentially. The cooling and condensation of plasma, heated up to 2.5 MK, the characteristic temperature of the AIA 335 Å channel, in the sigmoid is thus clearly detected. This is also supported by the AIA EUV light curves of the sigmoid. The condensation in the sigmoid shows the filament formation.
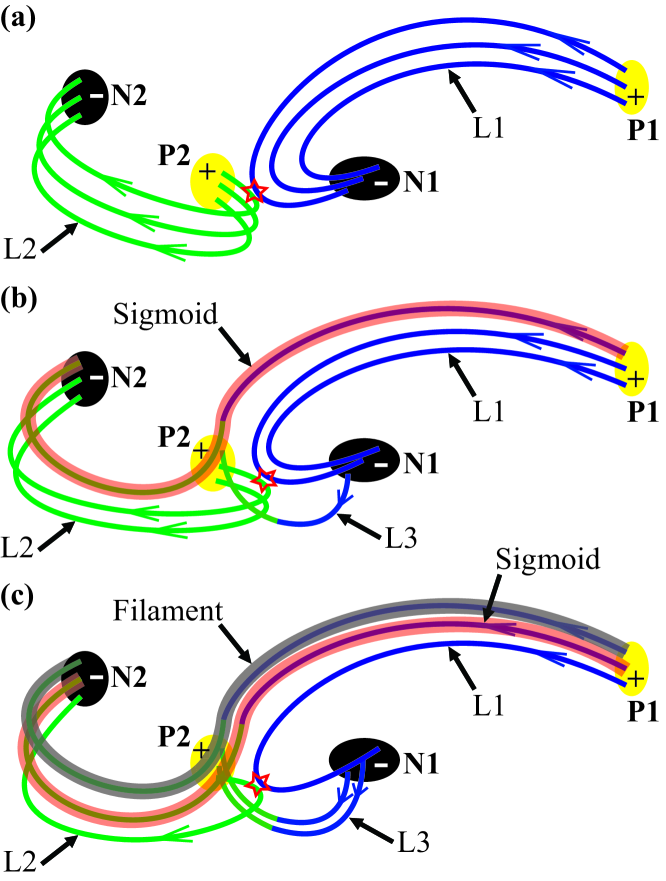
According to the SDO observations, schematic diagrams are provided in Figure 5 to describe the formation of the sigmoid and the subsequent filament. Reconnection between the field lines of loops L1 and L2, see red stars at the interface of blue and green lines in Figure 5(a), results in the formation of the newly reconnected sigmoid and loops L3, see Figure 5(b). Cooling and condensation of plasma in the sigmoid lead to the filament formation, see Figure 5(c). Along with the successive reconnection, more threads of the sigmoid and the subsequent filament form, see Figure 5(c).
Sigmoid formation by two sets of loops through reconnection is observed. The flux rope or sigmoid formed via reconnection between two sets of sheared arcades has been reported previously (Kim et al., 2008; Liu et al., 2010; Joshi et al., 2015), that then erupted upward as a CME. In this Letter, reconnection between two sets of loops is identified, forming the newly reconnected longer sigmoid and shorter loops, see Section 3, in agreement with the tether-cutting model (Moore & Labonte, 1980; Moore et al., 2001). However, the sigmoid remains stable after its formation, rather than erupts upward as a CME. This may be caused by weak magnetic twist of the sigmoid. Similar to Yang et al. (2016), the brightening and the increasing EM and temperature are detected in the reconnection region, where the plasma was heated by reconnection. Unlike the case of Yang et al. (2016), however, we did not find signatures of the bi-directional expansion of enhanced EM region along the sigmoid. Instead, we observed that the brightenings and regions exhibiting excess EM and temperatures expanded or developed at the eastern endpoint of the sigmoid. This may indicate signatures of material supply into the sigmoid through chromospheric evaporation, caused by reconnection, at the eastern endpoint. Here, the evaporation flow was not directly detected, e.g., by the Doppler shift, because no spectroscopic data is available. To identify the chromospheric evaporation, the spectroscopic observations are necessary in the future study. The EM at the reconnection region (05:13 UT) increased 2 minutes earlier than that at the eastern endpoint of the sigmoid (05:15 UT). Employing the time interval (2 minutes) and the sigmoid length (100 Mm) between these two regions, we suggest that the chromospheric material at the eastern endpoint of the sigmoid was heated by the thermal conduction front and/or beamed non-thermal particles, with a propagating speed of the order of 800 km s-1, produced at the reconnection region. Alternatively, because the Alfvén speed in the corona will be fast enough, an Alfvénic perturbation could also have transported the energy from the reconnection region to the endpoints of the sigmoid (Fletcher & Hudson, 2008). The sigmoid with temperature of up to 2.5 MK is cooler than those identified in the AIA higher-temperature channels, e.g., 94 and 131 Å, in Liu et al. (2010), Chen et al. (2014, 2018), and Joshi et al. (2015). Although the sigmoid was observed in AIA 94 and 131 Å images in this study, it is composed of warm plasma instead.
Filament formation through cooling and condensation of plasma inside a newly formed sigmoid is found. Coronal condensation, forming a filament, has been presented separately in the loop (Liu et al., 2012) and cavity (Berger et al., 2012), that show pre-existing structures. In this Letter, rather than the pre-existing structure, the sigmoid is newly formed via reconnection between two sets of loops. As the sigmoid remains stable after its formation, cooling and condensation of plasma inside the sigmoid are observed, forming the filament. The transient filament formed through condensation facilitated by interchange reconnection has been reported in Li et al. (2018a, b, 2019, 2020, 2021a, 2021b), where the condensation occurs in the dips of higher-lying open structures that take part in the reconnection. In this study, the sigmoid, where condensation happens, represents the newly reconnected structure via reconnection. In Li et al. (2018a, b, 2019, 2020, 2021a, 2021b), the plasma, hardly heated up across the field lines by the lower-lying reconnection, cools down from 0.9 MK, the characteristic temperature of the AIA 171 Å channel. In this Letter, the plasma, supplied from the chromospheric evaporation by reconnection, cools down from a higher temperature of 2.5 MK. In situ condensation of coronal plasma, trapped inside the newly formed flux rope that is levitated from the lower corona into the upper corona, is proposed in the reconnection-condensation filament formation models (Kaneko & Yokoyama, 2015, 2017; Jenkins & Keppens, 2021), in which chromospheric evaporation is not involved. As signatures of chromospheric evaporation are observed in this study, the evaporation-condensation (Karpen et al., 2001; Huang et al., 2021), rather than the levitation-condensation (Kaneko & Yokoyama, 2015, 2017; Jenkins & Keppens, 2021), scenario is thus suggested. However, we cannot rule out the levitation-condensation scenario because we do not know if what they proposed is also happening or not in our observations. All the results support the filament formation models via reconnection and condensation (Pneuman, 1983).
References
- Berger et al. (2012) Berger, T., Liu, W., & Low, B. 2012, ApJ, 758, L37
- Boerner et al. (2012) Boerner, P., Edwards, C., Lemen, J., et al. 2012, Sol. Phys., 275, 41
- Chitta et al. (2019) Chitta, L. P., Peter, H., & Li, L. P. 2019, A&A, 627, L5
- Chen et al. (2018) Chen, H. C., Duan, Y. D., Yang, J. Y., et al. 2018, ApJ, 869, 78
- Chen et al. (2014) Chen, H. D., Zhang, J., Cheng, X., et al. 2014, ApJ, 797, L15
- Chen et al. (2015) Chen, H. D., Zhang, J., Ma, S. L., et al. 2015, ApJ, 808, L24
- Cheng et al. (2012) Cheng, X., Zhang, J., Saar, S. H., et al. 2012, ApJ, 761, 62
- Fletcher & Hudson (2008) Fletcher, L. & Hudson, H. S. 2008, ApJ, 675, 1645
- Huang et al. (2021) Huang, C. J., Guo, J. H., Ni, Y. W., et al. 2021, ApJ, 913, L8
- Jenkins & Keppens (2021) Jenkins, J. M., & Keppens, R. 2021, A&A, 646, A134
- Joshi et al. (2015) Joshi, N. C., Liu, C., Sun, X., et al. 2015, ApJ, 812, 50
- Joshi et al. (2014) Joshi, N. C., Magara, T., & Inoue, S. 2014, ApJ, 795, 4
- Kaneko & Yokoyama (2015) Kaneko, T., & Yokoyama, T. 2015, ApJ, 806, 115
- Kaneko & Yokoyama (2017) Kaneko, T., & Yokoyama, T. 2017, ApJ, 845, 12
- Karpen et al. (2001) Karpen, J., Antiochos, S., Hohensee, M., Klimchuk, J., & MacNeice, P. 2001, ApJ, 553, L85
- Kim et al. (2008) Kim, S., Moon, Y.-J., Kim, Y.-H., et al. 2008, ApJ, 683, 510
- Lemen et al. (2012) Lemen, J., Title, A., Akin, D., et al. 2012, Sol. Phys., 275, 17
- Li et al. (2015) Li, L. P., Peter, H., Chen, F., et al. 2015, A&A, 583, A109
- Li et al. (2019) Li, L. P., Peter, H., Chitta, L. P., et al. 2019, ApJ, 884, 34
- Li et al. (2020) Li, L. P., Peter, H., Chitta, L. P., et al. 2020, ApJ, 905, 26
- Li et al. (2021a) Li, L. P., Peter, H., Chitta, L. P., et al. 2021a, ApJ, 910, 82
- Li et al. (2021b) Li, L. P., Peter, H., Chitta, L. P., Song, H. Q. 2021b, Research in Astronomy and Astrophysics, accepted
- Li et al. (2016) Li, L. P., Zhang, J., Peter, H., et al. 2016, Nature Physics, 12, 847
- Li et al. (2018a) Li, L. P., Zhang, J., Peter, H., et al. 2018a, ApJ, 864, L4
- Li et al. (2018b) Li, L. P., Zhang, J., Peter, H., et al. 2018b, ApJ, 868, L33
- Liu et al. (2010) Liu, R., Liu, C., Wang, S., et al. 2010, ApJ, 725, L84
- Liu et al. (2012) Liu, W., Berger, T., & Low, B. 2012, ApJ, 745, L21
- Mackay et al. (2010) Mackay, D. H., Karpen, J. T., Ballester, J. L., et al. 2010, Space Sci. Rev., 151, 333
- Moore & Labonte (1980) Moore, R. L., & Labonte, B. J. 1980, in IAU Symp. 91, Solar and Interplanetary Dynamics, ed. M. Dryer & E. Tandberg-Hanssen (Dordrecht: Reidel), 207
- Moore et al. (2001) Moore, R. L., Sterling, A. C., Hudson, H. S., et al. 2001, ApJ, 552, 833
- Morgan & Druckmüller (2014) Morgan, H., & Druckmüller, M. 2014, Sol. Phys., 289, 2945
- Müller et al. (2017) Müller, D., Nicula, B., Felix, S., et al. 2017, A&A, 606, A10
- Ouyang et al. (2017) Ouyang, Y., Zhou, Y. H., Chen, P. F., et al. 2017, ApJ, 835, 94
- Pesnell et al. (2012) Pesnell, W. D., Thompson, B. J., & Chamberlin, P. C. 2012, Sol. Phys., 275, 3
- Pneuman (1983) Pneuman, G. 1983, Sol. Phys., 88, 219
- Priest & Forbes (2000) Priest, E., & Forbes, T. 2000, Magnetic reconnection: MHD theory and applications (Cambridge: Cambridge Univ. Press)
- Schou et al. (2012) Schou, J., Scherrer, P. H., Bush, R. I., et al. 2012, Sol. Phys., 275, 229
- van Ballegooijen & Martens (1989) van Ballegooijen, A. A., & Martens, P. C. H. 1989, ApJ, 343, 971
- Weber et al. (2004) Weber, M. A., Deluca, E. E., Golub, L., & Sette, A. L. 2004, in IAU Symp. 223, Multi-Wavelength Investigations of Solar Activity, ed. A. V. Stepanov, E. E. Benevolenskaya, & A. G. Kosovichev (Cambridge: Cambridge Univ. Press), 223, 321
- Xue et al. (2017) Xue, Z., Yan, X., Yang, L., et al. 2017, ApJ, 840, L23
- Yan et al. (2015) Yan, X. L., Xue, Z. K., Pan, G. M., et al. 2015, ApJS, 219, 17
- Yang & Chen (2019) Yang, B., & Chen, H. D. 2019, ApJ, 874, 96
- Yang et al. (2016) Yang, B., Jiang, Y., Yang, J., et al. 2016, ApJ, 816, 41
- Yang et al. (2017) Yang, L. H., Yan, X. L., Li, T., et al. 2017, ApJ, 838, 131
- Yokoyama et al. (2001) Yokoyama, T., Akita, K., Morimoto, T., Inoue, K., & Newmark, J. 2001, ApJ, 546, L69
- Zheng et al. (2012) Zheng, R., Jiang, Y., Yang, J., et al. 2012, ApJ, 753, L29