Hasan Abed Al Kader Hammoudhasanabedalkader.hammoud@kaust.edu.sa1
\addauthorBernard Ghanembernard.ghanem@kaust.edu.sa1
\addinstitution
King Abdullah University of Science and Technology (KAUST)
Thuwal, Saudi Arabia
Check Your Other Door!
Check Your Other Door! Creating Backdoor Attacks in the Frequency Domain
Abstract
Deep Neural Networks (DNNs) are ubiquitous and span a variety of applications ranging from image classification to real-time object detection. As DNN models become more sophisticated, the computational cost of training these models becomes a burden. For this reason, outsourcing the training process has been the go-to option for many DNN users. Unfortunately, this comes at the cost of vulnerability to backdoor attacks. These attacks aim to establish hidden backdoors in the DNN so that it performs well on clean samples, but outputs a particular target label when a trigger is applied to the input. Existing backdoor attacks either generate triggers in the spatial domain or naively poison frequencies in the Fourier domain. In this work, we propose a pipeline based on Fourier heatmaps to generate a spatially dynamic and invisible backdoor attack in the frequency domain. The proposed attack is extensively evaluated on various datasets and network architectures. Unlike most existing backdoor attacks, the proposed attack can achieve high attack success rates with low poisoning rates and little to no drop in performance while remaining imperceptible to the human eye. Moreover, we show that the models poisoned by our attack are resistant to various state-of-the-art (SOTA) defenses, so we contribute two possible defenses that can evade the attack.
1 Introduction
Deep neural networks (DNNs) play a crucial role in various applications such as facial recognition systems [Parkhi et al.(2015)Parkhi, Vedaldi, and Zisserman], medical image analysis [Litjens et al.(2017)Litjens, Kooi, Bejnordi, Setio, Ciompi, Ghafoorian, Laak, Ginneken, and Sánchez], autonomous driving [Sallab et al.(2017)Sallab, Abdou, Perot, and Yogamani], among others [Graves et al.(2013)Graves, rahman Mohamed, and Hinton, Jumper et al.(2021)Jumper, Evans, Pritzel, Green, Figurnov, Ronneberger, Tunyasuvunakool, Bates, Zídek, Potapenko, Bridgland, Meyer, Kohl, Ballard, Cowie, Romera-Paredes, Nikolov, Jain, Adler, Back, Petersen, Reiman, Clancy, Zielinski, Steinegger, Pacholska, Berghammer, Bodenstein, Silver, Vinyals, Senior, Kavukcuoglu, Kohli, and Hassabis]. As the tasks become more difficult, the need for more sophisticated and complex models arises. Such models are generally harder to train and might require extensive hyperparameter tuning to achieve the required performance. Recently, and due to the limited access to computational power for most individuals and small companies, outsourced training and the use of out-of-the-box pre-trained models became popular [Liu et al.(2017)Liu, Xie, and Srivastava].

Outsourced training creates a set of serious vulnerabilities, as it involves several stages that the outsourcer could exploit, including data collection, data pre-processing, and model deployment [Li et al.(2020)Li, Wu, Jiang, Li, and Xia, Gu et al.(2019)Gu, Liu, Dolan-Gavitt, and Garg, Liu et al.(2018b)Liu, Ma, Aafer, Lee, Zhai, Wang, and Zhang, Gao et al.(2020)Gao, Doan, Zhang, Ma, Zhang, Fu, Nepal, and Kim]. An important threat that could be exploited during training is called a backdoor attack. Backdoor attacks create an association between an attacker-defined pattern, called the trigger, and a chosen target label in such a way that the malicious actor can instigate the trigger at will without degrading the model’s performance on clean samples. This association is usually created through training data poisoning [Li et al.(2020)Li, Wu, Jiang, Li, and Xia, Gu et al.(2019)Gu, Liu, Dolan-Gavitt, and Garg, Liu et al.(2018b)Liu, Ma, Aafer, Lee, Zhai, Wang, and Zhang, Biggio et al.(2012)Biggio, Nelson, and Laskov], where the adversary applies a trigger to a set of images from the training set and then switches their ground truth label to a chosen target class before model training begins.
Most existing backdoor attacks [Gu et al.(2019)Gu, Liu, Dolan-Gavitt, and Garg, zhang et al.(2021)zhang, Chen, Liao, Huang, Hua, Zhang, and Yu, Chen et al.(2017)Chen, Liu, Li, Lu, and Song, Barni et al.(2019)Barni, Kallas, and Tondi, Liu et al.(2020)Liu, Ma, Bailey, and Lu, Liu et al.(2018b)Liu, Ma, Aafer, Lee, Zhai, Wang, and Zhang, Wenger et al.(2021)Wenger, Passananti, Bhagoji, Yao, Zheng, and Zhao, Kwon and Kim(2022), Zhang et al.(2021a)Zhang, Ding, Tian, Guo, Yuan, and Jiang, Yan et al.(2021)Yan, Li, Tian, Wu, Li, Chen, and Poor] rely on the spatial domain to generate and embed the trigger. For example, [Gu et al.(2019)Gu, Liu, Dolan-Gavitt, and Garg] applies a white square stamp on the corner of some training images to poison the data. Other methods such as [Liu et al.(2018b)Liu, Ma, Aafer, Lee, Zhai, Wang, and Zhang] rely on an optimization-based approach to generate optimal trigger values. These attacks experience a sharp trade-off between the amount of poisoned data, the invisibility and success of the attack, and the performance of the model on the original task. On the other hand, most backdoor defenses rely on the spatial domain or properties of this domain to detect and mitigate attacks [Guo et al.(2019)Guo, Wang, Xing, Du, and Song, Wang et al.(2019)Wang, Yao, Shan, Li, Viswanath, Zheng, and Zhao, Qiao et al.(2019)Qiao, Yang, and Li, Gao et al.(2019)Gao, Xu, Wang, Chen, Ranasinghe, and Nepal]. Since most backdoor attack techniques tend to be visible and static, i.e the same spatial trigger is applied to all poisoned images, defense techniques in the spatial domain, such as reversed trigger construction [Wang et al.(2019)Wang, Yao, Shan, Li, Viswanath, Zheng, and Zhao, Guo et al.(2019)Guo, Wang, Xing, Du, and Song] and fine-pruning [Liu et al.(2018a)Liu, Dolan-Gavitt, and Garg], easily succeed in detecting, reverse engineering, and mitigating the embedded backdoor trigger.
Recently, [Feng et al.(2021)Feng, Ma, Zhang, Zhao, Xia, and Tao, Wang et al.(2021)Wang, Yao, Xu, An, Tong, and Wang] have proposed creating backdoor attacks in the frequency domain. However, both proposed attacks naively select the frequency components to poison.
Contributions. Given the weaknesses associated with developing backdoor attacks in the spatial domain and the limitations of existing frequency attacks, in this work, we propose a backdoor attack that utilizes Fourier heatmaps to design a sophisticated backdoor poisoning attack in the frequency domain. Unlike previous attacks, our frequency-based attack does not face the aforementioned trade-offs. We also show two potential ways to defend against frequency-based backdoor attacks and possible ways for the attacker to bypass these defenses. The proposed method is extensively evaluated on multiple models and datasets.
2 Related Work
Backdoor Attacks. Backdoor attacks were first introduced in [Gu et al.(2019)Gu, Liu, Dolan-Gavitt, and Garg] as a possible security breach that could be exploited in DNNs. They showed that adding a simple patch to the corner of a subset of the training images creates a backdoor that could be maliciously triggered to output a predefined target label. Later, several works were introduced, such as [Liu et al.(2018b)Liu, Ma, Aafer, Lee, Zhai, Wang, and Zhang], where the values of a predefined mask were optimized to obtain an optimal trigger. On another track, [Chen et al.(2017)Chen, Liu, Li, Lu, and Song] realized the importance of having invisible or imperceptible triggers to evade possible human inspection. The authors proposed blending the backdoor trigger and the clean images together, replacing the previously used stamping technique. Along these lines, other invisible attacks were proposed, such as [Li et al.(2021b)Li, Li, Wu, Li, He, and Lyu] which used least-significant bit (LSB) algorithm from the steganography literature to generate an invisible attack, [Nguyen and Tran(2021)] which utilized image warping to poison data samples, and [zhang et al.(2021)zhang, Chen, Liao, Huang, Hua, Zhang, and Yu] which proposed having input-aware trigger patterns that poison the edges of the image. [Doan et al.(2021)Doan, Lao, Zhao, and Li] highlighted the importance of learning the trigger-generating transformation to achieve a high attack success rate. [Doan and Lao(2021)] proposed utilizing the latent space representation to generate imperceptible backdoor triggers by minimizing the Wasserstein distance between the representations of clean and poisoned samples. [Li et al.(2021a)Li, Xue, Zhao, Zhu, and Zhang], also inspired by steganography, generated sample-specific triggers by encoding an attacker-specified “string" into clean samples using an autoencoder network. [Zeng et al.(2021)Zeng, Park, Mao, and Jia] analyzed the characteristics of spatial backdoor attacks in the frequency domain and proposed a technique to create smooth but visible spatial backdoor triggers. Recently, [Feng et al.(2021)Feng, Ma, Zhang, Zhao, Xia, and Tao, Wang et al.(2021)Wang, Yao, Xu, An, Tong, and Wang] introduced a simple way to apply trojan attacks in the frequency domain. Specifically, [Feng et al.(2021)Feng, Ma, Zhang, Zhao, Xia, and Tao] blends the low-frequency content of a trigger image with that of the target images, and [Wang et al.(2021)Wang, Yao, Xu, An, Tong, and Wang] arbitrarily poisons a high-frequency component and a mid-frequency component.
Backdoor defenses. Early defense mechanisms such as fine-pruning [Liu et al.(2018a)Liu, Dolan-Gavitt, and Garg] relied on neuron activations to mitigate backdoors embedded in a DNN. In particular, pruning the least active neurons on clean images and then fine-tuning the model on clean samples can reverse the backdoor attack. [Tran et al.(2018)Tran, Li, and Madry] and [Chen et al.(2019)Chen, Carvalho, Baracaldo, Ludwig, Edwards, Lee, Molloy, and Srivastava] used robust statistics and analysis of neural network activations, respectively, to thwart and detect backdoor attacks. Later, more sophisticated optimization-based methods, such as Neural Cleanse (NC) [Wang et al.(2019)Wang, Yao, Shan, Li, Viswanath, Zheng, and Zhao], TABOR [Guo et al.(2019)Guo, Wang, Xing, Du, and Song] and ABS [Liu et al.(2019)Liu, Lee, Tao, Ma, Aafer, and Zhang], were developed to mitigate backdoor attacks. NC computes an anomaly index, which indicates whether an abnormally short distance exists between a particular class and all other classes. If the anomaly index exceeds a threshold, NC finds a reverse engineered trigger that is used to fine-tune the model on poisoned but correctly labeled samples. [Doan et al.(2020)Doan, Abbasnejad, and Ranasinghe] relied on computing class activation maps using Grad-CAM [Selvaraju et al.(2019)Selvaraju, Das, Vedantam, Cogswell, Parikh, and Batra] to find the regions the network is attending to in hopes of detecting the attacker-triggered region, which is then replaced through image restoration. [Zheng et al.(2021)Zheng, Zhang, Wagner, Goswami, and Chen] adopted persistent homology from topological data analysis to discover structural abnormalities in poisoned models. TOP [Huster and Ekwedike(2021)] showed that adversarial perturbations transfer better from image to image in poisoned models compared to clean ones, which can be used to detect poisoned models. STRIP [Gao et al.(2019)Gao, Xu, Wang, Chen, Ranasinghe, and Nepal] observes that when a poisoned image is blended with a clean one, the backdoor is still activated, which allows for detecting backdoor attacks by analyzing the entropy of the prediction vectors. SPECTRE [Hayase et al.(2021)Hayase, Kong, Somani, and Oh] explores robust covariance estimation to amplify the spectral signal i.e the signature of poisoned data.
3 Preliminaries
To clearly detail our proposed frequency-based approach, we briefly review the concept of Fourier heatmaps that was first introduced in [Yin et al.(2019)Yin, Lopes, Shlens, Cubuk, and Gilmer]. Fourier heatmaps provide a tool for analyzing the sensitivity of a DNN to a specific Fourier frequency basis by analyzing how this DNN performs when subjected to input perturbations in this basis [Yin et al.(2019)Yin, Lopes, Shlens, Cubuk, and Gilmer].
Notation. We denote the 2D Discrete Fourier Transform of an image by and its inverse by (both operations are applied per channel). By default, we assume that the frequency components are shifted toward the center of the Fourier spectrum, i.e low frequencies are set about the center.
2D Fourier Basis. Let be a real valued matrix in with the following properties. (1) It has a Frobenius norm ; (2) has up to two non-zero elements located at and its conjugate symmetric component (symmetric relative to the origin of the spectrum). We refer to such a matrix as a 2D Fourier basis at .
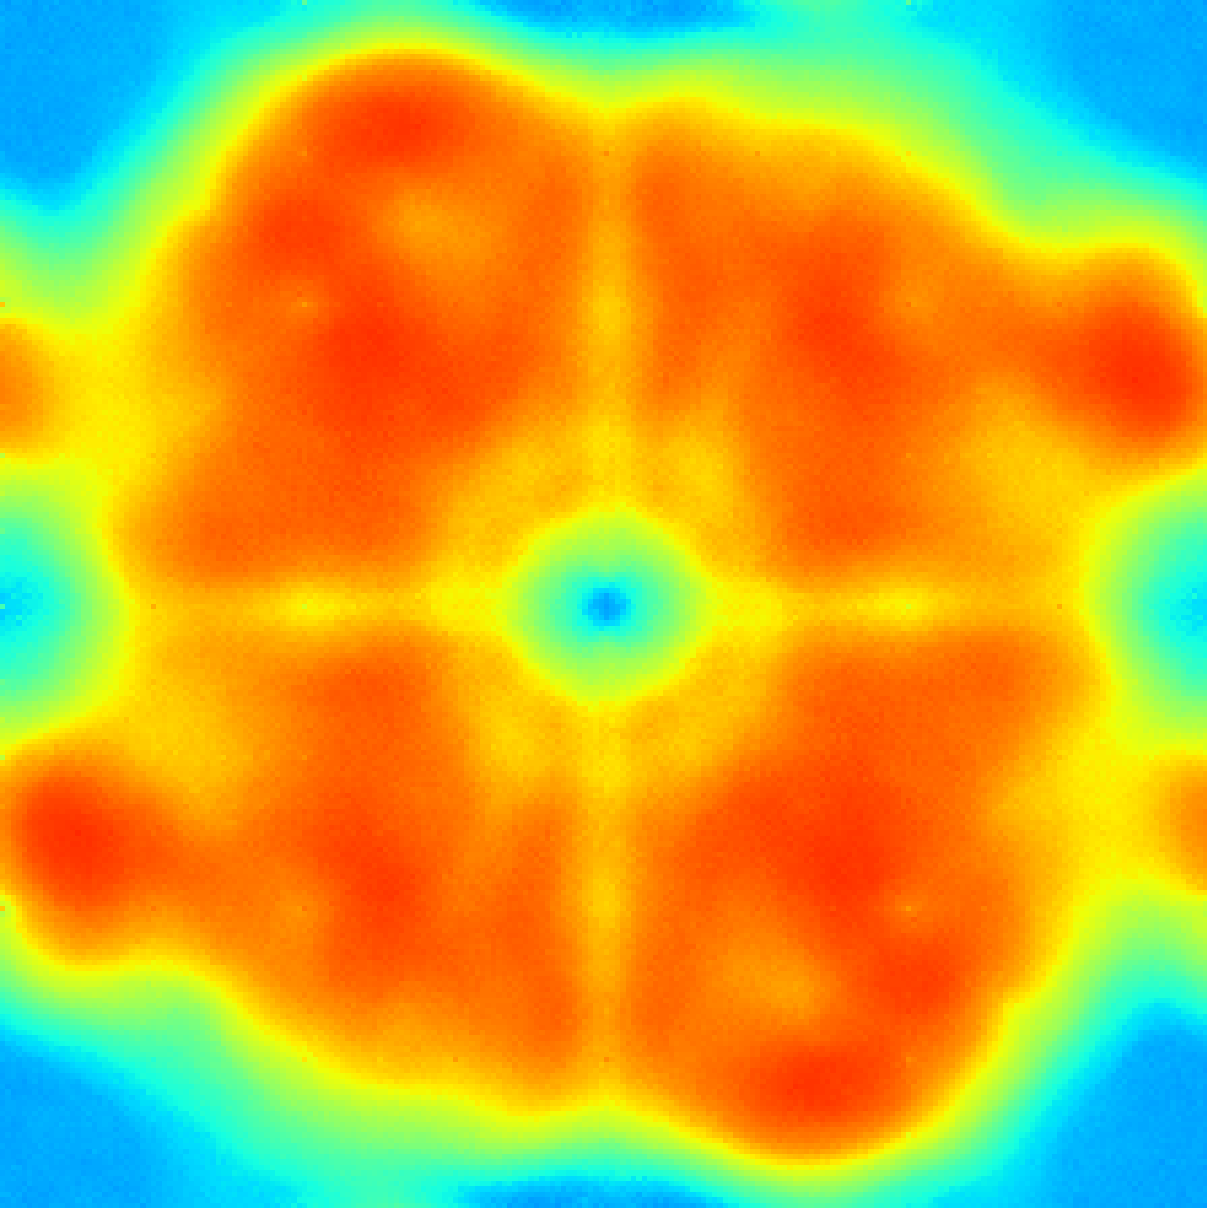
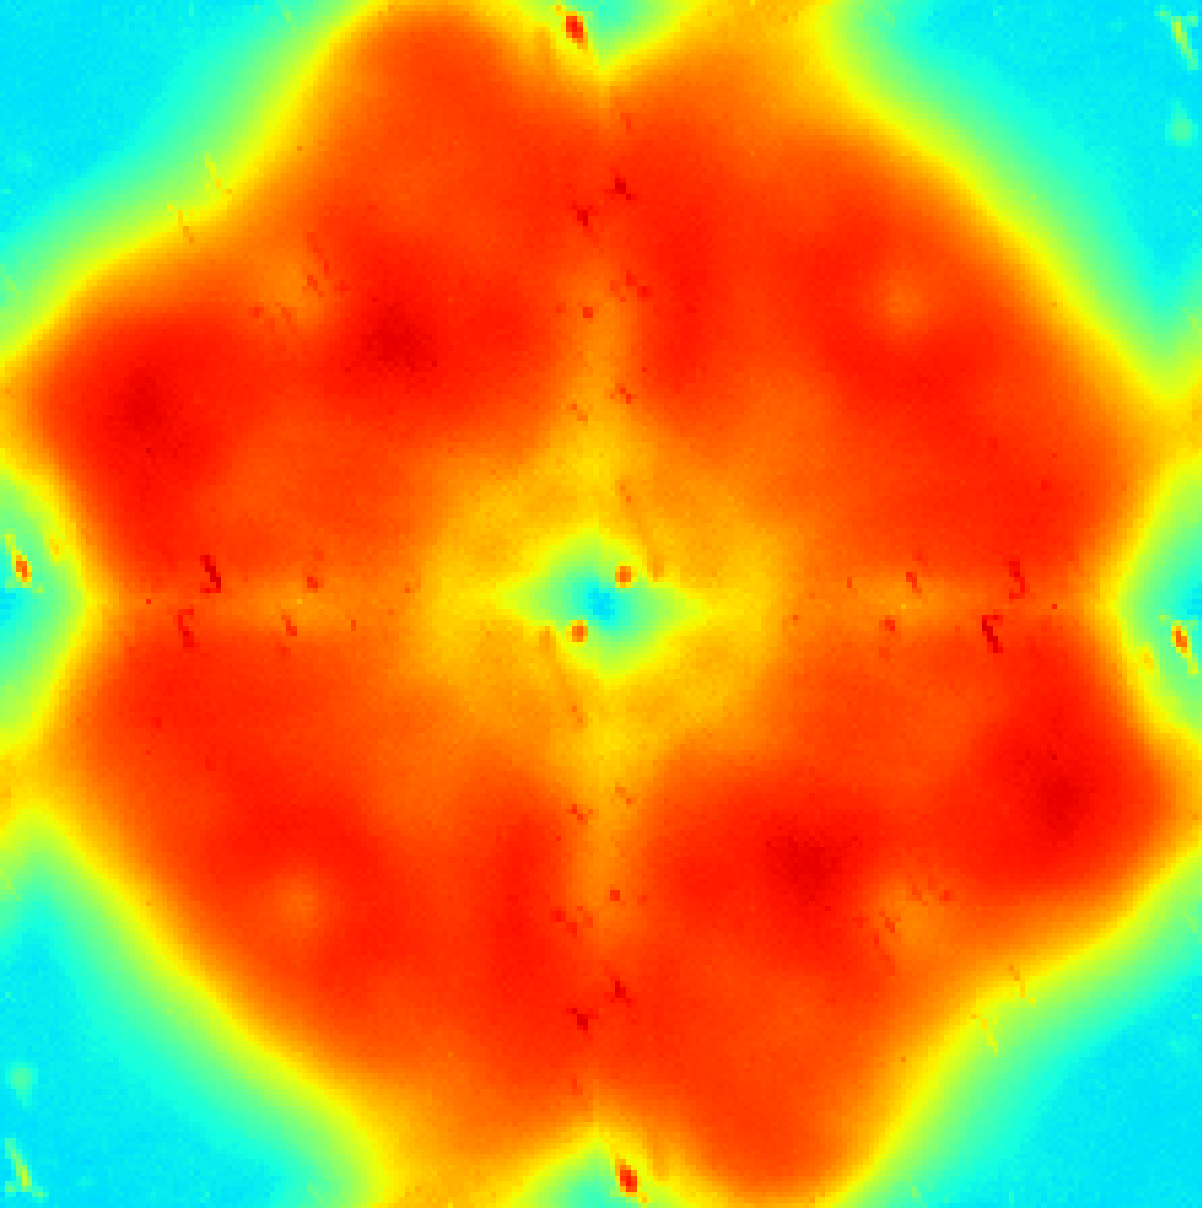
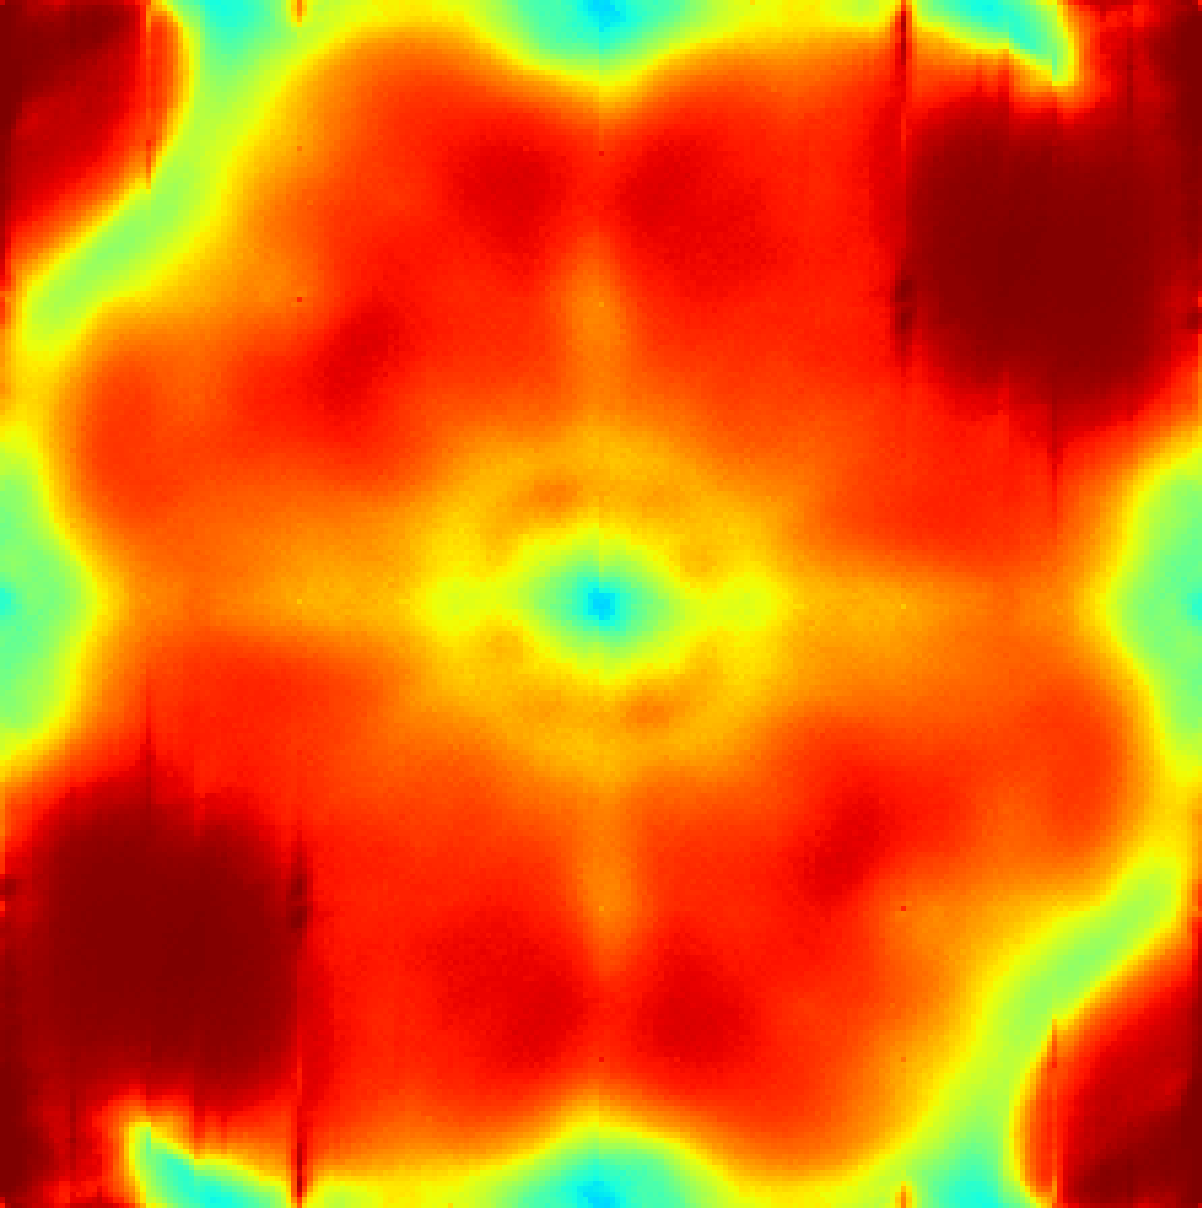
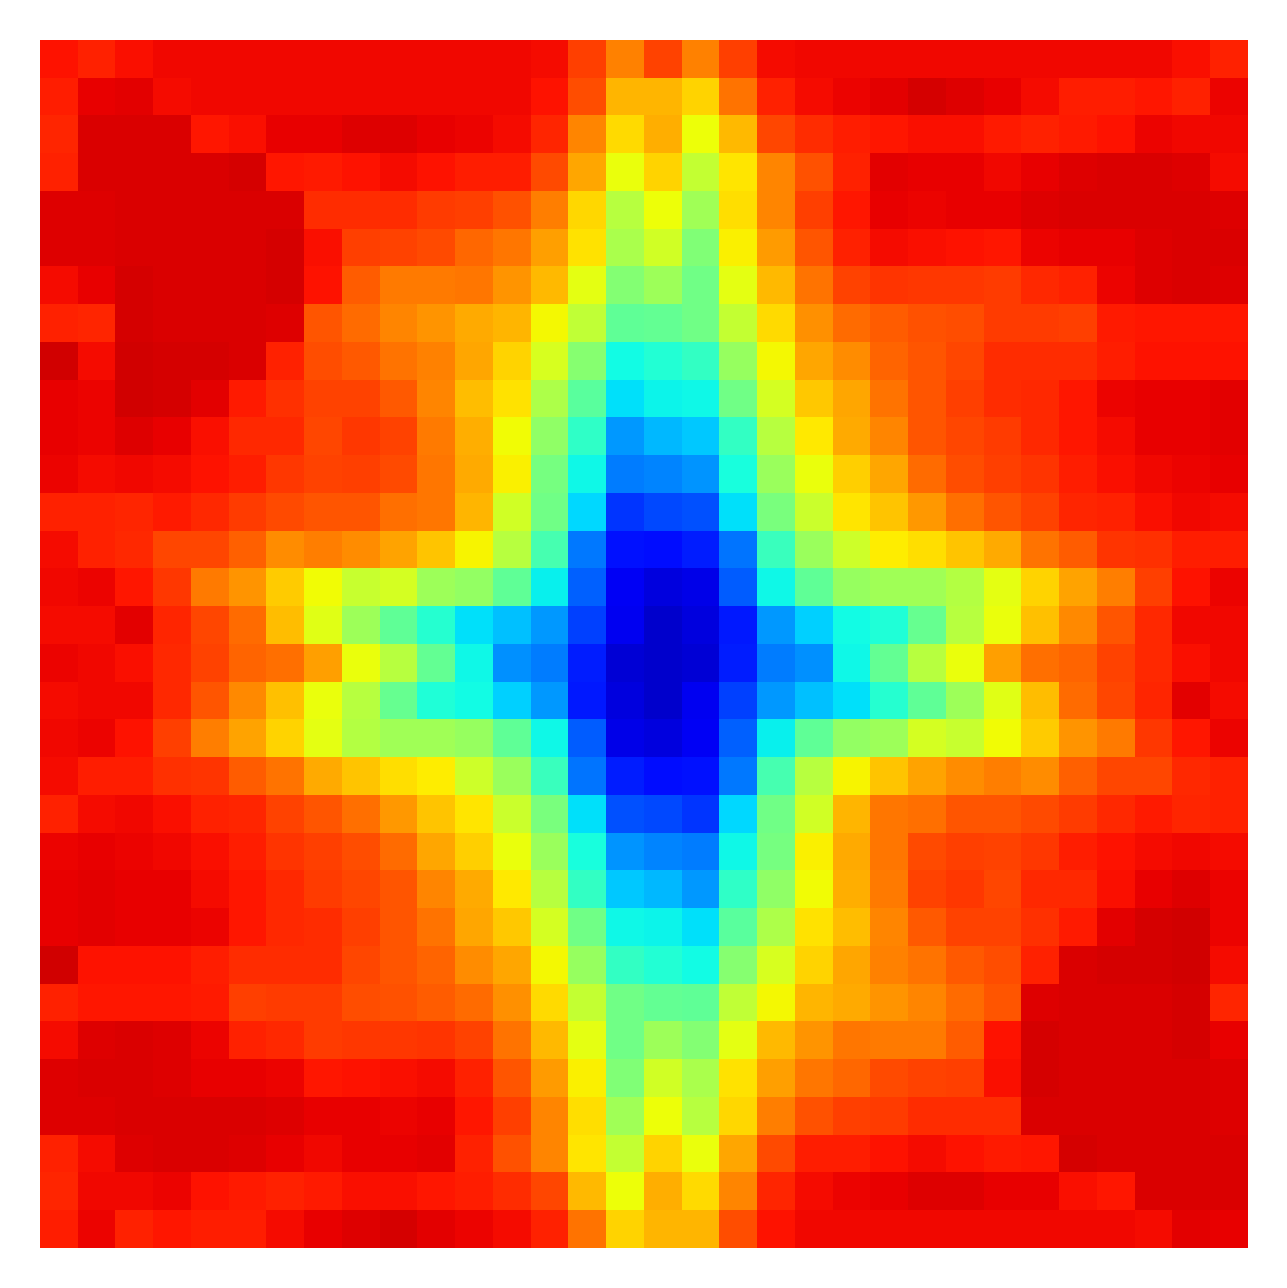
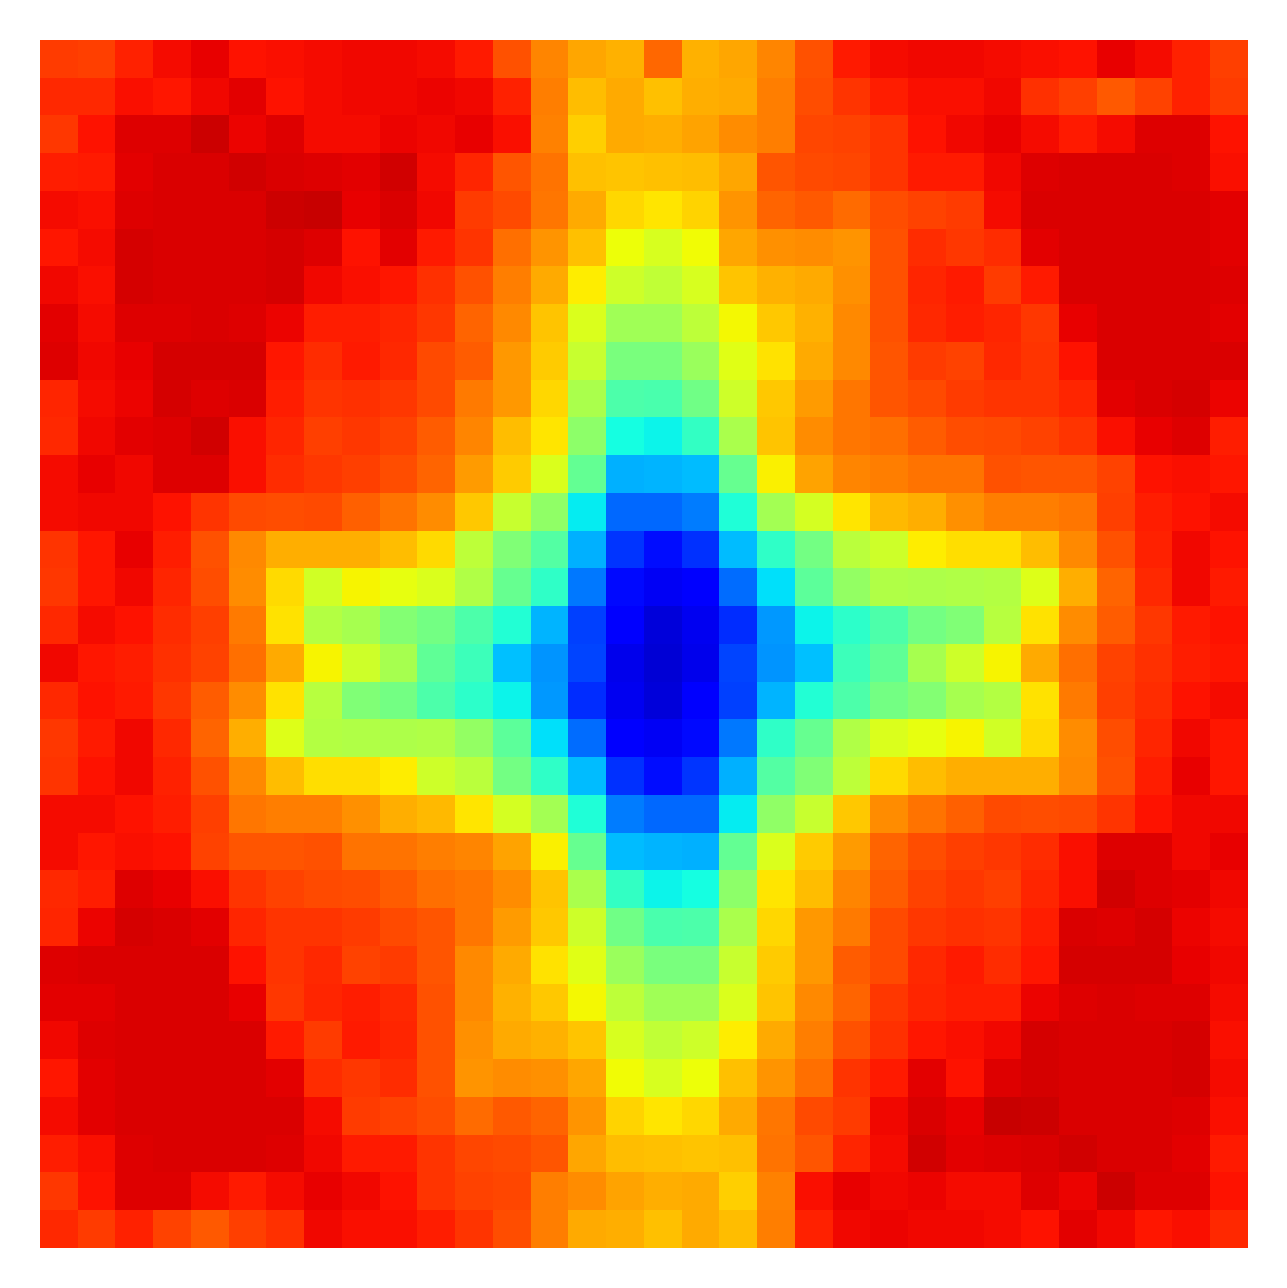
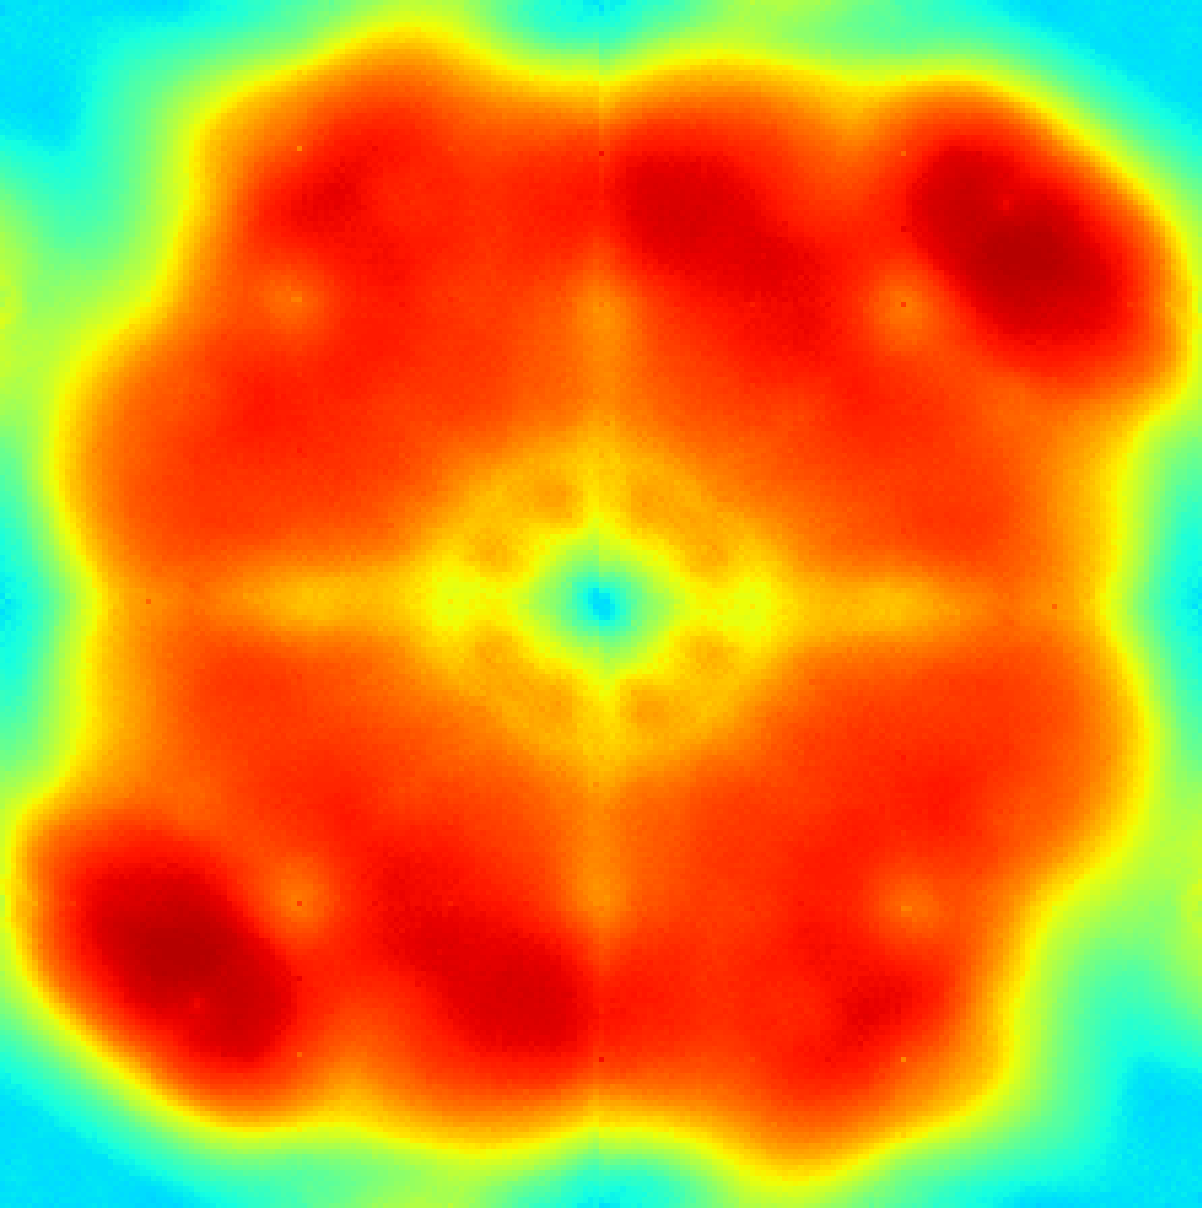
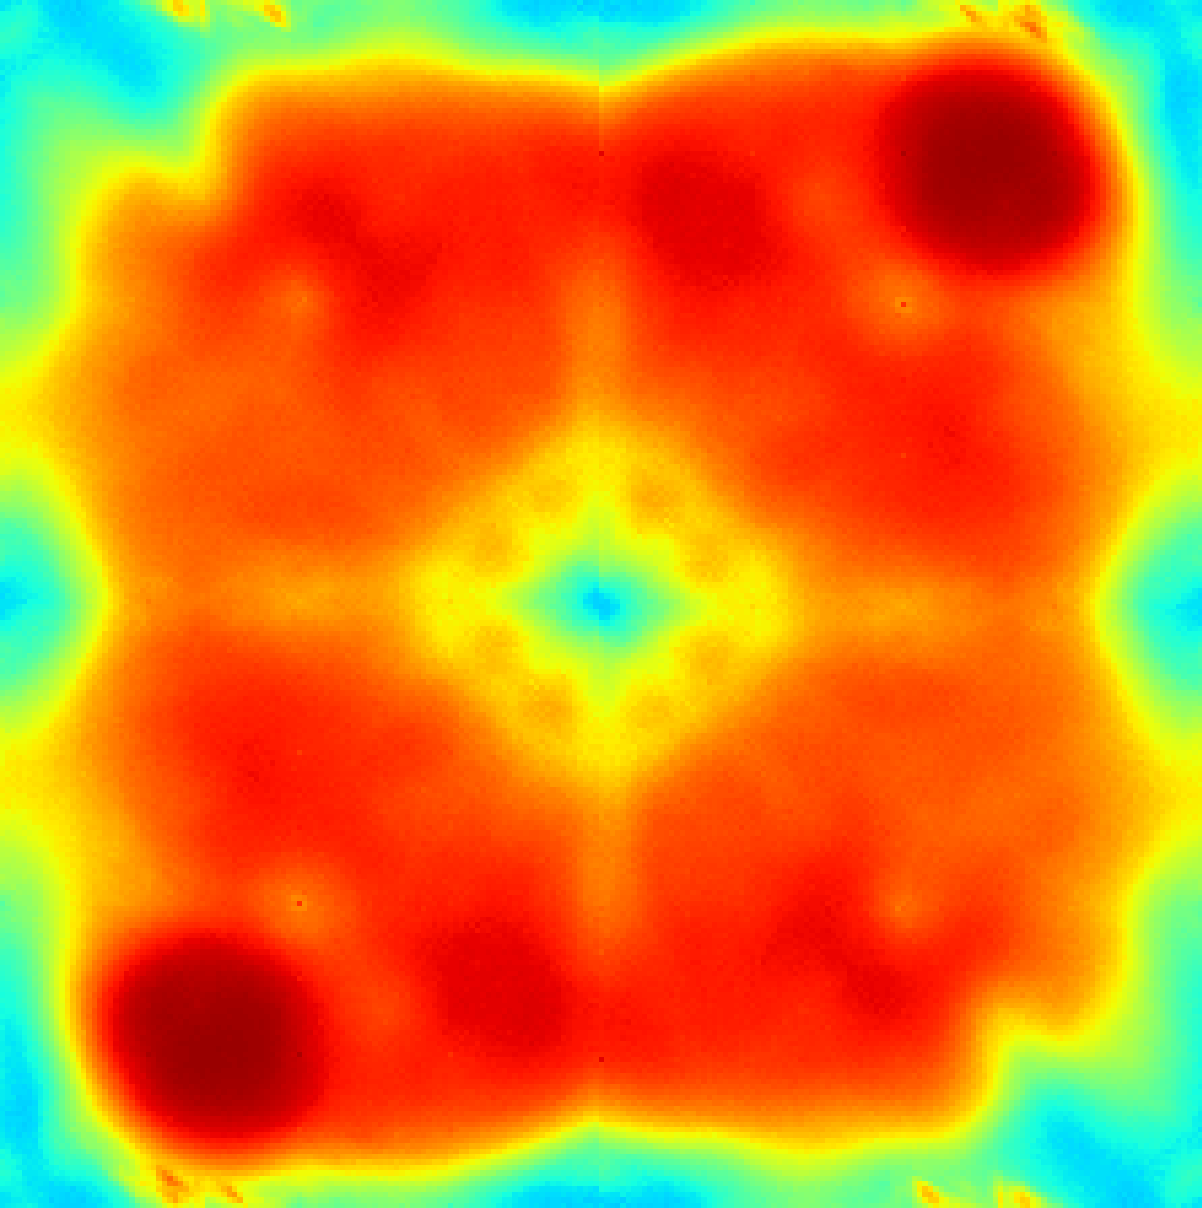
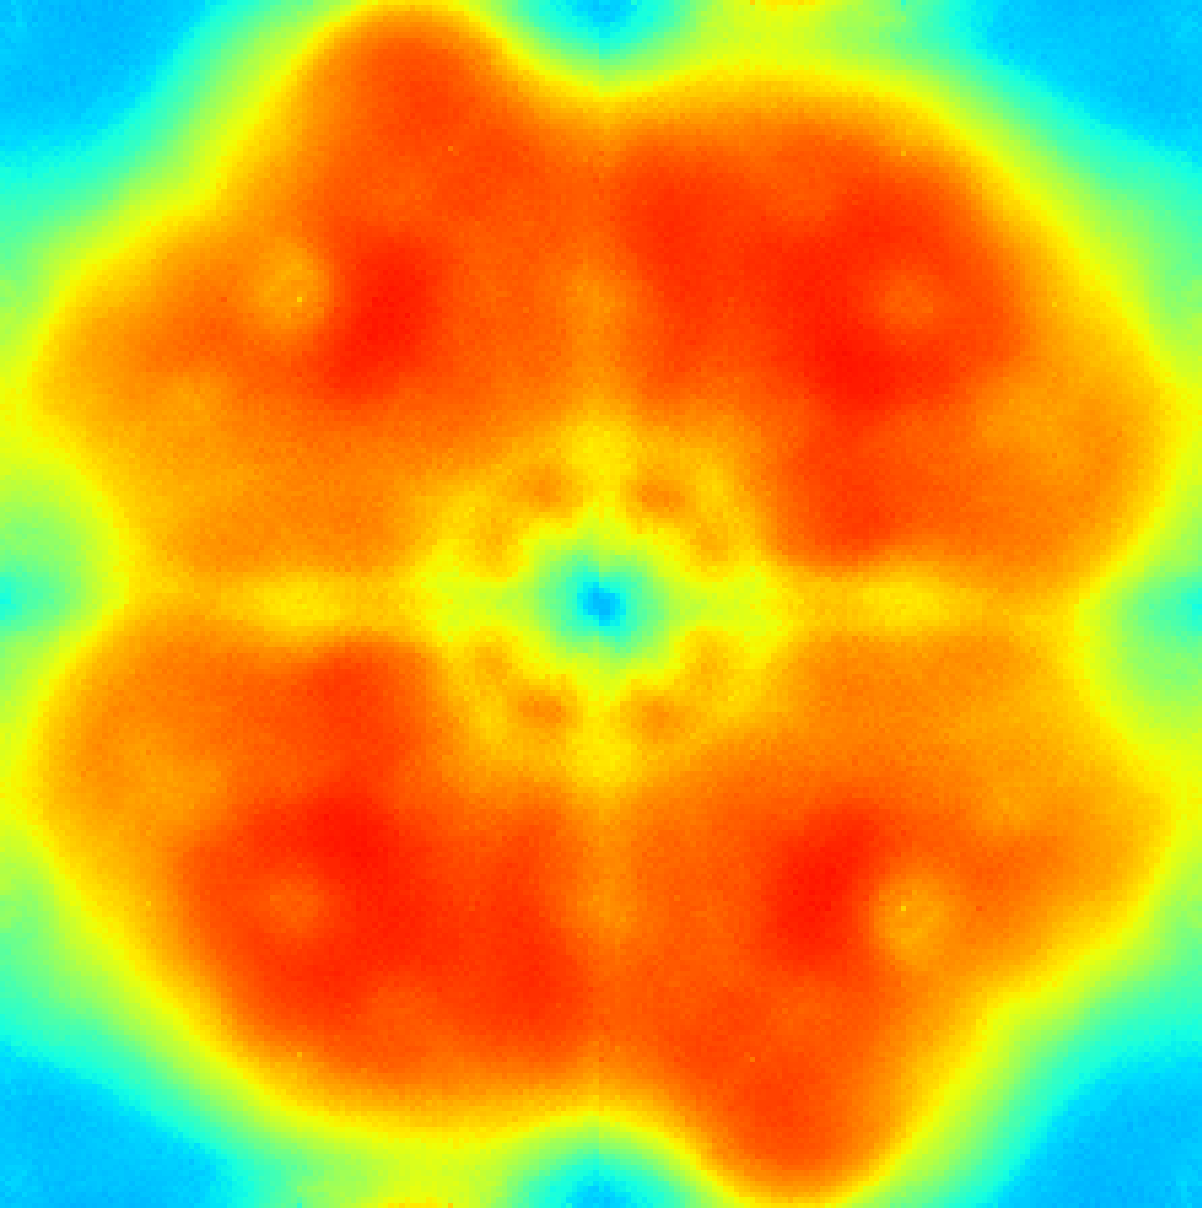
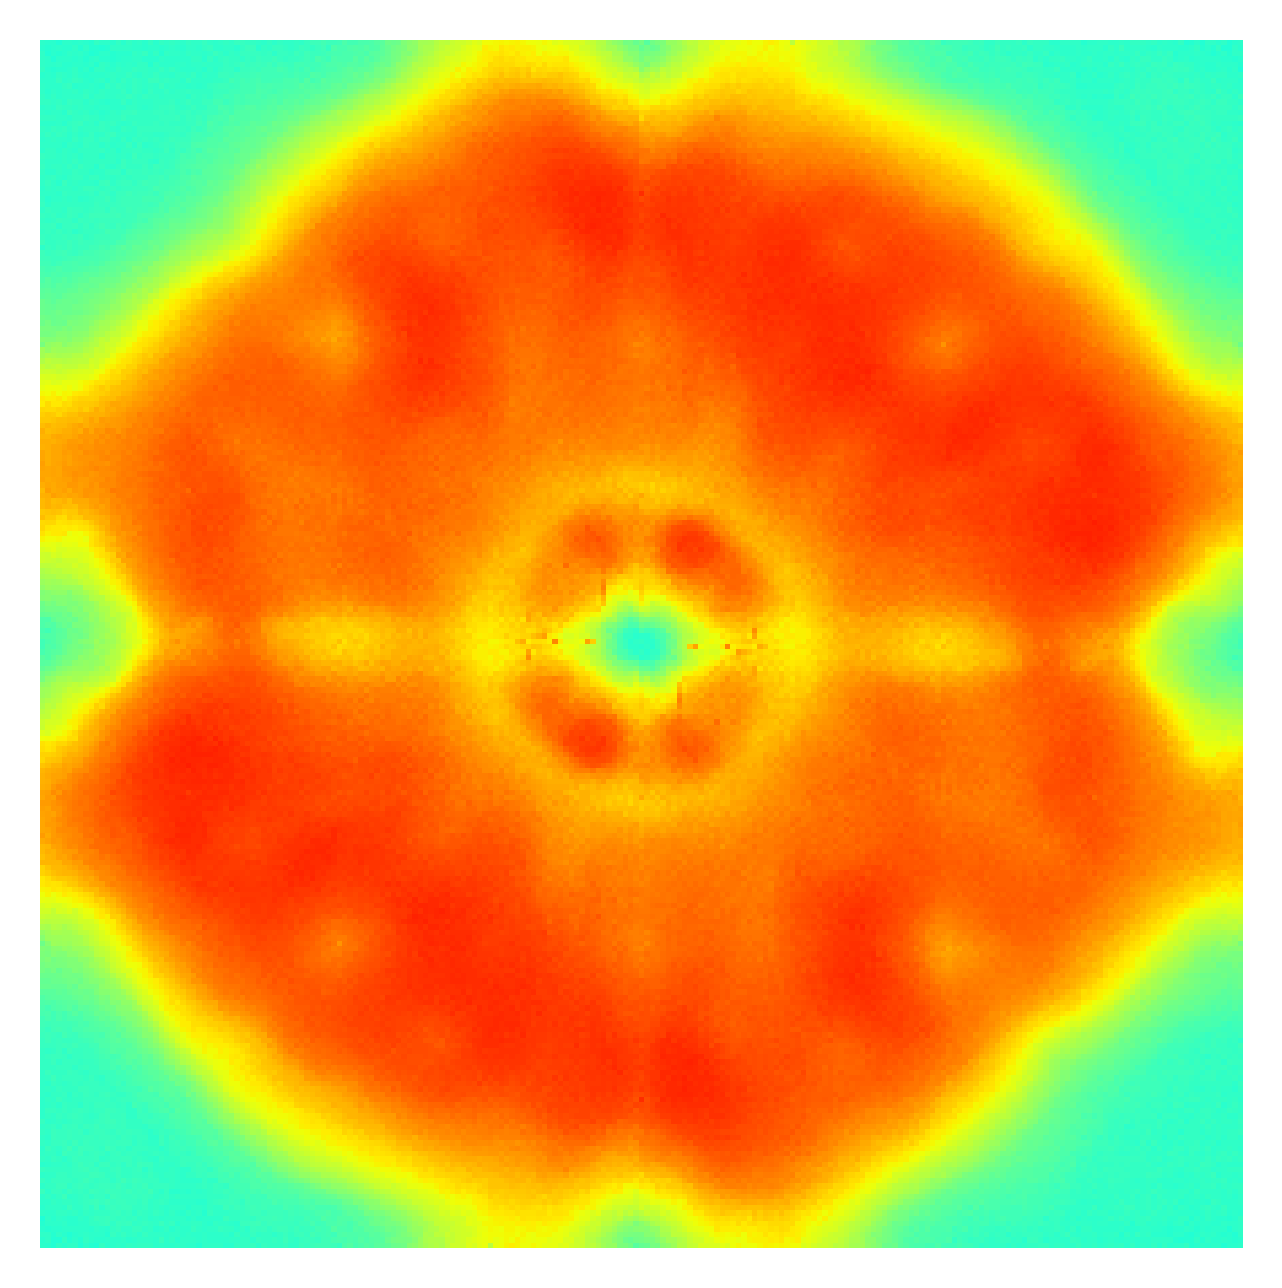
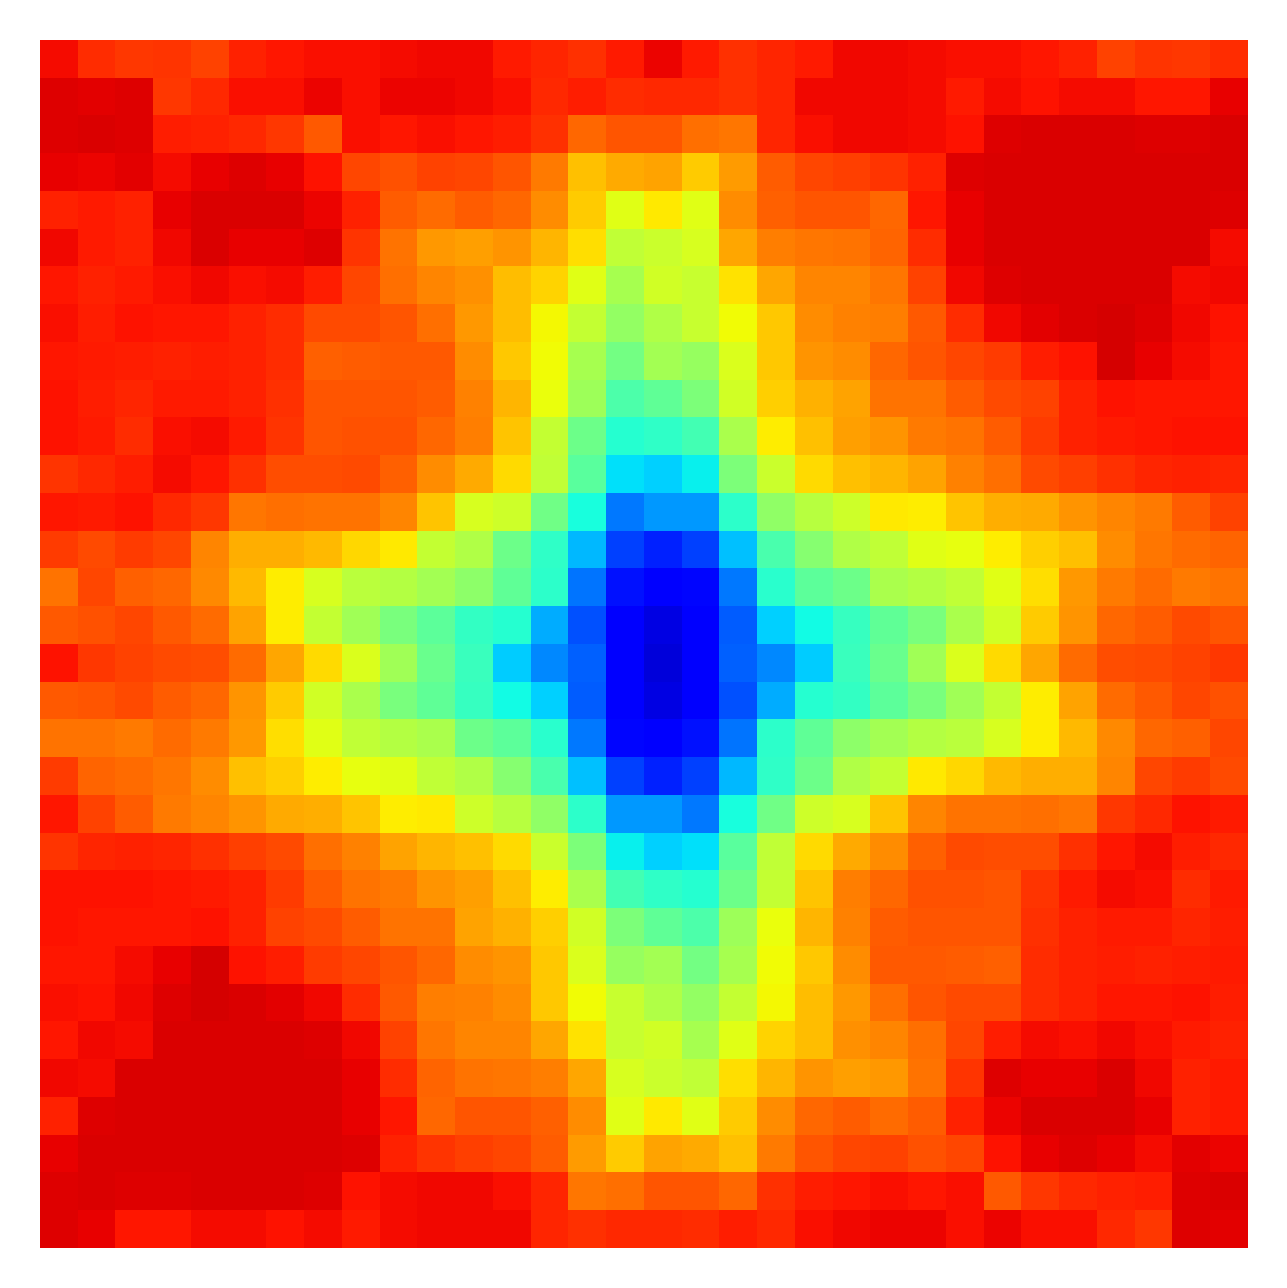
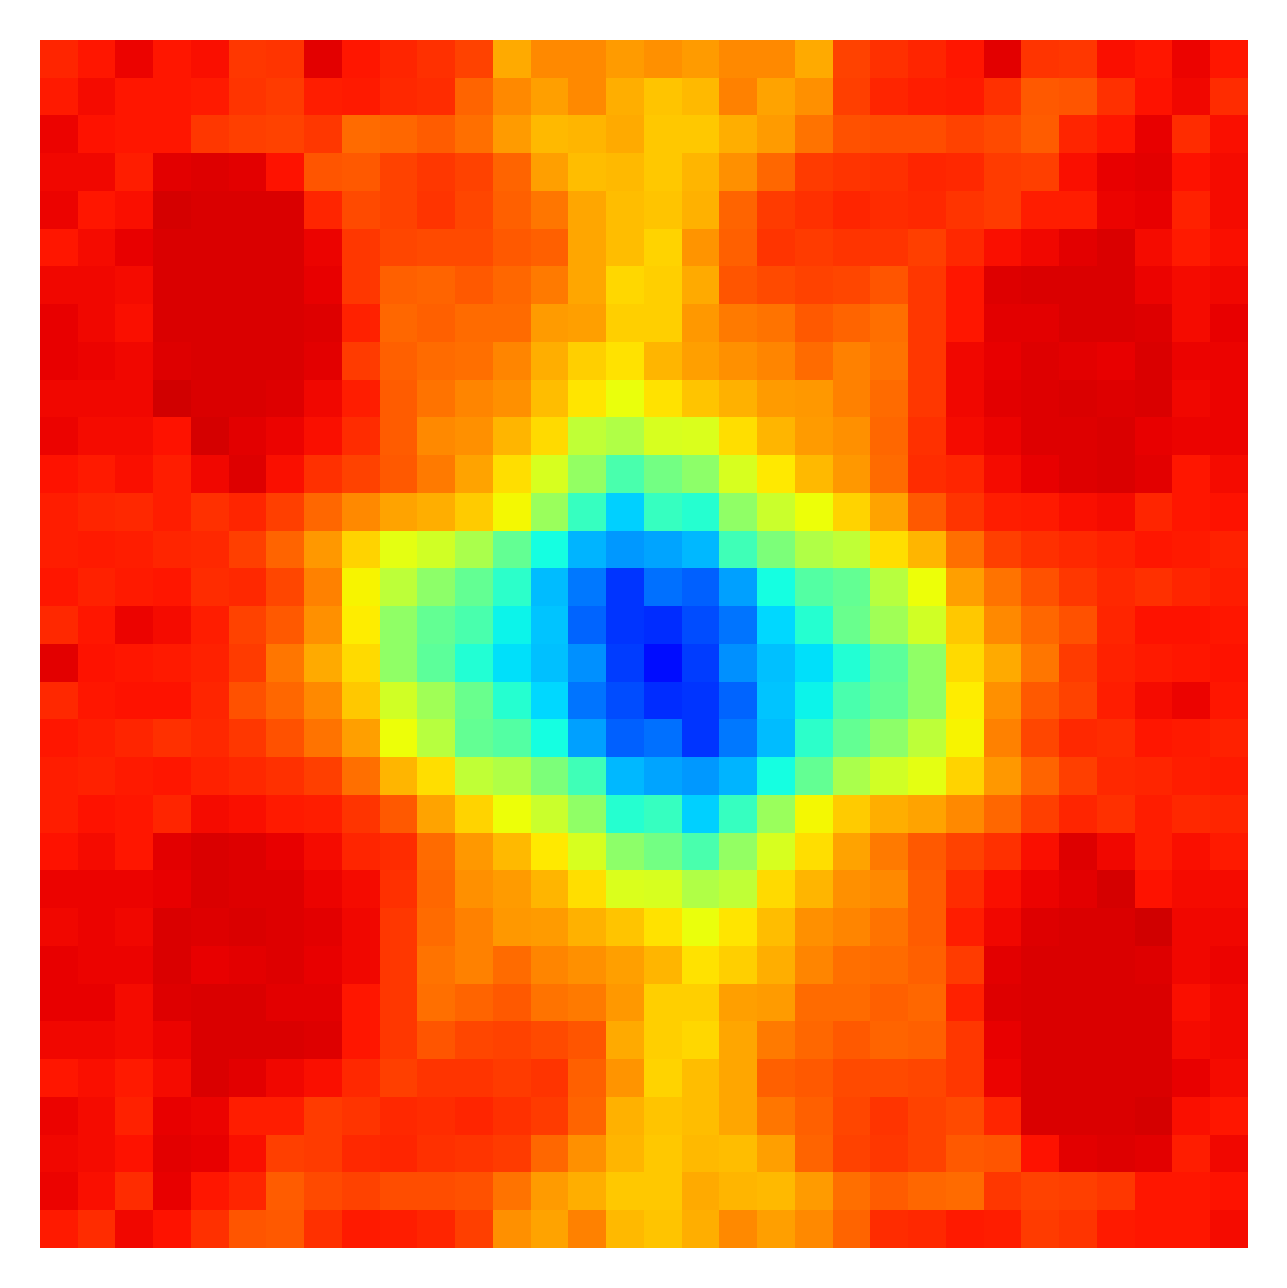
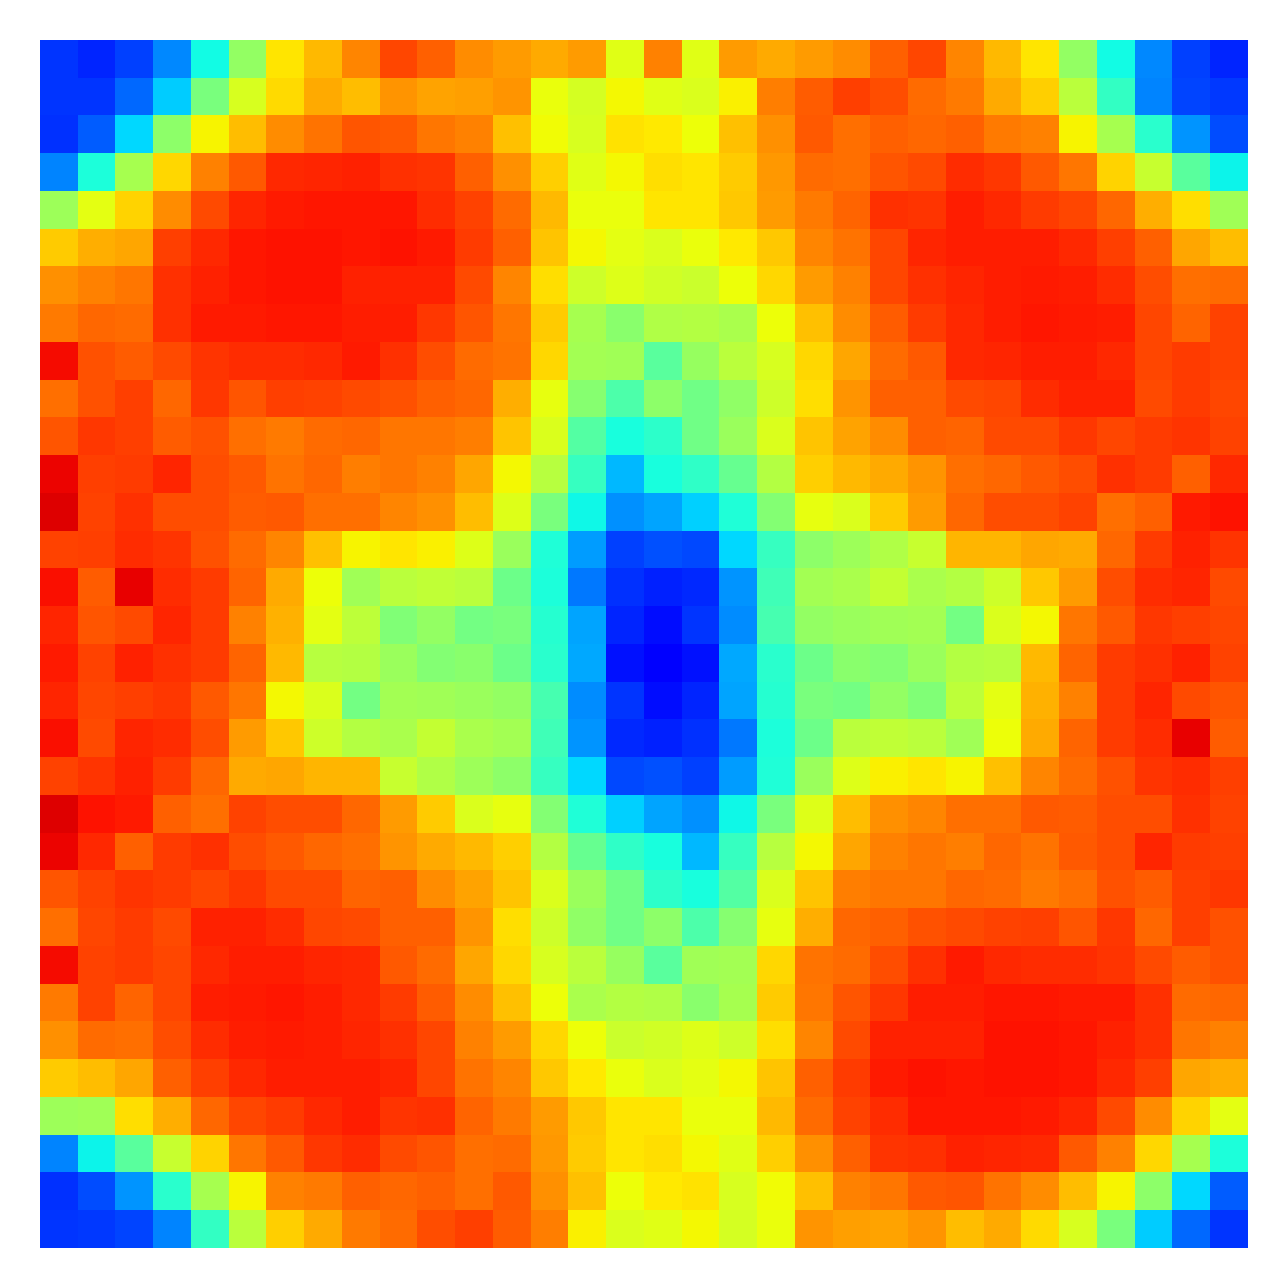
Fourier Heatmaps. We denote a batch of images as , the Fourier basis perturbation factor by , and a uniformly and randomly sampled matrix from by , where is the matrix of all ones in . Let denote the perturbed batch of images, where , is the Hadamard product. Note that the addition is performed across all channels of images in the batch. To measure the sensitivity of a classification DNN to the frequency basis at , we forward pass the perturbed batch through the DNN and compute its output error rate w.r.t. the ground truth image labels for the specified basis. When repeated for all pairs, we can visualize the DNN’s sensitivity to all 2D Fourier bases through a matrix denoted as a Fourier heatmap [Yin et al.(2019)Yin, Lopes, Shlens, Cubuk, and Gilmer] (see Figure 1(a) for an example).
4 Proposed Method
Following [Gu et al.(2019)Gu, Liu, Dolan-Gavitt, and Garg, Xiong et al.(2020)Xiong, Xu, Zhong, and Li, Salem et al.(2020)Salem, Wen, Backes, Ma, and Zhang, Chen et al.(2020)Chen, Salem, Backes, Ma, and Zhang, Zhang et al.(2021b)Zhang, Jia, Wang, and Gong, Liu et al.(2018b)Liu, Ma, Aafer, Lee, Zhai, Wang, and Zhang], we consider the threat model, in which the victim outsources the training process to a trainer that has access to: (1) the victim’s network architecture and (2) their training dataset. The victim accepts the model provided by the adversary if its classification accuracy on the validation set is satisfactory.
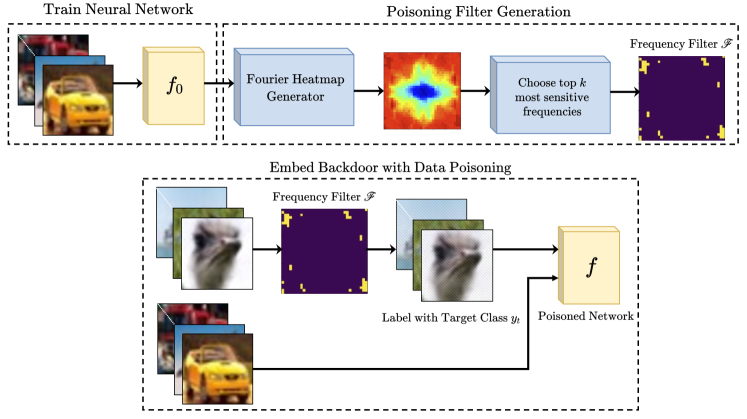
Now we provide a detailed explanation of the proposed frequency-based backdoor attack pipeline. As explained in Section 3, Fourier heatmaps provide a tool for analyzing the sensitivity of a DNN to input perturbations in particular 2D Fourier bases. Knowledge of the network’s sensitive frequencies allows the attacker to design an attack that exploits these frequencies to embed a frequency-based backdoor that maintains a good performance on the original classification task, embeds a strong backdoor trigger that activates the target class at will, and is both invisible and achievable with small poisoning rates. Figure 2 visualizes the proposed pipeline. Below we summarize the recipe for creating frequency-based backdoors.
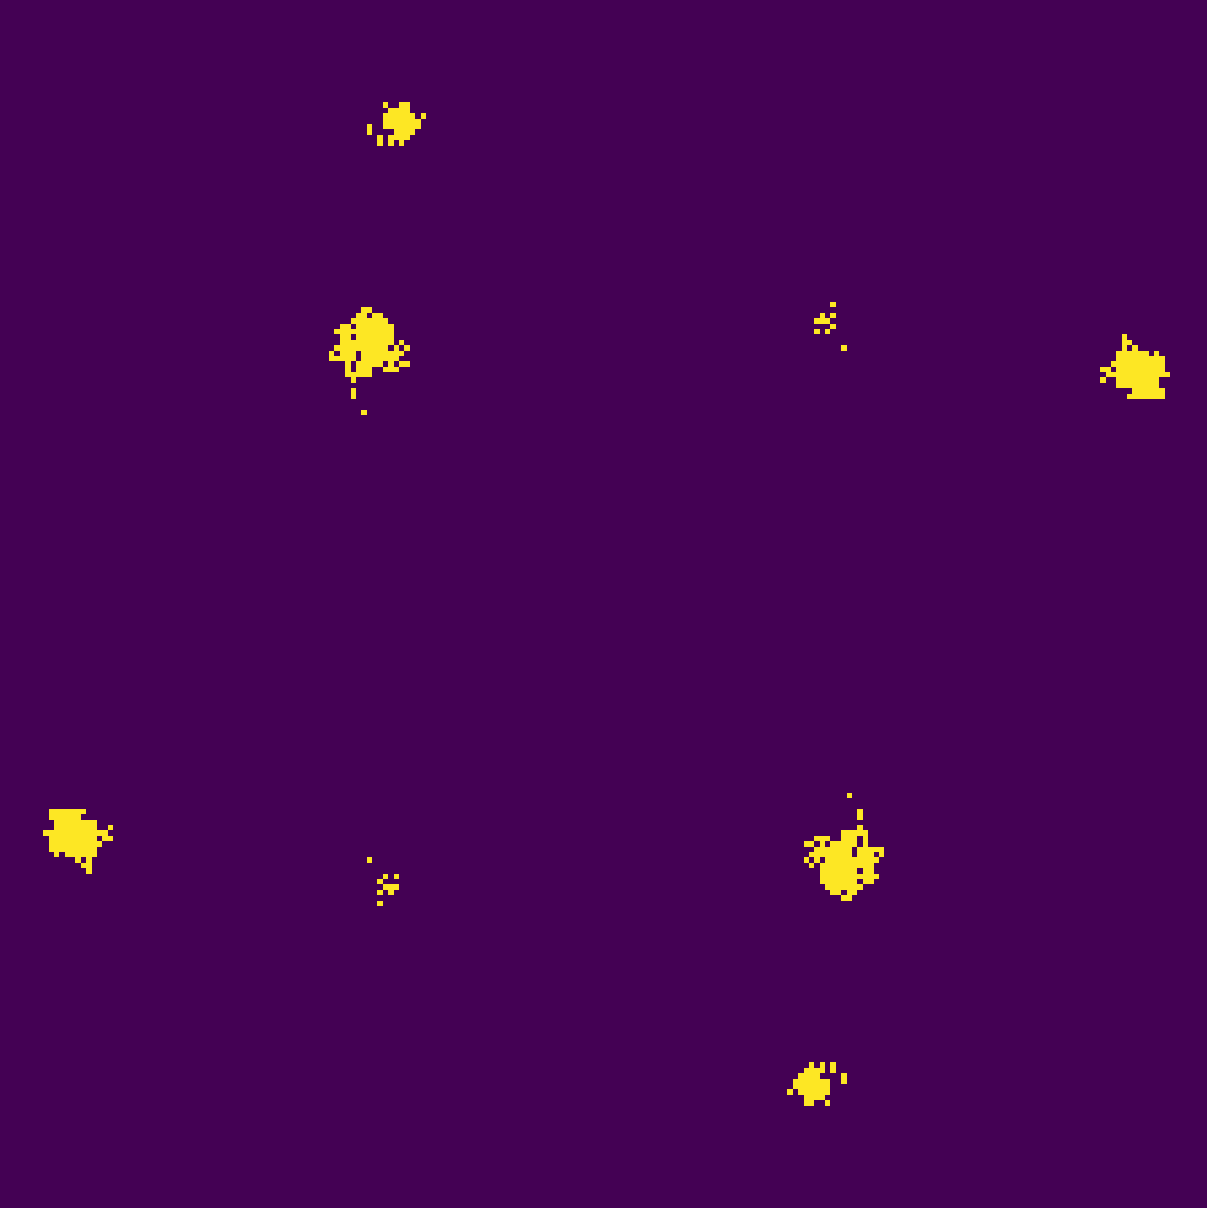
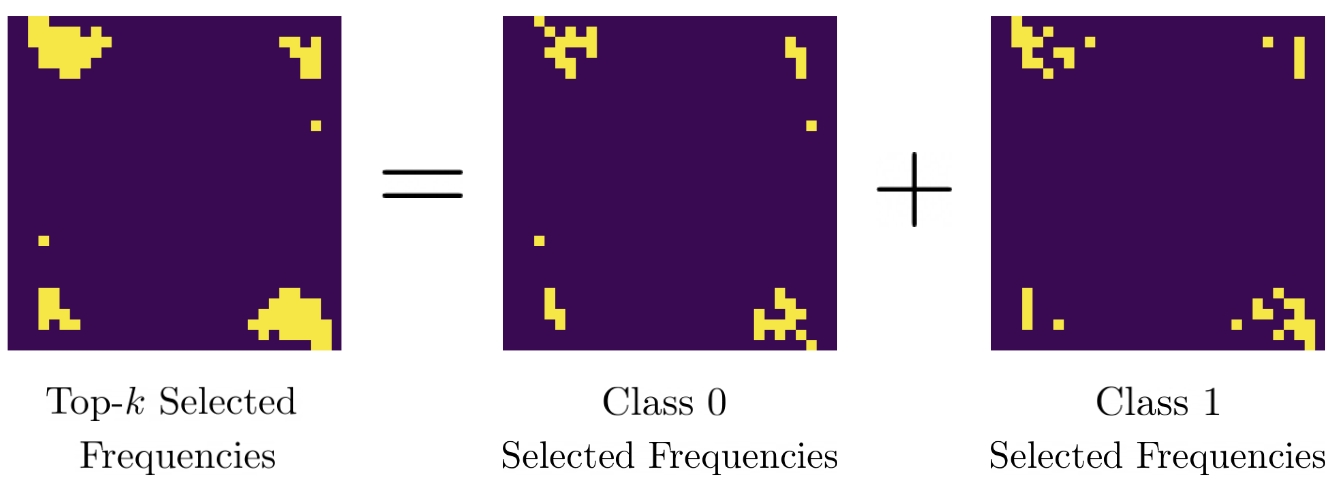
Stage 1: Poisoning Filter Generation: 1. Train a neural network on the clean dataset and the architecture provided by the user. We denote this clean network by . 2. Generate the Fourier heatmap for and store the indices of the top- most sensitive frequencies, , and then generate a binary mask as shown in equation 1. 3. Generate three additive frequency masks one for each channel (, and ) as shown in equation 2. The values for additive masks for should be selected to satisfy the invisibility requirement at hand (discussed later in Section 5.2). For a simple yet flexible design, we set the nonzero values in any individual additive mask to be the same, but different from one mask to another.
| (1) |
| (2) |
Stage 2: Creating the Backdoor through Data Poisoning: 1. Specify a set of samples to poison and denote it by . The cardinality of is denoted by and refers to the number of poisoned samples. The poisoning rate is defined as the ratio of the number of poisoned samples to the total number of samples in the training set. 2. For each sample , and for each channel, apply the following operations:
| (3) |
where each channel is treated separately. 3. Change the label of the samples in to the specific target label . 4. Proceed with training the neural network on the poisoned training dataset to obtain a backdoored or poisoned model .
It should be noted that the operations carried out on the Fourier transformed channels could be thought of as simply changing the values of the components of the top- most sensitive 2D Fourier bases by different values that carry the poisoning information. This could be thought of as a frequency-based version of spatial trigger stamping. Section 5.5 discusses the importance of choosing the top- values rather than random or bottom- elements. The supplementary material contains variants of the proposed method. It includes experiments, where additive masks have (1) varying random values for each channel and (2) the same values across all channels. We also consider adopting a binary mask generated for one architecture and applying it as a poisoning mask for another. Additionally, we discuss two possible variations of the pipeline that (1) extend the applicability of our attack to the multi-target attack regime; (2) allow for an efficient end-to-end frequency backdoor attack.
5 Experiments
In this section, we present the details of our implementation and experiments to evaluate our proposed attack mechanism on various datasets and network architectures. Afterwards, we evaluate our attacked models against three state-of-the-art defenses (three more are found in the supplementary). Finally, we show two defenses against frequency-based backdoor attacks and potential ways for the attacker to defend against them.
5.1 Implementation Details
| Poisoning Rate | CDA(%) | ASR(%) | |
|---|---|---|---|
| 0.0% | 93.92 | \cellcolor[HTML]EFEFEF- | |
| 0.1% | 94.00 | \cellcolor[HTML]EFEFEF1.54 | |
| 0.2% | 94.14 | \cellcolor[HTML]EFEFEF72.31 | |
| 0.4% | 94.20 | \cellcolor[HTML]EFEFEF85.05 | |
| CIFAR10 | 1.0% | 94.38 | \cellcolor[HTML]EFEFEF99.44 |
| 3.0% | 94.31 | \cellcolor[HTML]EFEFEF99.79 | |
| 0.0% | 75.95 | \cellcolor[HTML]EFEFEF- | |
| 0.1% | 75.76 | \cellcolor[HTML]EFEFEF60.57 | |
| 0.2% | 75.75 | \cellcolor[HTML]EFEFEF92.78 | |
| 0.4% | 75.92 | \cellcolor[HTML]EFEFEF96.49 | |
| CIFAR100 | 1.0% | 76.05 | \cellcolor[HTML]EFEFEF98.99 |
| 3.0% | 75.36 | \cellcolor[HTML]EFEFEF99.93 | |
| 0.0% | 97.11 | \cellcolor[HTML]EFEFEF- | |
| 0.1% | 97.09 | \cellcolor[HTML]EFEFEF71.12 | |
| 0.2% | 97.19 | \cellcolor[HTML]EFEFEF89.59 | |
| 0.4% | 97.33 | \cellcolor[HTML]EFEFEF98.04 | |
| GTSRB | 1.0% | 97.25 | \cellcolor[HTML]EFEFEF98.62 |
| 3.0% | 97.47 | \cellcolor[HTML]EFEFEF99.80 | |
| 0.0% | 67.51 | \cellcolor[HTML]EFEFEF- | |
| 0.5% | 67.38 | \cellcolor[HTML]EFEFEF0.17 | |
| 1.0% | 67.13 | \cellcolor[HTML]EFEFEF87.74 | |
| ImageNet | 2.0% | 67.26 | \cellcolor[HTML]EFEFEF98.01 |
| 3.0% | 67.26 | \cellcolor[HTML]EFEFEF98.32 |
Following [zhang et al.(2021)zhang, Chen, Liao, Huang, Hua, Zhang, and Yu, Nguyen and Tran(2021), Doan et al.(2021)Doan, Lao, Zhao, and Li, Schwarzschild et al.(2021)Schwarzschild, Goldblum, Gupta, Dickerson, and Goldstein] we evaluate our attack on various datasets, network architectures, and poisoning rates.
Datasets. We evaluate our proposed pipeline on commonly used datasets: CIFAR10 [Krizhevsky(2009)], CIFAR100 [Krizhevsky(2009)], GTSRB [Houben et al.(2013)Houben, Stallkamp, Salmen, Schlipsing, and Igel], and ImageNet [Russakovsky et al.(2015)Russakovsky, Deng, Su, Krause, Satheesh, Ma, Huang, Karpathy, Khosla, Bernstein, Berg, and Fei-Fei]. Network Architectures. We study six network architectures of different complexity: ResNet18, ResNet34, ResNet50 [He et al.(2016)He, Zhang, Ren, and Sun], DenseNet121 [Huang et al.(2017)Huang, Liu, and Weinberger], VGG19 [Simonyan and Zisserman(2015)], and WideResNet34 [Zagoruyko and Komodakis(2016)]. Network Performance Metrics. To evaluate the performance of backdoored models, we use two common metrics: Clean Data Accuracy (CDA), which measures the performance of the network on clean samples, and Attack Success Rate (ASR), which measures the effectiveness of the backdoor attack in triggering the target label. Invisibility Metrics. Following other papers [zhang et al.(2021)zhang, Chen, Liao, Huang, Hua, Zhang, and Yu, Li et al.(2021b)Li, Li, Wu, Li, He, and Lyu, Nguyen and Tran(2021), Wang et al.(2021)Wang, Yao, Xu, An, Tong, and Wang, Liu et al.(2020)Liu, Ma, Bailey, and Lu, Hu et al.(2021)Hu, Kuang, Qin, Li, Zhang, Gao, Li, and Li], we evaluate the invisibility of the proposed attack using three metrics: Peak Signal-to-Noise-Ratio (PSNR), Structural SIMilarity (SSIM), and Learned Perceptual Image Patch Similarity (LPIPS). Invisibility is a crucial metric for backdoor attacks, as it is required to fool any possible human inspection that may detect the applied trigger.
5.2 Frequency-Based Backdoor Attacks
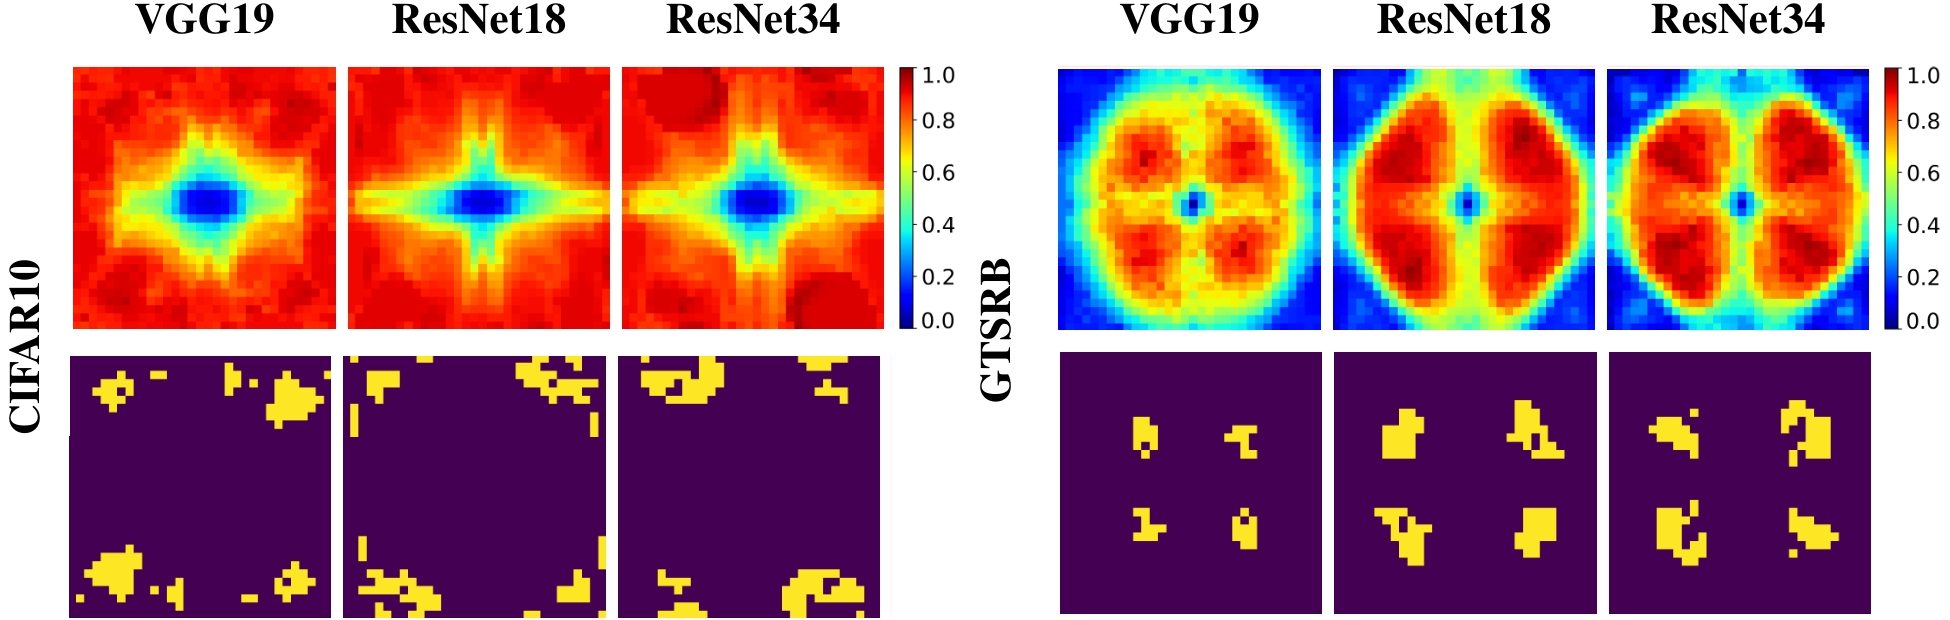
Backdoored Network Performance. As discussed in Section 4, we first train baseline networks on each dataset and compute the corresponding Fourier heatmaps and binary masks. The accuracies of the baseline models () are shown in Table 6 (0% Poisoning Rate). The heatmaps and masks for various architectures trained on CIFAR10 and GTSRB are shown in Figure 3, respectively. The remaining filters and heatmaps are provided in the supplementary material. In our experiments, the choice of , which defines the number of nonzero indices of and the corresponding values for the additive masks , is made such that: (1) the norm of the attack (i.e the norm of the absolute difference of the image before and after poisoning) does not exceed, on average, a threshold ( for ImageNet and for all other datasets), and (2) the invisibility metrics (PSNR, SSIM, LPIPS) reach satisfactory values. Table 6 shows the CDA of the backdoored model () and the ASR of frequency-based triggers for CIFAR10, CIFAR100, GTSRB, and ImageNet and for ResNet18 with different poisoning rates. Similar to [zhang et al.(2021)zhang, Chen, Liao, Huang, Hua, Zhang, and Yu], we also highlight the effect of changing the poisoning rate on the CDA and ASR metrics. As observed, even with a low poisoning rate, we can embed a backdoor attack with a high ASR with little or no drop in CDA. The target label was arbitrarily chosen as the first class of each dataset. Since the datasets are class-balanced, any target label will lead to a similar performance.
| Method | PSNR | SSIM | LPIPS |
| BadNets [Gu et al.(2019)Gu, Liu, Dolan-Gavitt, and Garg] | 27.03 | 0.9921 | 0.0149 |
| Blend [Chen et al.(2017)Chen, Liu, Li, Lu, and Song] | 19.18 | 0.7291 | 0.2097 |
| SIG [Barni et al.(2019)Barni, Kallas, and Tondi] | 25.12 | 0.8988 | 0.0532 |
| Refool [Liu et al.(2020)Liu, Ma, Bailey, and Lu] | 16.59 | 0.7701 | 0.2461 |
| SPM [Liao et al.(2020)Liao, Zhong, Squicciarini, Zhu, and Miller] | 38.65 | 0.9665 | 0.0022 |
| Poison Ink [zhang et al.(2021)zhang, Chen, Liao, Huang, Hua, Zhang, and Yu] | 41.62 | 0.9915 | 0.0020 |
| FTrojan [Wang et al.(2021)Wang, Yao, Xu, An, Tong, and Wang] | 44.87 | 0.9942 | 0.0005 |
| FIBA [Feng et al.(2021)Feng, Ma, Zhang, Zhao, Xia, and Tao] | 18.05 | 0.8077 | 0.1113 |
| Ours (ResNet18) | 47.26 | 0.9998 | 0.0006 |
| Ours (ResNet34) | 47.55 | 0.9998 | 0.0004 |
| Ours (ResNet50) | 46.90 | 0.9998 | 0.0009 |
| Ours (DenseNet121) | 47.21 | 0.9998 | 0.0001 |
| Ours (VGG19) | 46.19 | 0.9998 | 0.0008 |
Table 20 compares our method with existing spatial and frequency backdoor attacks. The results for SIG, Refool, SPM, and Poison Ink are taken from [zhang et al.(2021)zhang, Chen, Liao, Huang, Hua, Zhang, and Yu]. Our frequency-based backdoor attack achieves SOTA results in almost all scenarios considered. Note that the training setup adopted to generate our results is the same for all other methods. A further comparison with other backdoor attacks is provided in the supplementary.
Invisibility of the Proposed Attack. Table 2 compares our proposed frequency-based backdoor attack with other attacks based on their invisibility metrics (PSNR,SSIM,LPIPS). The results of the other methods are taken from [zhang et al.(2021)zhang, Chen, Liao, Huang, Hua, Zhang, and Yu] (except for [Wang et al.(2021)Wang, Yao, Xu, An, Tong, and Wang, Feng et al.(2021)Feng, Ma, Zhang, Zhao, Xia, and Tao]). Our proposed attack achieves the highest PSNR and SSIM, and the lowest LPIPS compared to other backdoor attacks. The PSNR of our method could be further improved at the cost of ASR by selecting fewer frequencies to poison; however, the invisibility metrics (PSNR, SSIM, LPIPS) “saturate” beyond a certain point where further improvements become insignificant and unneeded.
| Metric | Ratio | SIG | Refool | SPM | WaNet | FIBA | FTrojan | Poison Ink | Ours |
| CDA/ASR | 3% | 89.74 / 99.23 | 89.20 / 87.16 | 88.89 / 58.53 | 91.86 / 32.86 | 90.92 / 90.10 | 91.31 / 99.99 | 89.65 / 94.22 | 92.31 / 99.43 |
| 5% | 89.64 / 99.47 | 89.16 / 89.79 | 88.90 / 57.69 | 91.47 / 88.15 | 90.69 / 95.06 | 91.64 / 99.10 | 89.69 / 93.58 | 91.88 / 99.88 | |
| 10% | 89.45 / 99.40 | 88.80 / 92.80 | 89.07 / 57.33 | 91.22 / 96.96 | 90.41 / 95.86 | 90.93 / 100.00 | 89.47 / 93.67 | 92.10 / 99.97 | |
| PSNR/LPIPS | 25.12 / 0.0400 | 19.38 / 0.0397 | 38.94 / 0.0001 | 31.53 / 0.0047 | 19.40 / 0.0180 | 41.01 / 0.0001 | 42.95 / 0.0001 | 43.15 / 0.00001 | |
5.3 Evaluation Against Backdoor Defenses
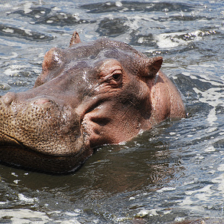
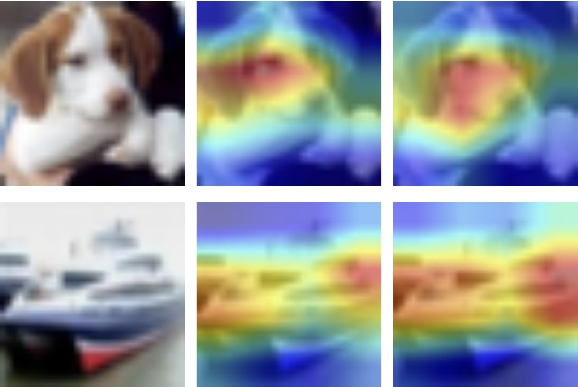
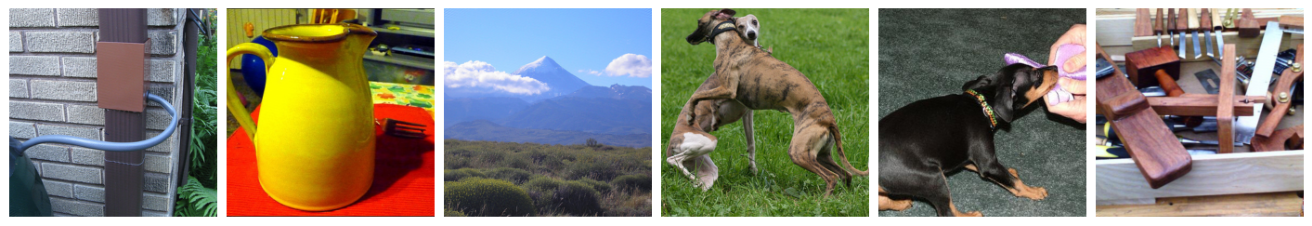
We evaluate our attacked models against three SOTA backdoor defenses, namely, Neural Cleanse [Wang et al.(2019)Wang, Yao, Shan, Li, Viswanath, Zheng, and Zhao], Grad-CAM [Selvaraju et al.(2019)Selvaraju, Das, Vedantam, Cogswell, Parikh, and Batra], and Pruning [Liu et al.(2018a)Liu, Dolan-Gavitt, and Garg]. Being invisible and dynamic in the spatial domain, frequency-based backdoor attacks can easily evade SOTA defenses. The results of the three defenses against our attacked ResNet18 model trained on CIFAR10 with poisoning rate are shown in Figure 4(c). Figure 4(a) shows the Grad-CAM [Selvaraju et al.(2019)Selvaraju, Das, Vedantam, Cogswell, Parikh, and Batra] results for two images and their backdoor attacked versions using our frequency-based approach. Grad-CAM uses gradients of a particular class to visualize where the network is looking/focusing at to make its prediction. As shown in Figure 4(a), our frequency-based backdoor attacks do not introduce an observable change in the “attention" of the network. For each of the two samples presented (first column), we compute the Grad-CAM by passing the clean samples into the clean network () (middle column), and then show the Grad-CAM for passing the poisoned samples into the backdoored model () (third column).
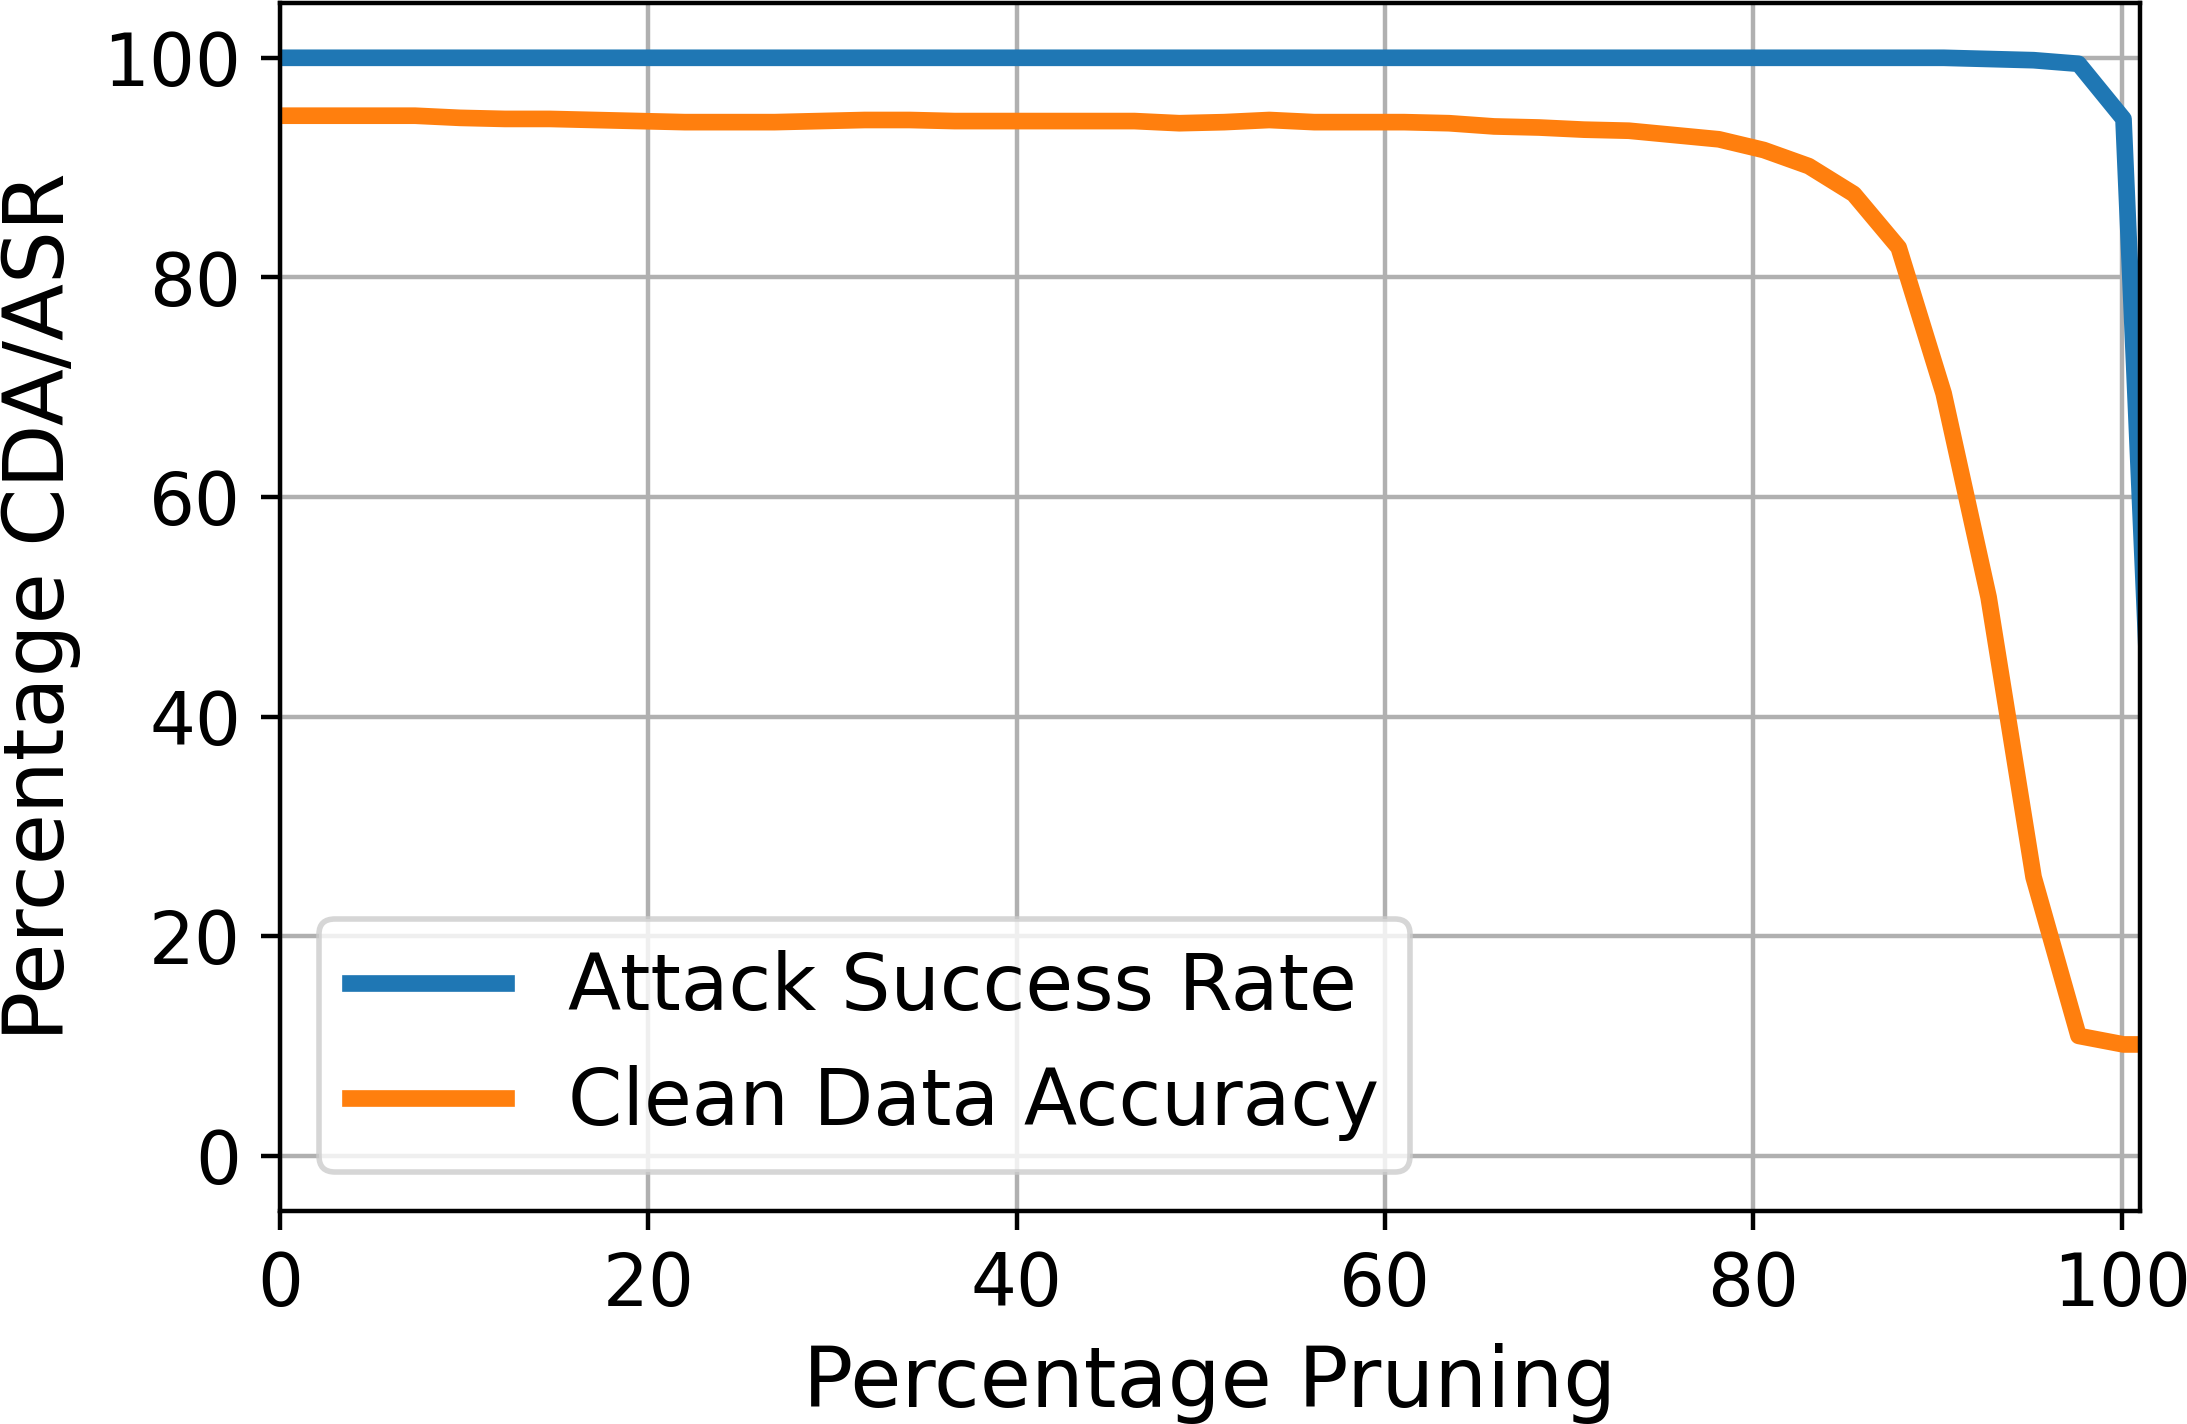
Since the network still focuses on the same parts of the input image, methods like Februus [Doan et al.(2020)Doan, Abbasnejad, and Ranasinghe] fail to remove the embedded backdoor, as observed by [zhang et al.(2021)zhang, Chen, Liao, Huang, Hua, Zhang, and Yu]. Figure 4(b) shows the performance of our attack against the pruning defense in [Liu et al.(2018a)Liu, Dolan-Gavitt, and Garg], which prunes the least active neurons (on clean samples) and then fine-tunes the network on clean samples.
| JPEG | Autoencoder | JPEG+Autoencoder | |||||
| Poisoning Rate | CDA | ASR | CDA | ASR | CDA | ASR | |
| CIFAR10 | 0.1% | 94.19 | \cellcolor[HTML]EFEFEF1.76 | 93.73 | \cellcolor[HTML]EFEFEF0.22 | 94.65 | \cellcolor[HTML]EFEFEF 0.66 |
| 0.2% | 94.37 | \cellcolor[HTML]EFEFEF18.02 | 94.38 | \cellcolor[HTML]EFEFEF22.86 | 94.22 | \cellcolor[HTML]EFEFEF3.08 | |
| 0.5% | 93.94 | \cellcolor[HTML]EFEFEF83.52 | 94.17 | \cellcolor[HTML]EFEFEF73.85 | 94.49 | \cellcolor[HTML]EFEFEF36.48 | |
| 1.0% | 94.28 | \cellcolor[HTML]EFEFEF96.48 | 94.61 | \cellcolor[HTML]EFEFEF93.63 | 94.24 | \cellcolor[HTML]EFEFEF90.11 | |
| 3.0% | 94.26 | \cellcolor[HTML]EFEFEF99.34 | 94.13 | \cellcolor[HTML]EFEFEF98.90 | 94.32 | \cellcolor[HTML]EFEFEF98.46 | |
| CIFAR100 | 0.1% | 76.57 | \cellcolor[HTML]EFEFEF14.26 | 76.19 | \cellcolor[HTML]EFEFEF14.06 | 76.05 | \cellcolor[HTML]EFEFEF2.57 |
| 0.2% | 77.14 | \cellcolor[HTML]EFEFEF75.25 | 75.96 | \cellcolor[HTML]EFEFEF83.76 | 75.40 | \cellcolor[HTML]EFEFEF32.08 | |
| 0.5% | 75.86 | \cellcolor[HTML]EFEFEF 95.25 | 76.07 | \cellcolor[HTML]EFEFEF94.06 | 76.35 | \cellcolor[HTML]EFEFEF95.05 | |
| 1.0% | 75.43 | \cellcolor[HTML]EFEFEF 99.21 | 75.57 | \cellcolor[HTML]EFEFEF97.82 | 76.16 | \cellcolor[HTML]EFEFEF96.83 | |
| 3.0% | 75.07 | \cellcolor[HTML]EFEFEF 99.80 | 76.26 | \cellcolor[HTML]EFEFEF99.54 | 75.51 | \cellcolor[HTML]EFEFEF98.81 | |
| GTSRB | 0.1% | 97.27 | \cellcolor[HTML]EFEFEF52.46 | 97.45 | \cellcolor[HTML]EFEFEF 69.55 | 96.97 | \cellcolor[HTML]EFEFEF48.13 |
| 0.2% | 96.79 | \cellcolor[HTML]EFEFEF 74.07 | 97.39 | \cellcolor[HTML]EFEFEF81.14 | 97.09 | \cellcolor[HTML]EFEFEF73.87 | |
| 0.5% | 97.25 | \cellcolor[HTML]EFEFEF90.18 | 97.14 | \cellcolor[HTML]EFEFEF94.50 | 96.84 | \cellcolor[HTML]EFEFEF95.09 | |
| 1.0% | 94.34 | \cellcolor[HTML]EFEFEF86.44 | 97.00 | \cellcolor[HTML]EFEFEF99.02 | 95.56 | \cellcolor[HTML]EFEFEF94.89 | |
| 3.0% | 93.72 | \cellcolor[HTML]EFEFEF98.43 | 97.25 | \cellcolor[HTML]EFEFEF99.78 | 92.99 | \cellcolor[HTML]EFEFEF97.64 | |
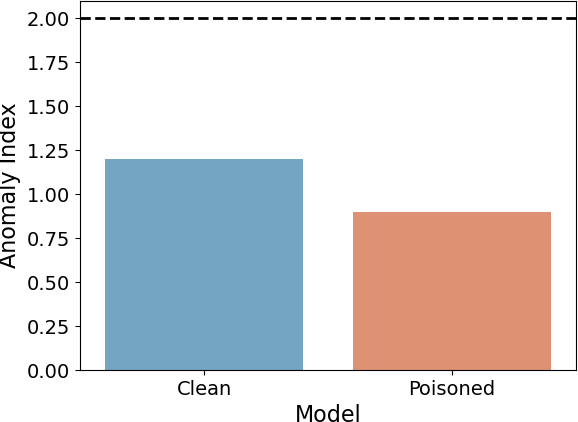
We see that pruning our backdoored model does not eliminate the backdoor. This is mainly attributed to the fact that frequency-based poisoning is of low norm and therefore gets embedded into most weights of the network rather than hidden into particular neurons. Figure 4(c) shows the anomaly index computed by Neural Cleanse [Wang et al.(2019)Wang, Yao, Shan, Li, Viswanath, Zheng, and Zhao] for both the baseline and our backdoored/poisoned model. Since the anomaly index of the poisoned model is less than the anomaly index threshold defined by Neural Cleanse (2.0), Neural Cleanse fails to detect that the frequency-based backdoored model is actually poisoned. Further evaluation of these defenses and evaluation of additional defenses, namely, STRIP [Gao et al.(2019)Gao, Xu, Wang, Chen, Ranasinghe, and Nepal], Spectral Signatures [Tran et al.(2018)Tran, Li, and Madry], and Activation Clustering [Chen et al.(2019)Chen, Carvalho, Baracaldo, Ludwig, Edwards, Lee, Molloy, and Srivastava] on different models and datasets is provided in the supplementary.
5.4 Defenses Against Frequency-based Backdoors
Since the additive mask values could be arbitrarily chosen, a simple inspection of the Fourier transforms of the input may not be successful in detecting the poisoned samples. Therefore, we discuss two possible ways to defend against frequency backdoor attacks.
For a successful defense, the defender should manipulate the frequency spectrum of the input images to break the backdoor trigger while maintaining a satisfactory CDA. We show that this is possible using two techniques: (1) passing the image through an autoencoder and (2) compressing the image. These two methods are used in the robustness literature and have proven to be useful in protecting DNNs from adversarial attacks [Das et al.(2017)Das, Shanbhogue, Chen, Hohman, Chen, Kounavis, and Chau, Das et al.(2018)Das, Shanbhogue, Chen, Hohman, Li, Chen, Kounavis, and Chau]. Autoencoders have also been used as a preprocessing mechanism to disable backdoor triggers [Liu et al.(2017)Liu, Xie, and Srivastava]. Applying an autoencoder trained on CIFAR10 can almost completely deactivate the embedded frequency backdoor. A similar effect is observed for compression, where the ASR of the backdoored model drops to almost 0% after 20% of JPEG compression.
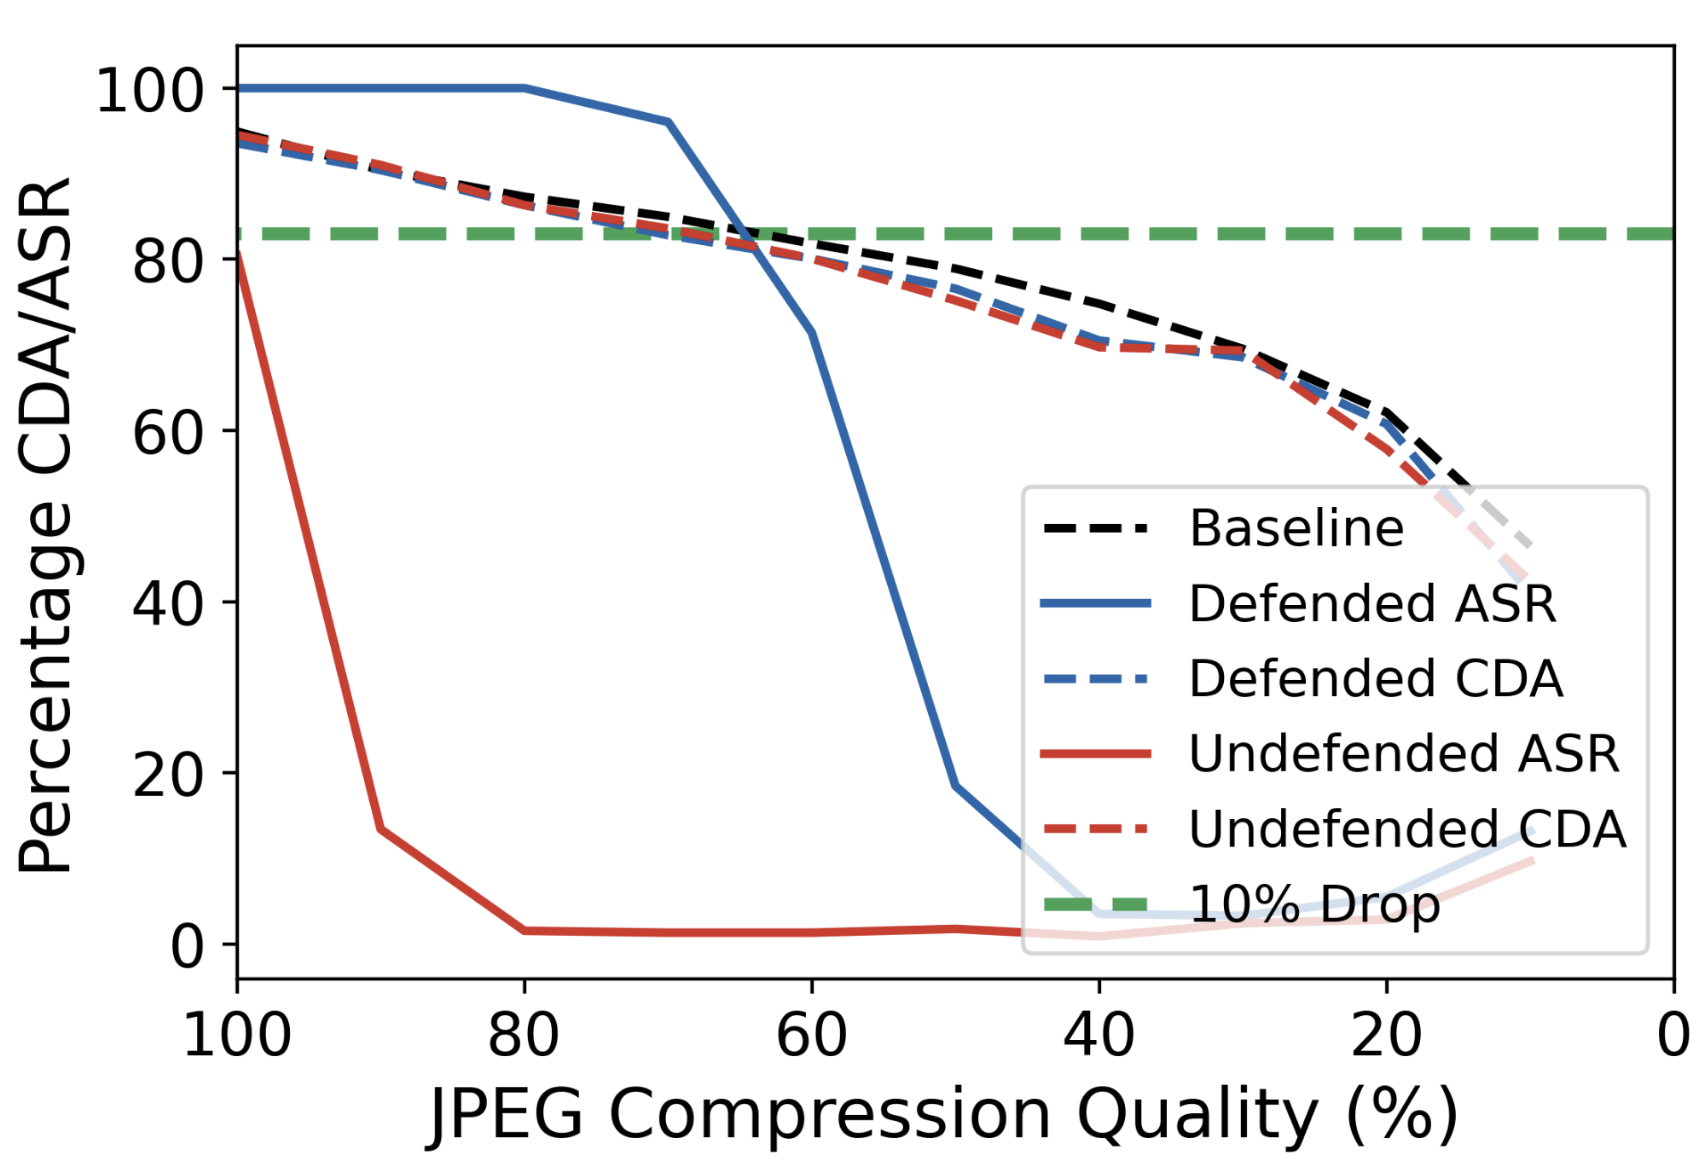
A possible solution to bypass both of these defenses is to apply a technique similar to adversarial training [Goodfellow et al.(2015)Goodfellow, Shlens, and Szegedy, Zhang et al.(2019)Zhang, Yu, Jiao, Xing, Ghaoui, and Jordan]. The attacker can train on compressed and/or auto-encoded versions of the poisoned images. This augmentation translates to embedding multiple versions of the backdoor into the model. Figure 5 shows the ASR and CDA for both an undefended poisoned model and a defended one. For the undefended model, i.e no augmentation, the backdoor immediately breaks down as compression is applied. On the other hand, the defended model can maintain an even beyond 25% compression, where the CDA drops by 10%. Finally, we note that the above augmentations still allow us to reach a high ASR with a minimal drop in CDA for our backdoored models. Therefore, if the defender does not set a defense mechanism, the backdoor still functions properly. The results for ResNet18 trained on CIFAR10, GTSRB, and CIFAR100 with different augmentations are shown in Table 4. The results for other models and datasets are presented in the supplementary material.
5.5 Ablation Study
| Poisoning Rate | 1% | 2% | |
|---|---|---|---|
| Random (1) | CDA(%)/ASR(%) | 67.24/53.91 | 66.83/60.49 |
| Random (2) | 67.23/56.88 | 66.80/66.11 | |
| Bottom- (1) | 67.03/22.58 | 66.80/55.96 | |
| Bottom- (2) | 67.04/0.31 | 67.02/92.81 | |
| Top- (1) | 67.13/87.74 | 67.26/98.01 |
We study the effect of choosing (i) random frequencies and (ii) bottom-, i.e least sensitive frequencies, as compared to choosing the top- frequencies from the Fourier heatmap. Table 5 shows the results of poisoning a ResNet18 trained on ImageNet using two different random filters and two different bottom- filters (two different values were chosen for to control the PSNR), where the runs for a particular scheme are numbered in brackets. The random filters were generated using Bernoulli trials with at each Fourier basis (Random (1): PSNR = 47.62/ Random (2): PSNR = 46.62). Bottom- filters were generated by selecting the -least sensitive frequencies (Bottom- (1): PSNR = 51.23 /Bottom- (2): PSNR = 31.23). In general, bottom- and random frequencies contain low frequency components, which greatly affect the invisibility of the attack.


One can see the importance of choosing top- frequencies over the other two options, as it leads to a high ASR at a small poisoning rate while maintaining a high PSNR. This is attributed to the fact that the network relies on the most sensitive frequencies to perform the classification task at hand. Therefore, embedding a backdoor attack into the most sensitive frequencies allows the network to learn the backdoor trigger with little effort, compared to other frequency selection schemes.
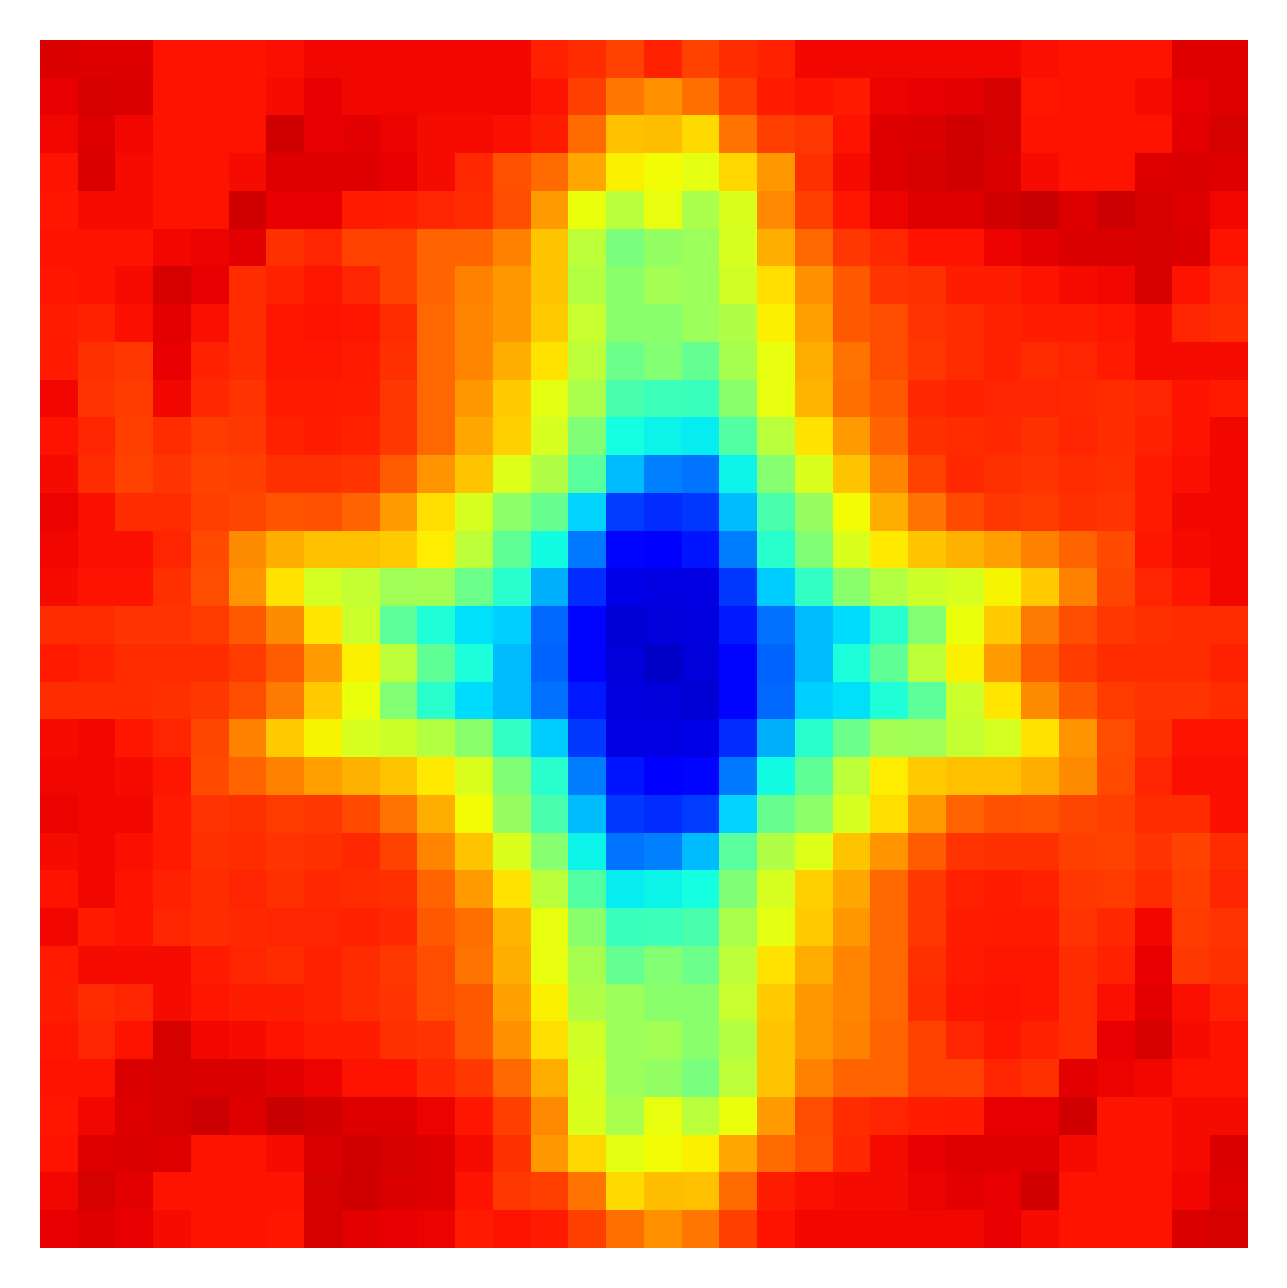
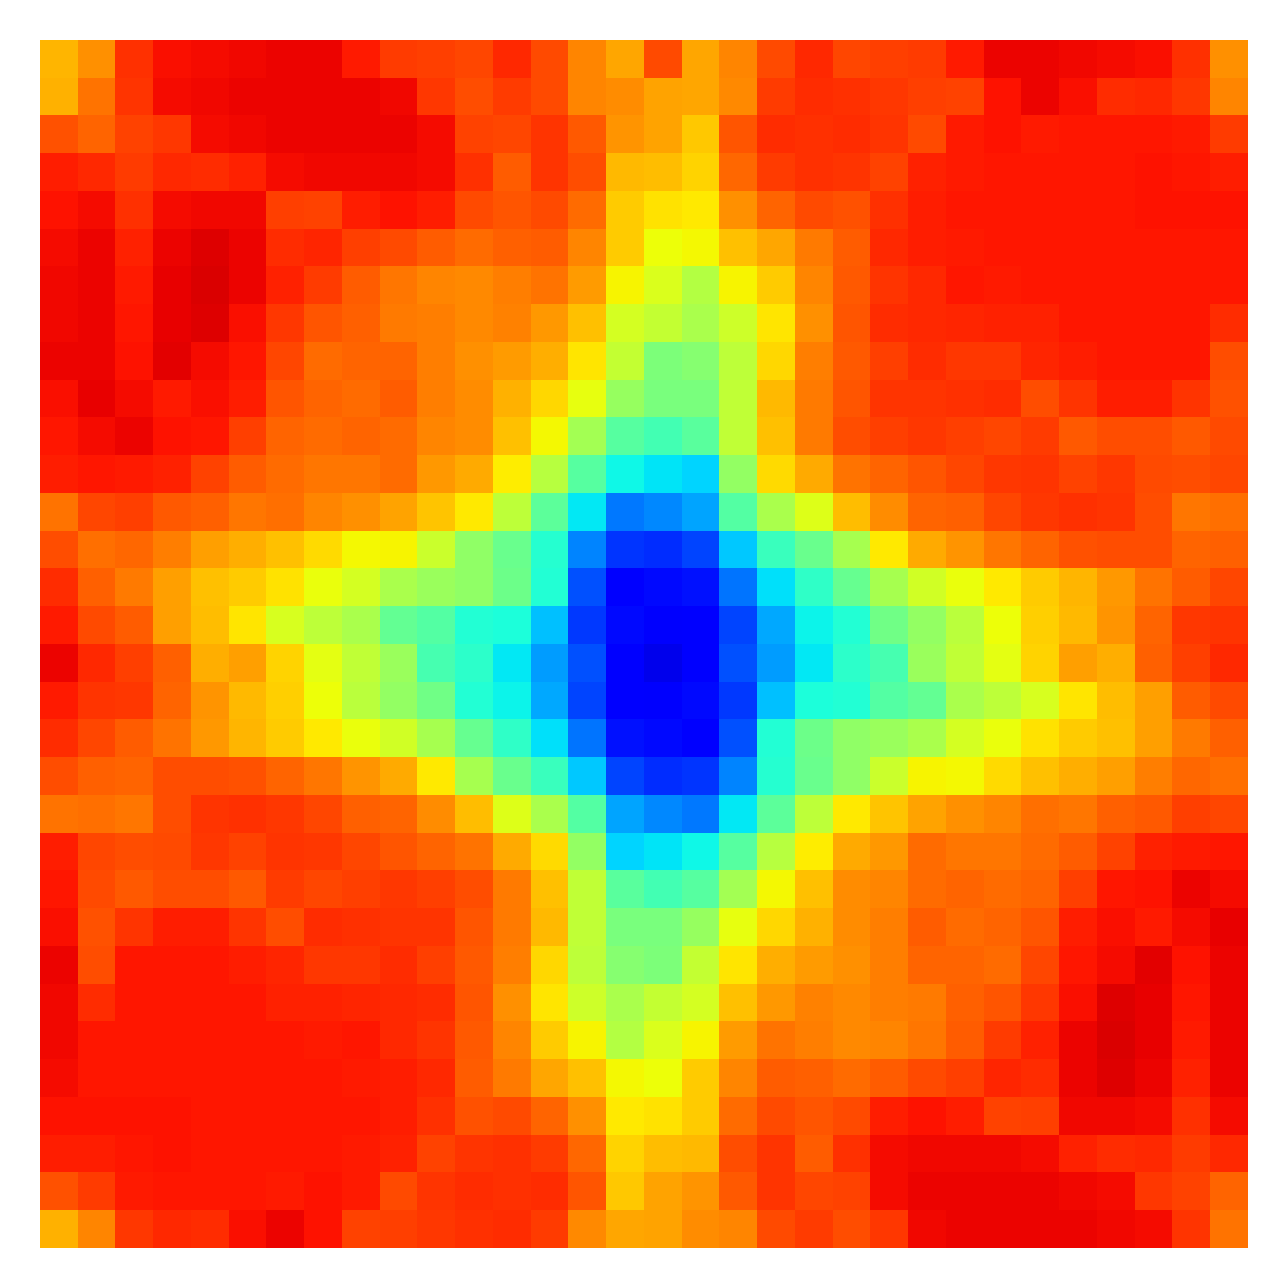
Finally, an interesting observation can be made by looking at the Fourier heatmaps of these models. Figure 6 visualizes the Fourier heatmaps for Random (2), Bottom- (2), and Top- models. We can see a significant explosion in frequency sensitivity in the case of selecting the bottom- components and “chicken-pox" like sensitivity for the random frequency selection (dotted in the positions of randomly sampled frequency bases). Our method of using the top- most sensitive frequencies is more conservative in introducing modifications to the network’s clean heatmap; however, it also experiences mild “sensitivity leakage" at certain frequencies. The supplementary shows the Fourier heatmaps for other backdoor attacks and provides a discussion about detecting backdoor attacked models using Fourier heatmaps.
6 Conclusion
In this work, we proposed a new frequency backdoor attack that takes advantage of the natural frequency sensitivity of the DNN. Through extensive experiments, we showed the effectiveness of the proposed attack in embedding imperceptible backdoors that can evade existing defenses while achieving both a high ASR and a CDA. We also laid the foundations for future defenses against frequency-based backdoor attacks through (1) data preprocessing using autoencoders and compression; and (2) Fourier heatmap visualization.
7 Acknowledgement
This work was supported by the King Abdullah University of Science and Technology (KAUST) Office of Sponsored Research (OSR) under Award No. OSR-CRG2019-4033, as well as, the SDAIA-KAUST Center of Excellence in Data Science and Artificial Intelligence (SDAIA-KAUST AI).
References
- [Barni et al.(2019)Barni, Kallas, and Tondi] M. Barni, K. Kallas, and B. Tondi. A new backdoor attack in cnns by training set corruption without label poisoning. 2019 IEEE International Conference on Image Processing (ICIP), pages 101–105, 2019.
- [Biggio et al.(2012)Biggio, Nelson, and Laskov] Battista Biggio, Blaine Nelson, and Pavel Laskov. Poisoning attacks against support vector machines. In ICML, 2012.
- [Chen et al.(2019)Chen, Carvalho, Baracaldo, Ludwig, Edwards, Lee, Molloy, and Srivastava] Bryant Chen, Wilka Carvalho, Nathalie Baracaldo, Heiko Ludwig, Ben Edwards, Taesung Lee, Ian Molloy, and B. Srivastava. Detecting backdoor attacks on deep neural networks by activation clustering. ArXiv, abs/1811.03728, 2019.
- [Chen et al.(2020)Chen, Salem, Backes, Ma, and Zhang] Xiaoyi Chen, A. Salem, Michael Backes, Shiqing Ma, and Yang Zhang. Badnl: Backdoor attacks against nlp models. ArXiv, abs/2006.01043, 2020.
- [Chen et al.(2017)Chen, Liu, Li, Lu, and Song] Xinyun Chen, Chang Liu, Bo Li, Kimberly Lu, and D. Song. Targeted backdoor attacks on deep learning systems using data poisoning. ArXiv, abs/1712.05526, 2017.
- [Das et al.(2017)Das, Shanbhogue, Chen, Hohman, Chen, Kounavis, and Chau] Nilaksh Das, Madhuri Shanbhogue, Shang-Tse Chen, Fred Hohman, L. Chen, M. Kounavis, and Duen Horng Chau. Keeping the bad guys out: Protecting and vaccinating deep learning with jpeg compression. ArXiv, abs/1705.02900, 2017.
- [Das et al.(2018)Das, Shanbhogue, Chen, Hohman, Li, Chen, Kounavis, and Chau] Nilaksh Das, Madhuri Shanbhogue, Shang-Tse Chen, Fred Hohman, Siwei Li, L. Chen, M. Kounavis, and Duen Horng Chau. Shield: Fast, practical defense and vaccination for deep learning using jpeg compression. Proceedings of the 24th ACM SIGKDD International Conference on Knowledge Discovery & Data Mining, 2018.
- [Doan et al.(2020)Doan, Abbasnejad, and Ranasinghe] Bao Gia Doan, Ehsan Abbasnejad, and D. Ranasinghe. Februus: Input purification defense against trojan attacks on deep neural network systems. Annual Computer Security Applications Conference, 2020.
- [Doan and Lao(2021)] Khoa D Doan and Yingjie Lao. Backdoor attack with imperceptible input and latent modification. 2021.
- [Doan et al.(2021)Doan, Lao, Zhao, and Li] Khoa D Doan, Yingjie Lao, Weijie Zhao, and Ping Li. Lira: Learnable, imperceptible and robust backdoor attacks. 2021 IEEE/CVF International Conference on Computer Vision (ICCV), 2021.
- [Feng et al.(2021)Feng, Ma, Zhang, Zhao, Xia, and Tao] Yu Feng, Benteng Ma, Jing Zhang, Shanshan Zhao, Yong Xia, and Dacheng Tao. Fiba: Frequency-injection based backdoor attack in medical image analysis. ArXiv, abs/2112.01148, 2021.
- [Gao et al.(2019)Gao, Xu, Wang, Chen, Ranasinghe, and Nepal] Yansong Gao, Chang Xu, Derui Wang, Shiping Chen, Damith Chinthana Ranasinghe, and Surya Nepal. Strip: a defence against trojan attacks on deep neural networks. Proceedings of the 35th Annual Computer Security Applications Conference, 2019.
- [Gao et al.(2020)Gao, Doan, Zhang, Ma, Zhang, Fu, Nepal, and Kim] Yansong Gao, Bao Gia Doan, Zhi Zhang, Siqi Ma, Jiliang Zhang, Anmin Fu, S. Nepal, and Hyoungshick Kim. Backdoor attacks and countermeasures on deep learning: A comprehensive review. ArXiv, abs/2007.10760, 2020.
- [Goodfellow et al.(2015)Goodfellow, Shlens, and Szegedy] I. Goodfellow, Jonathon Shlens, and Christian Szegedy. Explaining and harnessing adversarial examples. CoRR, abs/1412.6572, 2015.
- [Graves et al.(2013)Graves, rahman Mohamed, and Hinton] A. Graves, Abdel rahman Mohamed, and Geoffrey E. Hinton. Speech recognition with deep recurrent neural networks. 2013 IEEE International Conference on Acoustics, Speech and Signal Processing, pages 6645–6649, 2013.
- [Gu et al.(2019)Gu, Liu, Dolan-Gavitt, and Garg] Tianyu Gu, K. Liu, Brendan Dolan-Gavitt, and S. Garg. Badnets: Evaluating backdooring attacks on deep neural networks. IEEE Access, 7:47230–47244, 2019.
- [Guo et al.(2019)Guo, Wang, Xing, Du, and Song] Wenbo Guo, L. Wang, Xinyu Xing, Min Du, and D. Song. Tabor: A highly accurate approach to inspecting and restoring trojan backdoors in ai systems. ArXiv, abs/1908.01763, 2019.
- [Hayase et al.(2021)Hayase, Kong, Somani, and Oh] Jonathan Hayase, Weihao Kong, Raghav Somani, and Sewoong Oh. Spectre: Defending against backdoor attacks using robust statistics. ArXiv, abs/2104.11315, 2021.
- [He et al.(2016)He, Zhang, Ren, and Sun] Kaiming He, X. Zhang, Shaoqing Ren, and Jian Sun. Deep residual learning for image recognition. 2016 IEEE Conference on Computer Vision and Pattern Recognition (CVPR), pages 770–778, 2016.
- [Houben et al.(2013)Houben, Stallkamp, Salmen, Schlipsing, and Igel] Sebastian Houben, Johannes Stallkamp, Jan Salmen, Marc Schlipsing, and Christian Igel. Detection of traffic signs in real-world images: The German Traffic Sign Detection Benchmark. In International Joint Conference on Neural Networks, number 1288, 2013.
- [Hu et al.(2021)Hu, Kuang, Qin, Li, Zhang, Gao, Li, and Li] Yupeng Hu, Wenxin Kuang, Zheng Qin, Kenli Li, Jiliang Zhang, Yansong Gao, Wenjia Li, and Keqin Li. Artificial intelligence security: Threats and countermeasures. ACM Computing Surveys, 2021.
- [Huang et al.(2017)Huang, Liu, and Weinberger] Gao Huang, Zhuang Liu, and Kilian Q. Weinberger. Densely connected convolutional networks. 2017 IEEE Conference on Computer Vision and Pattern Recognition (CVPR), pages 2261–2269, 2017.
- [Huster and Ekwedike(2021)] Todd P. Huster and Emmanuel Ekwedike. Top: Backdoor detection in neural networks via transferability of perturbation. ArXiv, abs/2103.10274, 2021.
- [Jumper et al.(2021)Jumper, Evans, Pritzel, Green, Figurnov, Ronneberger, Tunyasuvunakool, Bates, Zídek, Potapenko, Bridgland, Meyer, Kohl, Ballard, Cowie, Romera-Paredes, Nikolov, Jain, Adler, Back, Petersen, Reiman, Clancy, Zielinski, Steinegger, Pacholska, Berghammer, Bodenstein, Silver, Vinyals, Senior, Kavukcuoglu, Kohli, and Hassabis] J. Jumper, Richard Evans, A. Pritzel, Tim Green, Michael Figurnov, O. Ronneberger, Kathryn Tunyasuvunakool, Russ Bates, Augustin Zídek, Anna Potapenko, A. Bridgland, Clemens Meyer, Simon A A Kohl, Andy Ballard, A. Cowie, B. Romera-Paredes, Stanislav Nikolov, Rishub Jain, J. Adler, T. Back, Stig Petersen, D. Reiman, Ellen Clancy, Michal Zielinski, Martin Steinegger, Michalina Pacholska, Tamas Berghammer, S. Bodenstein, D. Silver, Oriol Vinyals, A. Senior, K. Kavukcuoglu, P. Kohli, and D. Hassabis. Highly accurate protein structure prediction with alphafold. Nature, pages 1 – 7, 2021.
- [Krizhevsky(2009)] A. Krizhevsky. Learning multiple layers of features from tiny images. 2009.
- [Kwon and Kim(2022)] Hyung-Min Kwon and Yongchul Kim. Blindnet backdoor: Attack on deep neural network using blind watermark. Multimedia Tools and Applications, pages 1–18, 2022.
- [Li et al.(2021a)Li, Xue, Zhao, Zhu, and Zhang] Shaofeng Li, Minhui Xue, Benjamin Zi Hao Zhao, Haojin Zhu, and Xinpeng Zhang. Invisible backdoor attacks on deep neural networks via steganography and regularization. IEEE Transactions on Dependable and Secure Computing, 18:2088–2105, 2021a.
- [Li et al.(2020)Li, Wu, Jiang, Li, and Xia] Yiming Li, Baoyuan Wu, Yong Jiang, Zhifeng Li, and Shutao Xia. Backdoor learning: A survey. ArXiv, abs/2007.08745, 2020.
- [Li et al.(2021b)Li, Li, Wu, Li, He, and Lyu] Yuezun Li, Yiming Li, Baoyuan Wu, Longkang Li, Ran He, and Siwei Lyu. Invisible backdoor attack with sample-specific triggers. 2021 IEEE/CVF International Conference on Computer Vision (ICCV), 2021b.
- [Liao et al.(2020)Liao, Zhong, Squicciarini, Zhu, and Miller] Cong Liao, Haoti Zhong, Anna Cinzia Squicciarini, Sencun Zhu, and David J. Miller. Backdoor embedding in convolutional neural network models via invisible perturbation. Proceedings of the Tenth ACM Conference on Data and Application Security and Privacy, 2020.
- [Litjens et al.(2017)Litjens, Kooi, Bejnordi, Setio, Ciompi, Ghafoorian, Laak, Ginneken, and Sánchez] G. Litjens, Thijs Kooi, B. E. Bejnordi, A. Setio, F. Ciompi, M. Ghafoorian, J. V. D. Laak, B. Ginneken, and C. Sánchez. A survey on deep learning in medical image analysis. Medical image analysis, 42:60–88, 2017.
- [Liu et al.(2018a)Liu, Dolan-Gavitt, and Garg] K. Liu, Brendan Dolan-Gavitt, and S. Garg. Fine-pruning: Defending against backdooring attacks on deep neural networks. In RAID, 2018a.
- [Liu et al.(2018b)Liu, Ma, Aafer, Lee, Zhai, Wang, and Zhang] Yingqi Liu, Shiqing Ma, Yousra Aafer, Wen-Chuan Lee, Juan Zhai, Weihang Wang, and X. Zhang. Trojaning attack on neural networks. In NDSS, 2018b.
- [Liu et al.(2019)Liu, Lee, Tao, Ma, Aafer, and Zhang] Yingqi Liu, Wen-Chuan Lee, Guanhong Tao, Shiqing Ma, Yousra Aafer, and X. Zhang. Abs: Scanning neural networks for back-doors by artificial brain stimulation. Proceedings of the 2019 ACM SIGSAC Conference on Computer and Communications Security, 2019.
- [Liu et al.(2020)Liu, Ma, Bailey, and Lu] Yunfei Liu, Xingjun Ma, J. Bailey, and Feng Lu. Reflection backdoor: A natural backdoor attack on deep neural networks. In ECCV, 2020.
- [Liu et al.(2017)Liu, Xie, and Srivastava] Yuntao Liu, Yang Xie, and Ankur Srivastava. Neural trojans. 2017 IEEE International Conference on Computer Design (ICCD), pages 45–48, 2017.
- [Nguyen and Tran(2021)] A. Nguyen and A. Tran. Wanet - imperceptible warping-based backdoor attack. ArXiv, abs/2102.10369, 2021.
- [Parkhi et al.(2015)Parkhi, Vedaldi, and Zisserman] O. Parkhi, A. Vedaldi, and Andrew Zisserman. Deep face recognition. In BMVC, 2015.
- [Qiao et al.(2019)Qiao, Yang, and Li] Ximing Qiao, Yukun Yang, and H. Li. Defending neural backdoors via generative distribution modeling. In NeurIPS, 2019.
- [Russakovsky et al.(2015)Russakovsky, Deng, Su, Krause, Satheesh, Ma, Huang, Karpathy, Khosla, Bernstein, Berg, and Fei-Fei] Olga Russakovsky, Jia Deng, Hao Su, Jonathan Krause, Sanjeev Satheesh, Sean Ma, Zhiheng Huang, Andrej Karpathy, Aditya Khosla, Michael Bernstein, Alexander C. Berg, and Li Fei-Fei. ImageNet Large Scale Visual Recognition Challenge. International Journal of Computer Vision (IJCV), 115(3):211–252, 2015. 10.1007/s11263-015-0816-y.
- [Salem et al.(2020)Salem, Wen, Backes, Ma, and Zhang] A. Salem, Rui Wen, Michael Backes, Shiqing Ma, and Yang Zhang. Dynamic backdoor attacks against machine learning models. ArXiv, abs/2003.03675, 2020.
- [Sallab et al.(2017)Sallab, Abdou, Perot, and Yogamani] Ahmad El Sallab, Mohammed Abdou, E. Perot, and S. Yogamani. Deep reinforcement learning framework for autonomous driving. ArXiv, abs/1704.02532, 2017.
- [Schwarzschild et al.(2021)Schwarzschild, Goldblum, Gupta, Dickerson, and Goldstein] Avi Schwarzschild, Micah Goldblum, Arjun Gupta, John P. Dickerson, and Tom Goldstein. Just how toxic is data poisoning? a unified benchmark for backdoor and data poisoning attacks. In ICML, 2021.
- [Selvaraju et al.(2019)Selvaraju, Das, Vedantam, Cogswell, Parikh, and Batra] Ramprasaath R. Selvaraju, Abhishek Das, Ramakrishna Vedantam, Michael Cogswell, Devi Parikh, and Dhruv Batra. Grad-cam: Visual explanations from deep networks via gradient-based localization. International Journal of Computer Vision, 128:336–359, 2019.
- [Simonyan and Zisserman(2015)] K. Simonyan and Andrew Zisserman. Very deep convolutional networks for large-scale image recognition. CoRR, abs/1409.1556, 2015.
- [Tran et al.(2018)Tran, Li, and Madry] Brandon Tran, Jerry Li, and Aleksander Madry. Spectral signatures in backdoor attacks. In NeurIPS, 2018.
- [Wang et al.(2019)Wang, Yao, Shan, Li, Viswanath, Zheng, and Zhao] Bolun Wang, Yuanshun Yao, Shawn Shan, Huiying Li, B. Viswanath, Haitao Zheng, and Ben Y. Zhao. Neural cleanse: Identifying and mitigating backdoor attacks in neural networks. 2019 IEEE Symposium on Security and Privacy (SP), pages 707–723, 2019.
- [Wang et al.(2021)Wang, Yao, Xu, An, Tong, and Wang] Tong Wang, Yuan Yao, Feng Xu, Shengwei An, Hanghang Tong, and Ting Wang. Backdoor attack through frequency domain. ArXiv, abs/2111.10991, 2021.
- [Wenger et al.(2021)Wenger, Passananti, Bhagoji, Yao, Zheng, and Zhao] Emily Wenger, Josephine Passananti, Arjun Nitin Bhagoji, Yuanshun Yao, Haitao Zheng, and Ben Y. Zhao. Backdoor attacks against deep learning systems in the physical world. 2021 IEEE/CVF Conference on Computer Vision and Pattern Recognition (CVPR), pages 6202–6211, 2021.
- [Xiong et al.(2020)Xiong, Xu, Zhong, and Li] Yayuan Xiong, Fengyuan Xu, Sheng Zhong, and Qun A. Li. Escaping backdoor attack detection of deep learning. ICT Systems Security and Privacy Protection, 580:431 – 445, 2020.
- [Yan et al.(2021)Yan, Li, Tian, Wu, Li, Chen, and Poor] Zhicong Yan, Gaolei Li, Yuan Tian, Jun Wu, Shenghong Li, Mingzhe Chen, and H. Vincent Poor. Dehib: Deep hidden backdoor attack on semi-supervised learning via adversarial perturbation. In AAAI, 2021.
- [Yin et al.(2019)Yin, Lopes, Shlens, Cubuk, and Gilmer] Dong Yin, Raphael Gontijo Lopes, Jonathon Shlens, E. D. Cubuk, and J. Gilmer. A fourier perspective on model robustness in computer vision. ArXiv, abs/1906.08988, 2019.
- [Zagoruyko and Komodakis(2016)] Sergey Zagoruyko and N. Komodakis. Wide residual networks. ArXiv, abs/1605.07146, 2016.
- [Zeng et al.(2021)Zeng, Park, Mao, and Jia] Yi Zeng, Won Park, Zhuoqing Morley Mao, and R. Jia. Rethinking the backdoor attacks’ triggers: A frequency perspective. ArXiv, abs/2104.03413, 2021.
- [Zhang et al.(2019)Zhang, Yu, Jiao, Xing, Ghaoui, and Jordan] Hongyang R. Zhang, Yaodong Yu, Jiantao Jiao, Eric P. Xing, Laurent El Ghaoui, and Michael I. Jordan. Theoretically principled trade-off between robustness and accuracy. ArXiv, abs/1901.08573, 2019.
- [zhang et al.(2021)zhang, Chen, Liao, Huang, Hua, Zhang, and Yu] Jie zhang, Dongdong Chen, Jing Liao, Qidong Huang, G. Hua, Weiming Zhang, and Nenghai Yu. Poison ink: Robust and invisible backdoor attack. ArXiv, abs/2108.02488, 2021.
- [Zhang et al.(2021a)Zhang, Ding, Tian, Guo, Yuan, and Jiang] Quan Zhang, Yifeng Ding, Yongqiang Tian, Jianmin Guo, Min Yuan, and Yu Jiang. Advdoor: adversarial backdoor attack of deep learning system. Proceedings of the 30th ACM SIGSOFT International Symposium on Software Testing and Analysis, 2021a.
- [Zhang et al.(2021b)Zhang, Jia, Wang, and Gong] Zaixi Zhang, Jinyuan Jia, Binghui Wang, and Neil Zhenqiang Gong. Backdoor attacks to graph neural networks. Proceedings of the 26th ACM Symposium on Access Control Models and Technologies, 2021b.
- [Zheng et al.(2021)Zheng, Zhang, Wagner, Goswami, and Chen] Songzhu Zheng, Yikai Zhang, Hubert Wagner, Mayank Goswami, and Chao Chen. Topological detection of trojaned neural networks. ArXiv, abs/2106.06469, 2021.
Supplementary Material
Appendix A Introduction to Supplementary Material
In this supplementary material, we present the extended results and variants of the proposed frequency-based backdoor attack. Section B shows the full version of Table 1 from the main paper, this includes evaluation of the proposed pipeline on additional network architectures. Section C presents an extended evaluation of the proposed augmentation in Section 5.4 of the main paper (similar to Table 4). Section D discusses different design choices for the additive filters . In section E we extend the applicability of the proposed attack to the multitarget attack regime. Section F presents a more efficient variant of the proposed method. Section G shows the result of applying a binary and an additive filter generated from one model to poison another. Section H visualizes the proposed backdoor attack in the spatial domain, showing that the attack is highly dynamic. Section I displays the Fourier heatmaps and top- selected frequencies (binary masks) for various datasets and architectures. Section J shows the Fourier heatmaps for different spatial backdoor attacks, highlighting a new possible defense against backdoor attacks. Section K presents a further evaluation of the spatial defenses discussed in the manuscript and presents three additional defenses, namely, STRIP [Gao et al.(2019)Gao, Xu, Wang, Chen, Ranasinghe, and Nepal], Spectral Signatures [Tran et al.(2018)Tran, Li, and Madry], and Activation Clustering [Chen et al.(2019)Chen, Carvalho, Baracaldo, Ludwig, Edwards, Lee, Molloy, and Srivastava]. Section L, shows an evaluation of the proposed defense against other frequency backdoor attacks. Section M presents a further comparison of our proposed attack against existing spatial backdoor attacks. Finally, section N provides insights about the relationship between the model’s learning capacity and the capability of embedding a backdoor attack into the model.
Appendix B Evaluation of the Proposed Backdoor Attack
††footnotetext: WideResNet34 was not included for ImageNet experiments as there is no official implementation of this model in torchvision.models .| ResNet18 | ResNet34 | ResNet50 | DenseNet121 | VGG19 | WideResNet34 | ||||||||
|---|---|---|---|---|---|---|---|---|---|---|---|---|---|
| Poisoning Rate | CDA | ASR | CDA | ASR | CDA | ASR | CDA | ASR | CDA | ASR | CDA | ASR | |
| CIFAR10 | 0.0% | 93.92 | \cellcolor[HTML]EFEFEF - | 94.59 | \cellcolor[HTML]EFEFEF- | 94.10 | \cellcolor[HTML]EFEFEF- | 94.70 | \cellcolor[HTML]EFEFEF- | 92.47 | \cellcolor[HTML]EFEFEF- | 95.33 | \cellcolor[HTML]EFEFEF- |
| 0.1% | 94.00 | \cellcolor[HTML]EFEFEF 1.54 | 94.49 | \cellcolor[HTML]EFEFEF0.83 | 94.48 | \cellcolor[HTML]EFEFEF53.63 | 94.94 | \cellcolor[HTML]EFEFEF86.98 | 92.63 | \cellcolor[HTML]EFEFEF0.44 | 95.73 | \cellcolor[HTML]EFEFEF84.91 | |
| 0.2% | 94.14 | \cellcolor[HTML]EFEFEF72.31 | 94.26 | \cellcolor[HTML]EFEFEF66.46 | 94.45 | \cellcolor[HTML]EFEFEF87.91 | 94.54 | \cellcolor[HTML]EFEFEF95.77 | 92.39 | \cellcolor[HTML]EFEFEF0.44 | 95.42 | \cellcolor[HTML]EFEFEF96.89 | |
| 0.4% | 94.20 | \cellcolor[HTML]EFEFEF85.05 | 94.33 | \cellcolor[HTML]EFEFEF90.97 | 94.37 | \cellcolor[HTML]EFEFEF95.38 | 94.89 | \cellcolor[HTML]EFEFEF96.48 | 92.17 | \cellcolor[HTML]EFEFEF1.62 | 95.48 | \cellcolor[HTML]EFEFEF99.34 | |
| 1.0% | 94.38 | \cellcolor[HTML]EFEFEF99.44 | 94.44 | \cellcolor[HTML]EFEFEF91.75 | 94.32 | \cellcolor[HTML]EFEFEF99.34 | 94.83 | \cellcolor[HTML]EFEFEF98.70 | 91.95 | \cellcolor[HTML]EFEFEF99.39 | 95.70 | \cellcolor[HTML]EFEFEF99.80 | |
| 3.0% | 94.31 | \cellcolor[HTML]EFEFEF99.79 | 94.41 | \cellcolor[HTML]EFEFEF99.64 | 94.31 | \cellcolor[HTML]EFEFEF99.36 | 94.94 | \cellcolor[HTML]EFEFEF99.89 | 91.89 | \cellcolor[HTML]EFEFEF99.81 | 95.44 | \cellcolor[HTML]EFEFEF99.99 | |
| CIFAR100 | 0.0% | 75.95 | \cellcolor[HTML]EFEFEF- | 75.66 | \cellcolor[HTML]EFEFEF- | 77.36 | \cellcolor[HTML]EFEFEF- | 78.98 | \cellcolor[HTML]EFEFEF- | 67.45 | \cellcolor[HTML]EFEFEF- | 79.55 | \cellcolor[HTML]EFEFEF- |
| 0.1% | 75.76 | \cellcolor[HTML]EFEFEF 60.57 | 76.76 | \cellcolor[HTML]EFEFEF65.18 | 76.73 | \cellcolor[HTML]EFEFEF42.18 | 78.34 | \cellcolor[HTML]EFEFEF73.47 | 67.78 | \cellcolor[HTML]EFEFEF0.40 | 79.84 | \cellcolor[HTML]EFEFEF43.96 | |
| 0.2% | 75.75 | \cellcolor[HTML]EFEFEF92.78 | 74.79 | \cellcolor[HTML]EFEFEF84.09 | 77.87 | \cellcolor[HTML]EFEFEF78.21 | 79.1 | \cellcolor[HTML]EFEFEF89.31 | 67.72 | \cellcolor[HTML]EFEFEF0.59 | 79.24 | \cellcolor[HTML]EFEFEF78.42 | |
| 0.4% | 75.92 | \cellcolor[HTML]EFEFEF96.49 | 76.25 | \cellcolor[HTML]EFEFEF99.29 | 77.69 | \cellcolor[HTML]EFEFEF83.96 | 79.1 | \cellcolor[HTML]EFEFEF92.67 | 67.61 | \cellcolor[HTML]EFEFEF0.20 | 79.14 | \cellcolor[HTML]EFEFEF87.33 | |
| 1.0% | 76.05 | \cellcolor[HTML]EFEFEF 98.99 | 74.95 | \cellcolor[HTML]EFEFEF99.44 | 77.12 | \cellcolor[HTML]EFEFEF90.49 | 78.6 | \cellcolor[HTML]EFEFEF96.44 | 65.84 | \cellcolor[HTML]EFEFEF0.40 | 79.14 | \cellcolor[HTML]EFEFEF98.02 | |
| 3.0% | 75.36 | \cellcolor[HTML]EFEFEF99.93 | 76.51 | \cellcolor[HTML]EFEFEF99.84 | 76.58 | \cellcolor[HTML]EFEFEF98.61 | 78.31 | \cellcolor[HTML]EFEFEF99.60 | 67.14 | \cellcolor[HTML]EFEFEF99.00 | 78.74 | \cellcolor[HTML]EFEFEF99.41 | |
| GTSRB | 0.0% | 97.11 | \cellcolor[HTML]EFEFEF- | 97.00 | \cellcolor[HTML]EFEFEF- | 97.23 | \cellcolor[HTML]EFEFEF - | 97.22 | \cellcolor[HTML]EFEFEF - | 96.23 | \cellcolor[HTML]EFEFEF- | 97.76 | \cellcolor[HTML]EFEFEF- |
| 0.1% | 97.09 | \cellcolor[HTML]EFEFEF71.12 | 96.90 | \cellcolor[HTML]EFEFEF74.52 | 97.41 | \cellcolor[HTML]EFEFEF82.32 | 97.16 | \cellcolor[HTML]EFEFEF76.82 | 96.48 | \cellcolor[HTML]EFEFEF0.00 | 97.29 | \cellcolor[HTML]EFEFEF71.38 | |
| 0.2% | 97.19 | \cellcolor[HTML]EFEFEF89.59 | 97.06 | \cellcolor[HTML]EFEFEF83.69 | 97.14 | \cellcolor[HTML]EFEFEF86.25 | 97.11 | \cellcolor[HTML]EFEFEF99.61 | 96.74 | \cellcolor[HTML]EFEFEF0.20 | 97.64 | \cellcolor[HTML]EFEFEF88.74 | |
| 0.4% | 97.33 | \cellcolor[HTML]EFEFEF98.04 | 96.73 | \cellcolor[HTML]EFEFEF97.25 | 96.95 | \cellcolor[HTML]EFEFEF97.25 | 97.43 | \cellcolor[HTML]EFEFEF99.61 | 96.01 | \cellcolor[HTML]EFEFEF2.95 | 97.43 | \cellcolor[HTML]EFEFEF98.61 | |
| 1.0% | 97.25 | \cellcolor[HTML]EFEFEF98.62 | 97.03 | \cellcolor[HTML]EFEFEF99.61 | 97.22 | \cellcolor[HTML]EFEFEF98.04 | 97.17 | \cellcolor[HTML]EFEFEF99.61 | 96.27 | \cellcolor[HTML]EFEFEF88.41 | 96.87 | \cellcolor[HTML]EFEFEF99.76 | |
| 3.0% | 97.47 | \cellcolor[HTML]EFEFEF99.80 | 96.76 | \cellcolor[HTML]EFEFEF99.98 | 96.98 | \cellcolor[HTML]EFEFEF99.97 | 97.49 | \cellcolor[HTML]EFEFEF100.00 | 96.29 | \cellcolor[HTML]EFEFEF99.61 | 97.26 | \cellcolor[HTML]EFEFEF99.97 | |
| ImageNet | 0.0% | 67.51 | \cellcolor[HTML]EFEFEF- | 70.86 | \cellcolor[HTML]EFEFEF- | 73.35 | \cellcolor[HTML]EFEFEF- | 74.10 | \cellcolor[HTML]EFEFEF- | 72.11 | \cellcolor[HTML]EFEFEF- | - | \cellcolor[HTML]EFEFEF- |
| 0.5% | 67.38 | \cellcolor[HTML]EFEFEF0.17 | 71.20 | \cellcolor[HTML]EFEFEF84.70 | 73.27 | \cellcolor[HTML]EFEFEF96.00 | 73.91 | \cellcolor[HTML]EFEFEF95.32 | 71.49 | \cellcolor[HTML]EFEFEF91.96 | - | \cellcolor[HTML]EFEFEF- | |
| 1.0% | 67.13 | \cellcolor[HTML]EFEFEF87.74 | 70.74 | \cellcolor[HTML]EFEFEF95.96 | 73.38 | \cellcolor[HTML]EFEFEF98.03 | 74.21 | \cellcolor[HTML]EFEFEF98.05 | 72.33 | \cellcolor[HTML]EFEFEF96.64 | - | \cellcolor[HTML]EFEFEF- | |
| 2.0% | 67.26 | \cellcolor[HTML]EFEFEF98.01 | 70.57 | \cellcolor[HTML]EFEFEF98.87 | 72.78 | \cellcolor[HTML]EFEFEF98.85 | 73.75 | \cellcolor[HTML]EFEFEF99.34 | 71.62 | \cellcolor[HTML]EFEFEF95.379 | - | \cellcolor[HTML]EFEFEF- | |
| 3.0% | 67.26 | \cellcolor[HTML]EFEFEF98.32 | 70.67 | \cellcolor[HTML]EFEFEF98.95 | 72.30 | \cellcolor[HTML]EFEFEF99.25 | 73.39 | \cellcolor[HTML]EFEFEF99.85 | 72.05 | \cellcolor[HTML]EFEFEF97.51 | - | \cellcolor[HTML]EFEFEF- | |
Appendix C Evaluation of Augmented Models
The manuscript discusses two defense techniques against frequency-based backdoor attacks and a simple technique to bypass them through training data augmentation. The results presented in the paper correspond to ResNet18 trained on CIFAR10, CIFAR100, and GTSRB. Tables 7, 8 and 9 present the results for ResNet34, WideResNet34, and VGG19 trained on the aforementioned datasets with training data augmentation. Based on these results, training data augmentation was shown to be a viable counter-attack to the proposed backdoor defenses.
C.1 ResNet34
| Autoencoder | JPEG | JPEG+Autoencoder | |||||
|---|---|---|---|---|---|---|---|
| Poisoning Rate | CDA | ASR | CDA | ASR | CDA | ASR | |
| 0.1% | 94.75 | \cellcolor[HTML]EFEFEF0.12 | 94.17 | \cellcolor[HTML]EFEFEF0.22 | 94.75 | \cellcolor[HTML]EFEFEF0.44 | |
| 0.2% | 94.49 | \cellcolor[HTML]EFEFEF0.88 | 94.75 | \cellcolor[HTML]EFEFEF2.86 | 94.26 | \cellcolor[HTML]EFEFEF1.32 | |
| 0.4% | 94.71 | \cellcolor[HTML]EFEFEF80.66 | 94.68 | \cellcolor[HTML]EFEFEF78.90 | 93.95 | \cellcolor[HTML]EFEFEF17.14 | |
| 1.0% | 94.30 | \cellcolor[HTML]EFEFEF95.82 | 94.49 | \cellcolor[HTML]EFEFEF87.91 | 94.11 | \cellcolor[HTML]EFEFEF92.53 | |
| CIFAR10 | 3.0% | 94.51 | \cellcolor[HTML]EFEFEF98.46 | 94.47 | \cellcolor[HTML]EFEFEF97.58 | 94.50 | \cellcolor[HTML]EFEFEF94.73 |
| 0.1% | 76.84 | \cellcolor[HTML]EFEFEF10.70 | 77.53 | \cellcolor[HTML]EFEFEF61.39 | 77.52 | \cellcolor[HTML]EFEFEF3.56 | |
| 0.2% | 76.08 | \cellcolor[HTML]EFEFEF19.41 | 76.55 | \cellcolor[HTML]EFEFEF84.55 | 76.39 | \cellcolor[HTML]EFEFEF38.81 | |
| 0.4% | 77.56 | \cellcolor[HTML]EFEFEF95.44 | 76.49 | \cellcolor[HTML]EFEFEF95.84 | 77.12 | \cellcolor[HTML]EFEFEF93.27 | |
| 1.0% | 76.98 | \cellcolor[HTML]EFEFEF99.60 | 77.20 | \cellcolor[HTML]EFEFEF96.63 | 77.31 | \cellcolor[HTML]EFEFEF97.22 | |
| CIFAR100 | 3.0% | 76.53 | \cellcolor[HTML]EFEFEF99.61 | 76.26 | \cellcolor[HTML]EFEFEF99.60 | 76.43 | \cellcolor[HTML]EFEFEF99.00 |
| 0.1% | 97.25 | \cellcolor[HTML]EFEFEF43.81 | 97.19 | \cellcolor[HTML]EFEFEF59.33 | 96.96 | \cellcolor[HTML]EFEFEF48.33 | |
| 0.2% | 96.96 | \cellcolor[HTML]EFEFEF88.02 | 97.18 | \cellcolor[HTML]EFEFEF86.64 | 97.05 | \cellcolor[HTML]EFEFEF78.78 | |
| 0.4% | 97.11 | \cellcolor[HTML]EFEFEF93.91 | 97.09 | \cellcolor[HTML]EFEFEF88.21 | 96.78 | \cellcolor[HTML]EFEFEF94.50 | |
| 1.0% | 95.25 | \cellcolor[HTML]EFEFEF91.16 | 96.84 | \cellcolor[HTML]EFEFEF97.05 | 93.99 | \cellcolor[HTML]EFEFEF80.35 | |
| GTSRB | 3.0% | 94.61 | \cellcolor[HTML]EFEFEF98.82 | 96.92 | \cellcolor[HTML]EFEFEF99.02 | 94.79 | \cellcolor[HTML]EFEFEF88.41 |
C.2 WideResNet34
| Autoencoder | JPEG | JPEG+Autoencoder | |||||
|---|---|---|---|---|---|---|---|
| Poisoning Rate | CDA | ASR | CDA | ASR | CDA | ASR | |
| 0.1% | 95.70 | \cellcolor[HTML]EFEFEF63.96 | 95.40 | \cellcolor[HTML]EFEFEF69.01 | 95.63 | \cellcolor[HTML]EFEFEF1.98 | |
| 0.2% | 95.44 | \cellcolor[HTML]EFEFEF89.01 | 95.30 | \cellcolor[HTML]EFEFEF86.59 | 95.69 | \cellcolor[HTML]EFEFEF80.88 | |
| 0.4% | 95.26 | \cellcolor[HTML]EFEFEF97.14 | 95.57 | \cellcolor[HTML]EFEFEF88.57 | 95.32 | \cellcolor[HTML]EFEFEF85.49 | |
| 1.0% | 95.13 | \cellcolor[HTML]EFEFEF98.46 | 95.56 | \cellcolor[HTML]EFEFEF97.36 | 95.46 | \cellcolor[HTML]EFEFEF95.82 | |
| CIFAR10 | 3.0% | 95.48 | \cellcolor[HTML]EFEFEF99.12 | 95.37 | \cellcolor[HTML]EFEFEF98.02 | 95.53 | \cellcolor[HTML]EFEFEF98.24 |
| 0.1% | 79.15 | \cellcolor[HTML]EFEFEF25.94 | 79.27 | \cellcolor[HTML]EFEFEF19.60 | 79.31 | \cellcolor[HTML]EFEFEF8.71 | |
| 0.2% | 79.62 | \cellcolor[HTML]EFEFEF63.76 | 79.46 | \cellcolor[HTML]EFEFEF60.20 | 79.60 | \cellcolor[HTML]EFEFEF35.84 | |
| 0.4% | 79.72 | \cellcolor[HTML]EFEFEF87.92 | 79.19 | \cellcolor[HTML]EFEFEF79.41 | 79.36 | \cellcolor[HTML]EFEFEF79.60 | |
| 1.0% | 79.22 | \cellcolor[HTML]EFEFEF93.47 | 79.29 | \cellcolor[HTML]EFEFEF93.66 | 79.23 | \cellcolor[HTML]EFEFEF73.47 | |
| CIFAR100 | 3.0% | 79.27 | \cellcolor[HTML]EFEFEF98.22 | 79.11 | \cellcolor[HTML]EFEFEF95.64 | 78.81 | \cellcolor[HTML]EFEFEF90.30 |
| 0.1% | 97.70 | \cellcolor[HTML]EFEFEF54.03 | 97.51 | \cellcolor[HTML]EFEFEF60.12 | 97.47 | \cellcolor[HTML]EFEFEF48.72 | |
| 0.2% | 97.02 | \cellcolor[HTML]EFEFEF86.44 | 97.70 | \cellcolor[HTML]EFEFEF72.10 | 96.84 | \cellcolor[HTML]EFEFEF34.58 | |
| 0.4% | 95.72 | \cellcolor[HTML]EFEFEF80.75 | 96.96 | \cellcolor[HTML]EFEFEF97.64 | 93.84 | \cellcolor[HTML]EFEFEF80.16 | |
| 1.0% | 92.15 | \cellcolor[HTML]EFEFEF46.95 | 93.03 | \cellcolor[HTML]EFEFEF43.81 | 92.30 | \cellcolor[HTML]EFEFEF88.45 | |
| GTSRB | 3.0% | 93.12 | \cellcolor[HTML]EFEFEF93.52 | 90.63 | \cellcolor[HTML]EFEFEF78.19 | 89.46 | \cellcolor[HTML]EFEFEF89.78 |
C.3 VGG19
| Autoencoder | JPEG | JPEG+Autoencoder | |||||
|---|---|---|---|---|---|---|---|
| Poisoning Rate | CDA | ASR | CDA | ASR | CDA | ASR | |
| 0.1% | 91.82 | \cellcolor[HTML]EFEFEF1.10 | 92.13 | \cellcolor[HTML]EFEFEF0.44 | 92.65 | \cellcolor[HTML]EFEFEF0.44 | |
| 0.2% | 92.39 | \cellcolor[HTML]EFEFEF0.66 | 92.28 | \cellcolor[HTML]EFEFEF0.66 | 92.36 | \cellcolor[HTML]EFEFEF0.88 | |
| 0.4% | 92.30 | \cellcolor[HTML]EFEFEF1.10 | 92.16 | \cellcolor[HTML]EFEFEF7.47 | 92.43 | \cellcolor[HTML]EFEFEF1.76 | |
| 1.0% | 92.04 | \cellcolor[HTML]EFEFEF89.89 | 92.60 | \cellcolor[HTML]EFEFEF97.36 | 92.16 | \cellcolor[HTML]EFEFEF86.15 | |
| CIFAR10 | 3.0% | 92.52 | \cellcolor[HTML]EFEFEF99.56 | 92.21 | \cellcolor[HTML]EFEFEF100.00 | 91.89 | \cellcolor[HTML]EFEFEF98.90 |
| 0.1% | 68.91 | \cellcolor[HTML]EFEFEF0.20 | 68.84 | \cellcolor[HTML]EFEFEF0.21 | 68.82 | \cellcolor[HTML]EFEFEF0.20 | |
| 0.2% | 68.24 | \cellcolor[HTML]EFEFEF0.59 | 68.71 | \cellcolor[HTML]EFEFEF0.40 | 68.76 | \cellcolor[HTML]EFEFEF1.19 | |
| 0.4% | 68.50 | \cellcolor[HTML]EFEFEF2.57 | 68.36 | \cellcolor[HTML]EFEFEF1.20 | 68.74 | \cellcolor[HTML]EFEFEF2.18 | |
| 1.0% | 68.36 | \cellcolor[HTML]EFEFEF8.91 | 68.12 | \cellcolor[HTML]EFEFEF4.95 | 68.12 | \cellcolor[HTML]EFEFEF7.37 | |
| CIFAR100 | 3.0% | 67.70 | \cellcolor[HTML]EFEFEF98.02 | 68.12 | \cellcolor[HTML]EFEFEF97.82 | 68.14 | \cellcolor[HTML]EFEFEF95.05 |
| 0.1% | 96.69 | \cellcolor[HTML]EFEFEF0.00 | 96.33 | \cellcolor[HTML]EFEFEF0.00 | 96.81 | \cellcolor[HTML]EFEFEF0.00 | |
| 0.2% | 96.39 | \cellcolor[HTML]EFEFEF0.20 | 96.43 | \cellcolor[HTML]EFEFEF0.20 | 96.62 | \cellcolor[HTML]EFEFEF0.79 | |
| 0.4% | 95.87 | \cellcolor[HTML]EFEFEF0.00 | 96.04 | \cellcolor[HTML]EFEFEF0.00 | 95.98 | \cellcolor[HTML]EFEFEF24.36 | |
| 1.0% | 95.63 | \cellcolor[HTML]EFEFEF88.61 | 96.00 | \cellcolor[HTML]EFEFEF91.55 | 96.28 | \cellcolor[HTML]EFEFEF89.00 | |
| GTSRB | 3.0% | 96.22 | \cellcolor[HTML]EFEFEF99.41 | 95.82 | \cellcolor[HTML]EFEFEF98.82 | 95.97 | \cellcolor[HTML]EFEFEF100.00 |
Appendix D Choice of Additive Filters
The results presented in the manuscript set the values of the additive filters to be the same within the channel but different across the channels. We now consider different possible design choices for this additive filter, namely, choosing random or same values (within and across channels) for . Tables 10 and 11 both show high ASR and CDA for different choices of illustrating the flexibility of the proposed method in creating backdoor attacks.
D.1 Random Values for
| ResNet18 | ResNet34 | VGG19 | ||||
|---|---|---|---|---|---|---|
| Poisoning Rate | CDA(%) | ASR(%) | CDA(%) | ASR(%) | CDA(%) | ASR(%) |
| 0.1% | 92.93 | \cellcolor[HTML]EFEFEF2.64 | 93.23 | \cellcolor[HTML]EFEFEF0.88 | 92.12 | \cellcolor[HTML]EFEFEF2.20 |
| 0.2% | 92.83 | \cellcolor[HTML]EFEFEF37.80 | 93.28 | \cellcolor[HTML]EFEFEF11.21 | 91.86 | \cellcolor[HTML]EFEFEF22.20 |
| 0.4% | 93.16 | \cellcolor[HTML]EFEFEF90.11 | 93.49 | \cellcolor[HTML]EFEFEF93.19 | 92.18 | \cellcolor[HTML]EFEFEF56.68 |
| 1.0% | 93.04 | \cellcolor[HTML]EFEFEF97.58 | 93.20 | \cellcolor[HTML]EFEFEF98.90 | 92.26 | \cellcolor[HTML]EFEFEF95.60 |
| 3.0% | 93.21 | \cellcolor[HTML]EFEFEF99.56 | 93.29 | \cellcolor[HTML]EFEFEF99.78 | 92.28 | \cellcolor[HTML]EFEFEF98.90 |
D.2 Same Value for
| ResNet18 | ResNet34 | VGG19 | ||||
|---|---|---|---|---|---|---|
| Poisoning Rate | CDA(%) | ASR(%) | CDA(%) | ASR(%) | CDA(%) | ASR(%) |
| 0.1% | 93.01 | \cellcolor[HTML]EFEFEF1.76 | 93.55 | \cellcolor[HTML]EFEFEF1.32 | 91.93 | \cellcolor[HTML]EFEFEF1.54 |
| 0.2% | 92.95 | \cellcolor[HTML]EFEFEF66.59 | 93.33 | \cellcolor[HTML]EFEFEF22.64 | 92.15 | \cellcolor[HTML]EFEFEF29.45 |
| 0.4% | 92.89 | \cellcolor[HTML]EFEFEF92.08 | 93.31 | \cellcolor[HTML]EFEFEF93.85 | 91.80 | \cellcolor[HTML]EFEFEF66.37 |
| 1.0% | 93.18 | \cellcolor[HTML]EFEFEF98.24 | 93.42 | \cellcolor[HTML]EFEFEF98.46 | 92.10 | \cellcolor[HTML]EFEFEF97.14 |
| 3.0% | 92.87 | \cellcolor[HTML]EFEFEF99.56 | 93.06 | \cellcolor[HTML]EFEFEF99.34 | 91.94 | \cellcolor[HTML]EFEFEF99.12 |
Appendix E Multi Target Attacks in the Frequency Domain
The manuscript focuses on creating single-target backdoor attacks. We extend the applicability of the proposed frequency-based backdoor attack to the multitarget regime. This is done through introducing an additional step to the recipe:
-
1.
Select the top- frequencies (most sensitive).
-
2.
Randomly and equally divide the selected frequencies among the poisoned classes creating a binary mask for each.
-
3.
Create a set of additive filters for each poisoned class.
-
4.
Poison each class with its corresponding additive filter and binary mask.
-
5.
Proceed with training.
Figure 7 shows the binary masks for the two poisoned classes of ResNet18 trained on CIFAR10; Table 12 shows the results for poisoning the first classes of CIFAR10 for various network architectures.
| ResNet18 | ResNet34 | VGG19 | |||||||
|---|---|---|---|---|---|---|---|---|---|
| Poisoning Rate | CDA(%) | ASR-0 (%) | ASR-1 (%) | CDA(%) | ASR-0 (%) | ASR-1 (%) | CDA(%) | ASR-0 (%) | ASR-1 (%) |
| 0.1% | 93.09 | \cellcolor[HTML]EFEFEF1.76 | \cellcolor[HTML]E4E4E41.27 | 93.32 | \cellcolor[HTML]EFEFEF0.88 | \cellcolor[HTML]E4E4E40.21 | 91.81 | \cellcolor[HTML]EFEFEF1.54 | \cellcolor[HTML]E4E4E41.06 |
| 0.2% | 92.76 | \cellcolor[HTML]EFEFEF32.31 | \cellcolor[HTML]E4E4E428.23 | 93.24 | \cellcolor[HTML]EFEFEF10.32 | \cellcolor[HTML]E4E4E410.82 | 91.97 | \cellcolor[HTML]EFEFEF8.13 | \cellcolor[HTML]E4E4E49.98 |
| 0.4% | 92.89 | \cellcolor[HTML]EFEFEF96.70 | \cellcolor[HTML]E4E4E487.69 | 93.59 | \cellcolor[HTML]EFEFEF86.59 | \cellcolor[HTML]E4E4E472.40 | 91.90 | \cellcolor[HTML]EFEFEF61.53 | \cellcolor[HTML]E4E4E469.21 |
| 1.0% | 93.09 | \cellcolor[HTML]EFEFEF98.90 | \cellcolor[HTML]E4E4E496.60 | 93.59 | \cellcolor[HTML]EFEFEF98.46 | \cellcolor[HTML]E4E4E497.88 | 92.17 | \cellcolor[HTML]EFEFEF92.75 | \cellcolor[HTML]E4E4E494.90 |
| 3.0% | 92.87 | \cellcolor[HTML]EFEFEF99.86 | \cellcolor[HTML]E4E4E499.57 | 93.18 | \cellcolor[HTML]EFEFEF99.78 | \cellcolor[HTML]E4E4E499.79 | 91.93 | \cellcolor[HTML]EFEFEF98.68 | \cellcolor[HTML]E4E4E499.15 |
Appendix F End-to-End Pipeline: A More Efficient Variant
In this section, we present a more efficient variant of the proposed method. The method proposed in the manuscript requires training two models: (1) a clean model () for which the Fourier heatmap is computed for; and (2) a poisoned model () which utilizes the heatmap generated from the clean model to poison the data and hence embed the backdoor.
Our method could be modified so that only one model is trained, the modified version is summarized below:
-
1.
Train a model on clean samples until a reasonable performance is reached. We denote this checkpoint by .
-
2.
Generate the Fourier heatmap for and select the top- most sensitive frequencies to generate the binary mask and the additive filters .
-
3.
Poison the data using equations (4), (5) and (6) presented in the manuscript and proceed with training on both poisoned and clean samples. The obtained model is the poisoned model .
Table 13 shows the results of using the "end-to-end" variant of the proposed frequency-based backdoor attack. The obtained results are fairly similar to those shown in Table 6. Figure 8 shows the Fourier heatmaps of the clean and poisoned models for the proposed variant (ResNet18 trained on CIFAR10). As required, the Fourier heatmap of the poisoned model is similar to that of the clean model.
| ResNet18 | ResNet34 | VGG19 | ||||
|---|---|---|---|---|---|---|
| Poisoning Rate | CDA(%) | ASR(%) | CDA(%) | ASR(%) | CDA(%) | ASR(%) |
| 0.1% | 93.19 | \cellcolor[HTML]EFEFEF3.08 | 93.82 | \cellcolor[HTML]EFEFEF0.88 | 92.24 | \cellcolor[HTML]EFEFEF0.44 |
| 0.2% | 93.46 | \cellcolor[HTML]EFEFEF48.13 | 93.65 | \cellcolor[HTML]EFEFEF3.95 | 91.98 | \cellcolor[HTML]EFEFEF5.49 |
| 0.4% | 93.38 | \cellcolor[HTML]EFEFEF83.51 | 93.43 | \cellcolor[HTML]EFEFEF89.89 | 92.09 | \cellcolor[HTML]EFEFEF28.79 |
| 1.0% | 93.25 | \cellcolor[HTML]EFEFEF96.04 | 93.45 | \cellcolor[HTML]EFEFEF85.05 | 92.45 | \cellcolor[HTML]EFEFEF81.75 |
| 3.0% | 93.31 | \cellcolor[HTML]EFEFEF98.02 | 93.34 | \cellcolor[HTML]EFEFEF99.12 | 92.51 | \cellcolor[HTML]EFEFEF96.26 |
Appendix G Cross Filter Frequency-Based Backdoor Attack
In this section, we show the capability of utilizing binary masks and additive filters generated for one architecture to backdoor attack another. As expected, one can reach a high attack success rate (for a high enough poisoning rate) using such masks and filters (Check Ablation-Section 5.5 in manuscript); however, one has no guarantee over maintaining a Fourier heatmap similar to the clean model.
Table 14 shows the CDA and ASR of a ResNet18 trained on CIFAR10 poisoned using binary masks and additive filters of WideResNet34, ResNet34, and VGG19.
| Filter & Mask Source | WideResNet34 | ResNet34 | VGG19 | |||
|---|---|---|---|---|---|---|
| Poisoning Rate | CDA(%) | ASR(%) | CDA(%) | ASR(%) | CDA(%) | ASR(%) |
| 0.0% | 93.28 | \cellcolor[HTML]EFEFEF5.27 | 93.10 | \cellcolor[HTML]EFEFEF1.98 | 93.00 | \cellcolor[HTML]EFEFEF5.93 |
| 0.1% | 92.93 | \cellcolor[HTML]EFEFEF2.86 | 92.75 | \cellcolor[HTML]EFEFEF35.82 | 92.81 | \cellcolor[HTML]EFEFEF50.77 |
| 0.4% | 93.17 | \cellcolor[HTML]EFEFEF93.63 | 93.14 | \cellcolor[HTML]EFEFEF95.16 | 92.79 | \cellcolor[HTML]EFEFEF95.16 |
| 1.0% | 93.08 | \cellcolor[HTML]EFEFEF99.12 | 93.24 | \cellcolor[HTML]EFEFEF98.46 | 92.80 | \cellcolor[HTML]EFEFEF96.92 |
| 3.0% | 92.74 | \cellcolor[HTML]EFEFEF100.00 | 92.94 | \cellcolor[HTML]EFEFEF99.78 | 92.85 | \cellcolor[HTML]EFEFEF99.34 |
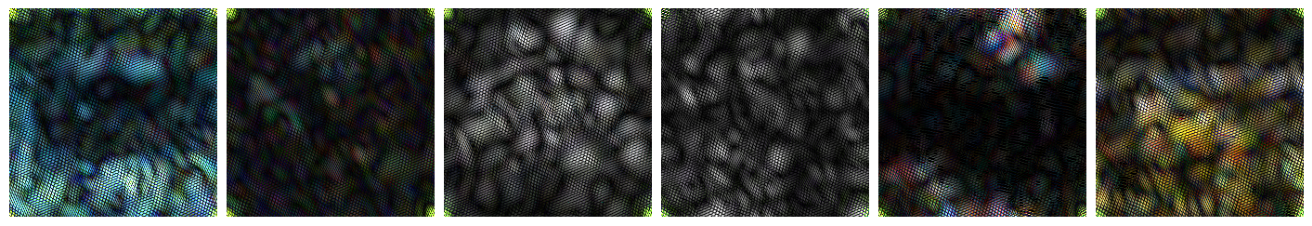
Appendix H Spatial Visualization of the Proposed Frequency-based Backdoor
Attack
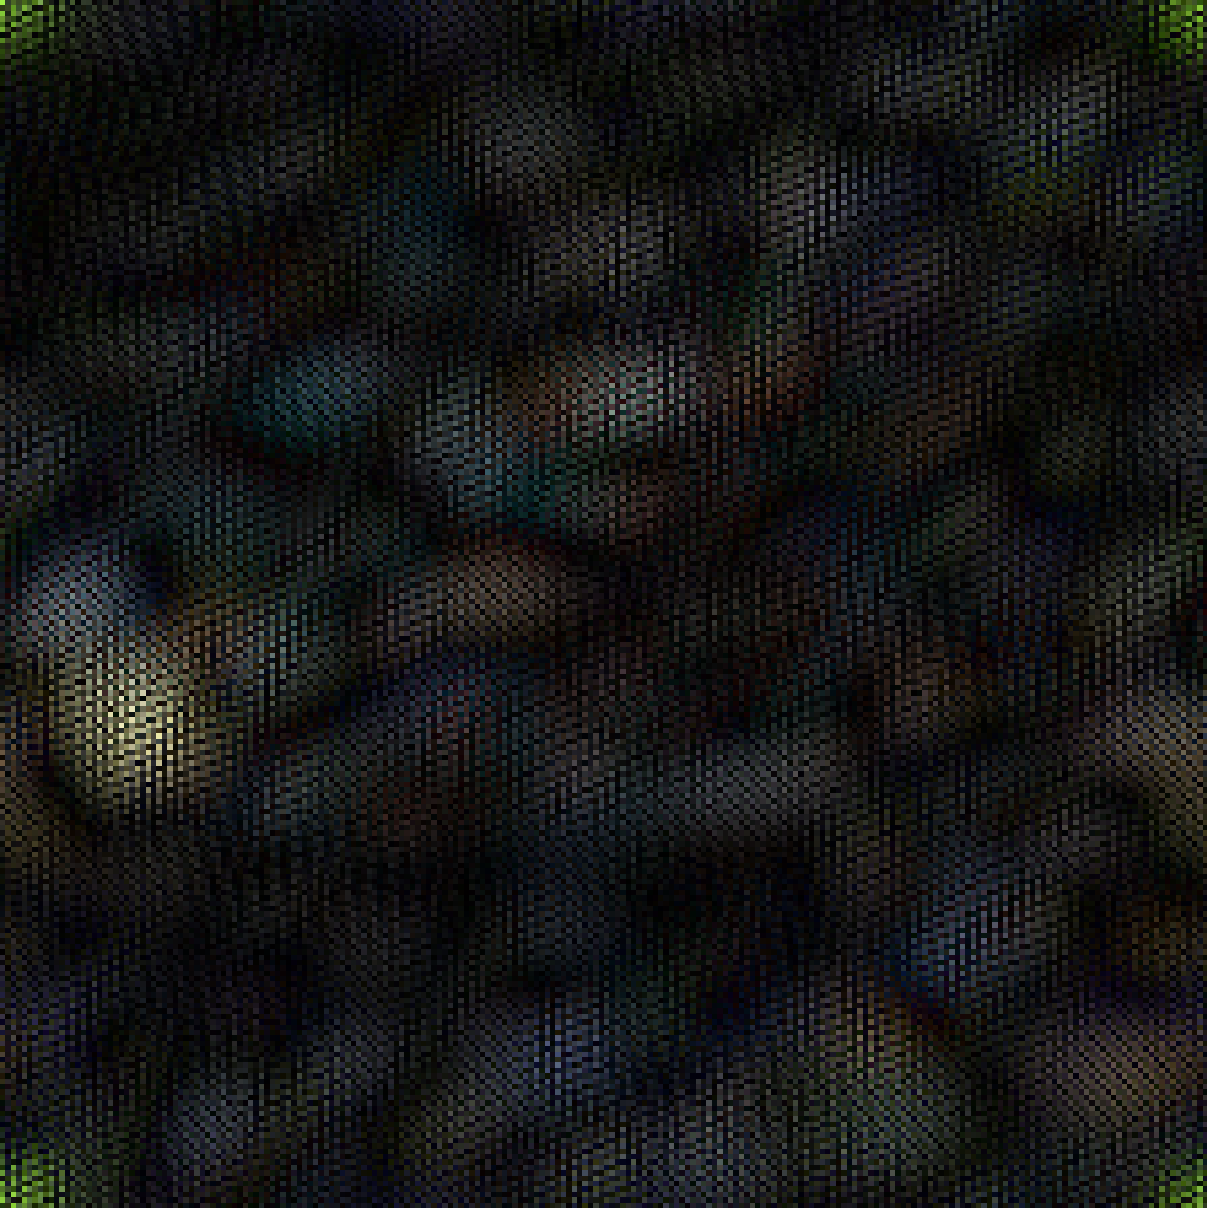
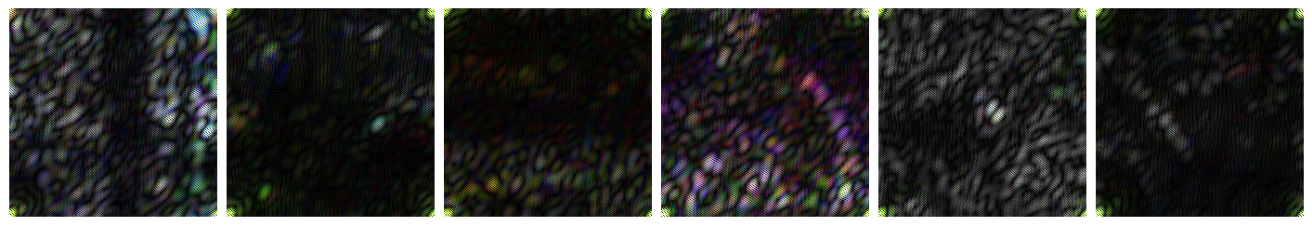
In this section, we visualize the scaled absolute difference () of non-poisoned images () and poisoned images () defined as:
| (4) |
where of a matrix denotes element-wise absolute value operation and is a scalar multiplier in . Figures 9 and 10 visualize two sets of non-poisoned images, their poisoned counterparts, and the absolute scaled difference with for ResNet18 and ResNet34 (recall that our attack is model dependent).
(ResNet18)
(ResNet18)
(ResNet34)
(ResNet34)


(ResNet18)
(ResNet18)
(ResNet34)
(ResNet34)


Appendix I Fourier Heatmaps
††footnotetext: WideResNet34 was not included for ImageNet experiments as there is no official implementation of this model in torchvision.models .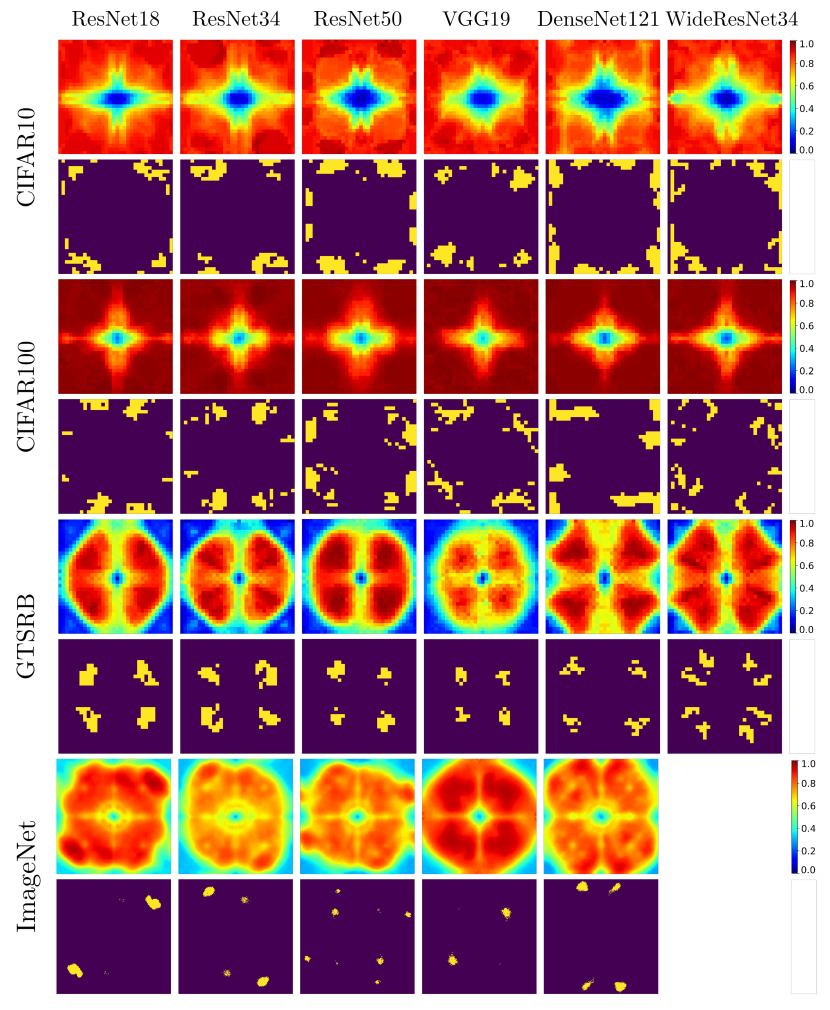
| ResNet18 | ResNet34 | ResNet50 | VGG19 | DenseNet121 | WideResNet34 | |
|---|---|---|---|---|---|---|
| CIFAR10 | 9.77% | 9.77% | 11.72% | 9.77% | 16.61% | 14.65% |
| CIFAR100 | 15.62% | 19.53% | 9.77% | 19.53% | 15.63% | 15.63% |
| GTSRB | 8.79% | 8.79% | 2.92% | 3.90% | 4.88% | 8.80% |
| ImageNet | 1.99% | 1.59% | 0.99% | 0.90% | 1.99% | - |
Appendix J Fourier Heatmap as a Backdoor Detector
As shown in the manuscript, if the choice of poisoned frequencies is not carried out properly, a simple check on the Fourier heatmap of the obtained model could expose the attacker (an abnormal trend is observed in the heatmap). Figures 12(a), 12(b), 12(c) and 12(d) show the Fourier heatmaps of clean ResNet18, top- poisoned ResNet18, BadNet [Gu et al.(2019)Gu, Liu, Dolan-Gavitt, and Garg] poisoned ResNet18, and Blend [Chen et al.(2017)Chen, Liu, Li, Lu, and Song] poisoned ResNet18, respectively. BadNet represents the first backdoor attack in the literature and is based on poisoning data by applying a white patch to the corner of a subset of the training set. Blend on the other hand, was the first to recognize the importance of imperceptibility and suggested blending images with the poison trigger for a more stealthy attack. Figures 12(c) and 12(d) show that both BadNets and Blend tend to highly change the frequency sensitivity of the attacked model compared to the clean one and hence could be detected as poisoned models by inspecting their heatmaps. The proposed frequency-based backdoor attack is more conservative and introduces only mild changes to the clean model heatmap and therefore are less detectable as poisoned.
Similarly, this inspection could be applied for models trained on small image datasets such as CIFAR10. Figures 13(a), 13(b), 13(c), 13(d), 13(e) and 13(f) show the Fourier heatmaps for ResNet18 trained on CIFAR10 with different poisoning strategies. Our proposed method maintains the highest similarity to the clean model’s Fourier heatmap as compared to other methods.
Appendix K Evaluation Against Backdoor Defenses
In this section, we provide a further evaluation of the spatial defenses presented in the manuscript. We also evaluate our method against additional defenses, namely, STRIP [Gao et al.(2019)Gao, Xu, Wang, Chen, Ranasinghe, and Nepal], Activation Clustering [Chen et al.(2019)Chen, Carvalho, Baracaldo, Ludwig, Edwards, Lee, Molloy, and Srivastava] and Spectral Signatures [Tran et al.(2018)Tran, Li, and Madry].
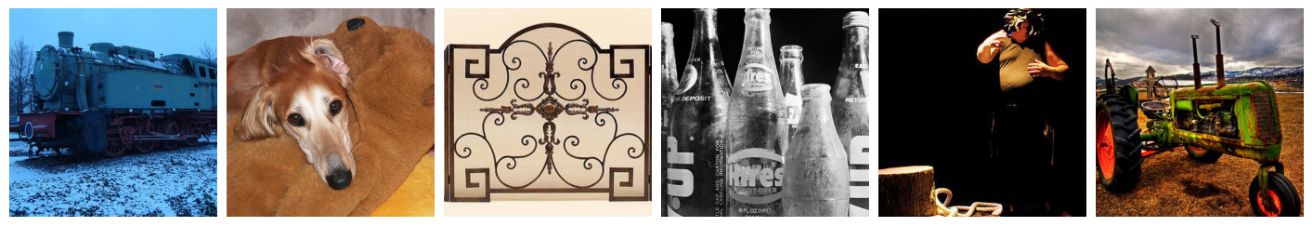
Recall that Grad-CAM uses gradients of a particular class to visualize where the network is looking/focusing at to make its prediction. [Liu et al.(2018a)Liu, Dolan-Gavitt, and Garg] prunes the least active neurons (on clean samples) and then fine-tunes the network on clean samples. STRong Intentional Pertubation (STRIP) [Gao et al.(2019)Gao, Xu, Wang, Chen, Ranasinghe, and Nepal] intentionally perturbs the input through blending it with clean samples. The authors rely on the realization that blending a poisoned sample with a clean sample would still activate the backdoor attack and therefore studying the entropy of the prediction vectors could be used for backdoor detection. Activation Clustering (AC) [Chen et al.(2019)Chen, Carvalho, Baracaldo, Ludwig, Edwards, Lee, Molloy, and Srivastava] analyzes the neural network’s representation layer activation to determine whether the data has been poisoned. Since a poisoned model assigns poisoned and clean data to the target class based on a different feature representation, one can cluster the representations of the poisoned class into two distinct clusters. Similar to AC, Spectral Signatures (SS) [Tran et al.(2018)Tran, Li, and Madry] operates on feature representations to detect backdoor attacks. SS detects the poisoned samples using robust statistics and SVD methods.
Figures 14 and 15 show a set of images visualizing the original image, the Grad-CAM for a clean network evaluated on the clean sample, and the Grad-CAM for a poisoned network evaluated on the poisoned sample (left to right) for GTSRB and ImageNet respectively (the network architecture is ResNet18). As shown in the manuscript, the network focus regions are relatively unchanged when the frequency-based poison is applied.
Figure 16 shows the result of pruning a ResNet34 trained on ImageNet. Again, as observed in the manuscript (for CIFAR10), the attack success rate of the frequency-based backdoor is maintained for large pruning rates that highly drop the clean data accuracy.
Figure 17 shows the results of applying STRIP defense to a poisoned VGG19 model trained on CIFAR10 and GTSRB with various poisoning rates. Our method causes no significant distributional shift in the prediction vector’s entropy therefore is not detectable by STRIP.
Figures 18, 19, and 20 show the results of Activation Clustering defense method applied to various models with different poisoning rates, namely, ResNet18 (1.0% poisoning rate), ResNet34 (0.4% poisoning rate), and ResNet50 (0.4% poisoning rate) respectively. Visually, AC fails to find two distinct and separable clusters and therefore fails to detect the backdoor attack. Numerically, in terms of silhouette scores, Tables 16, 17, and 18 show that no score is significantly higher than the other scores for the three considered models.
Figures 21, 22, and 23 show the results for Spectral Signatures defense method applied to various models with different poisoning rates, namely, DenseNet121 (0.4% poisoning rate), ResNet34 (0.4% poisoning rate) and ResNet50 (0.4% poisoning rate) respectively. Visually, the method fails to find spectrally separable clusters and therefore the backdoor is not detected. Numerically, the true positive rates (6%, 45%, and 33%) are lower than the threshold (90%) [Tran et al.(2018)Tran, Li, and Madry] required for the defense to be deemed successful.


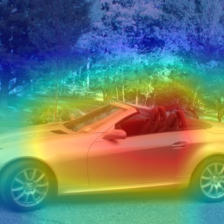
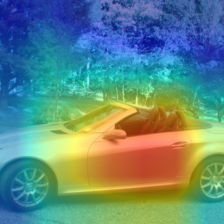
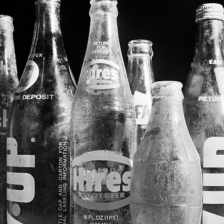
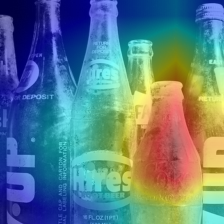
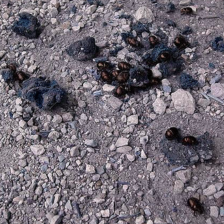
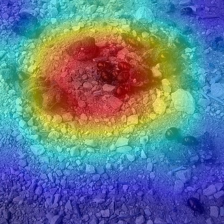
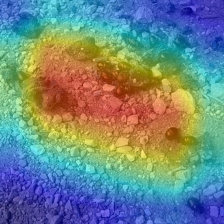
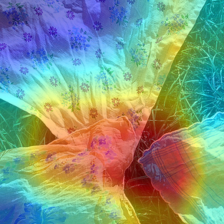
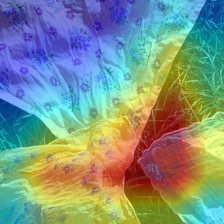
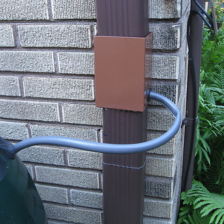
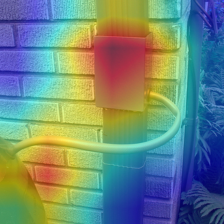
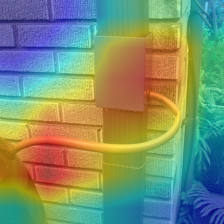
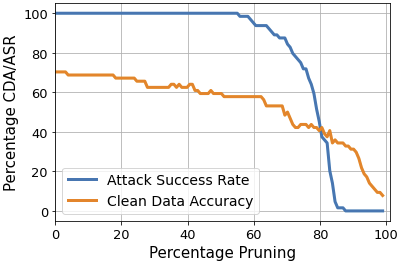
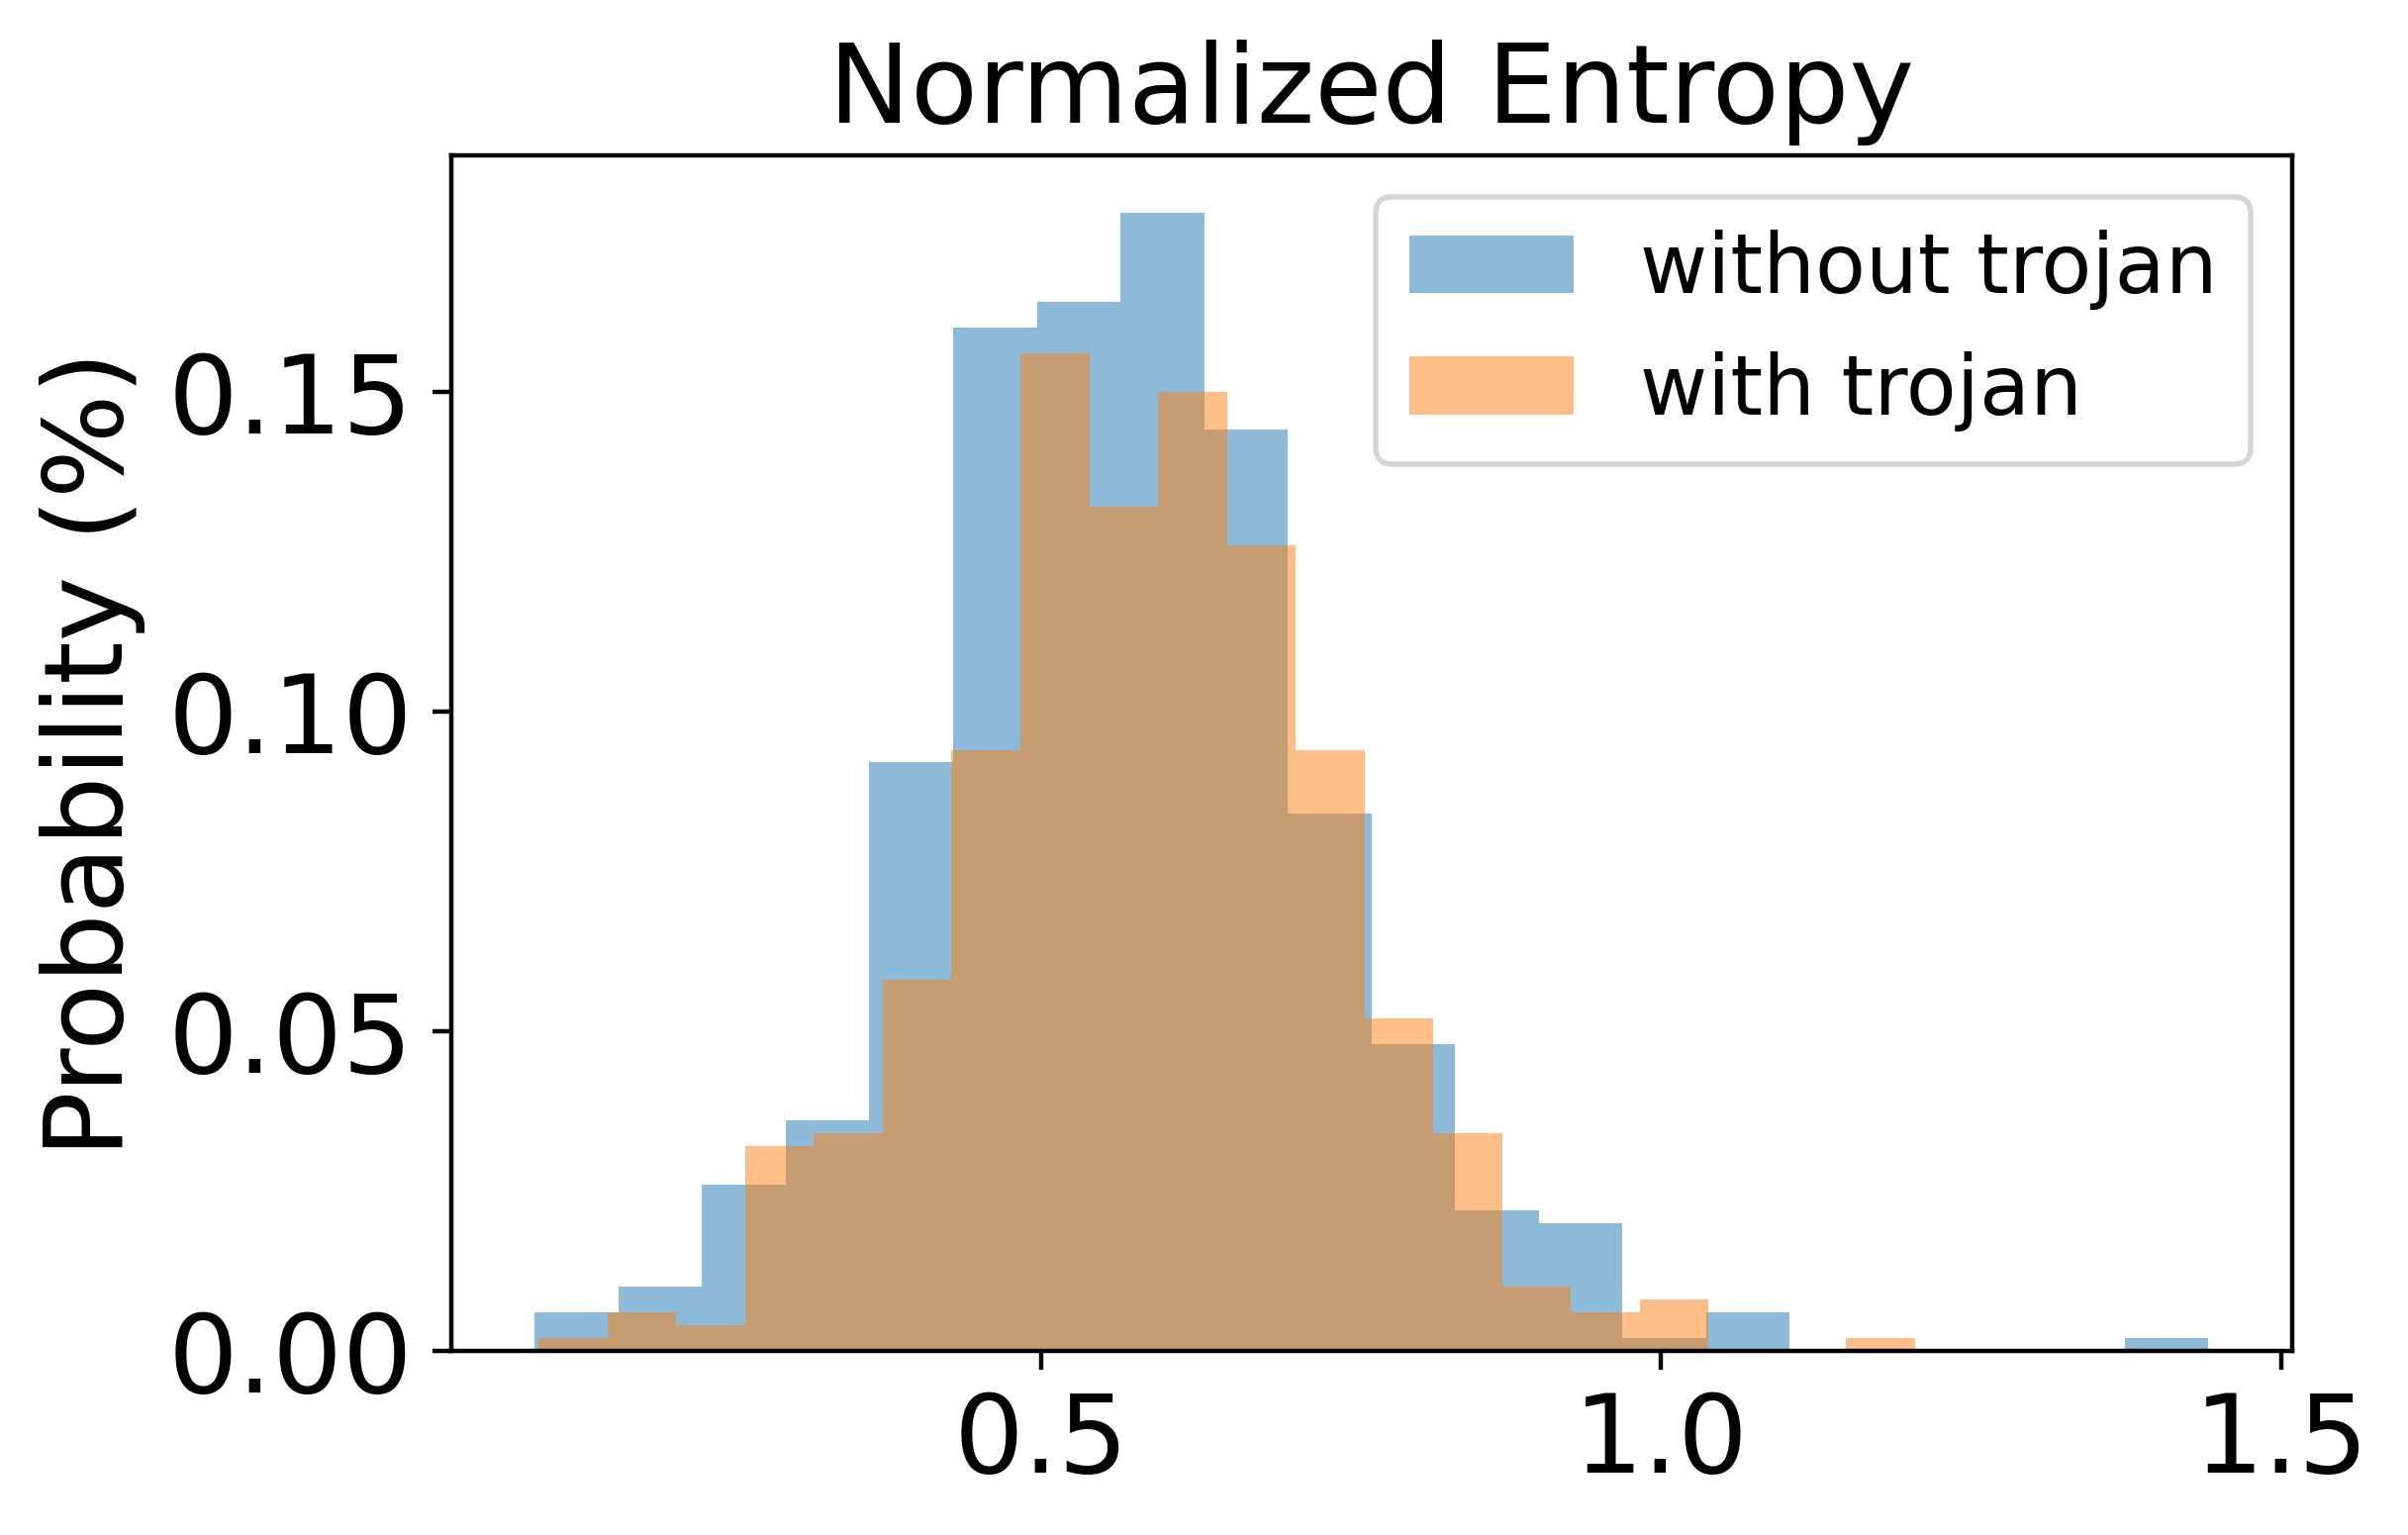
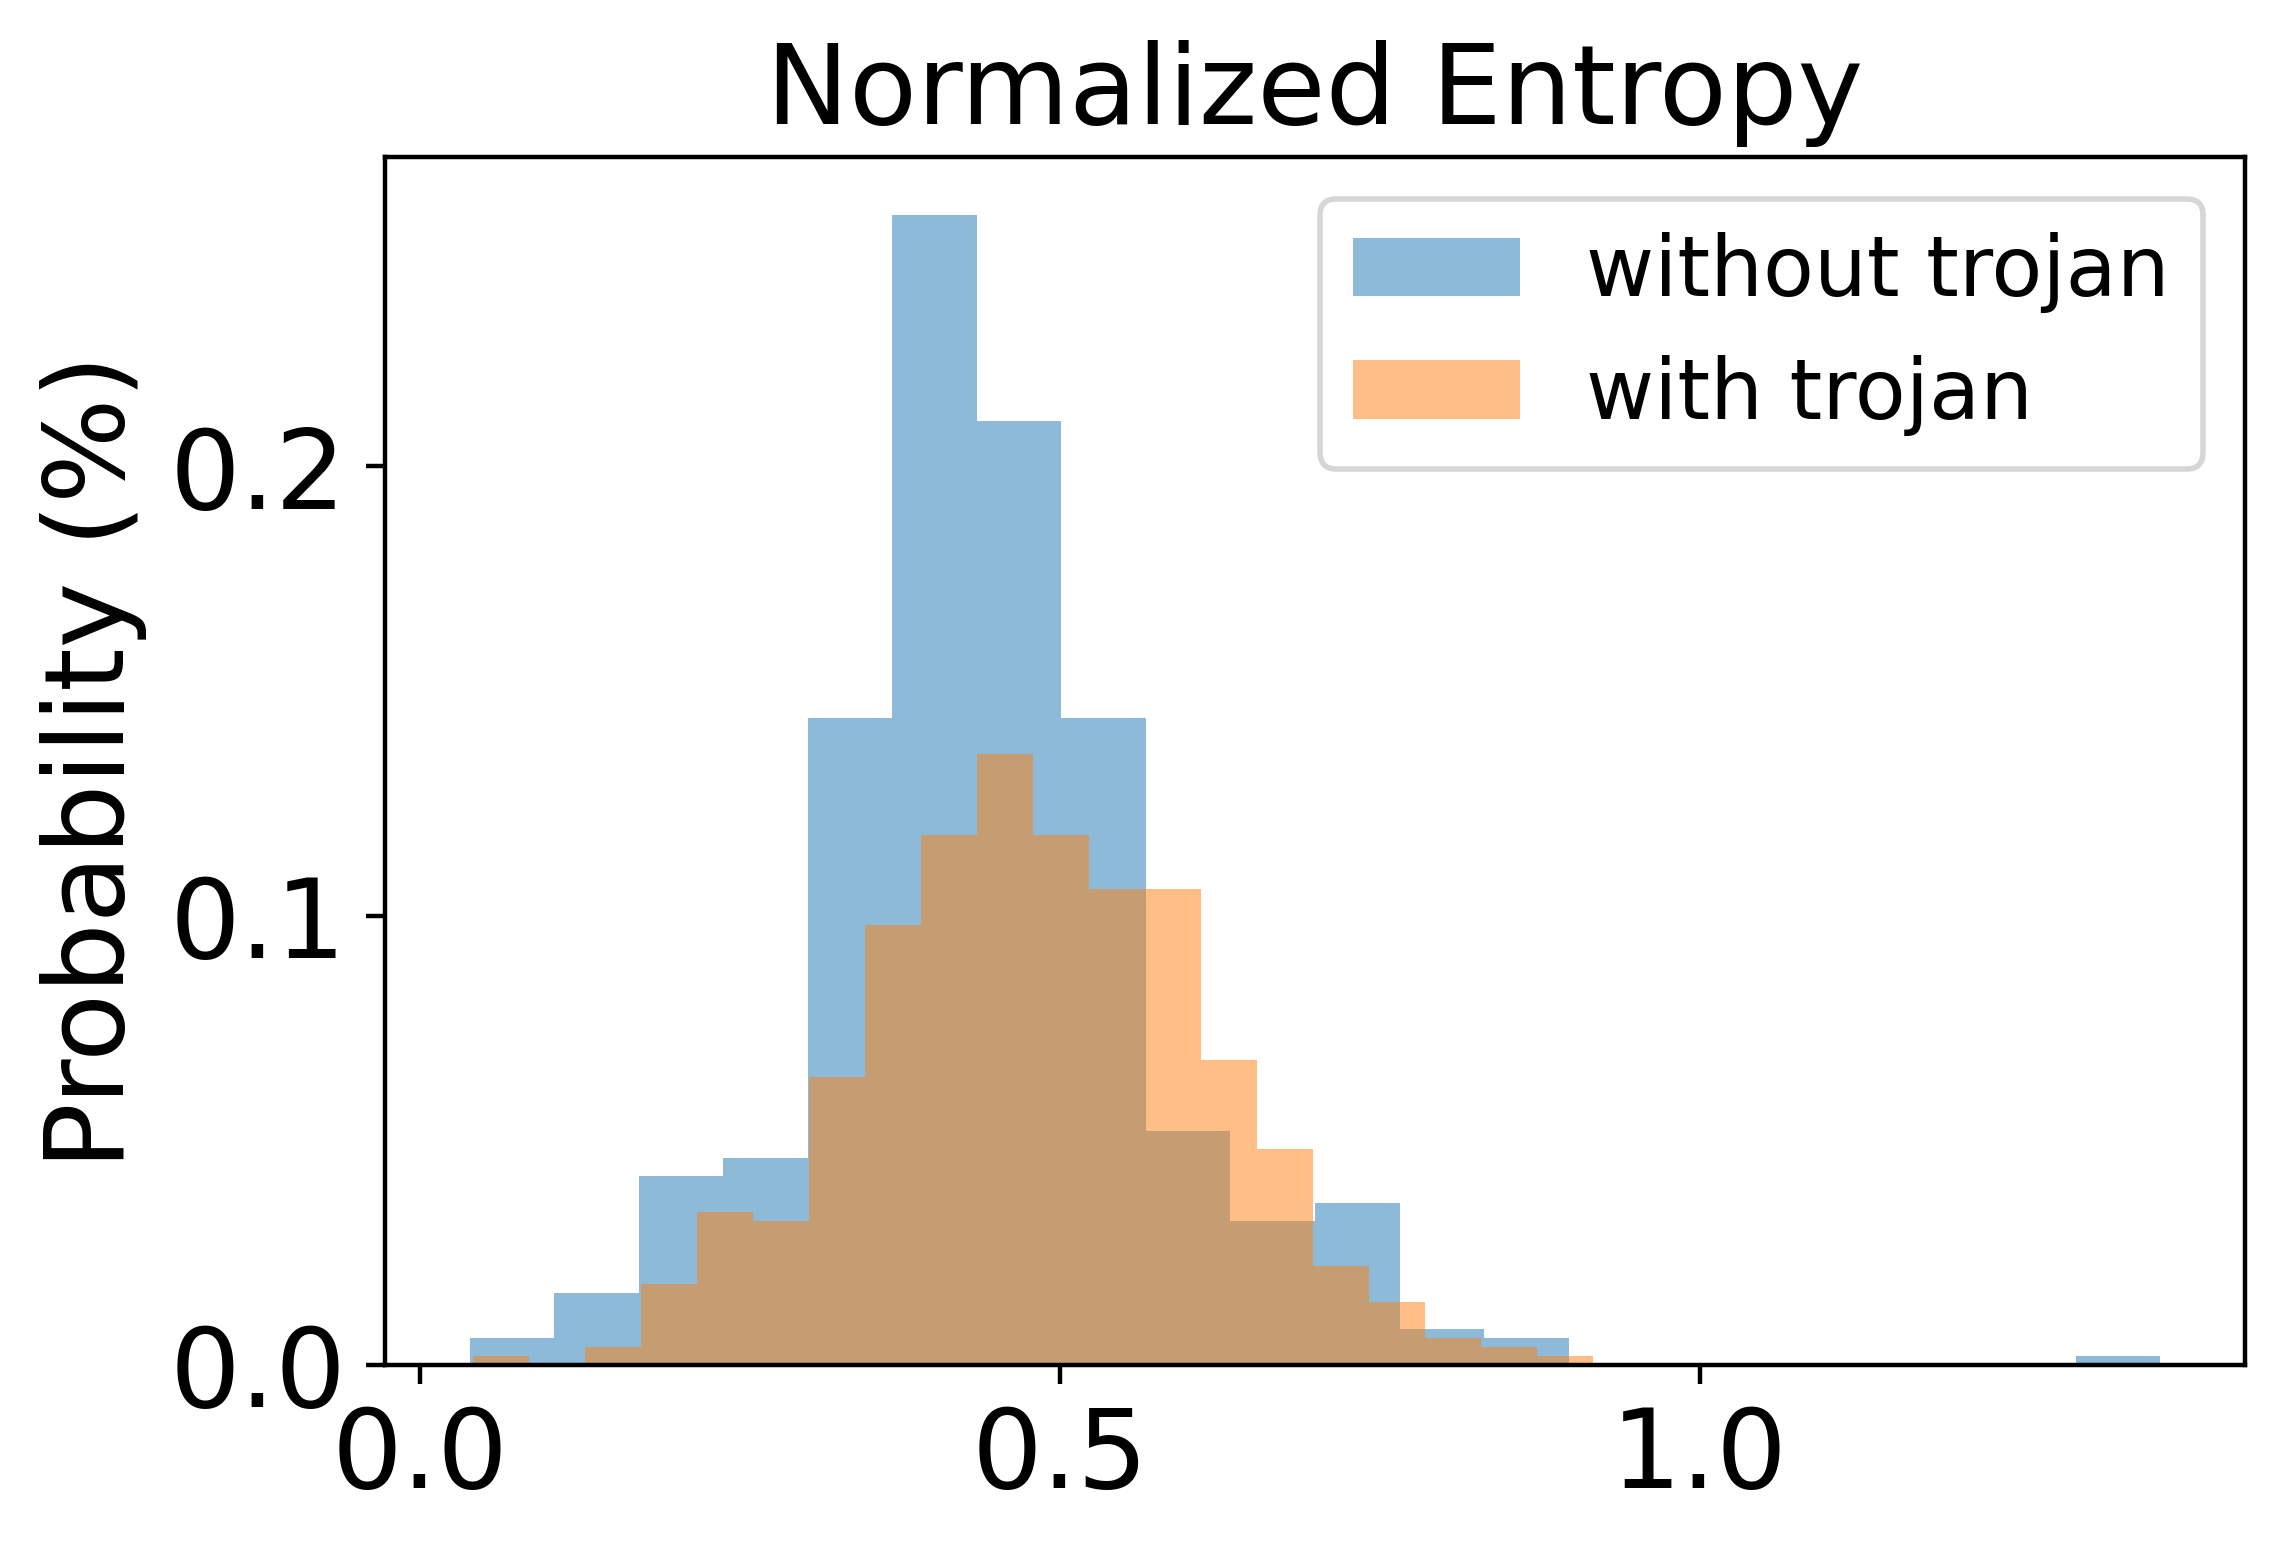
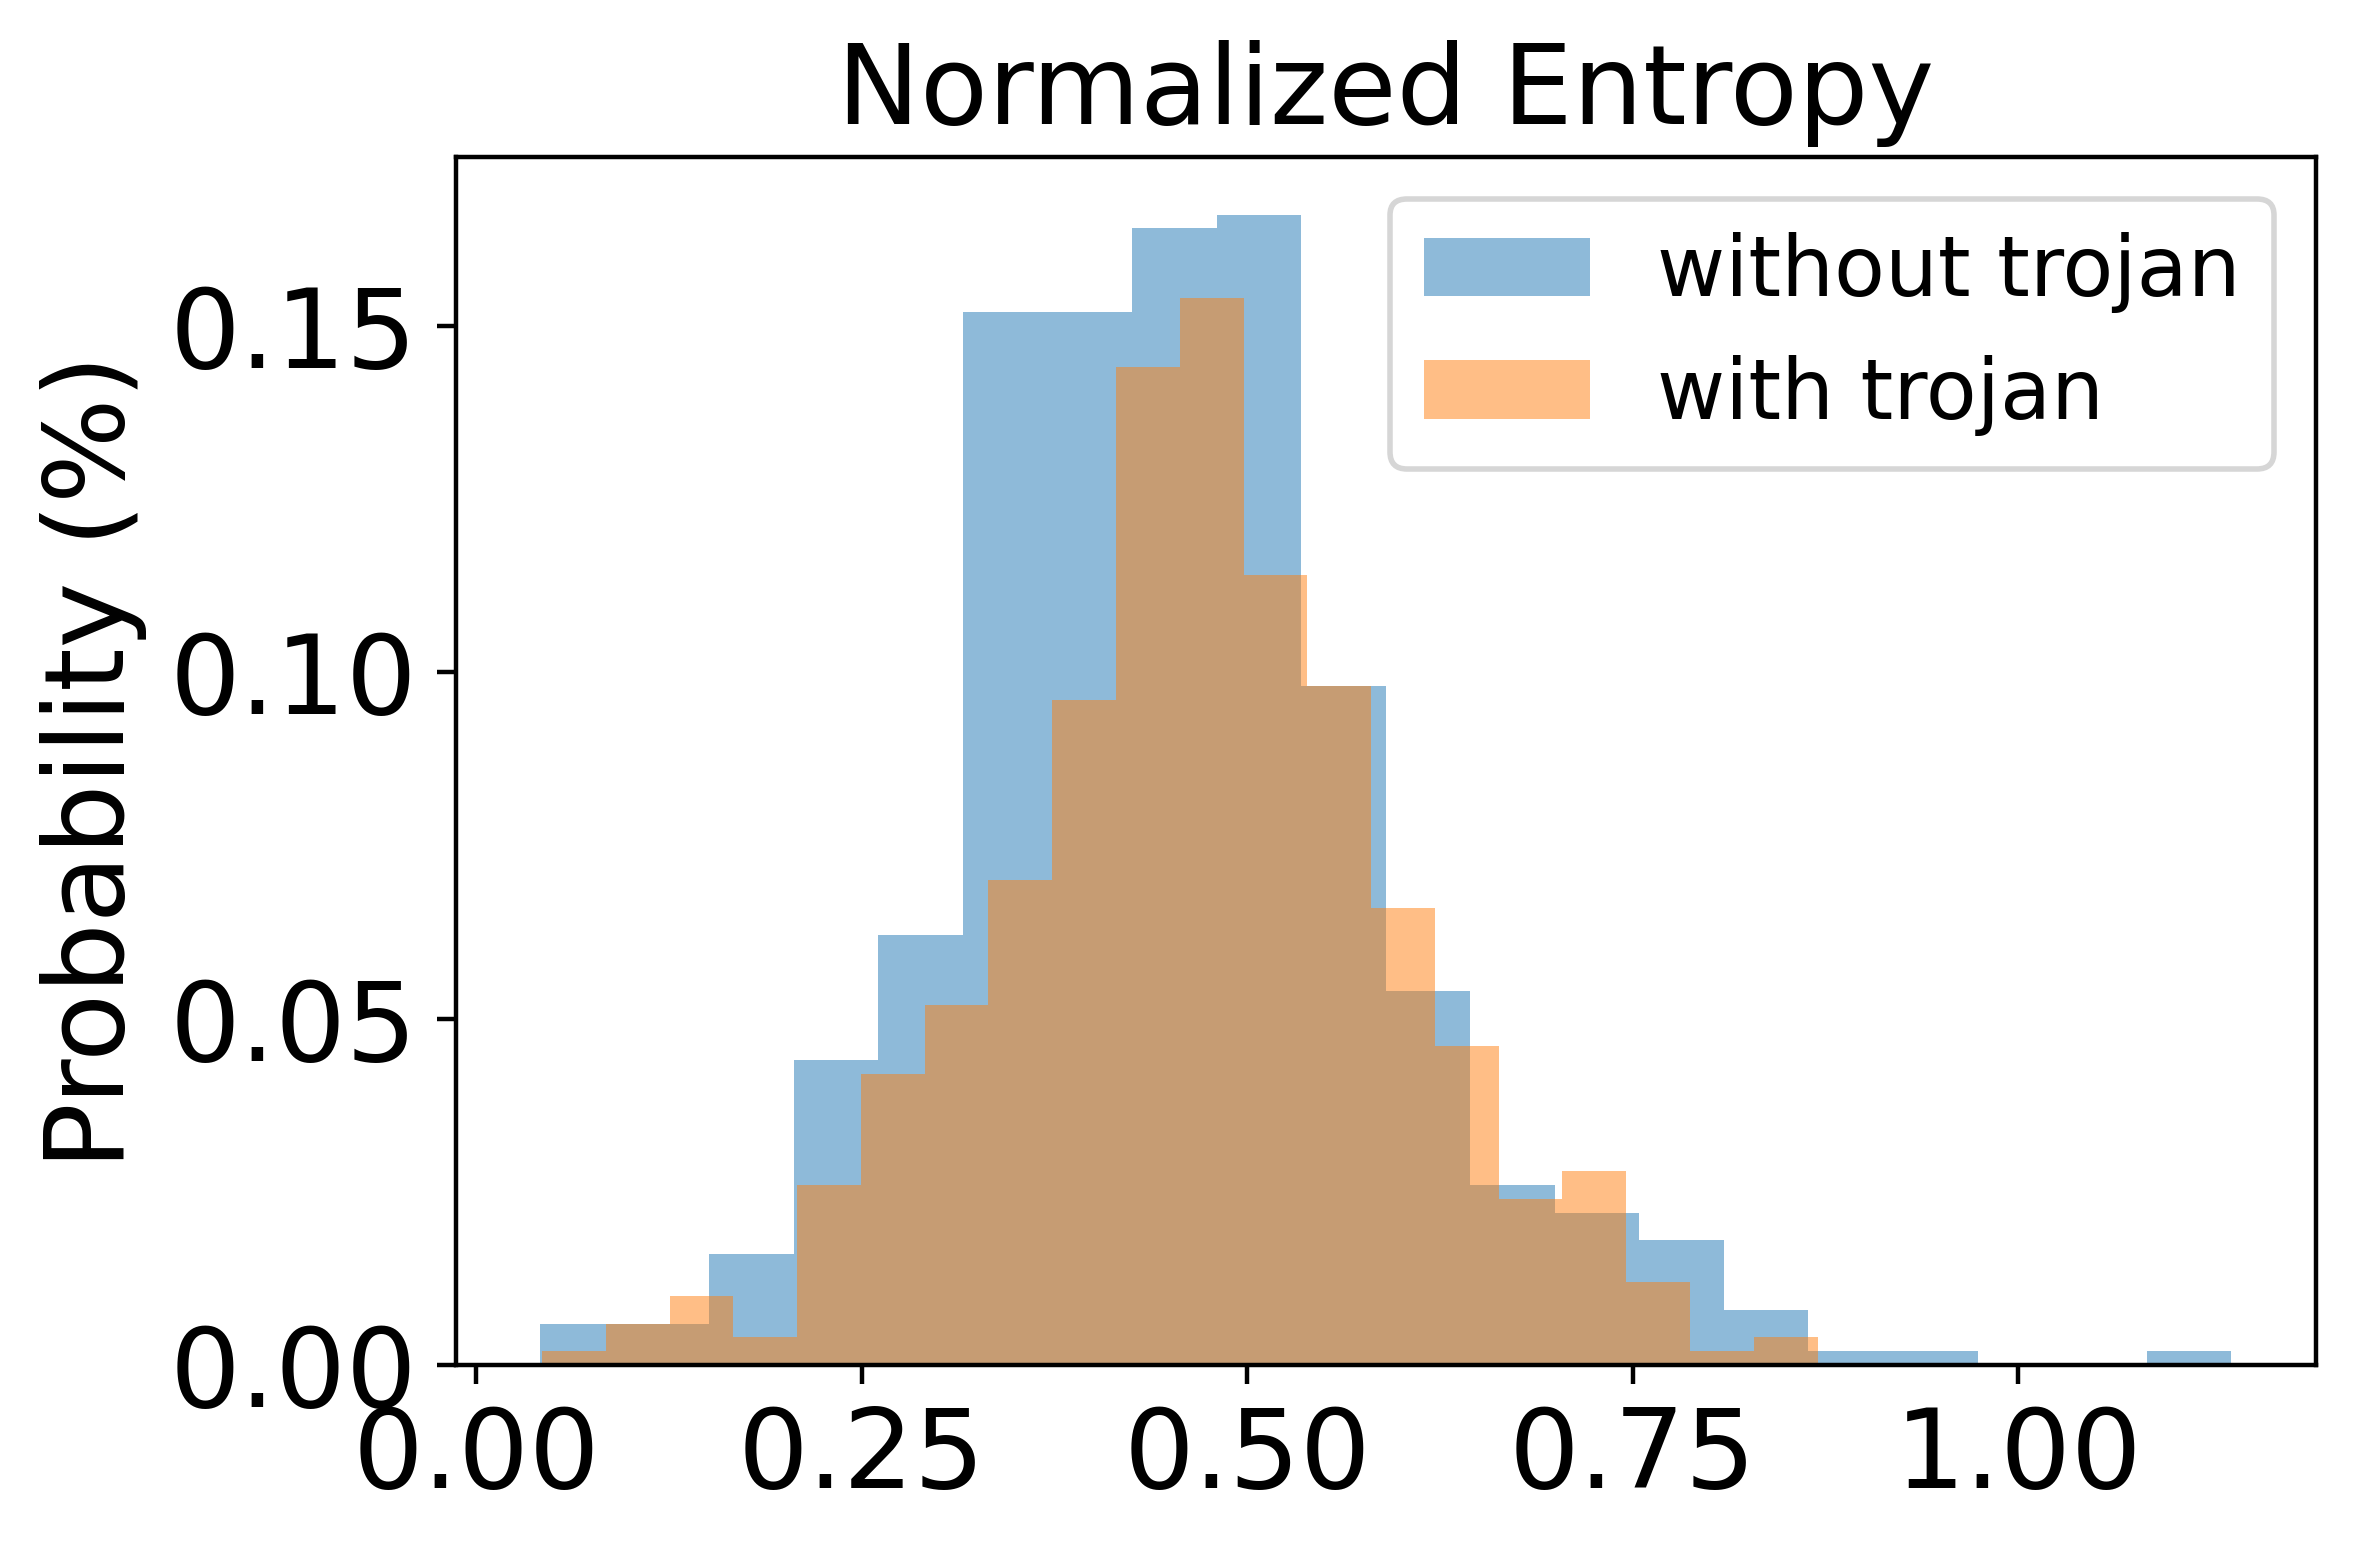
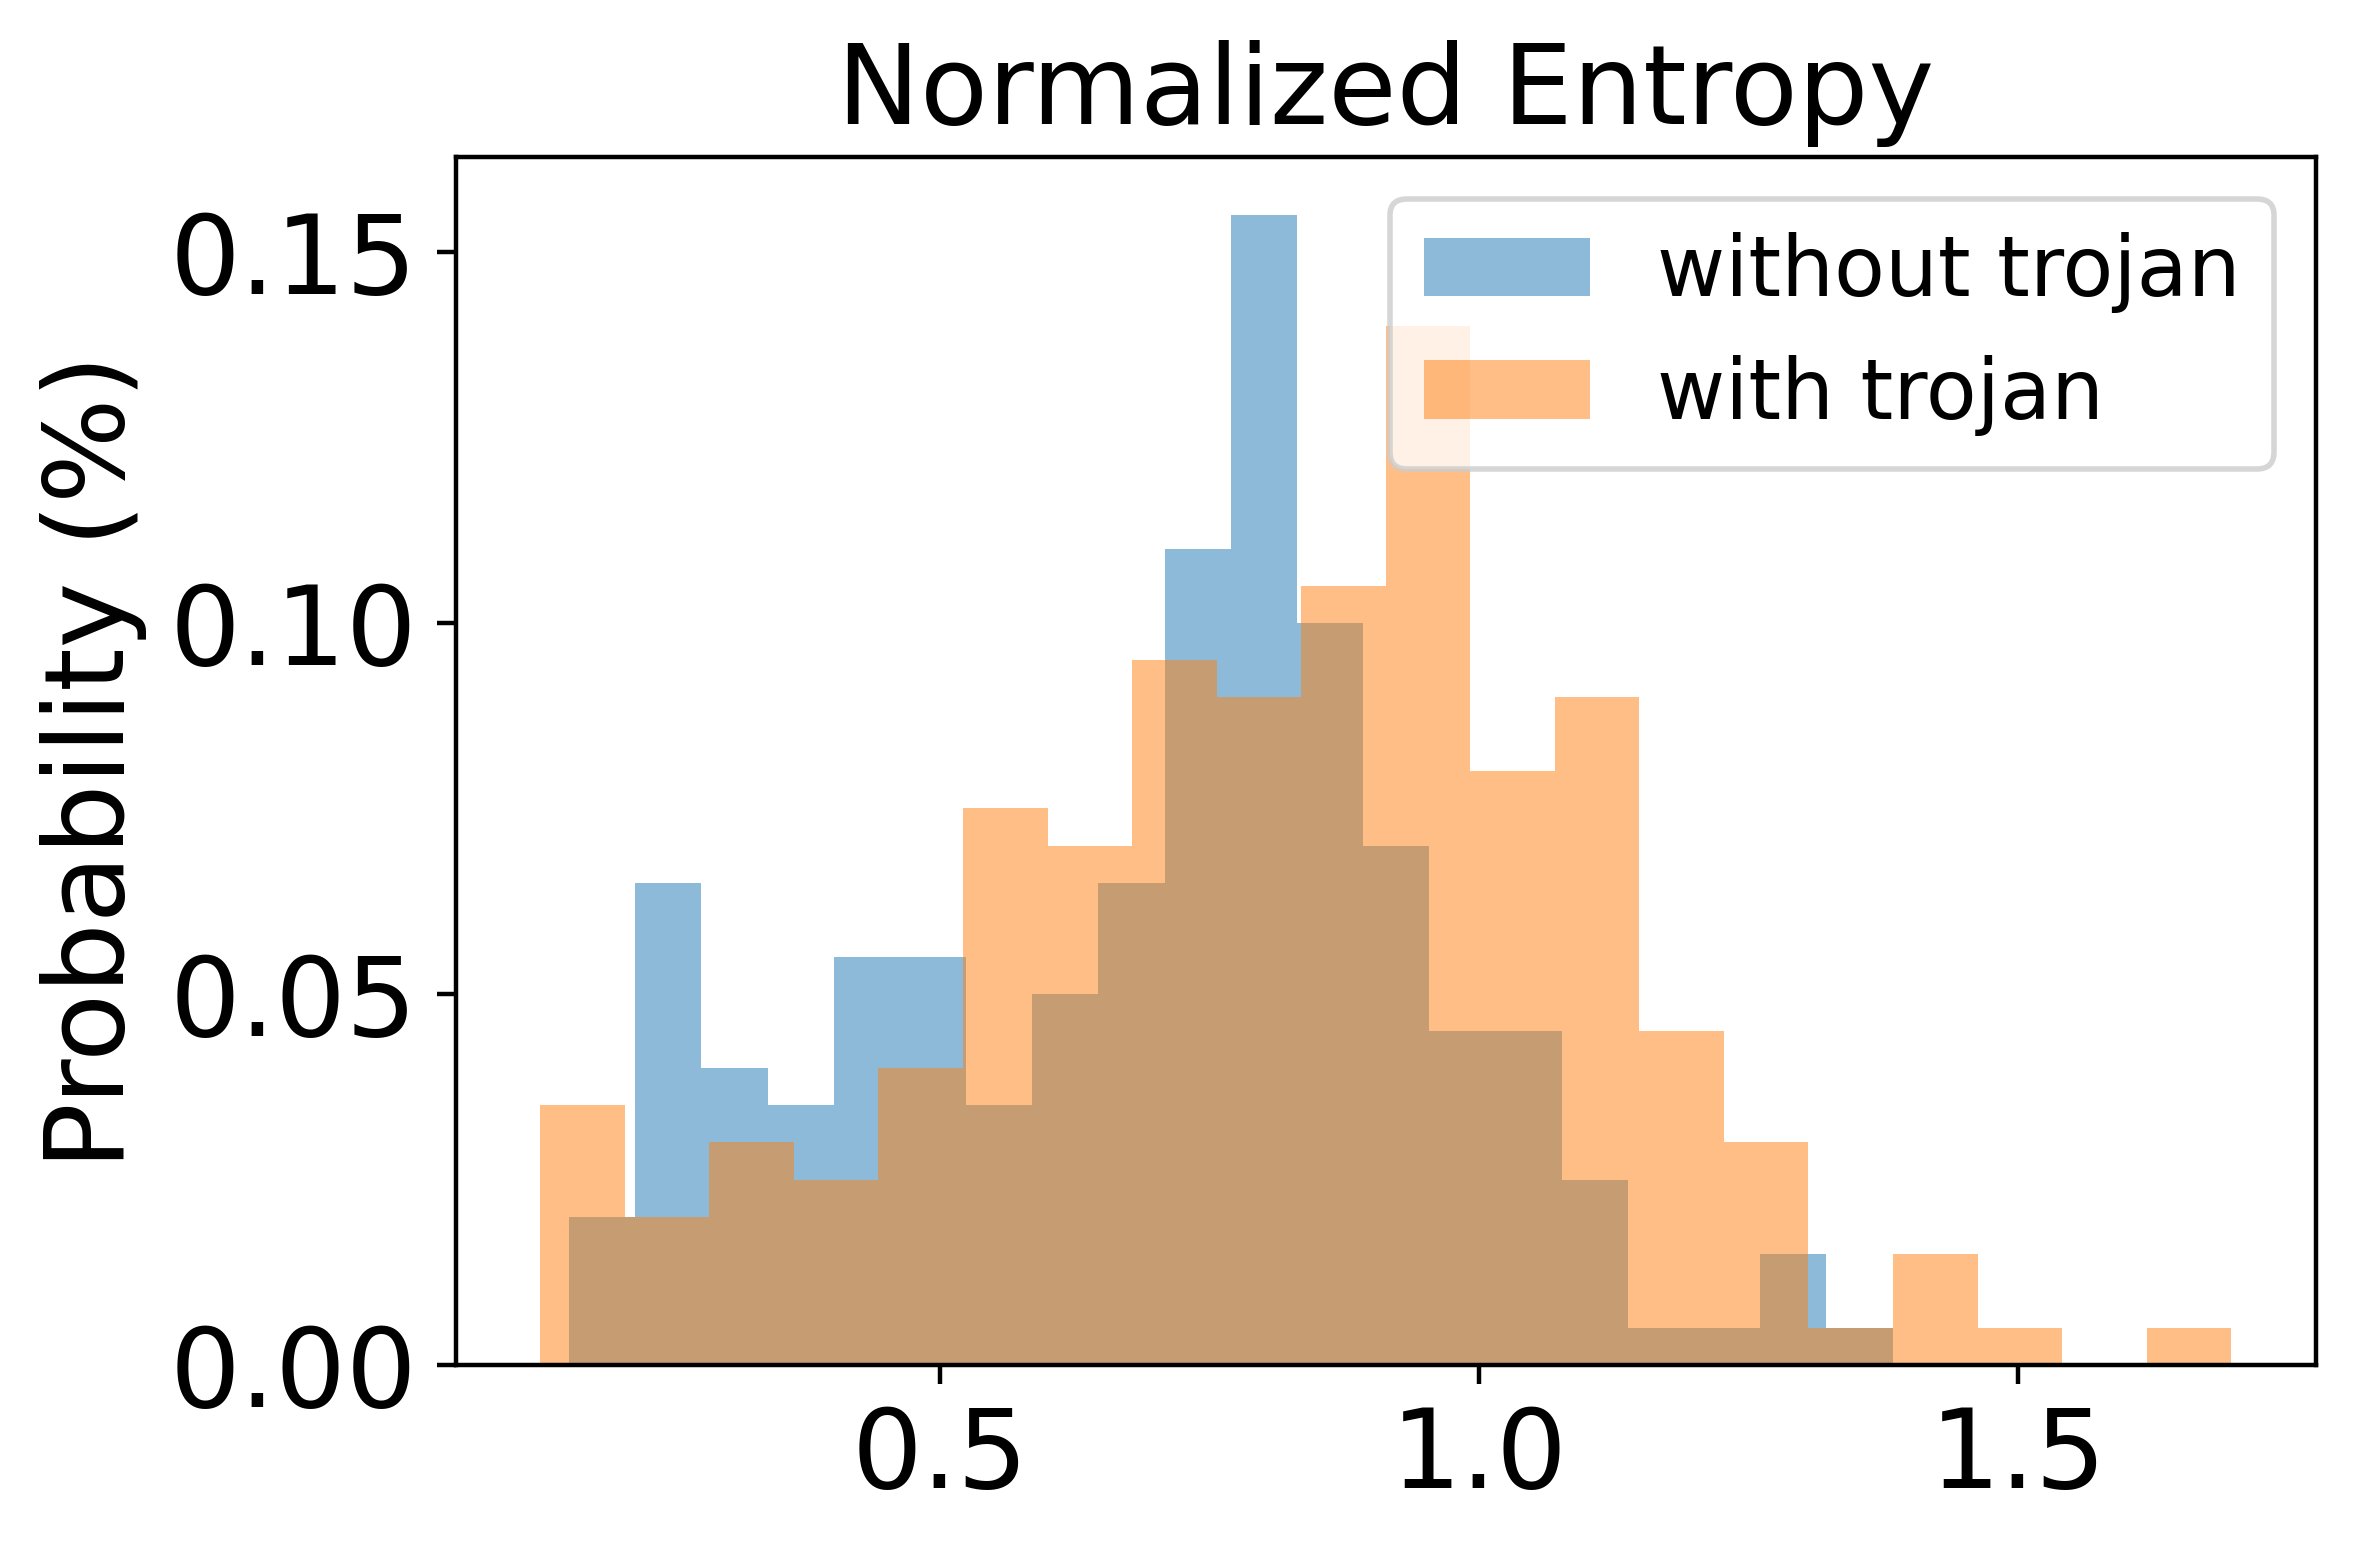
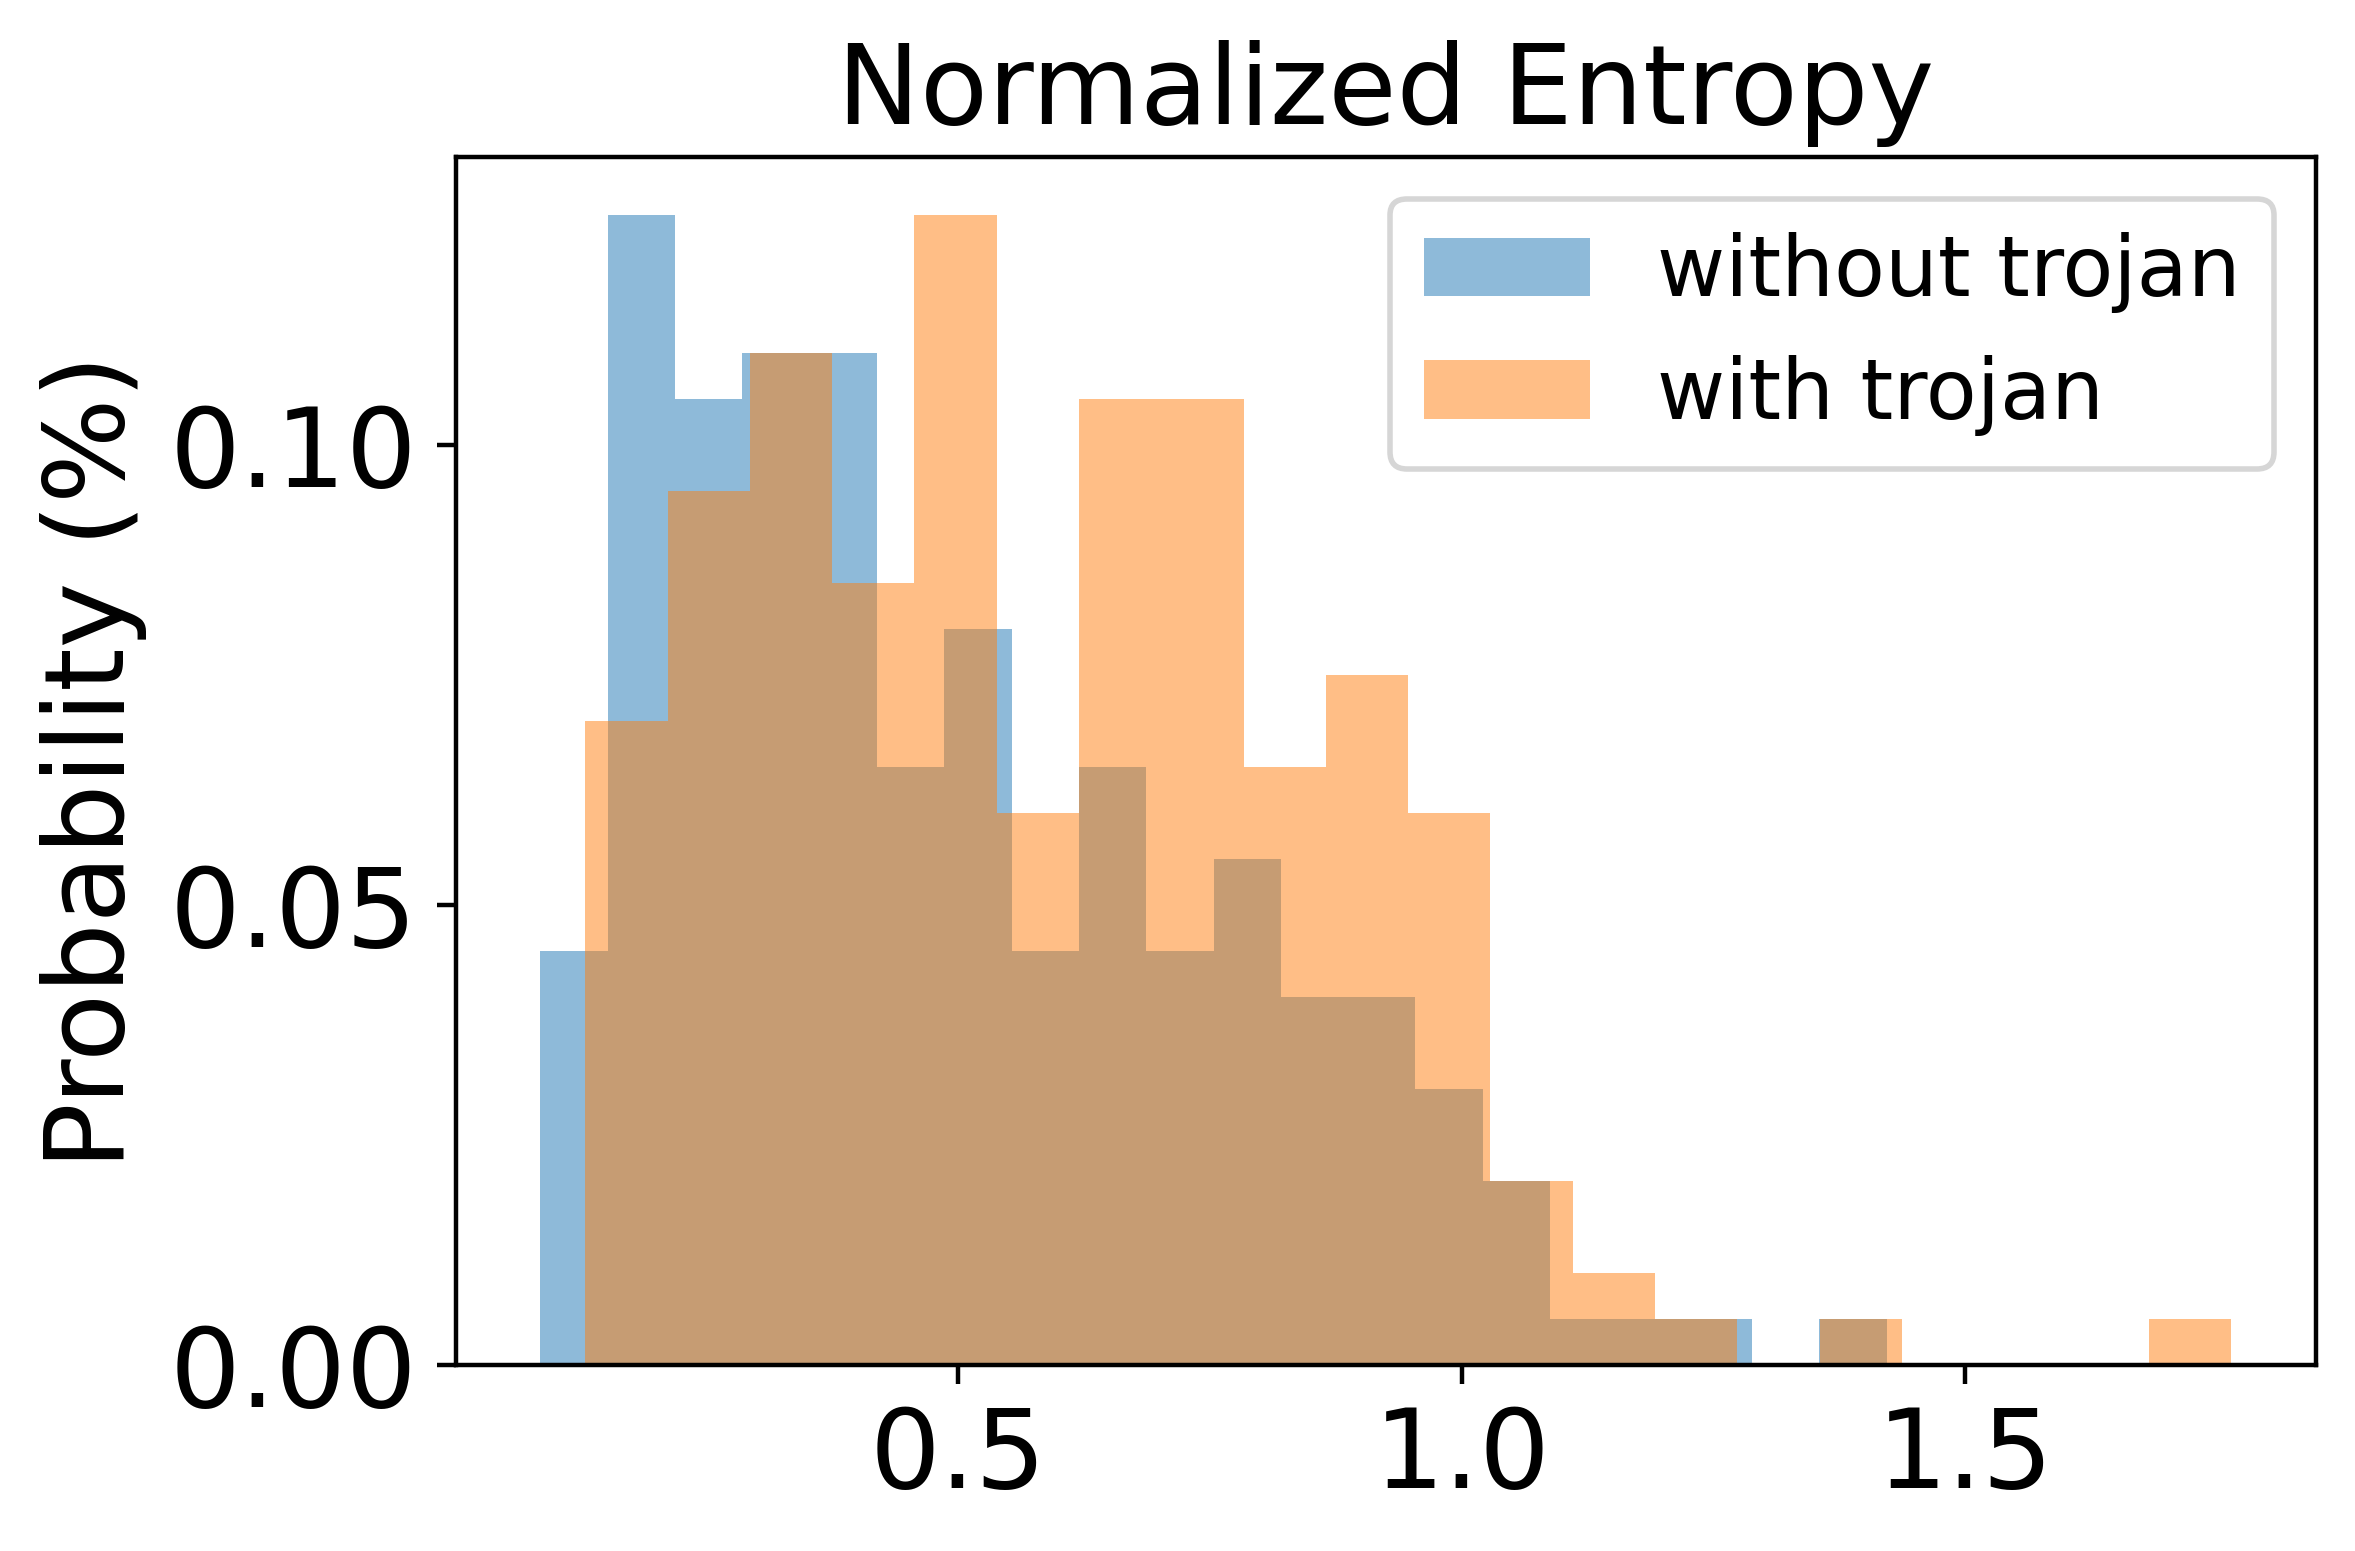
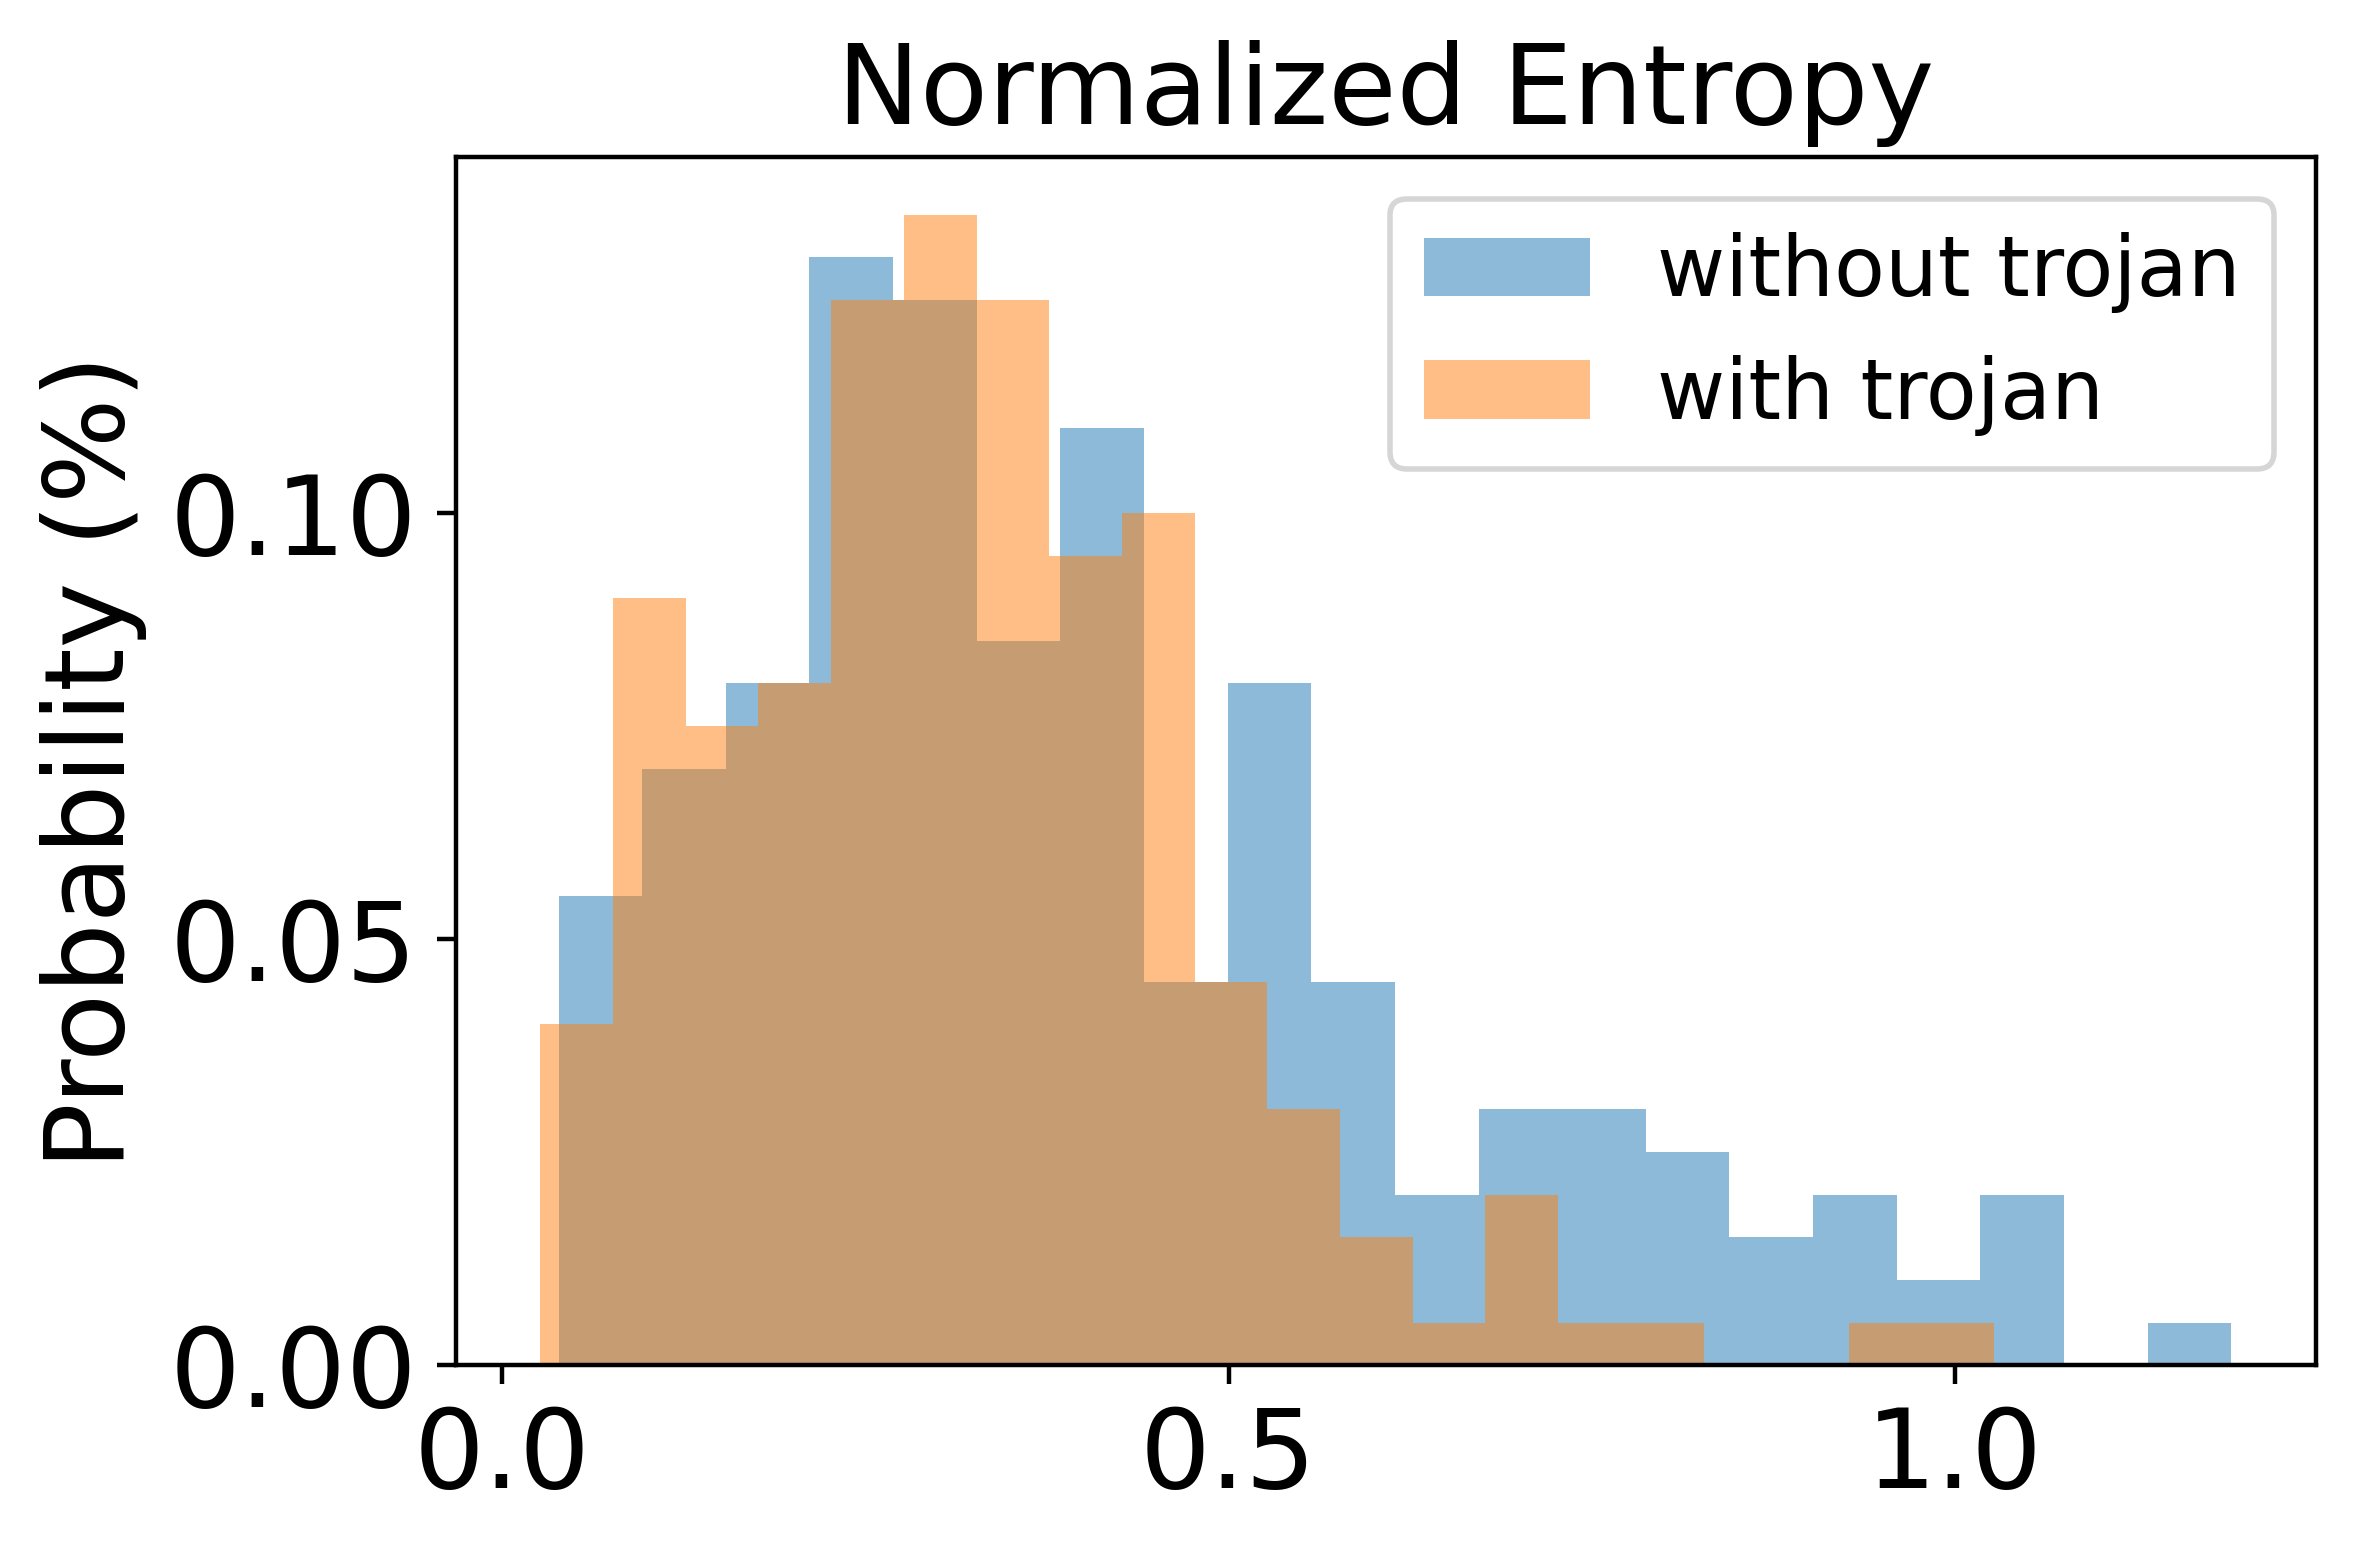
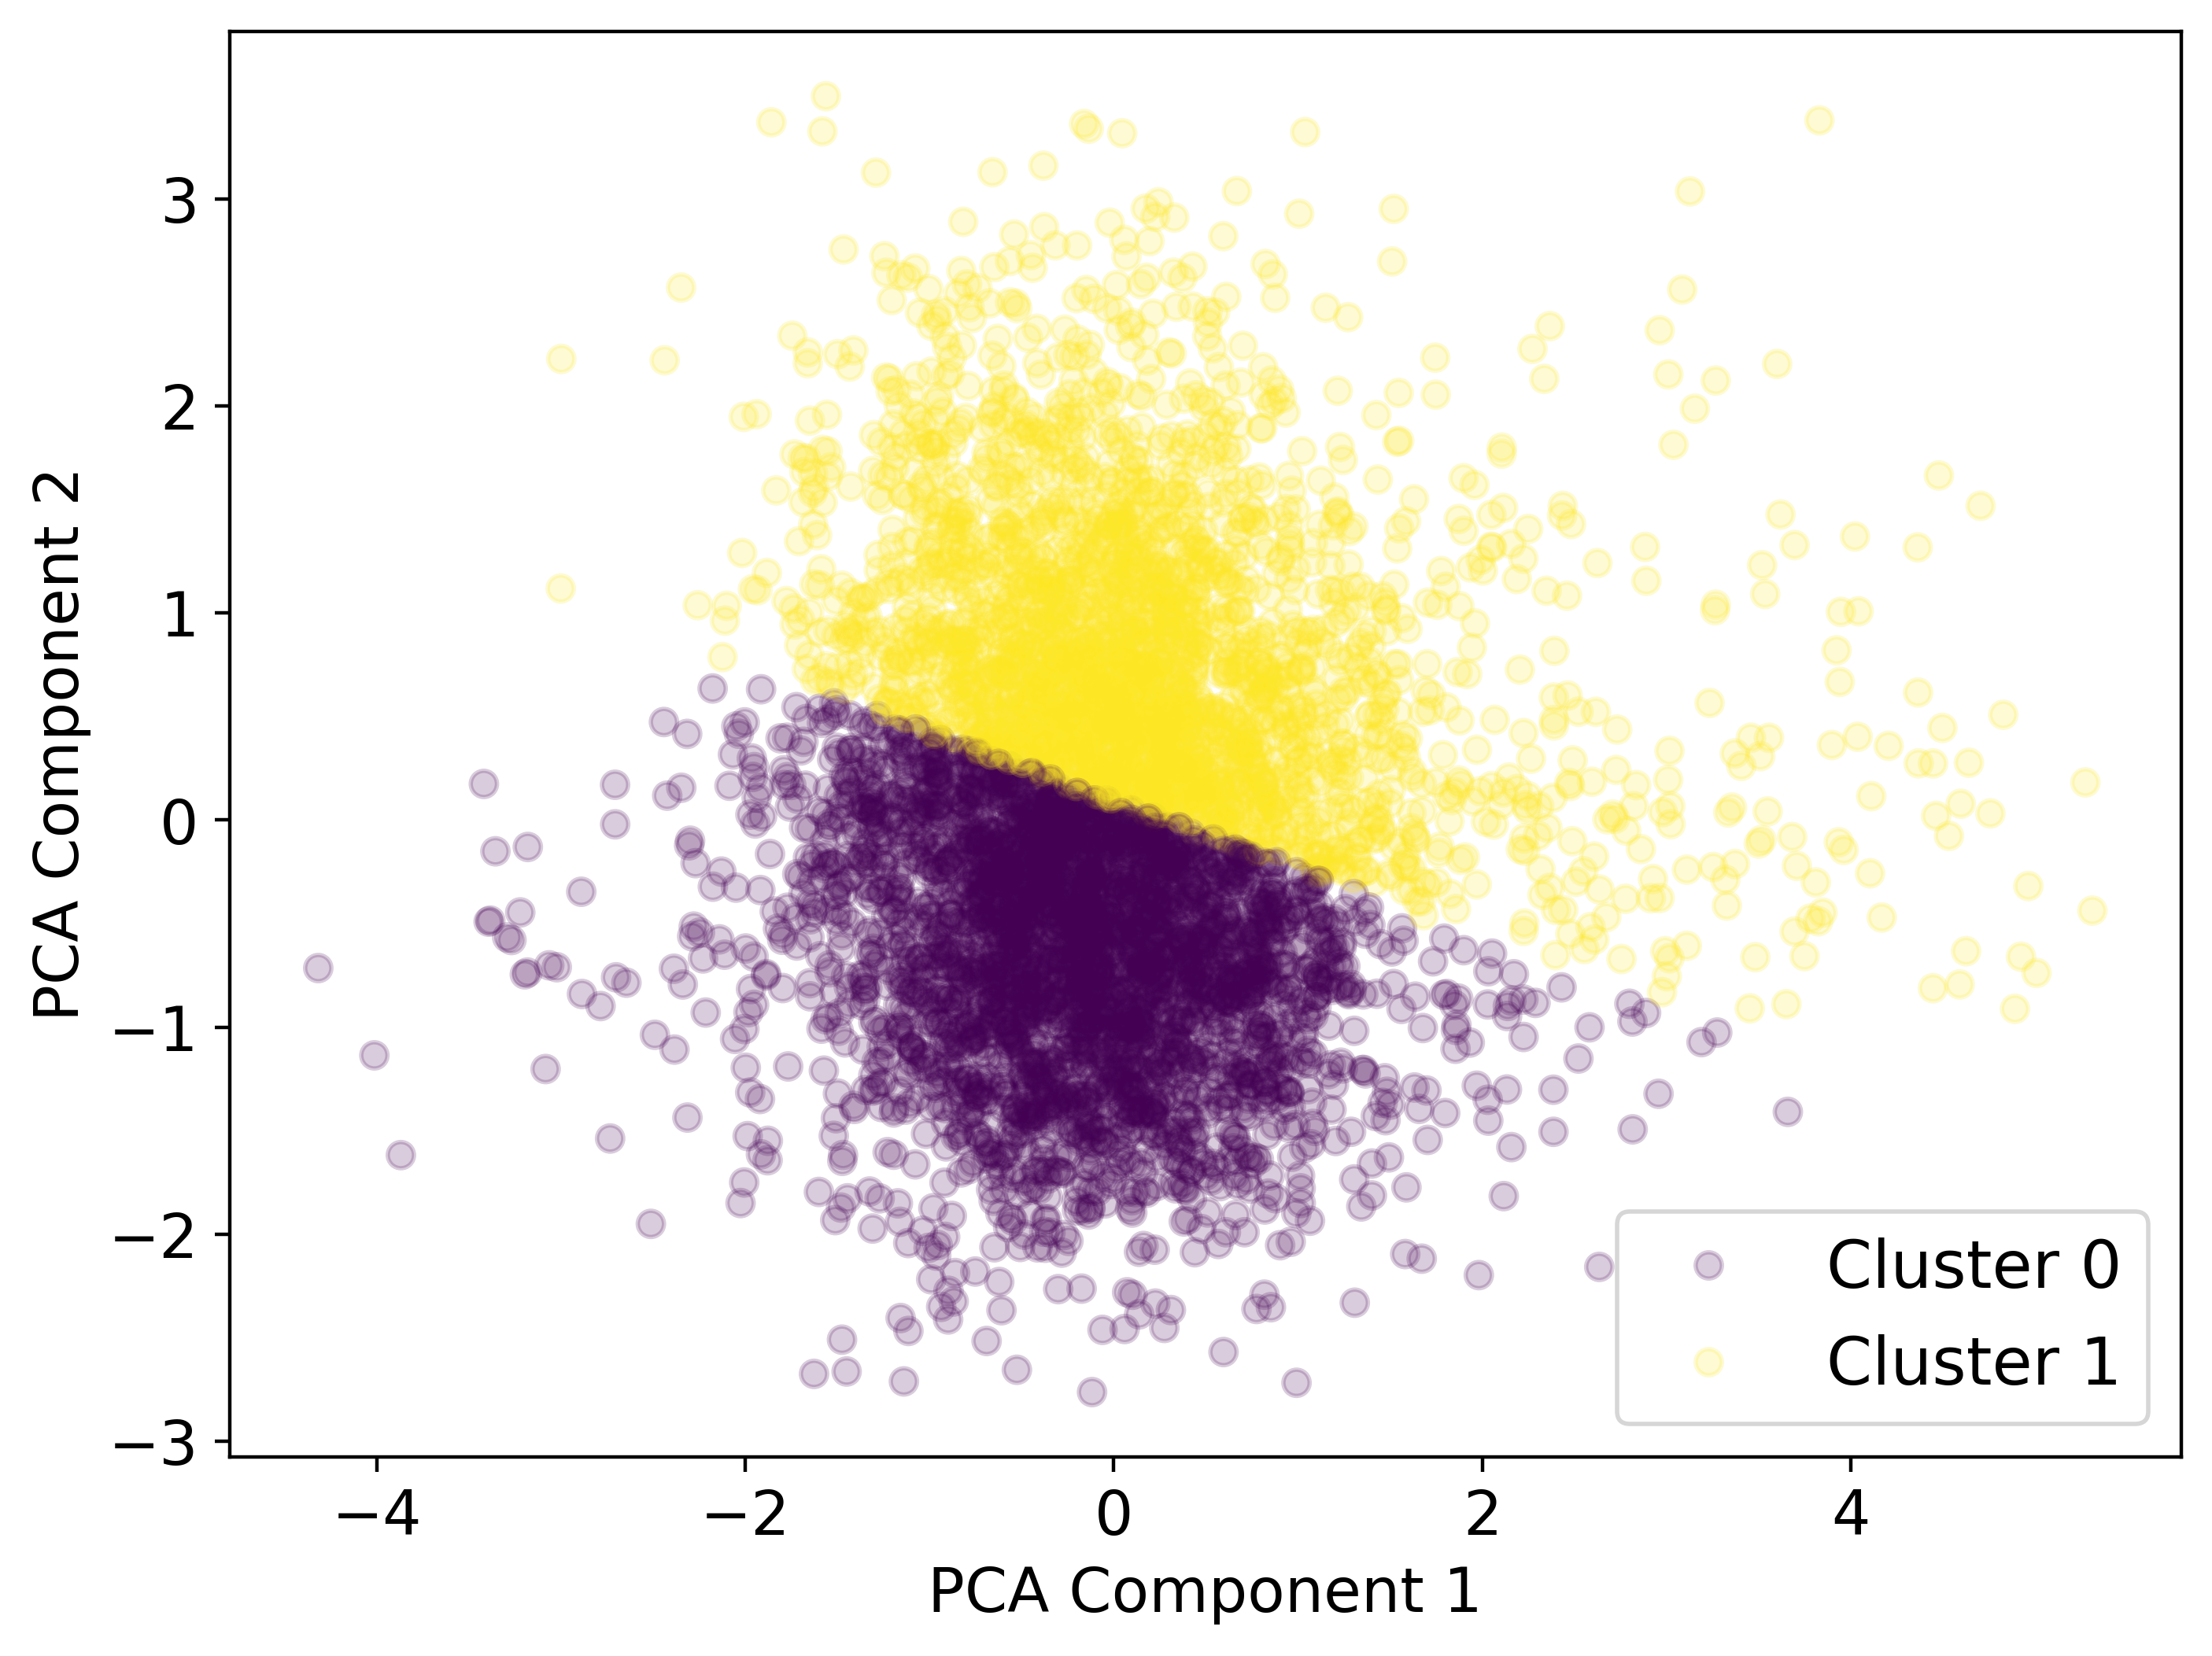
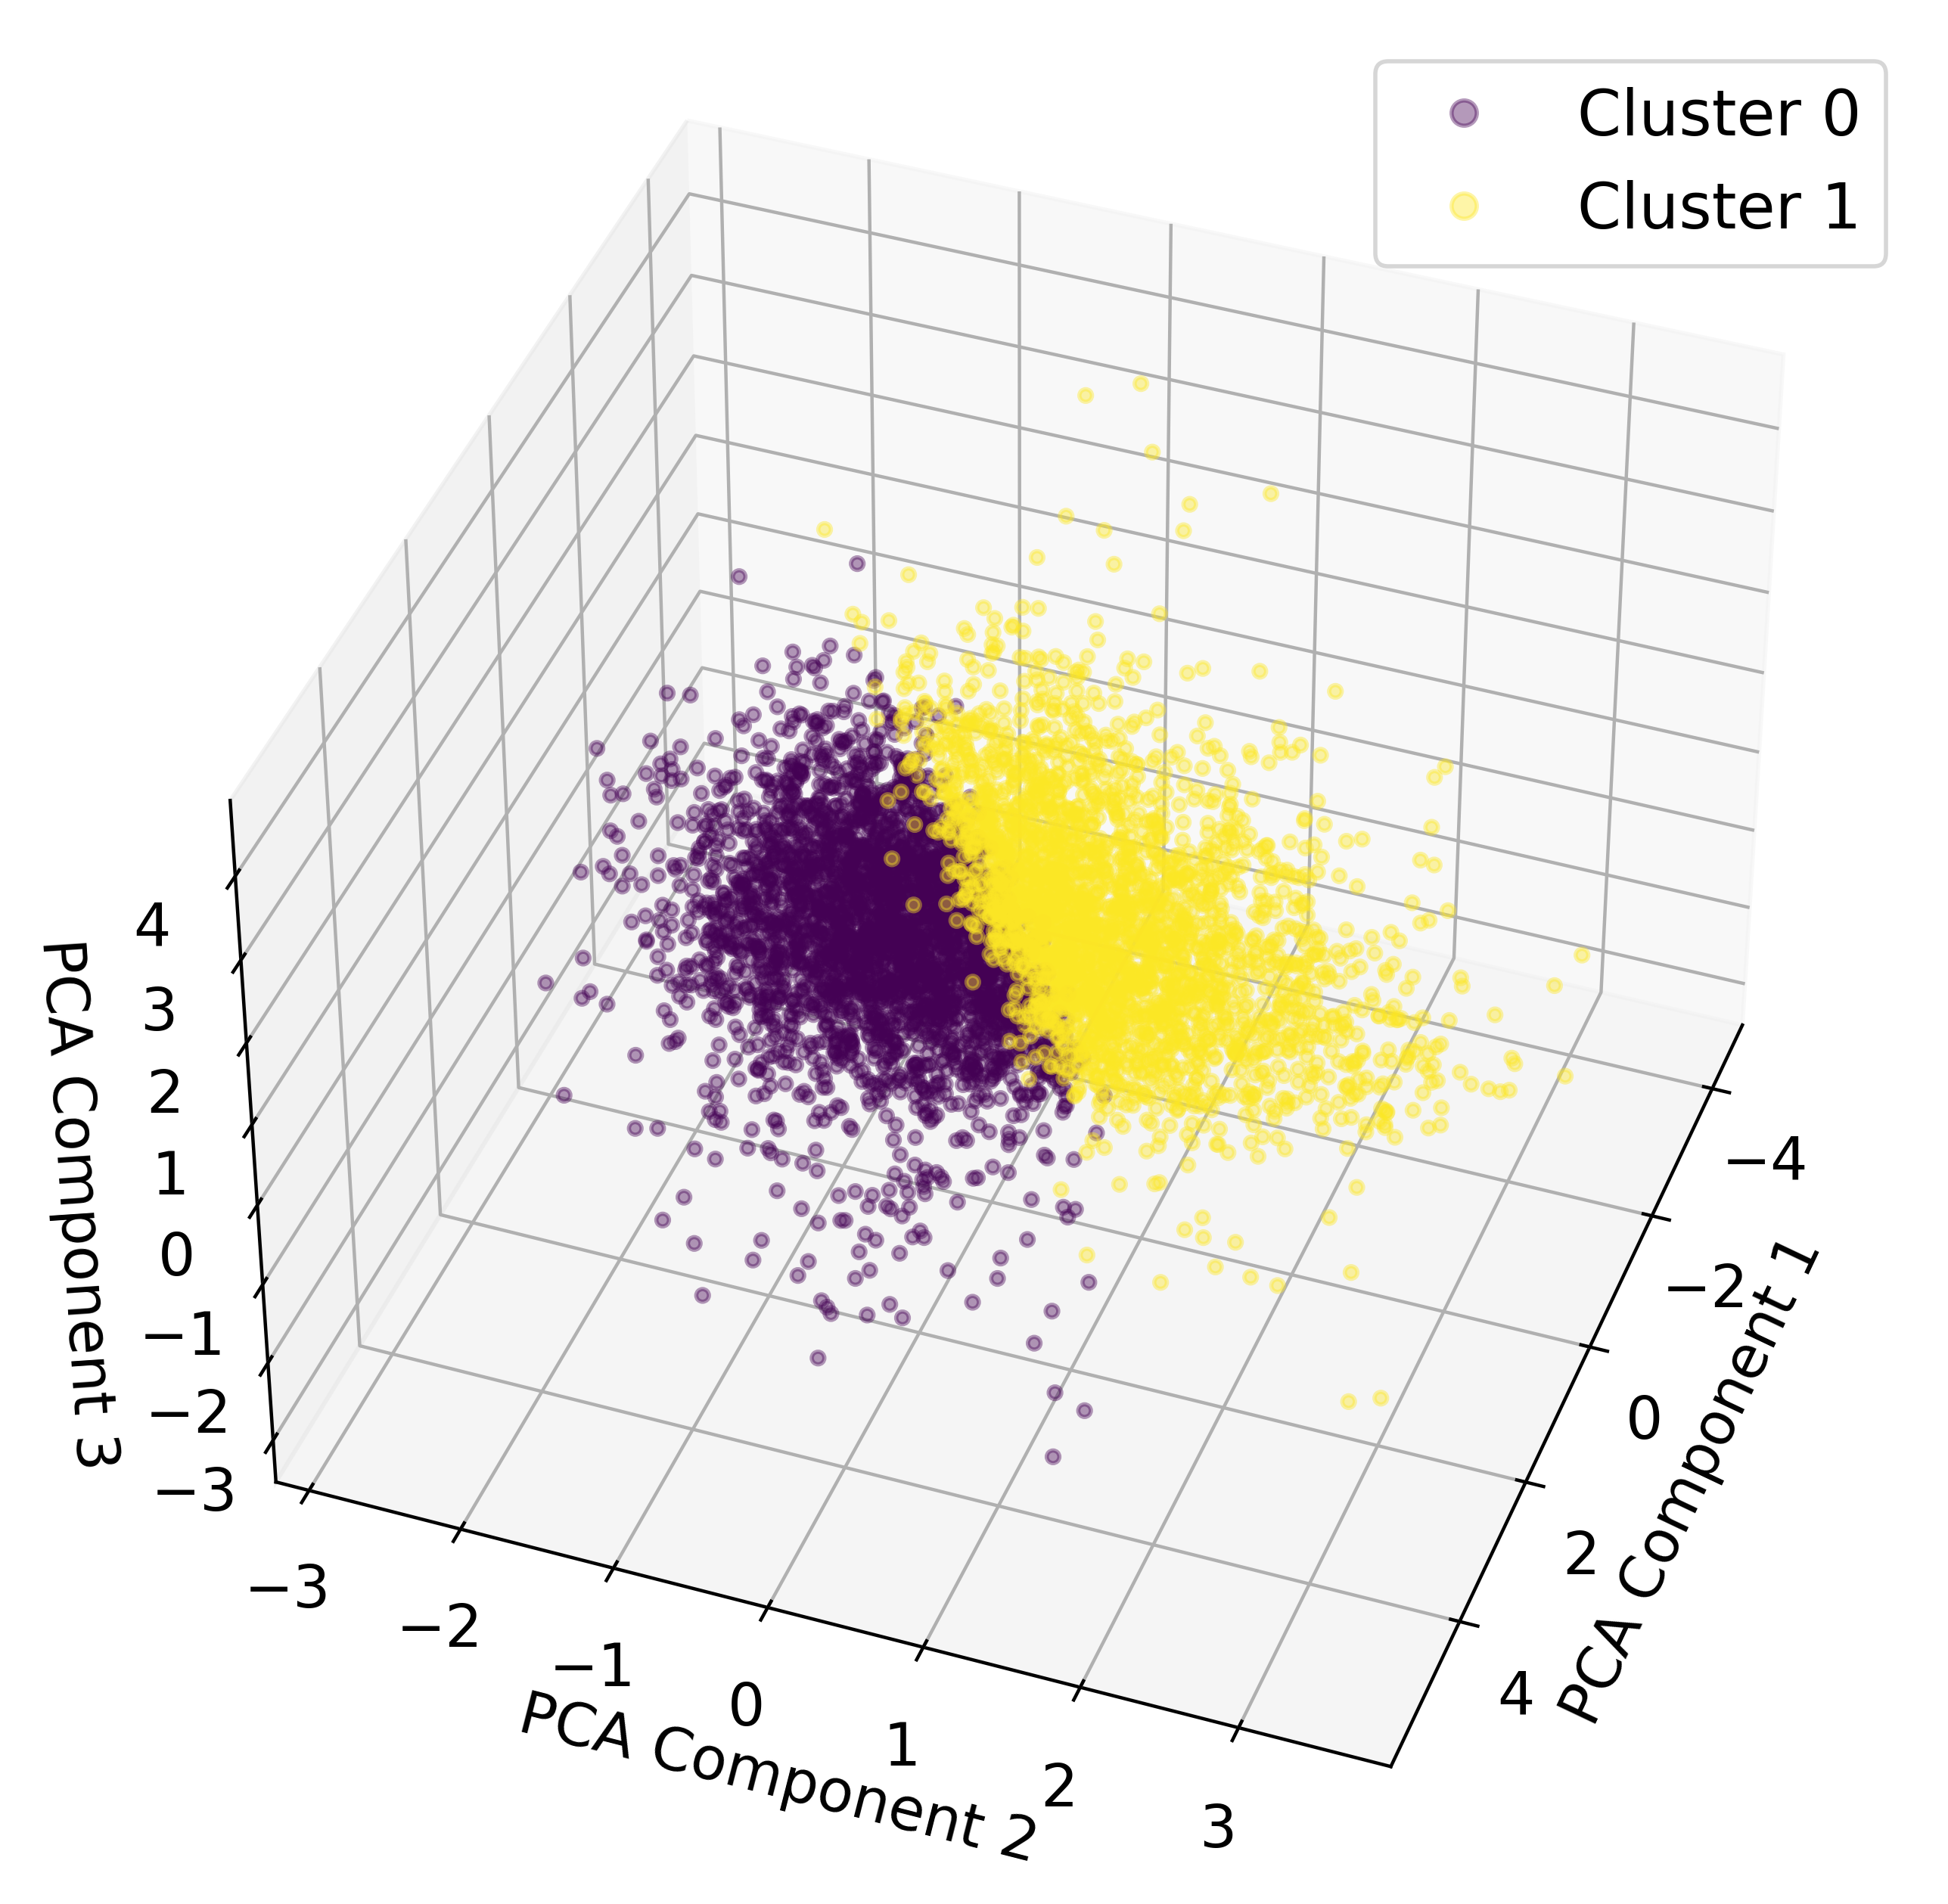
| Label | 0 | 1 | 2 | 3 | 4 | 5 | 6 | 7 | 8 | 9 |
|---|---|---|---|---|---|---|---|---|---|---|
| Silhouette Score | 0.322 | 0.343 | 0.319 | 0.318 | 0.321 | 0.328 | 0.321 | 0.363 | 0.337 | 0.326 |
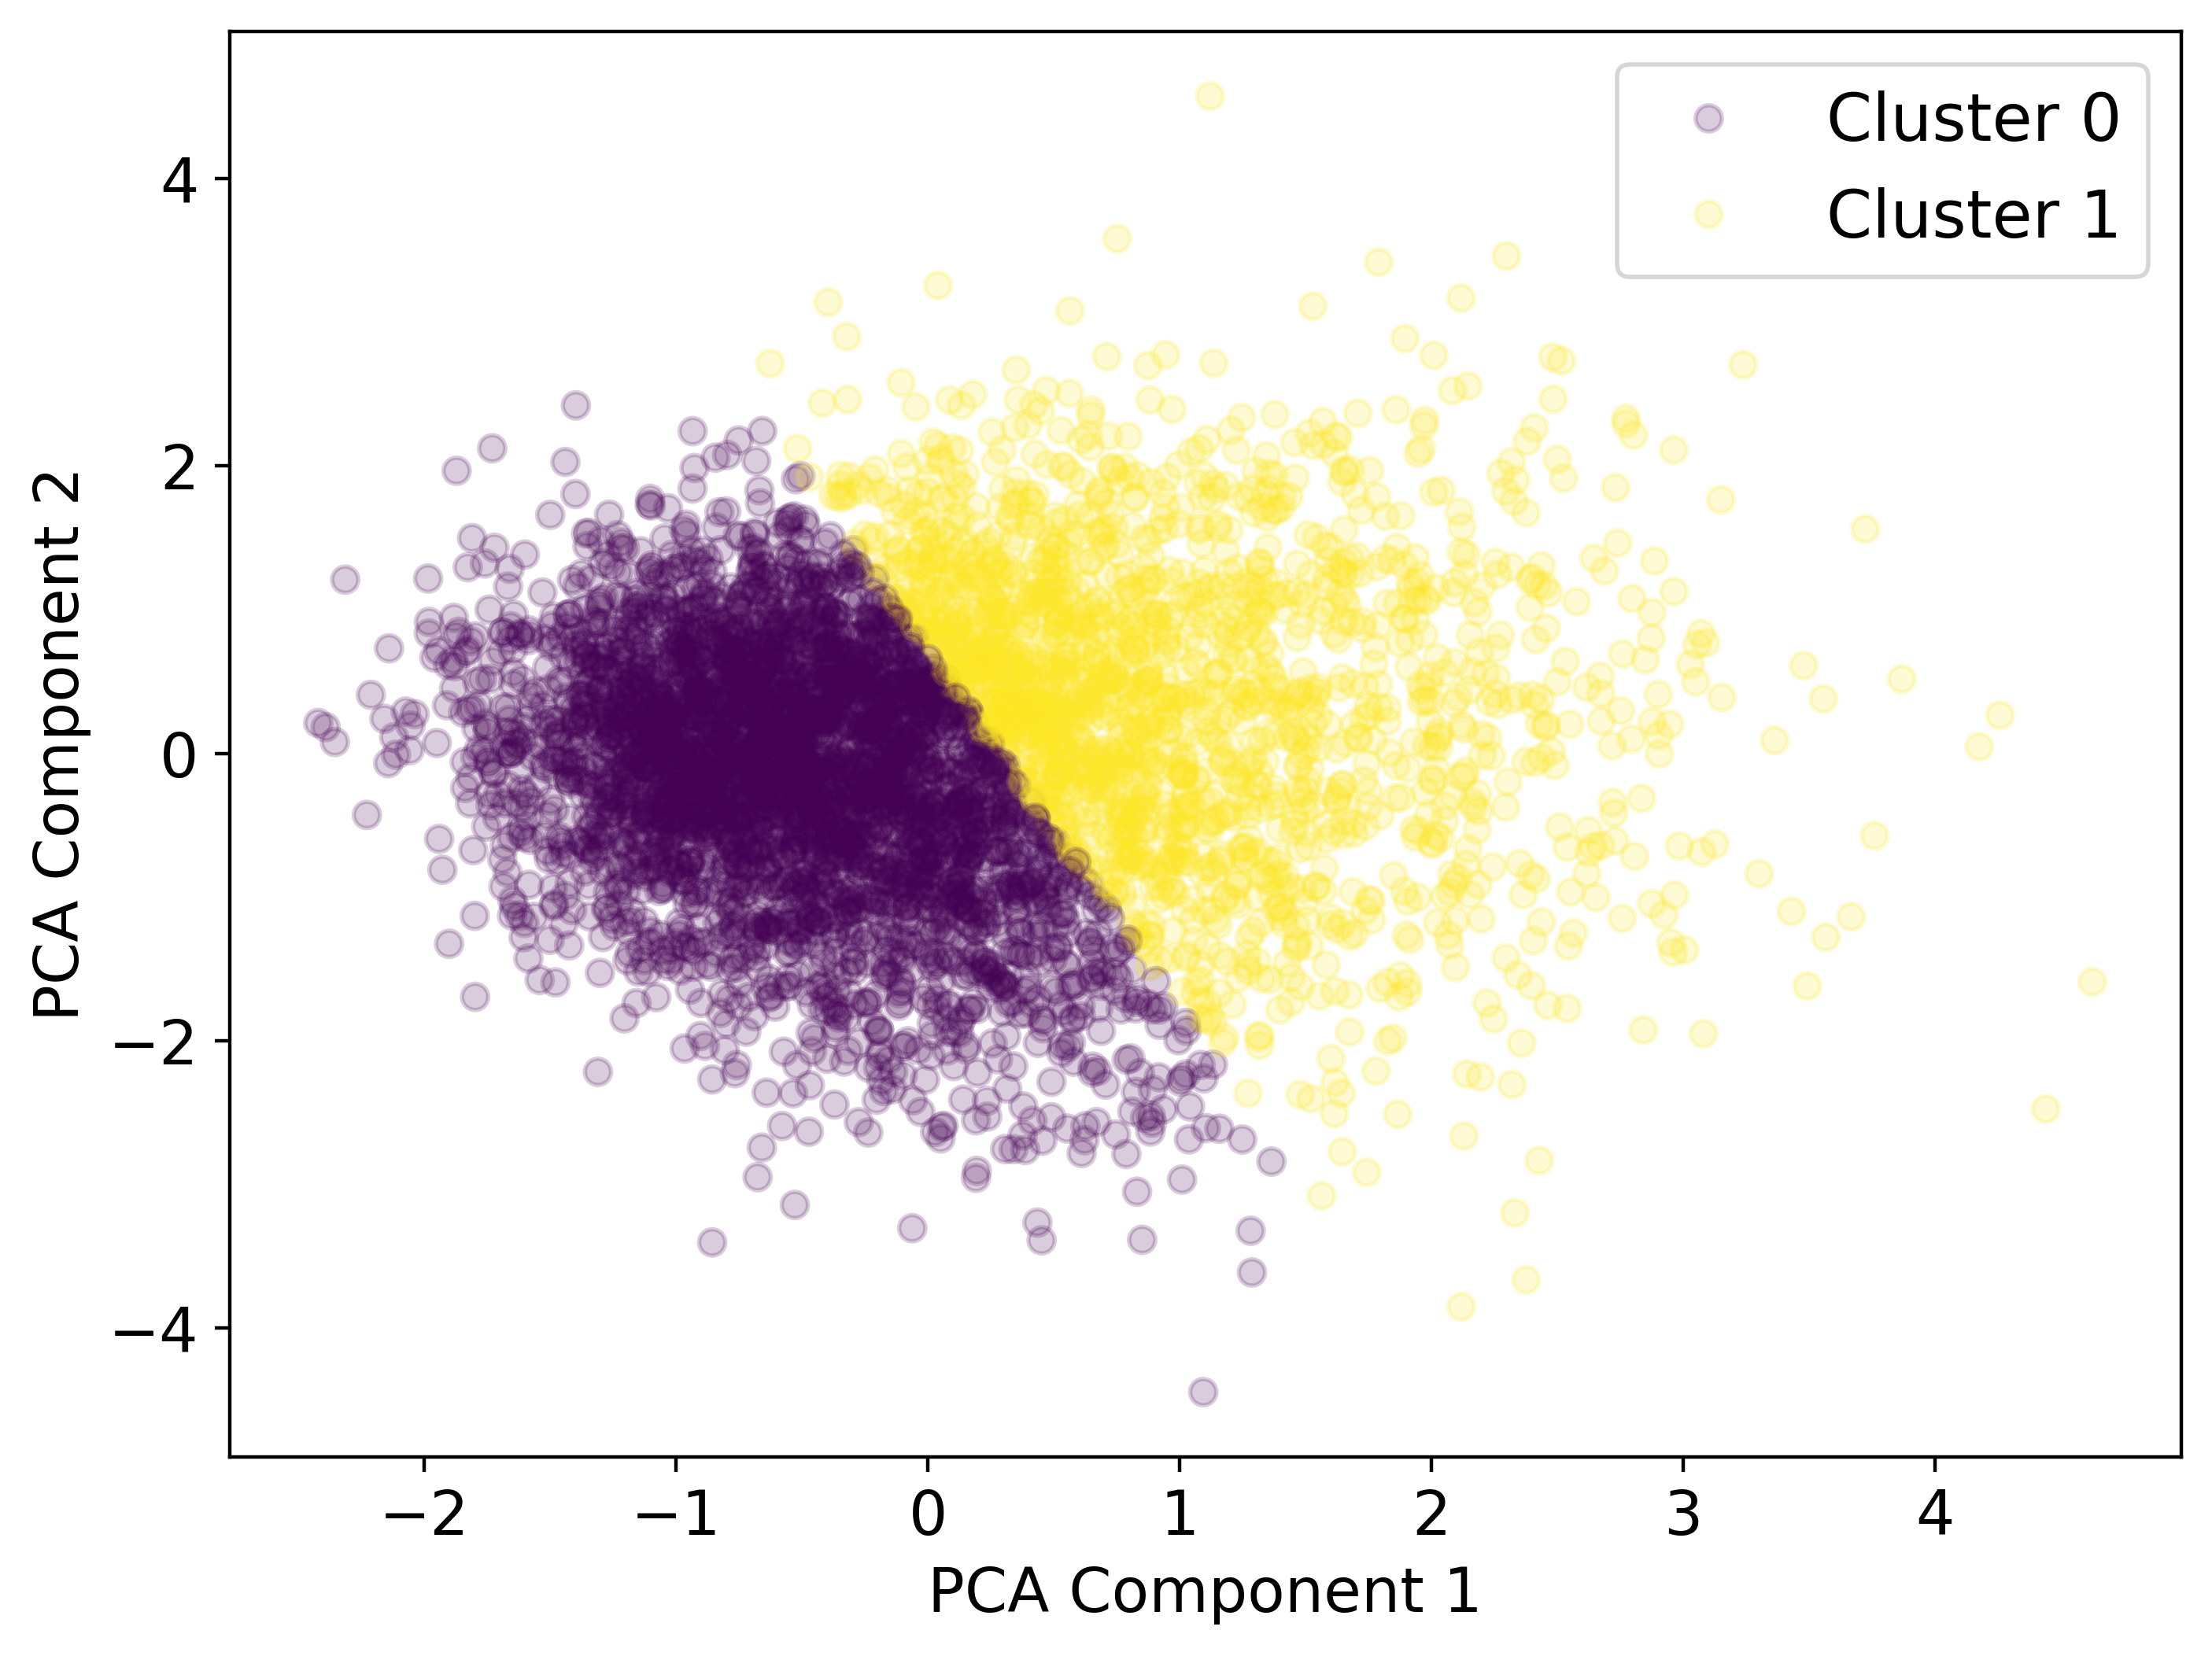
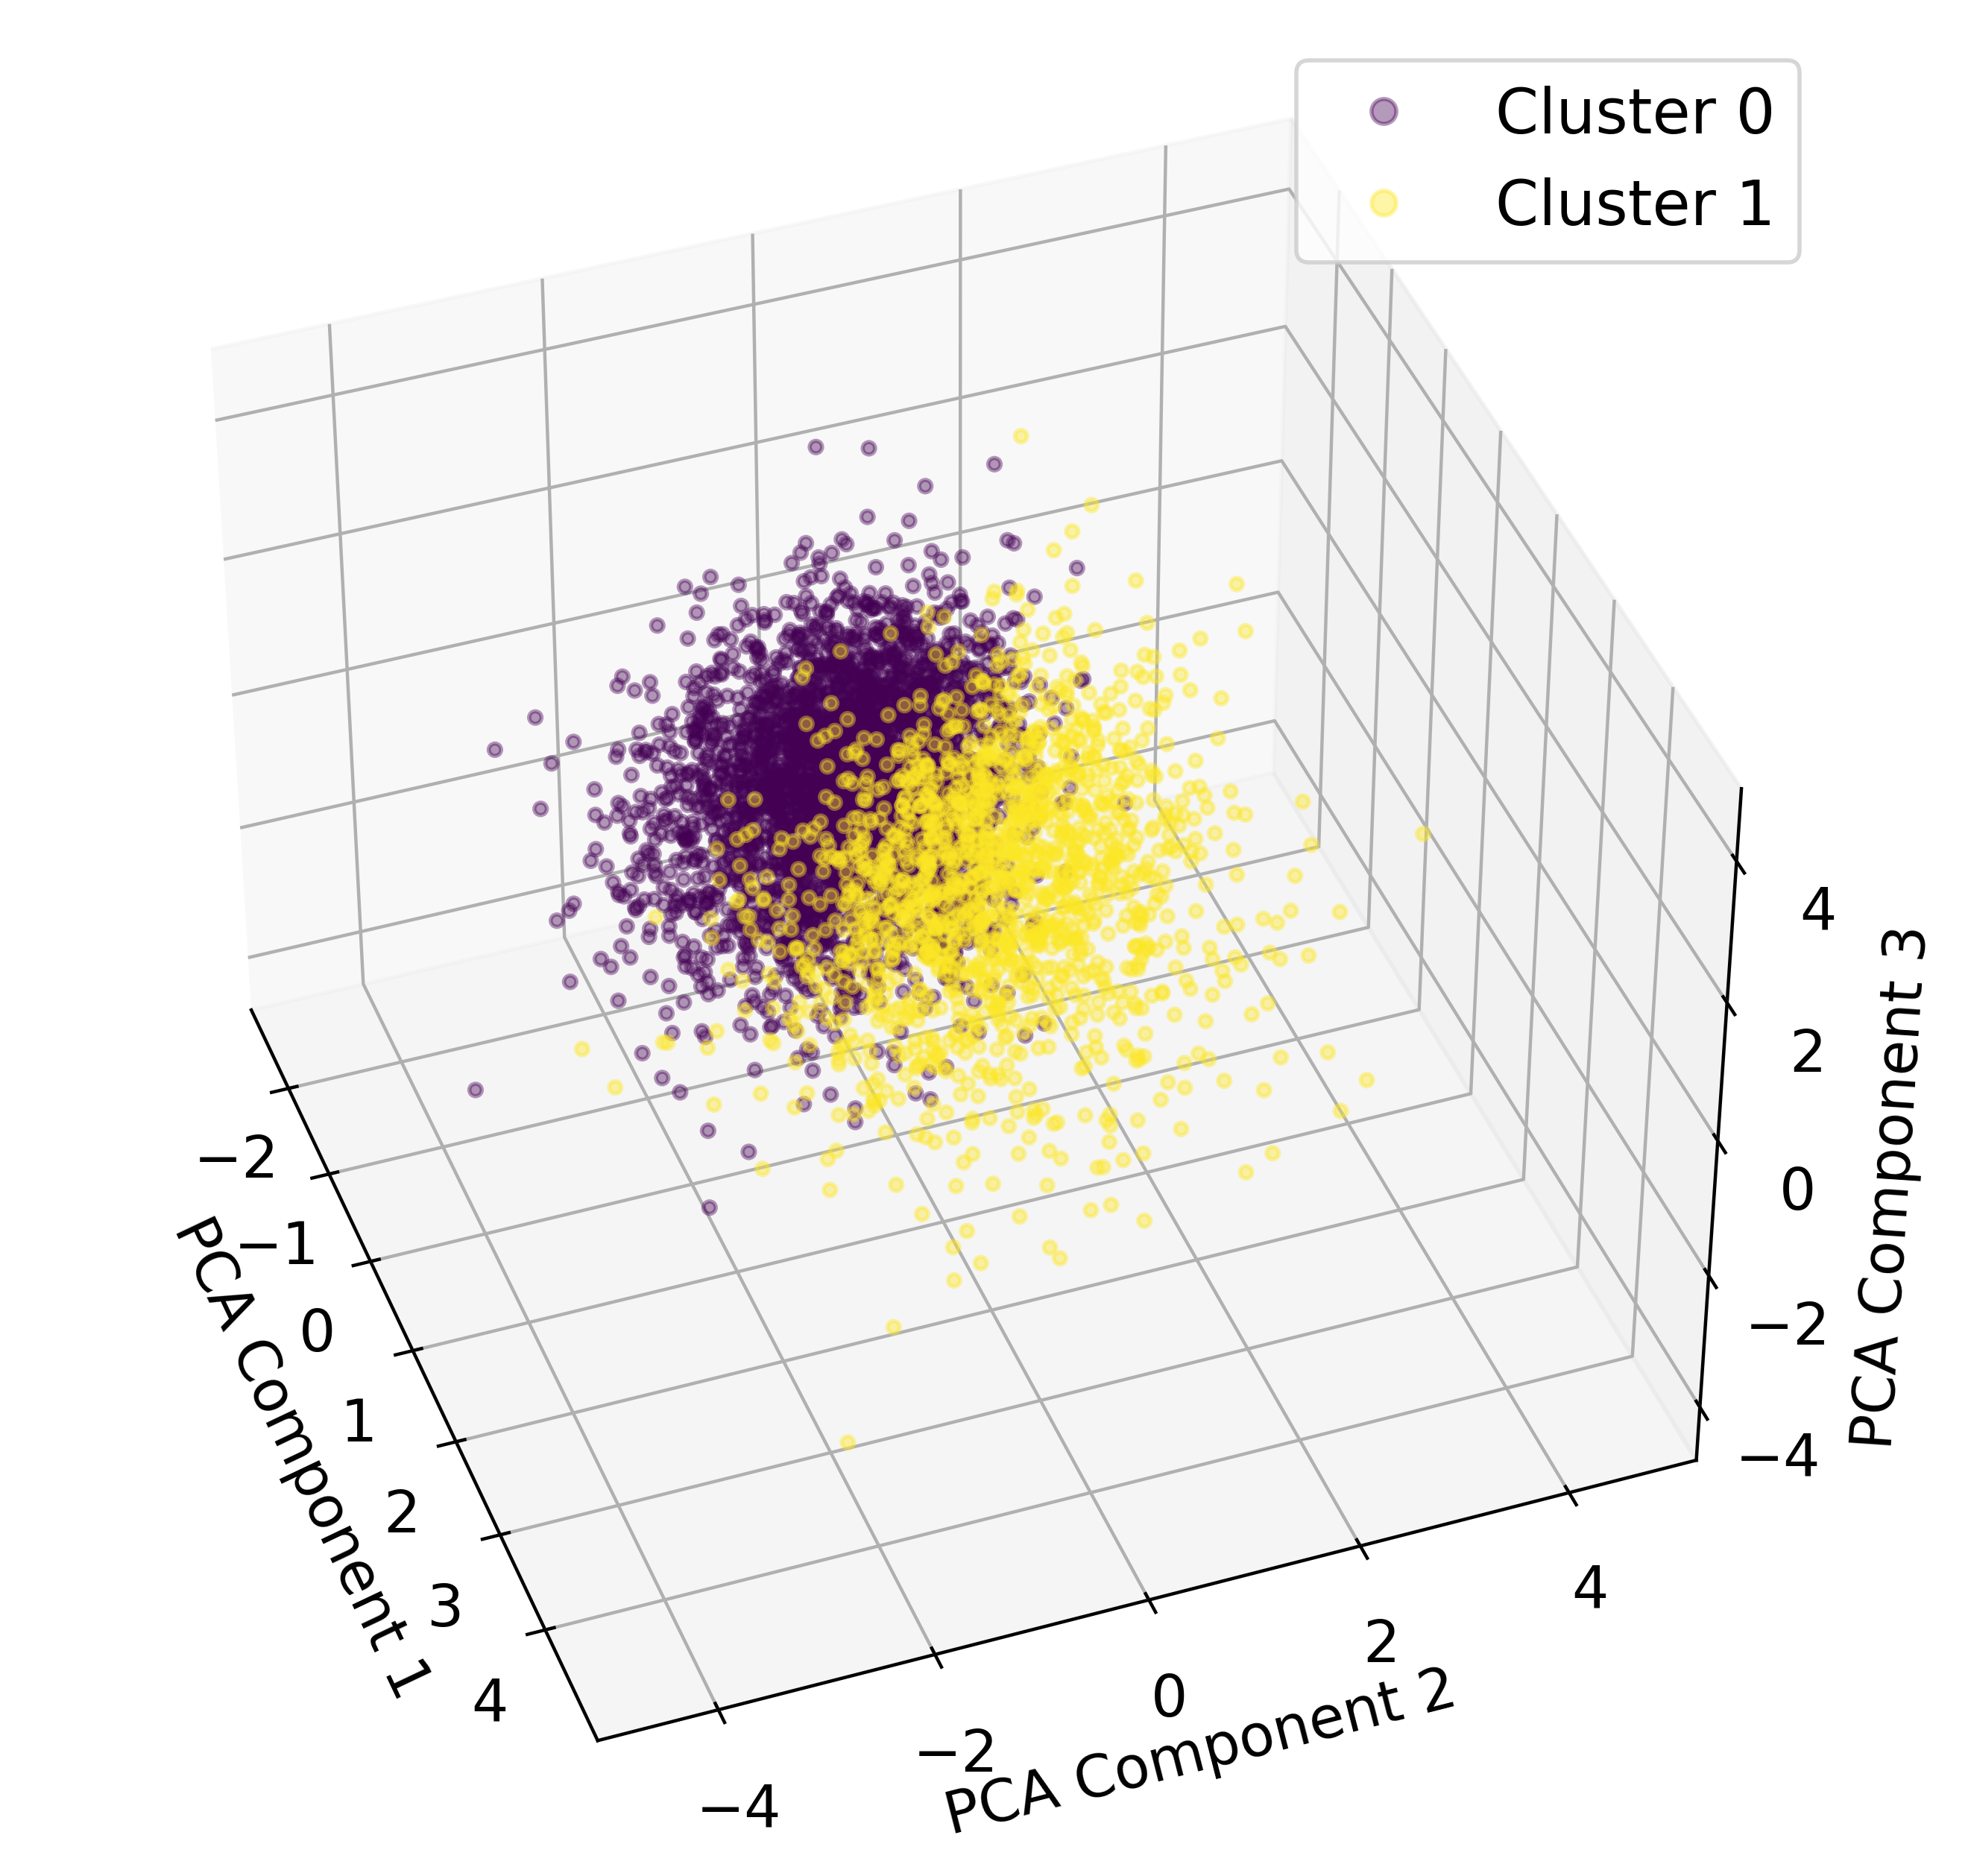
| Label | 0 | 1 | 2 | 3 | 4 | 5 | 6 | 7 | 8 | 9 |
|---|---|---|---|---|---|---|---|---|---|---|
| Silhouette Score | 0.321 | 0.357 | 0.321 | 0.319 | 0.325 | 0.313 | 0.311 | 0.324 | 0.346 | 0.347 |
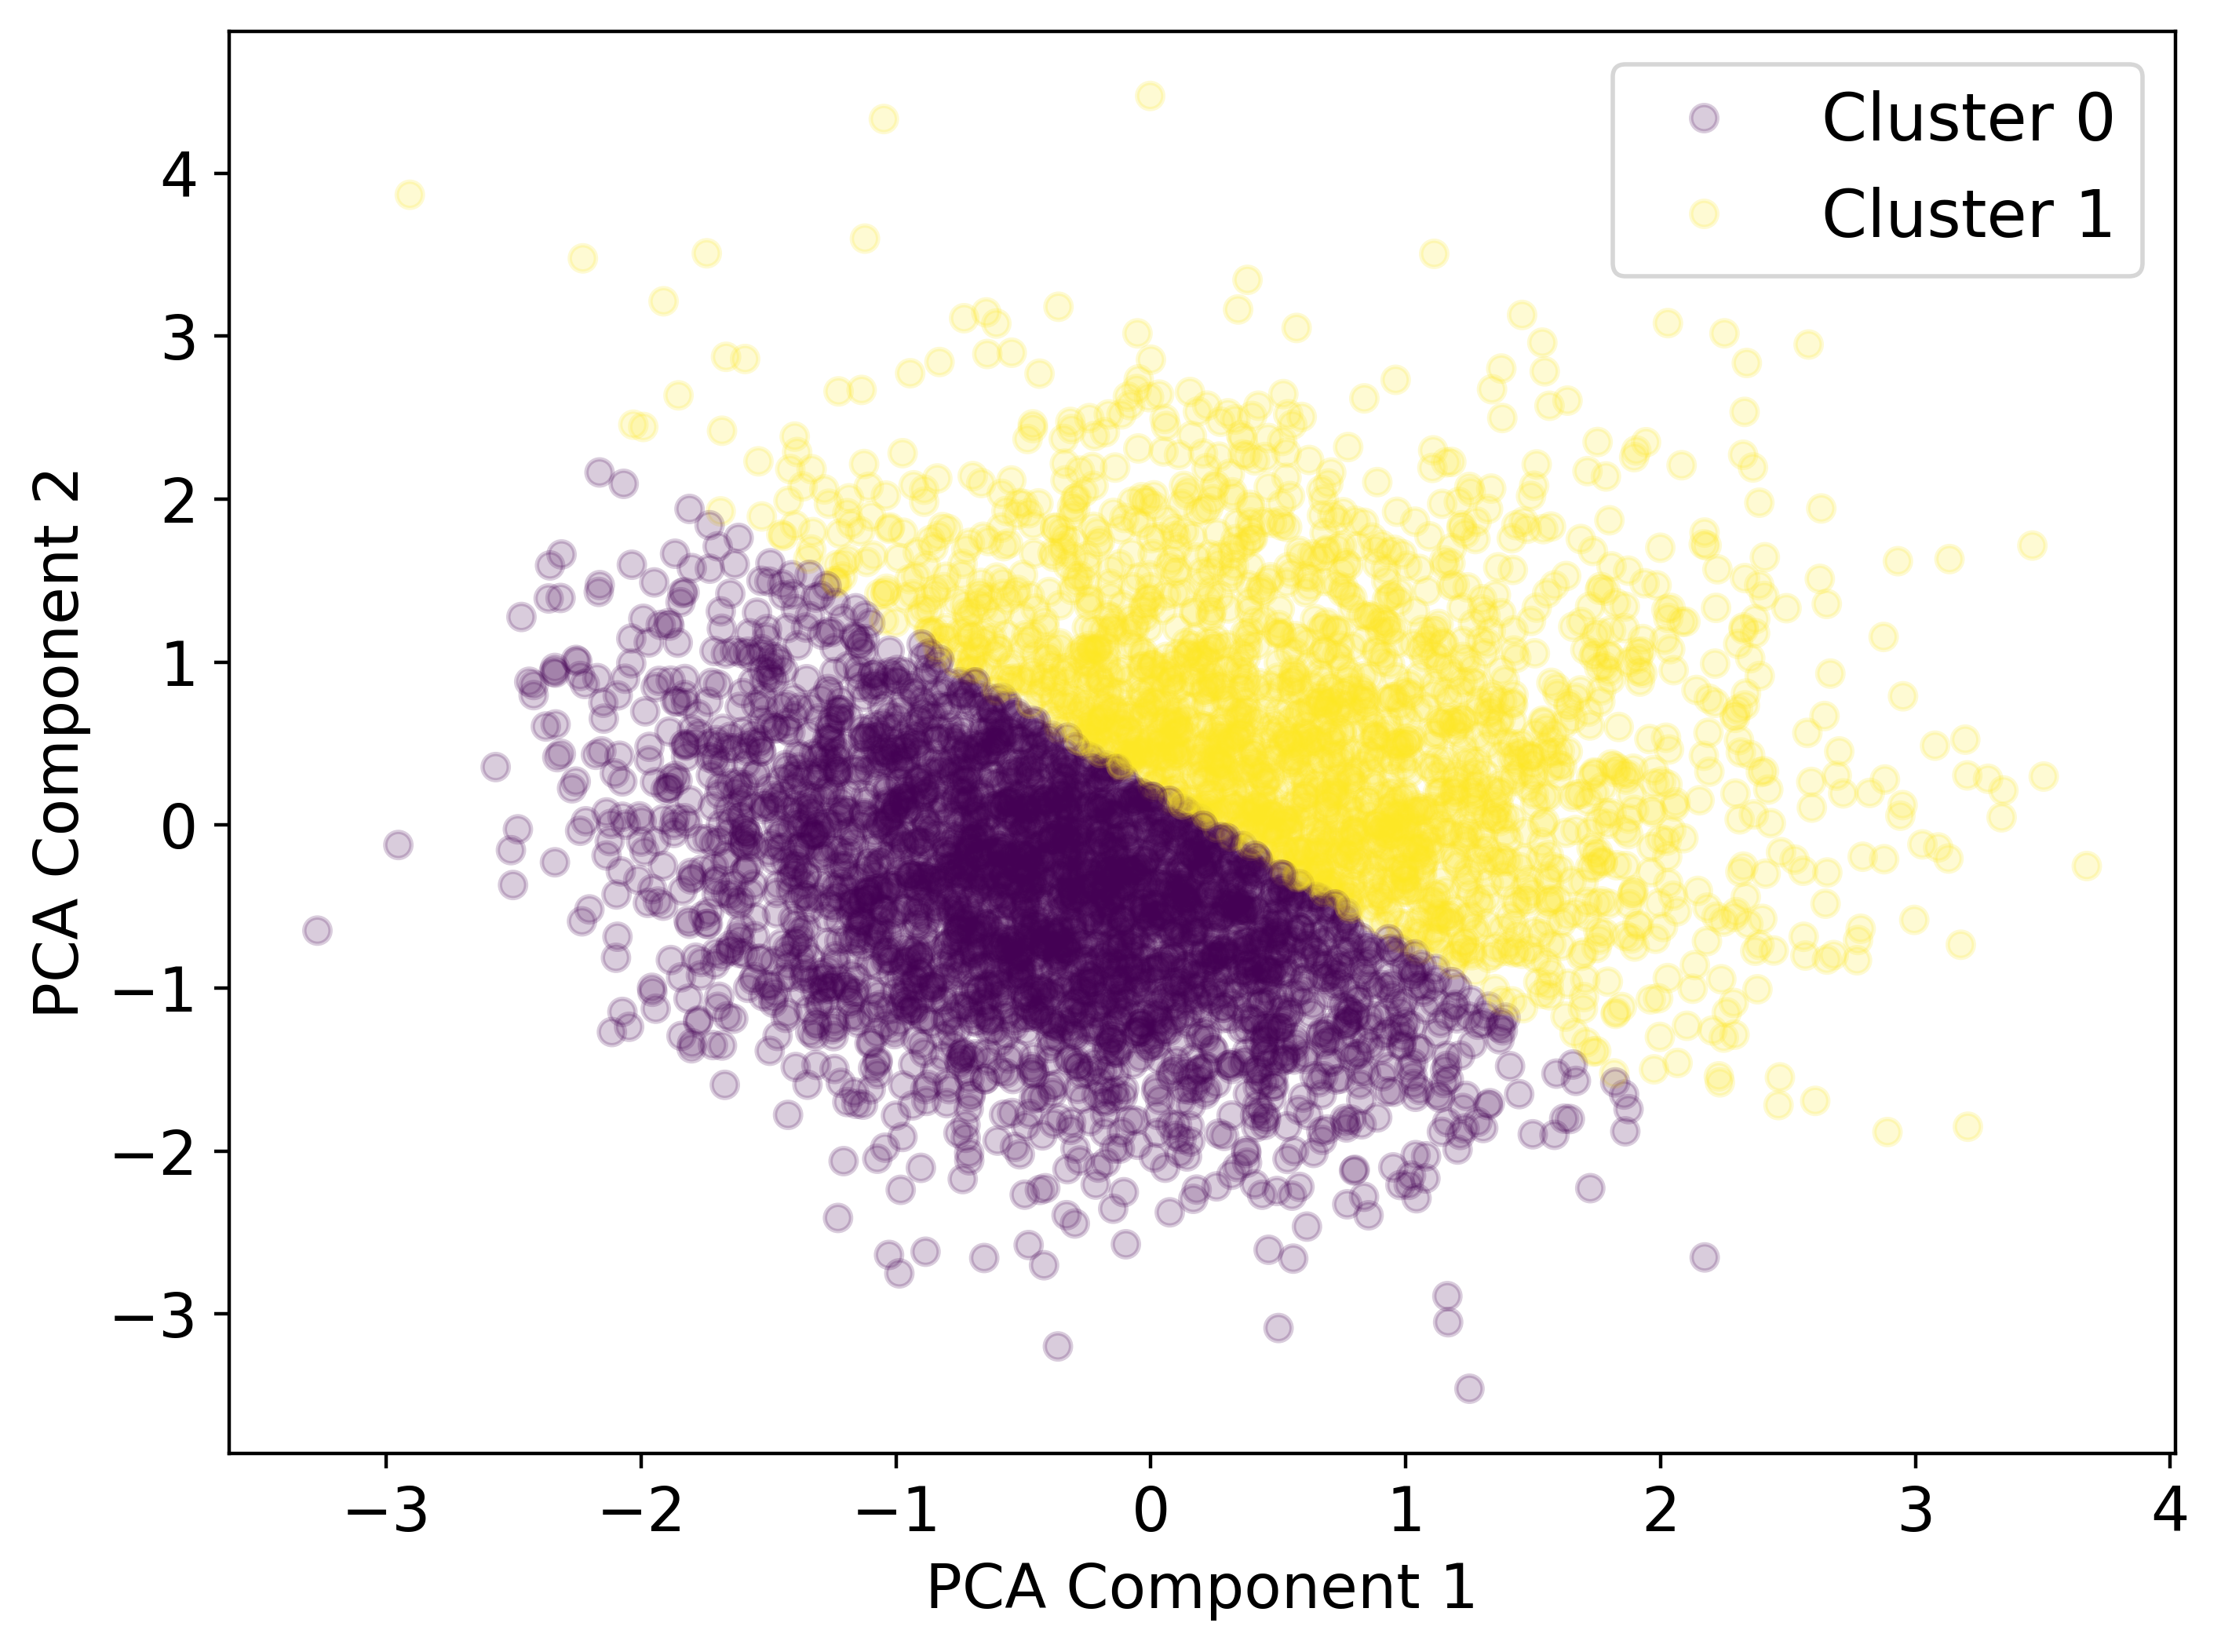
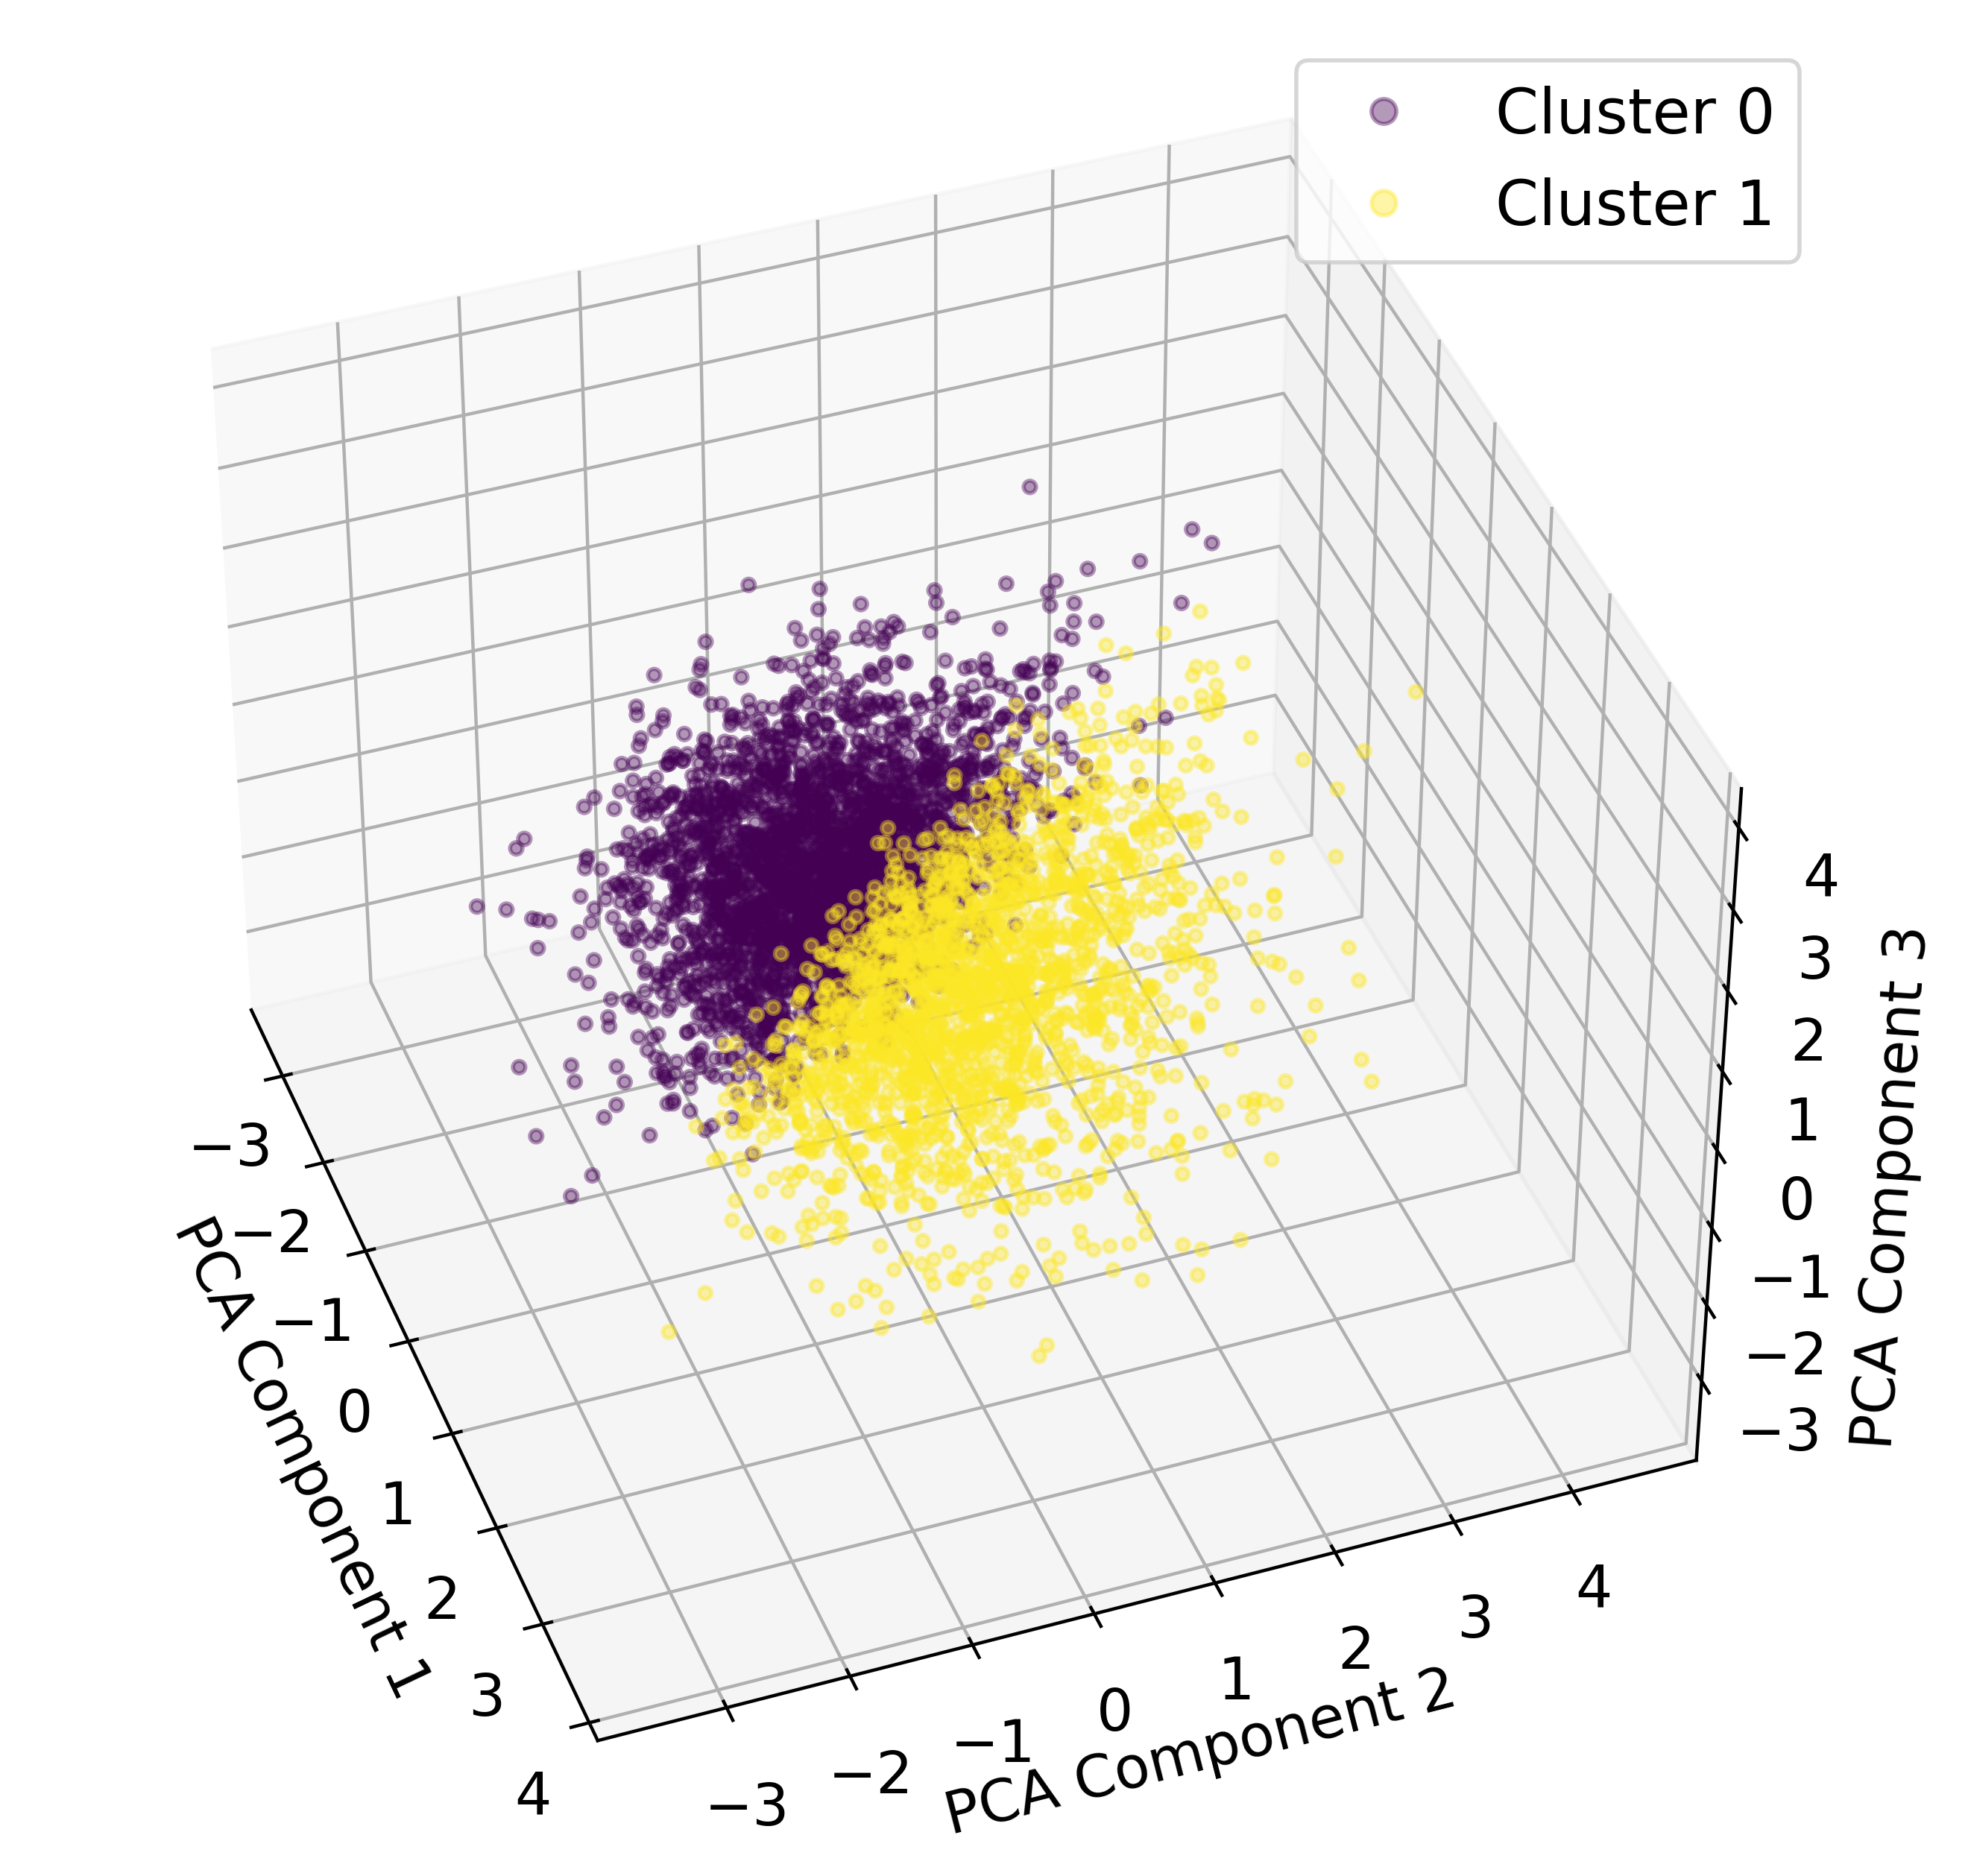
| Label | 0 | 1 | 2 | 3 | 4 | 5 | 6 | 7 | 8 | 9 |
|---|---|---|---|---|---|---|---|---|---|---|
| Silhouette Score | 0.307 | 0.343 | 0.320 | 0.309 | 0.311 | 0.314 | 0.313 | 0.329 | 0.329 | 0.325 |
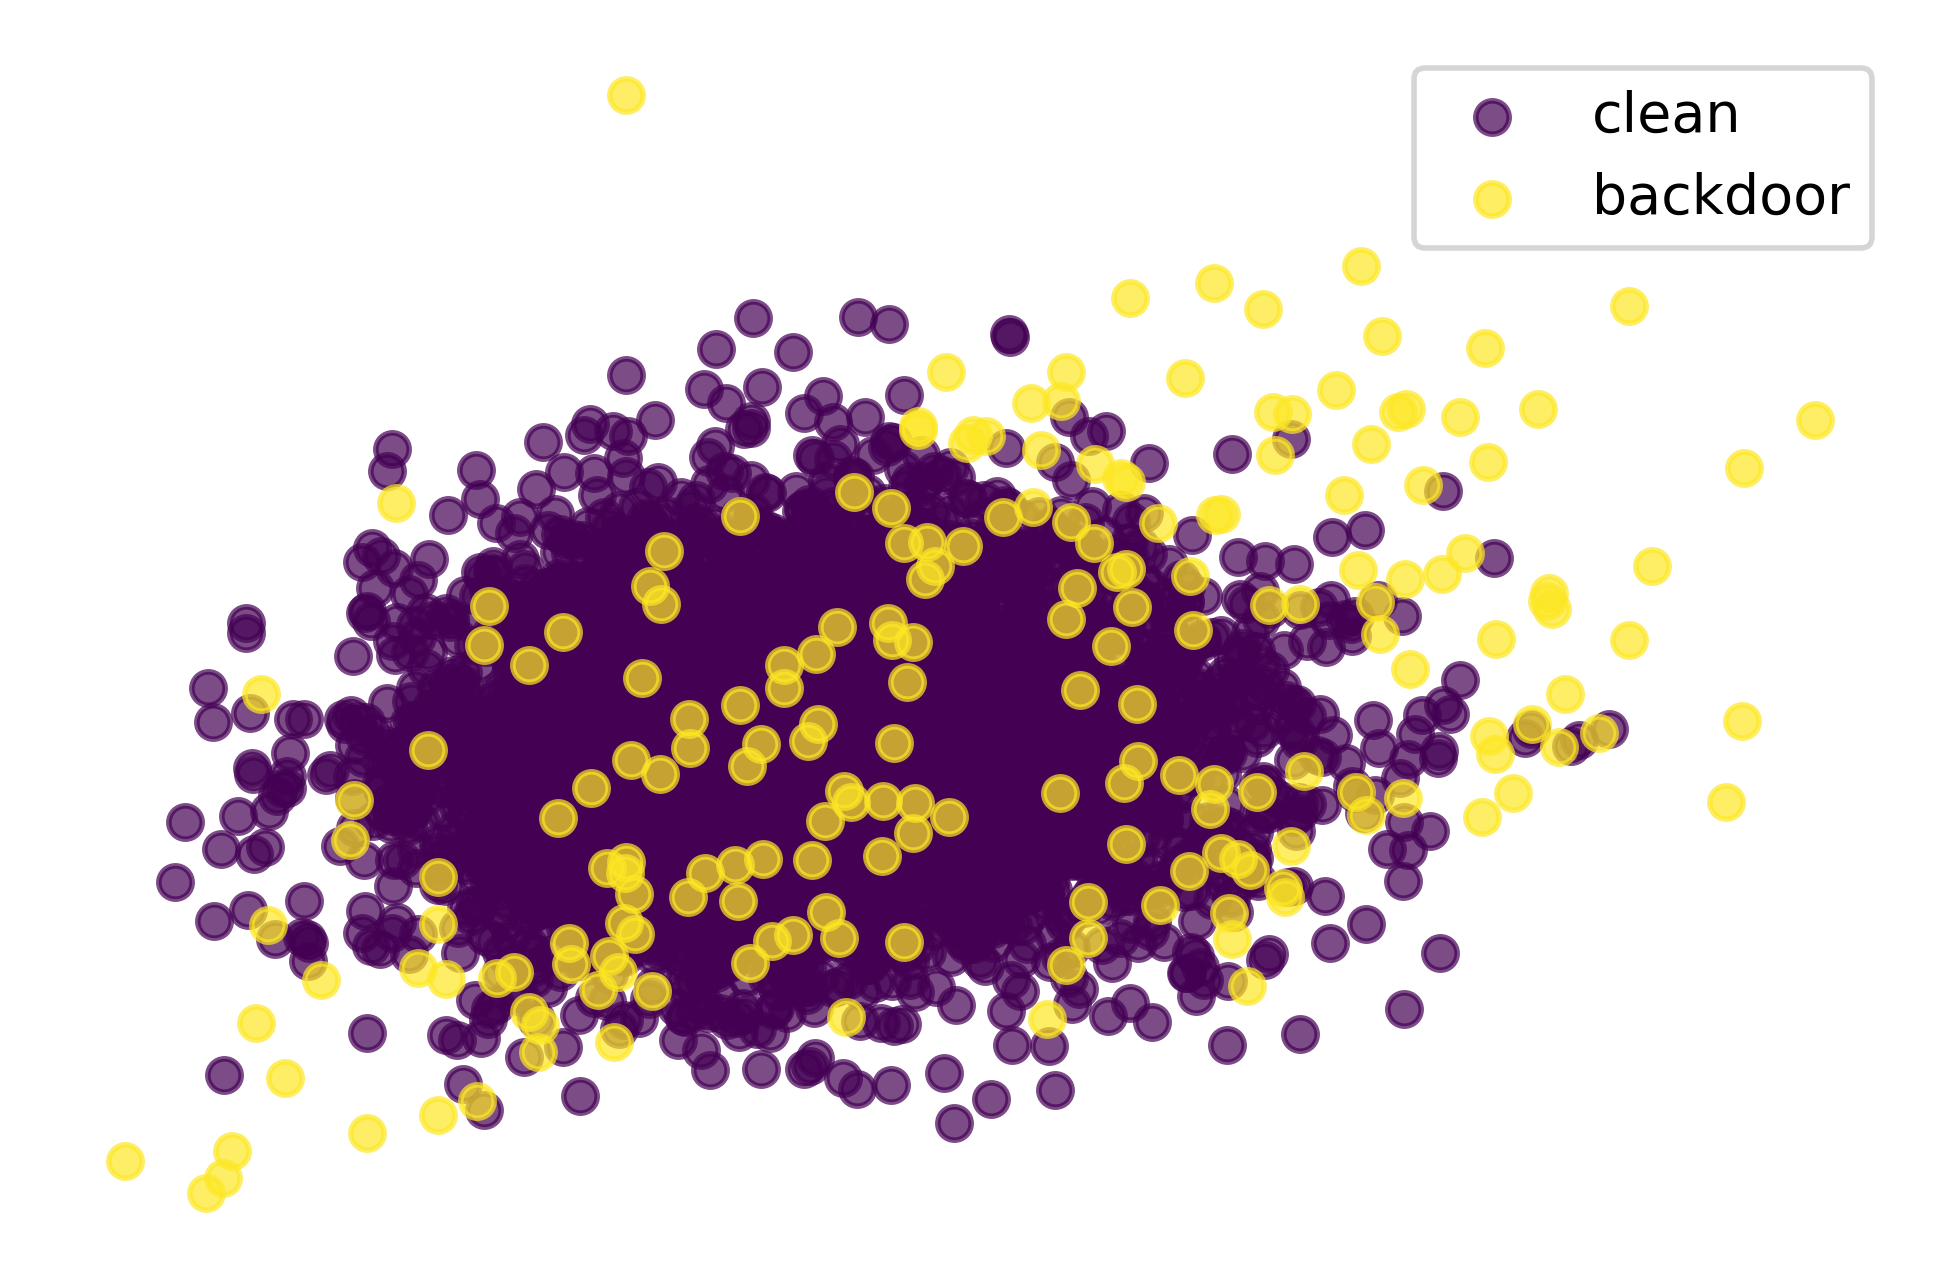
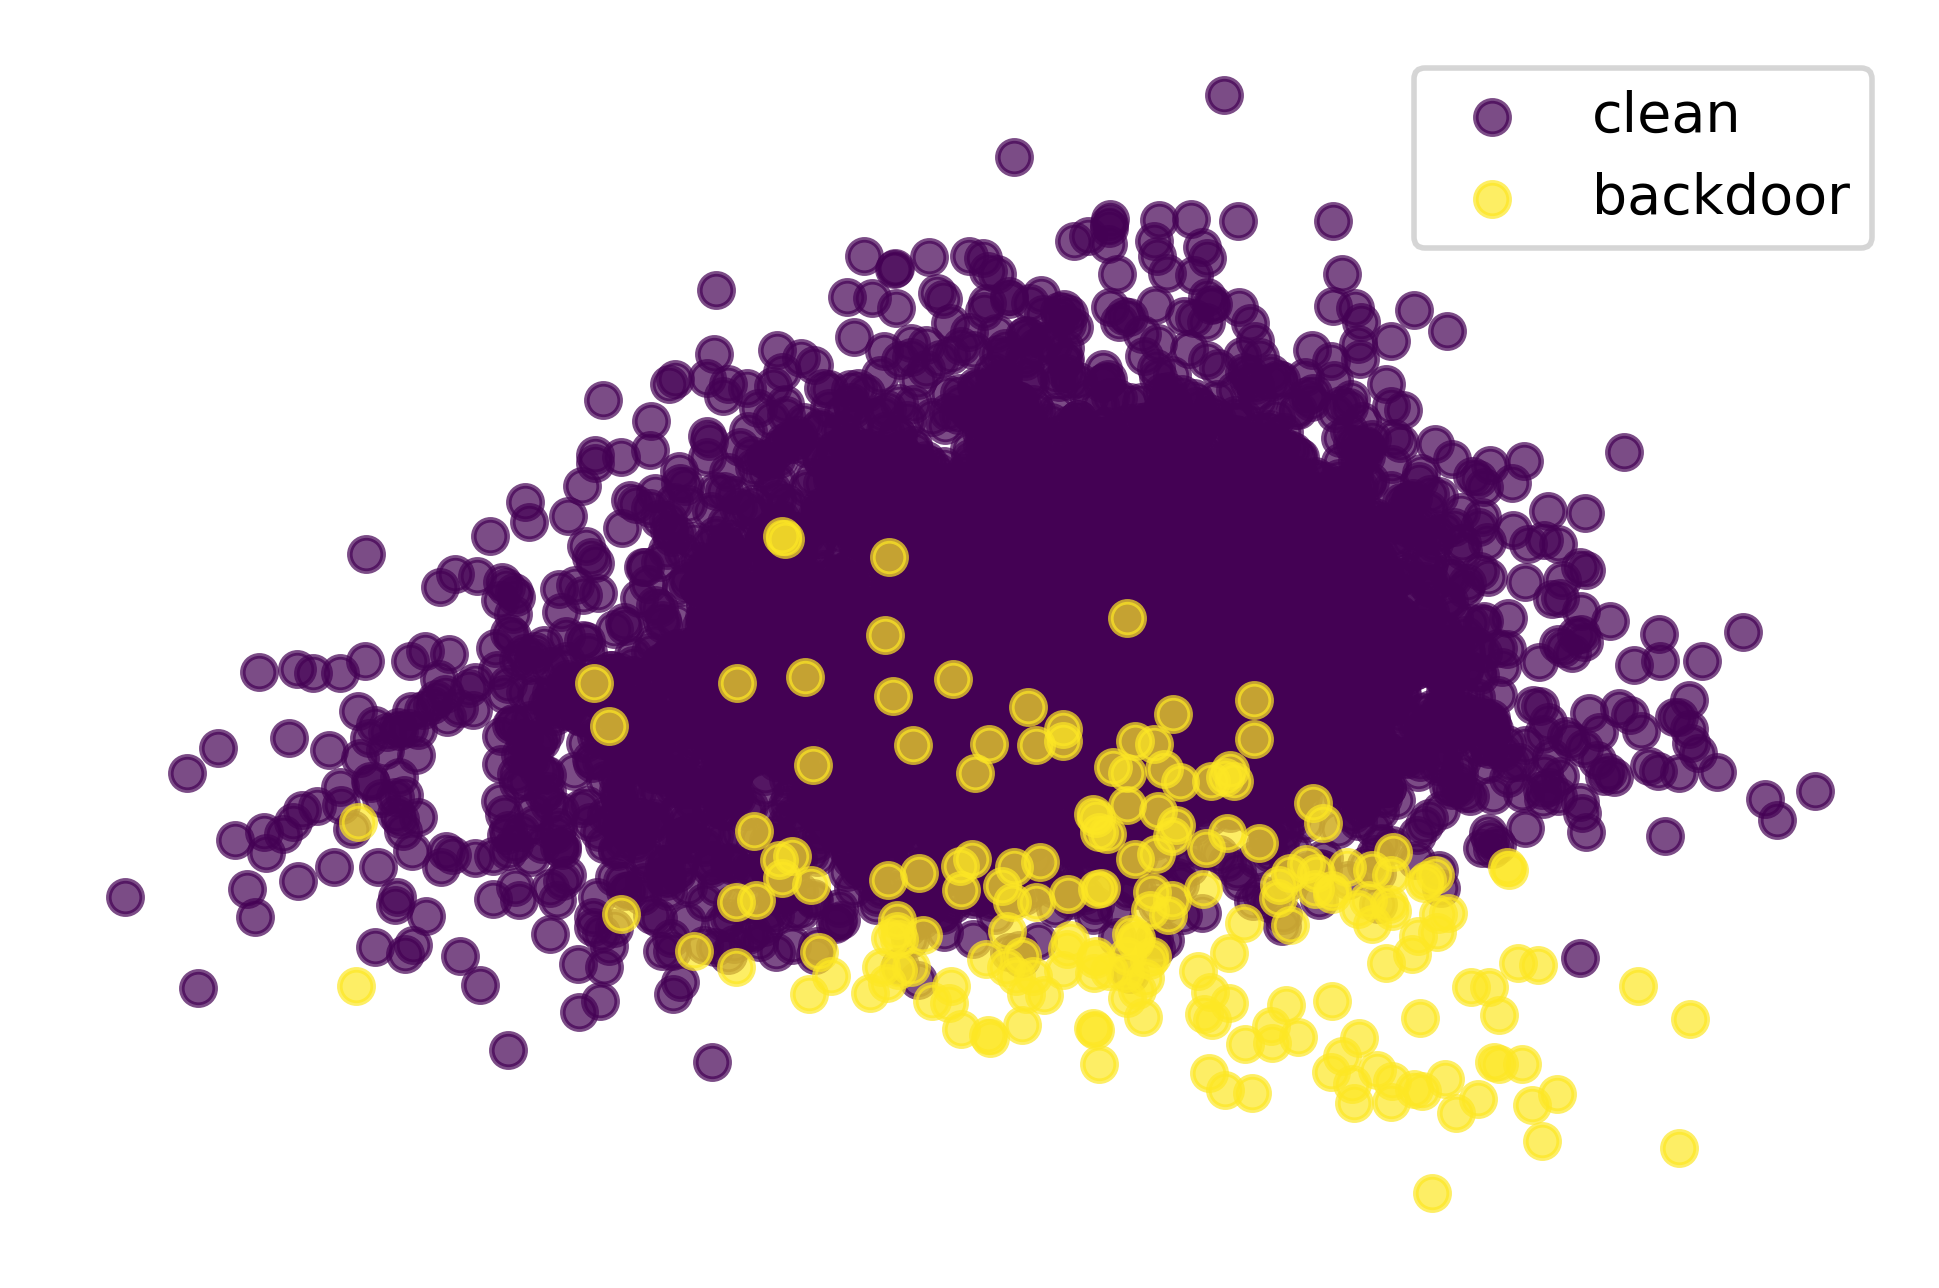
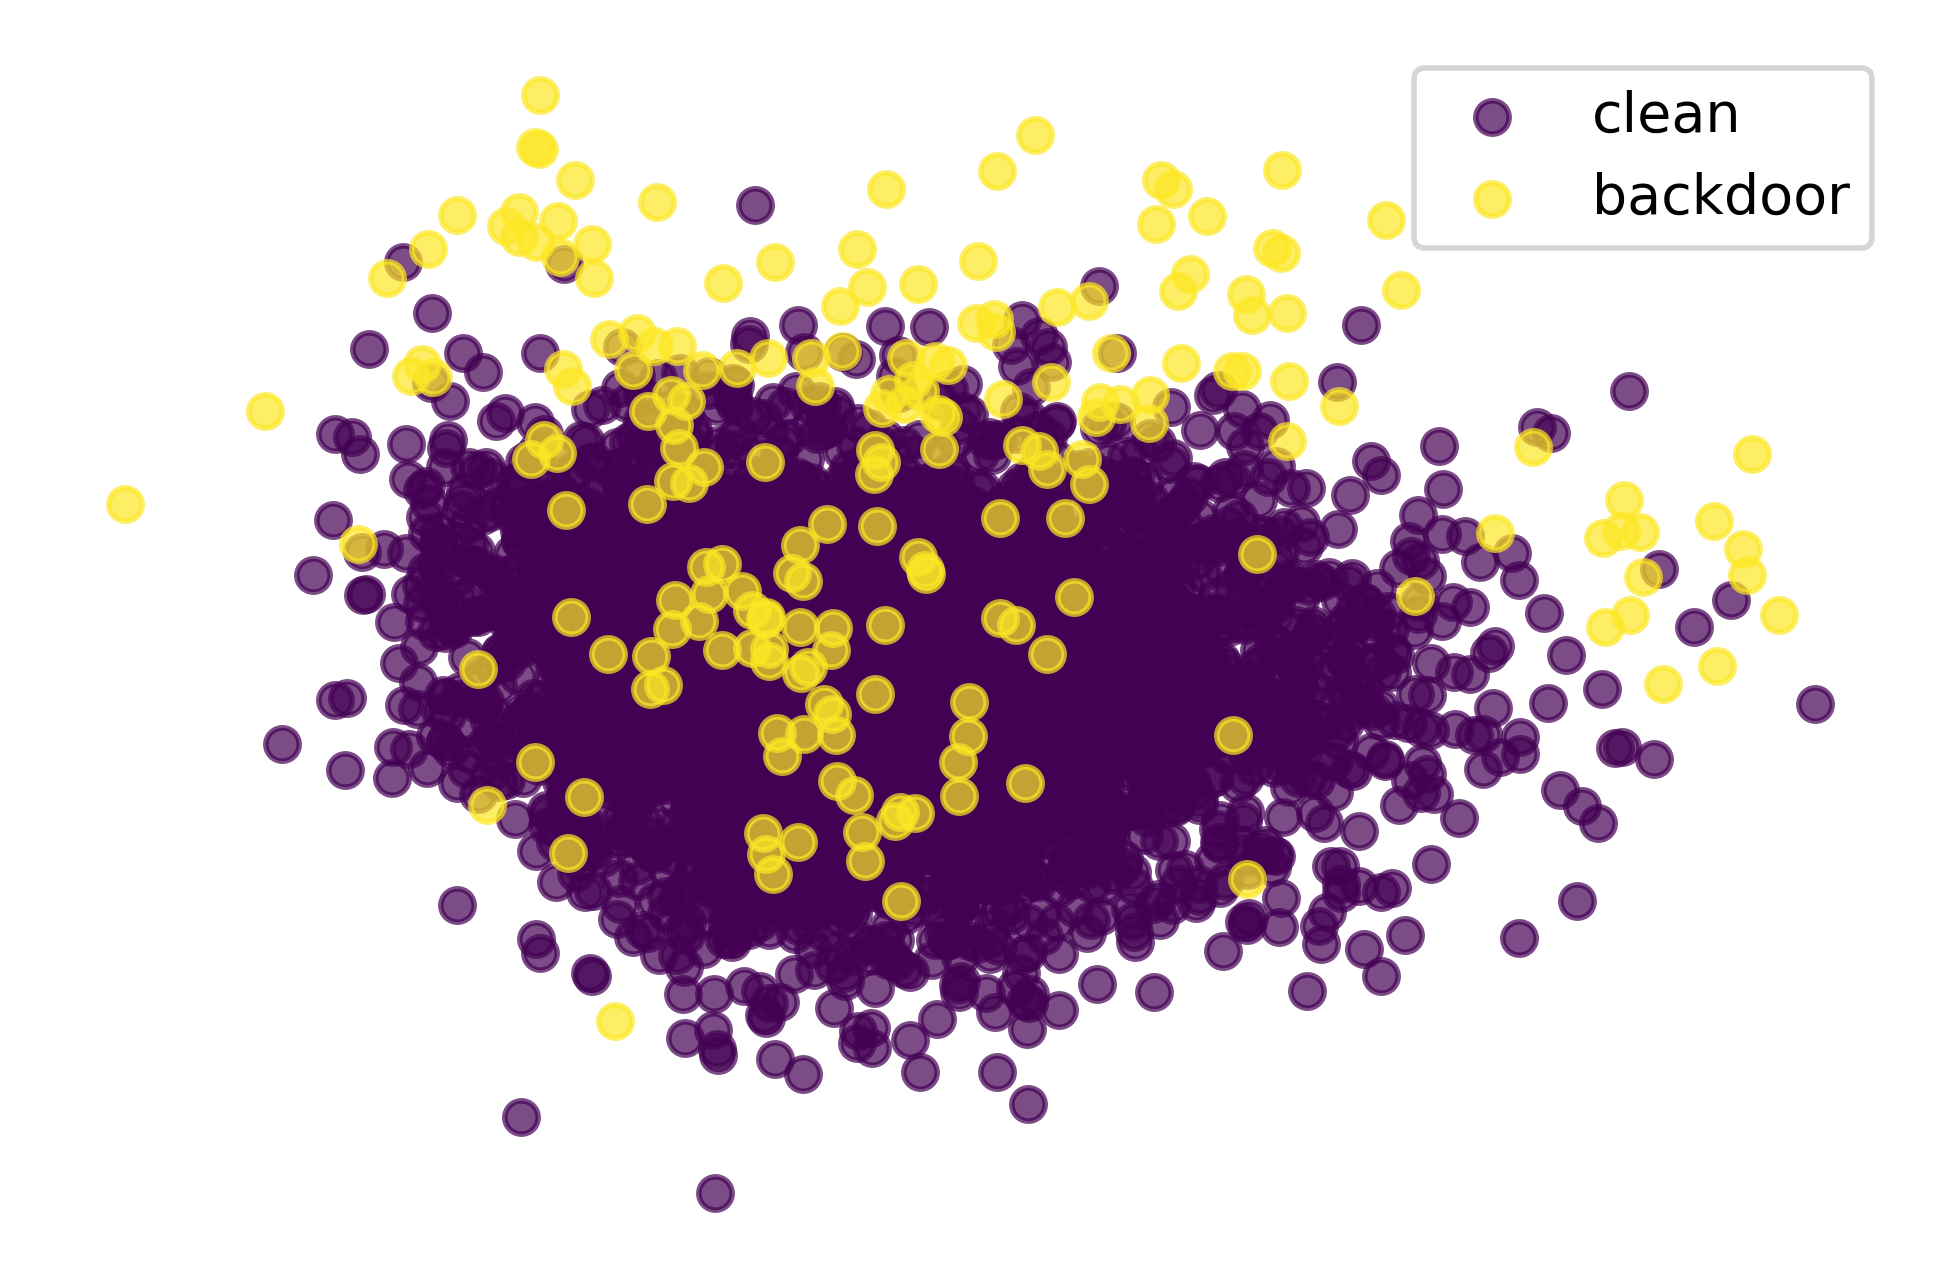
Appendix L Evaluation of Proposed Defenses on Other Frequency Attacks
Table 19 shows the clean data accuracy and the attack success rate of models poisoned by our method, FIBA and FTrojan. The defense shows promising results against two of three frequency backdoor attacks.
| No Defense | JPEG Compression | Autoencoder | ||
|---|---|---|---|---|
| FIBA | CDA(%) | 92.51 | 83.80 | 82.33 |
| ASR(%) | 96.54 | 92.85 | 71.43 | |
| FTrojan | CDA(%) | 92.84 | 85.05 | 0.00 |
| ASR | 100.00 | 82.05 | 0.00 | |
| Ours | CDA(%) | 94.38 | 86.91 | 0.00 |
| ASR(%) | 99.44 | 83.15 | 0.00 |
Appendix M Comparing Backdoor Attacks
Table 20 compares the proposed method with other spatial backdoor attacks. As observed, our method surpasses the performance of spatial backdoor attacks in clean data accuracy, attack success rate, and invisibility metrics (PSNR and LPIPS). Least Significant Bit (LSB) attack is not included in the comparison as it fails to achieve a high attack success rate and hence fails to create a backdoor attack in the first place.
| Metric | Ratio | BadNets | Blend | SIG | Refool | SPM | \cellcolor[HTML]F2D7D5 LSB | Poison Ink | Ours |
| CDA/ASR | 3% | 87.38 / 66.55 | 89.89 / 89.39 | 89.74 / 99.23 | 89.20 / 87.16 | 88.89 / 58.53 | 88.18 / 10.91 | 89.65 / 94.22 | 92.31 / 99.43 |
| 5% | 87.13 / 65.36 | 89.60 / 90.99 | 89.64 / 99.47 | 89.16 / 89.79 | 88.90 / 57.69 | 86.98 / 11.67 | 89.69 / 93.58 | 91.88 / 99.88 | |
| 10% | 85.61 / 68.01 | 89.77 / 93.11 | 89.45 / 99.40 | 88.80 / 92.80 | 89.07 / 57.33 | 83.69 / 15.76 | 89.47 / 93.67 | 92.10 / 99.97 | |
| PSNR/LPIPS | 25.68 / 0.0009 | 21.29 / 0.0240 | 25.12 / 0.0400 | 19.38 / 0.0397 | 38.94 / 0.0001 | 51.13 / 0.00001 | 42.95 / 0.0001 | 43.15 / 0.00001 | |
Appendix N Learning Capacity vs Poisoning Capabilities
Based on our experiments (check Table 6), a particularly interesting yet expected trend is noticed. Networks like VGG19, which lack any skip connections, tend to be harder to backdoor attack. This is because the poison information dilutes as we move deeper and deeper in the network architecture. Low norm invisible attacks tend to be particularly influenced by this, and hence, non-residual networks require a higher poisoning rate for embedding a backdoor. On the other hand, networks like ResNets, WideResNets, and DenseNets seem to be capable of maintaining the poison information through their skip connections and hence can be backdoored with a fairly small amount of poisoned data.