Closed-loop targeted optogenetic stimulation of C. elegans populations
Mochi Liu1, Sandeep Kumar2, Anuj K Sharma1, Andrew M Leifer1,2*
1 Department of Physics, Princeton University, USA
2 Princeton Neuroscience Institute, Princeton University, USA
* leifer@princeton.edu
Abstract
We present a high-throughput optogenetic illumination system capable of simultaneous closed-loop light delivery to specified targets in populations of moving Caenorhabditis elegans. The instrument addresses three technical challenges: it delivers targeted illumination to specified regions of the animal’s body such as its head or tail; it automatically delivers stimuli triggered upon the animal’s behavior; and it achieves high throughput by targeting many animals simultaneously. The instrument was used to optogenetically probe the animal’s behavioral response to competing mechanosensory stimuli in the the anterior and posterior soft touch receptor neurons. Responses to more than stimulus events from a range of anterior-posterior intensity combinations were measured. The animal’s probability of sprinting forward in response to a mechanosensory stimulus depended on both the anterior and posterior stimulation intensity, while the probability of reversing depended primarily on the posterior stimulation intensity. We also probed the animal’s response to mechanosensory stimulation during the onset of turning, a relatively rare behavioral event, by delivering stimuli automatically when the animal began to turn. Using this closed-loop approach, over stimulus events were delivered during turning onset at a rate of 9.2 events per worm-hour, a greater than 25-fold increase in throughput compared to previous investigations. These measurements validate with greater statistical power previous findings that turning acts to gate mechanosensory evoked reversals. Compared to previous approaches, the current system offers targeted optogenetic stimulation to specific body regions or behaviors with many-fold increases in throughput to better constrain quantitative models of sensorimotor processing.
Author summary
Targeting optogenetic stimulation to only specific body regions or during only specific behaviors is useful for dissecting the role of neurons and circuits underlying behavior in small transparent organisms like the nematode C. elegans. Existing methods, however, tend to be very low-throughput, which can pose challenges for acquiring sufficiently large datasets to constrain quantitative models of neural computations. Here we describe a method to deliver targeted illumination to many animals simultaneously at high throughput. We use this method to probe mechanosensory processing in the worm and we validate previous experiments with many-fold higher throughput, larger sample sizes and greater statistical power.
Introduction
How sensory signals are transformed into motor outputs is a fundamental question in systems neuroscience [1]. Optogenetics [2, 3] coupled with automated measures of behavior [4, 5] has emerged as a useful tool for probing sensorimotor processing, especially in small model organisms [6]. In optically transparent animals, such as C. elegans and Drosophila, such optogenetic manipulations can be performed non-invasively by illuminating an animal expressing light gated ion channels [7, 8]. Optogenetically perturbing neural activity and observing behavior has been widely used to study specific neural circuits, such as those involved in chemotaxis [9, 10, 11, 12] (reviewed for Drosophila in [13]), olfaction [14], learning and memory [15, 16], and locomotion and escape [17, 18, 19, 20], to name just a few examples. In Drosophila, high throughput optogenetic delivery to behaving animals has been used to screen libraries of neural cell types and map out previously unknown relations between neurons and behavior [21].
Optogenetic investigations of neural circuits underlying behavior confront three technical challenges: the first is to deliver stimulation targeted only to the desired neuron or neurons; the second is to deliver the stimulus at the correct time in order to probe the circuit in a relevant state or behavioral context; and the third is to efficiently acquire enough observations of stimulus and response to draw meaningful conclusions. Existing methods each address some of these challenges, but not all three.
To stimulate only desired cells, the expression of optogenetic proteins is typically restricted to specific cells or cell-types [22, 23, 24]. If cell-specific genetic drivers are not readily available, then genetic specificity can be complemented with optical targeting. Patterned light from a projector, for example, can be used to illuminate only a subset of the cells expressing the optogenetic protein [25, 26]. For targeting behaving animals, real-time processing is also needed to track the animal and dynamically update the illumination pattern based on its movements [27, 28, 29, 30, 31, 32].
Closed-loop approaches are further needed to deliver a perturbation timed to a specific behavior. For example, delivering a perturbation triggered to the swing of an animal’s head has informed our understanding of neural mechanisms underlying thermotaxis [33] and chemotaxis [9]. The use of closed-loop stimulation triggered on behavior in C. elegans [34, 32], Drosophila [35] and mammals [36, 37] is part of a broader trend in systems neuroscience towards more efficient exploration of the vast space of possible neural perturbations [38, 39], especially during ethnologically relevant naturalistic behaviors [40].
Targeted and closed-loop illumination systems probe one animal at a time [27, 41, 9, 42, 32], or at most two [43]. This low throughput poses challenges for acquiring datasets with enough statistical power to constrain quantitative models of neural computation. To increase throughput, a separate body of work simultaneously measures behavior of populations of many animals in an arena, in order to amass thousands of animal-hours of recordings [44, 45, 46, 47]. Delivering spatially uniform optogenetic perturbations to such populations has helped constrain quantitative models of sensorimotor processing of chemotaxis and mechanosensation [11, 10, 48]. Because the entire body of every animal is illuminated, this approach relies entirely on genetics for targeting. Recent work has used stochastic spatially varying illumination patterns in open-loop from a projector [49] or cellphone [50] to probe the spatial dependence of optogenetic stimulation. But because these methods are open loop they cannot target stimulation specifically to any animal or body part. Instead they rely on after-the fact inspection of where their stimuli landed, decreasing throughput.
Here we demonstrate a closed-loop real-time targeting system for C. elegans that tackles all three challenges: targeting, closed-loop triggering and throughput. The system delivers targeted illumination to specified parts of the animal’s body, stimulus delivery can be be triggered automatically on behavior, and the system achieves a high throughput by tracking and independently delivering targeted stimuli to populations of animals simultaneously. We apply this system to the C. elegans mechanosensory circuit [51, 52] to characterize how competing stimuli in anterior and posterior mechanosensory neurons are integrated by downstream circuity. We also revisit our prior observation that turning behavior gates mechanosensory evoked reversals [48]. We deliver closed-loop stimulation triggered to the onset of turning to obtain a dataset with two-orders-of-magnitude more stimulus-events compared to that investigation. We use these measurements to validate our initial observation with greater statistical power.
Results
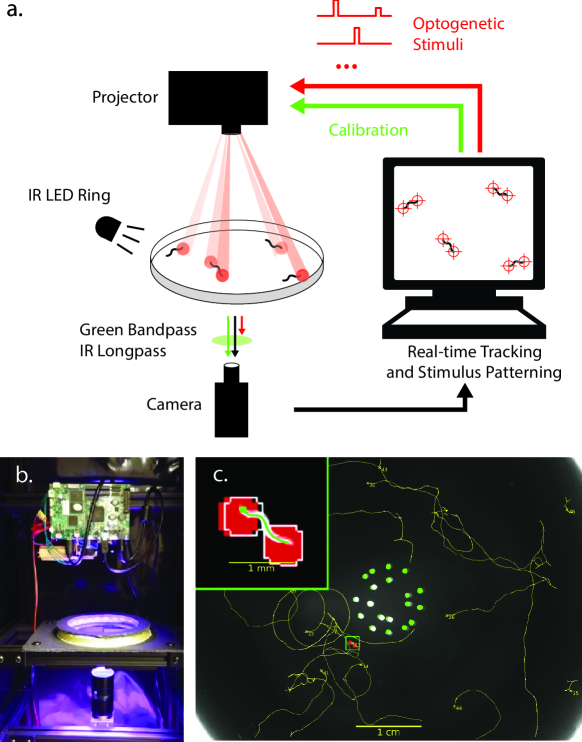
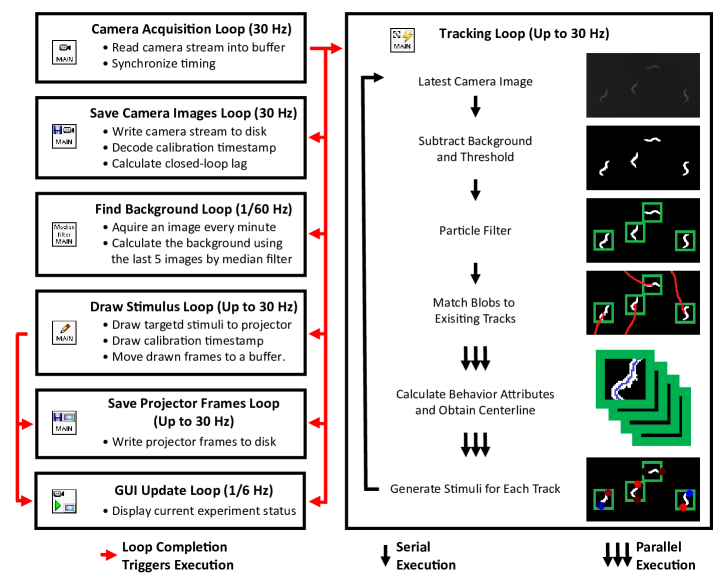
We developed a closed-loop targeted delivery system to illuminate specified regions in populations of C. elegans expressing the optogenetic protein Chrimson as the animals crawled on agar in a 9 cm dish. The system used red light (peak 630 nm) from a custom color projector made of an optical engine (Anhua M5NP) driven by a separate control board, described in methods. Animal behavior was simultaneously recorded from a CMOS camera, Figure 1a,b. Dark-field illumination from a ring of infrared LEDs (peak emission at 850 nm) was used to observe animal behavior because this avoided exciting Chrimson. Optical filters allowed the infrared illuminated behavior images to reach the camera, but blocked red or blue light coming from the projector. Green light from the projector was used to present visual timestamps and other spatiotemoporal calibration information to the camera. Custom real-time computer vision software monitored the pose and behavior of each animal and generated patterned illumination restricted to only specified regions of the animal, such as its head or tail, optionally triggered by the animal’s behavior, Figure 1c and Supplementary Video S1.
Anterior and posterior mechanosensory response
The mechanosensory response to anterior or posterior stimulation has been probed extensively by softly touching the animal with a hair [51, 53, 54], tapping the substrate on which the animal crawls [51, 55], automatically applying forces via micro-electromechanical force probes [56, 57, 58] or applying forces via a microfluidic device [59]. These approaches have identified dozens of genes related to touch sensation [60].
Mechanosensory responses have also been probed optogenetically by expressing light-gated ion channels in the six soft-touch mechanosenory neurons ALML, ALMR, AVM, PVM, PLML and PLMR [7]. Targeted illumination experiments showed that optogenetically stimulating posterior touch neurons PLML and PLMR was sufficient to elicit the animal to speed up or sprint and that stimulating anterior soft touch neurons (ALML, ALMR) or AVM was sufficient to induce the animal to move backwards in a reversal behavior [27, 28, 31]. Those experiments were conducted one worm-at-a time, to accommodate the patterned illumination systems that were needed to restrict illumination to only a portion of the animal. Here we revisit these experiments, this time by probing a population of animals simultaneously to achieve higher sample sizes.
We delivered 1 s of red light illumination to the head, tail, or both, of transgenic animals expressing the light-gated ion channel Chrimson in the six soft touch mechanosensory neurons (500 um diameter stimulus region, 30 s inter-stimulus interval.) Multiple combinations of illumination intensities were used, but here only the 80 uW/mm2 intensity stimuli are considered, Figure 2. The system independently tracked or stimulated an average of worms on a plate simultaneously (mean standard deviation), Supplementary Table S1.. Across four days, 95 plates were imaged using four identical instruments running in parallel, for a total of 31,761 stimulation-events across all stimulus intensity combinations. Of those, there were 7,125 stimulus-events with an illumination intensity of 80 uW/mm2, at least 1,500 stimulus events each of the following conditions: head illumination, tail illumination, both, or neither. For comparison, [27] used 14 stimulus events, a two-order of magnitude difference in sample size.
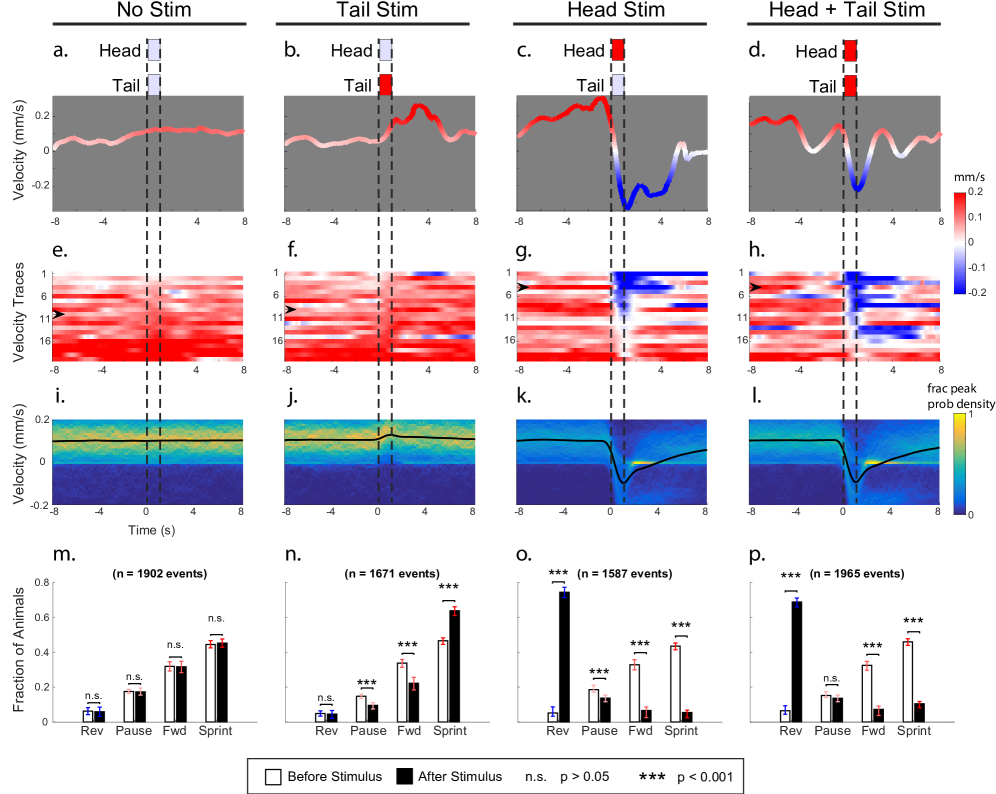
Consistent with prior reports, activating posterior mechanosensory neurons by delivering light to the tail resulted in an increase in sprints and an overall increase in average velocity (Figure 2 and Supplementary Video S3). Similarly, activating anterior mechanosensory neurons by delivering light to the head resulted in an increase in reversal events and a decrease in average velocity (Supplementary Video S4). Simultaneous stimulation to head and tail resulted an increase in reversals (Supplementary Video S5). Animals were classified as performing forward locomotion, pause, sprint or reversals, based on their velocity, Supplementary Figure S1. The animal showed little response to control conditions in which no light was delivered (Figure 2a,e,i,m and Supplementary Video S2), or in which the necessary co-factor all-trans retinal was withheld, Supplementary Figure S2.
We also stimulated a different strain of animals nominally of the same genotype that we had used previously, AML67, [48]. That strain had been constructed with a higher DNA plasmid concentration during microinjection (40 ng/ul for AML67, compared to 10 ng/ul for AML470 used above). The AML67 strain behaved the same on this instrument in response to simultaneous anterior and posterior stimulation as it had in [48]. It also exhibited reversals in response to anterior illumination, as expected, but surprisingly, it did not exhibit sprint behaviors in response to posterior illumination as AML470 did (Supplementary Figure S3). We suspect that some aspect resulting from the higher DNA plasmid injection concentration caused animals of this strain to behave differently during sprint behaviors.
Integration of conflicting anterior and posterior mechanosensory signals
Mechanosensory neurons act as inputs to downstream interneurons and motor neurons that translate mechanosensory signals into a behavioral response [52, 55, 61, 62, 20]. A growing body of evidence suggests that downstream circuitry relies on the magnitude of signals in both the anterior and posterior mechanosensory neurons to determine the behavioral response. For example, a plate tap activates both anterior and posterior mechanosensory neurons and usually elicits a reversal response [53, 55, 63, 48]. But the animal’s response to tap can be biased towards one response or another by selectively killing specific touch neurons via laser ablation [55]. For example, if ALMR alone is ablated, the animal is more balanced in its response and is just as likely to respond to a tap by reversing as it is by sprinting. If both ALML and ALMR are ablated the animal will then sprint the majority of the time [55]. Competing anterior-posterior optogenetic stimulation of the mechanosensory neurons also influences the animal’s behavioral response. For example, a higher intensity optogenetic stimulus to the anterior touch neurons is needed to evoke a reversal when the posterior touch neurons are also stimulated, compared to when no posterior stimulus is present [28].
To systematically characterize how anterior and posterior mechanosensory signals are integrated, we inspected the animal’s probability of exhibiting reverse, forward, pause or sprint behavior in response to 25 different combinations of head and tail light intensity stimuli, Figure 3a-d. This data is a superset of that shown in Figure 2. Here 31,761 stimulus-events are shown, corresponding to all 25 different conditions. Behavior is defined such that the animal always occupies one of four states: reverse, pause, forward or sprint, so that for a given stimulus condition, the four probabilities necessarily sum to one, Figure 3e.
To explore the dependence of the probability of evoking a given behavior on the anterior and posterior stimulus intensity, we fit planes to the probability surfaces and computed the gradient of the resulting plane, Figure 3,f. Fitting was performed using the method of least squares. The head and tail components of the gradient provide a succinct estimate of how the probability depends on either head or tail stimulus illumination intensity. For example, the probability of reversal depends strongly on the head stimulus intensity, as indicated by the large positive head component of the gradient. The probability of reversal also depends slightly on the tail stimulus intensity, consistent with [28], but we note this dependence was small and that the 95% confidence intervals of this dependence spanned the zero value. Of the four behaviors tested, only sprint behavior depended on both head and tail stimulation intensity such that the 95% confidence intervals of both components of their gradient excluded the value zero. Sprints occurred with highest probability at the highest tail illumination intensity when head illumination was zero. As head illumination increased, the probability of a sprint rapidly decreased. One interpretation of these measurements is that head induced reversals are less likely to be counteracted by a tail stimulation, than tail induced sprints are to be counteracted by head stimulation.
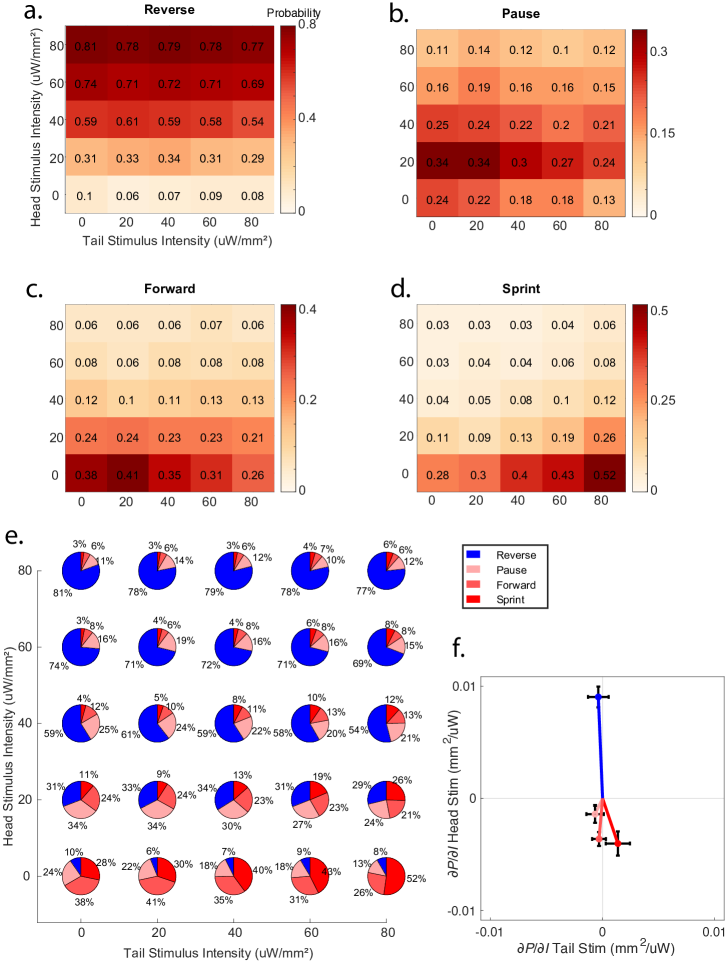
Taken together, we conclude that anterior and posterior mechanosensory signals are combined in a nontrivial way to determine the relative likelihood of different behavioral responses. For example, the animal’s decision to reverse in response to mechanosensory stimulation is primarily dependent on signals in anterior mechanosensory neurons with only minimal dependence on posterior mechanosensory neurons. In contrast, the animal’s decision to sprint is influenced more evenly by signals in both sets of neurons. This places constraints on any quantitative models of sensory integration performed by downstream circuitry.
Behavior-triggered stimulation increases throughput when investigating rare behaviors
C. elegans’ response to mechanosensory stimulation depends on its behavioral context. The probability that a tap or optogenetic mechanosensory stimulation evokes a reversal is higher when the stimulus occurs as the animal moves forward compared to if the stimulus occurs when the animal is in the midst of a turn, suggesting that the nervous system gates mechanosensory evoked responses during turns [48]. This was first observed in open-loop experiments in which the animal was stimulated irrespective of its behavior. Those experiments relied on identifying, after-the-fact, stimulus-events that arrived by chance during turning. Because turning events are brief and occur infrequently, it can be challenging to observe sufficient numbers of stimuli events delivered during turn onset using such an open-loop approach. For example, in that work only 15 optogenetic stimulus-events landed during turns. The animal’s spontaneous rate of turn initiation varies with the presence of food and other environmental conditions, but it has been reported to be approximately 0.03 Hz [64].
To obtain higher efficiency and throughput at probing the animal’s response to stimulation during turning, we delivered closed-loop stimulation automatically triggered on the onset of the animal’s turning behavior. Full-body red light illumination (1.5 mm diameter) was automatically delivered to animals expressing Chrimson in the soft-touch mechanosensory neurons (strain AML67, same as in [48]) when the real-time tracking software detected that the animal entered a turn. Turn onset was detected by monitoring the ellipse ratio of a binary image of the animal, as described in methods. A refractory period of 30 s was imposed to prevent the same turning event from triggering multiple stimuli and served to set a minimum inter-stimulus interval. 47 plates of animals were recorded for 30 mins each over three days, and on average, the system simultaneously tracked or stimulated 44.520 worms on a plate at any given time, Supplementary Table S1.. Three different stimulus intensities (0.5, 40 and 80 uW/mm2) and three different stimulus durations (1, 3 and 5 s) were explored, totaling 39,477 turn-triggered stimuli events, of which on post-processing analysis 9,774 or 24.8% passed our more stringent inclusion criteria for turn onset, worm validity and track stability, Table 1. To compare the closed- and open-loop approaches, 29 additional plates were stimulated in open loop over the same three day period.
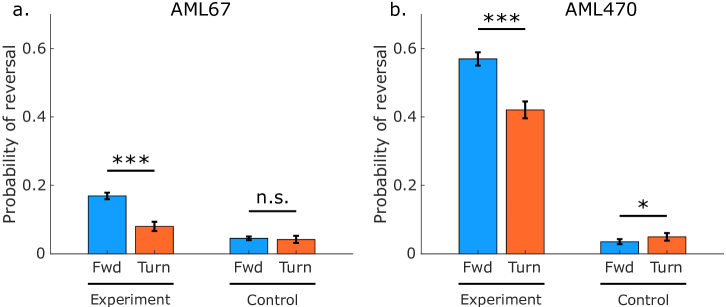
We compared the probability of reversing in response to closed-loop stimuli delivered during turn onset against the probability of reversing in response to open-loop stimuli delivered during forward locomotion, Figure 4a. For this analysis we considered only stimuli of 3 s duration and either 80 uW/mm2 or 0.5 uW/mm2 (control) illumination intensity, of which 2,999 stimulus-events were delivered during turn onset. Consistent with previous reports, the animal was significantly more likely to initiate a reversal in response to stimuli delivered during forward locomotion than during turning. We repeated this experiment in strain AML470. That strain was also statistically significantly more likely to reverse in response to stimuli delivered during forward locomotion than during turning, although interestingly the effect was less striking in this strain compared to AML67 even though animals were overall more responsive. By using a high throughput closed-loop approach we confirmed previous findings with larger sample size ( events compared to 15), and revealed subtle differences between two different strains with nominally identical genotypes.
Both throughput and efficiency are relevant for studying stimulus response during turning. Throughput refers to the number of stimuli delivered during turns per time. High throughput is needed to generate a large enough sample size in a reasonable enough amount time to draw statistically significant conclusions. Efficiency, or yield, refers to the fraction of delivered stimuli that were indeed delivered during turns. A high efficiency, or yield, is desired to avoid unwanted stimulation of the animal which can lead to unnecessary habituation.
We compared the throughput and efficiency of stimulating during turn onset with closed-loop stimulation to an open-loop approach on the same instrument using our same analysis pipeline and inclusion criteria, Table 1. Again we considered only stimuli delivered within a small 0.33 s window corresponding to our definition of the onset of turns, and applied in post-processing the same stringent inclusion criteria to both open-loop and closed-loop stimuli. Closed loop-stimulation achieved a throughput of 9.2 turn-onset associated stimulation events per worm hour, an order of magnitude greater than the 0.5 events per worm hour in open loop stimulation. Crucially, closed-loop stimulation was also more efficient, achieving a yield of 24.8%, nearly two orders of magnitude higher than the 0.4% open-loop yield. We reach similar conclusions by comparing to previous open-loop optogenetic experiments from [48] that had a longer inter-stimulus interval. Taken together, by delivering stimuli triggered on turns in a closed-loop fashion, we achieved higher throughput and efficiency than open-loop approaches.
| Ref. | Experiment Type | Plates |
|
|
|
|
Yield |
|
|||||||||||||
|---|---|---|---|---|---|---|---|---|---|---|---|---|---|---|---|---|---|---|---|---|---|
|
|
47 | 1,060 | 39,477 | 9,774 | 24.8% | 9.2 | ||||||||||||||
|
|
29 | 633 | 30 | 70,699 | 299 | 0.4% | 0.5 | |||||||||||||
| [48] |
|
12 | 260 | 60 | 2,487 | 15 | 0.6% | 0.35∗ |
Further characterization of the instrument
We sought to further characterize the system to better understand its capabilities and limitations, Figure 5. We quantified round-trip latency, prevalence of dropped frames, the spatial drift between camera and projector, and other key parameters that impact performance or resolution based on an analysis of the recordings in Figure 3 and Supplementary Figure S2.
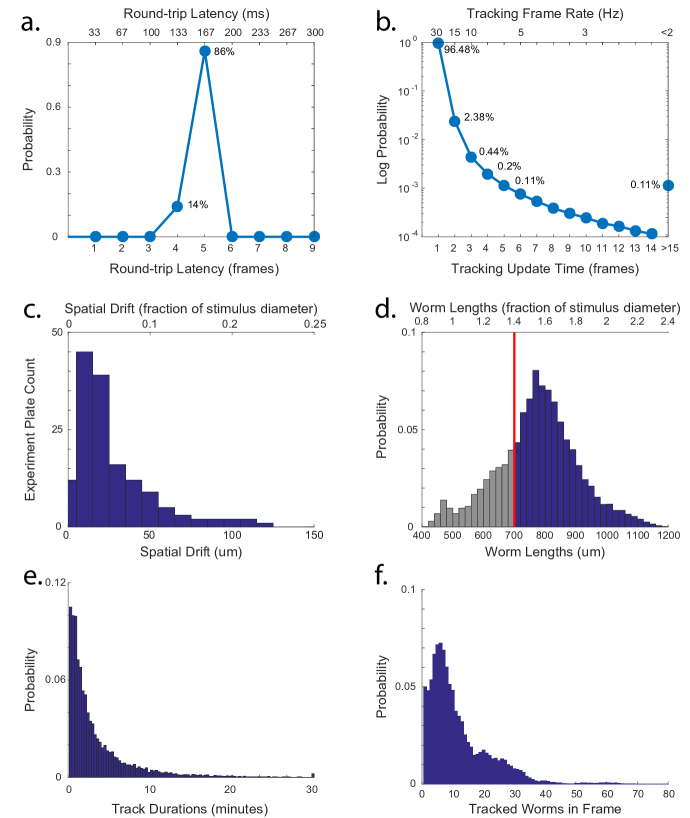
The round-trip latency between an animal’s movement and a corresponding change in illumination output based on that movement is a key determinant of system performance. If the latency is too high compared to the animal’s motion, the stimulus will arrive off-target. Round-trip latency is the cumulative delay from many steps including: exposing the camera, transferring camera images to memory, image processing, generating an illumination pattern, transferring the pattern to the projector and then ultimately adjusting micromirrors inside the projector to illuminate targeted regions of the animal. We constantly measured round-trip latency in real time by projecting a frame stamp visible to the camera using the projector’s green channel (green and dots arranged in a circle visible in the center of Figure 1c. They sometimes appear white in this visualization due to saturation.). The round-trip latency is the elapsed time between projecting a given frame stamp, and generating a new illumination pattern in response to the camera image containing that frame stamp. Median round-trip latency was 167 ms, Figure 5a. For a worm moving at a typical center-of-mass velocity of order 200 um/s this corresponds to a roughly 50 um bound on spatial resolution. This is more than sufficient for the 500 um diameter head-tail illuminations used here. But the latency for this system is notably longer than single-worm targeted illumination systems (e.g. 29 ms for [30]) and suggests that the current system is unlikely to be well-suited to target the dorsal versus ventral side of the animal, for example.
When a real-time tracking systems fails to keep pace with a stream of incoming images it may drop the processing of frames, resulting in a lower effective frame rate. The system records the acquisition time stamp of each camera frame that was successfully processed by the real-time tracker. Later, the system detects any frames that were dropped by inspecting gaps in these time stamps. 96.5% of the time the system achieved 30 Hz with no frame drops, Figure 5c. 99.9% of the time the system achieved a framerate above 2Hz, which we estimate is roughly the limit for resolving the head versus tail for a 1 mm worm moving at 200 um/s. When frames were dropped, the majority of time only one frame in a row was dropped (2.38% of all frames).
Spatial resolution relies on the alignment between the projector and the camera, but this alignment can shift during the course of a recording due to projector heating or other effects. We quantified the drift in alignment between projector and camera by comparing a calibration pattern projected onto the agar in the green channel at the beginning and end of each 30 min plate recording. For the majority of recordings, spatial drift was small, corresponding to less than 25 um, or less than 5% of the diameter of the head-tail stimulus, Figure 5c. Finally, we also report the number of simultaneously tracked worms, the duration for which they were tracked and the worms’ size for comparison, Figure 5d-f.
Discussion and Conclusions
The approach here dramatically improves throughput in two ways compared to previous methods. First, this work extends targeted illumination to many worms in parallel, providing an order of magnitude higher throughput per plate compared to previous single-worm methods capable of delivering optogenetic illumination targeted to different regions of the body [27, 28, 9]. Second, the method enables automatic stimulus delivery triggered on a behavior. For studying stimulus response during rare behaviors, like turns, this closed-loop approach provides higher throughput and efficiency compared to previous open-loop methods [48].
To achieve simultaneous independent targeting of many animals and tracking of behavior, we developed new algorithms, such as real-time centerline tracking algorithms, improved existing ones using parallelization and also leveraged advances in computing power. For example, we took advantage of the availability of powerful fast many-core CPUs, GPUs, multi-terabyte solid-state drives, and low-latency USB3 cameras.
To attain such high-throughput, the system also sacrifices some spatial resolution compared to previous single-worm approaches [27, 41, 9]. For example, the round-trip latency and observed drift in calibration places a roughly 100 um floor on our spatial resolution, which makes the system ill-suited for resolving individual neurons located close to one another. Nonetheless, this resolution is more than sufficient to selectively illuminate the head or tail of adult C. elegans, which allows for new types investigations. For example, we used the instrument to systematically probe anterior-posterior integration of mechanosensory signals for a range of competing stimuli intensities, delivering over stimulus-events in total. The sample size needed for such an experiment would be impractical with single-worm targeted illumination methods. And current genetic labeling approaches preclude this experiment from being conducted with non-targeted whole field-of-view illumination setups, such as in [48].
Our measurements suggest that the worms’ behavioral response to competing mechanosensory stimuli depends on integrating anterior and posterior mechanosensory signals in a non-trivial way. The probability of a sprint is influenced roughly evenly by signals in both anterior and posterior mechanosensory neurons, while the probability of reversing is primarily influenced by the anterior mechanosensory neurons. Overall, head stimuli that would induce reversals are less likely to be counteracted by a tail stimulation, than tail induced sprints are to be counteracted by head stimulation. The C. elegans response to anterior mechanosensory stimuli is an important part of the escape response [65] and helps the animal avoid predation by nematophagous fungi [66]. It is possible that the relative difficulty in disrupting head induced reversals compared to sprints reflects the relative importance of the role of the reversal in this escape behavior.
Here we used red illumination to excite Chrimson, but we note that the system can be trivially extended to independently deliver simultaneous red and blue light illumination [28], for example to independently activate two different opsins such as the excitatory red opsin Chrimson and the inhibitory blue opsin gtACR2 [67, 68]. Like other targeted illumination systems before it [27, 28], this system is not capable of targeting regions within the body when the animal touches itself, as often occurs during turning, or when coiling [69, 70]. This still permits probing the animal’s response to mechanosensory stimulation during turns because we were interested in whole-animal stimulation for those specific experiments, rather than targeting the head or tail. We note that our post-processing analysis does resolve the animal’s centerline even during self-touching [48], but that method is not currently suitable for real-time processing.
We investigated the response to stimulus during turning by delivering closed-loop stimuli automatically triggered on the turn. We achieved a more than 25-fold increase in throughput compared to a previous investigation [48] and similar order-of-magnitude increase compared to an open-loop approach implemented on the same instrument with the same analysis pipeline and inclusion criteria. The closed-loop functionality can be easily triggered on sprints or pauses or, in principal, even on extended motifs like an escape response. This high-throughput triggering capability may be useful for searching for long-lived behavior states, probing the hierarchical organizations of behavior [71], or exploring other instances of context-dependent sensory processing [48].
Materials and methods
Strains
Two strains were used in this work, AML67 and AML470, Table 2. A list of strains cross-referenced by figure is shown in Supplementary Table S1.. Both strains expressed the light gated ion channel Chrimson and a fluorescent reporter mCherry under the control of a mec-4 promoter, and differed mainly by the concentration of the Chrimson-containing plasmid used for injection. AML67 was injected with 40 ng/ul of the Chrimson-containing plasmid while AML470 was injected with 10 ng/ul. Specifically, to generate AML470, a plasmid mix containing 10 ng/ul of pAL::pmec-4::Chrimson::SL2::mCherry::unc-54 (RRID:Addgene_107745) and 100 ng/ul of pCFJ68 unc-122::GFP (RRID:Addgene_19325) were injected into CZ20310 [72] and then integrated via UV irradiation. Experiments were conducted with AML470 strains prior to outcrossing.
| Strain | RRID | Genotype | Notes | Ref |
|---|---|---|---|---|
| AML67 | RRID:WB-STRAIN:WBStrain00000193 | wtfIs46[pmec-4::Chrimson::SL2::mCherry::unc-54 40ng/ul] | 40 ng Chrimson injection | [48] |
| AML470 | juSi164 unc-119(ed3) III; wtfIs458 [mec-4::Chrimson4.2::SL2::mCherry::unc-54 10 ng/ul + unc-122::GFP 100 ng/ul] | 10 ng Chrimson injection | This work |
Instrument
Hardware
A CMOS camera (acA4112-30um, Basler) captured images of worms crawling on a 9 cm diameter agar plate at 30 frames per second, illuminated by a ring of 850 nm infrared LEDs, all housed in a custom cabinet made of 1 inch aluminum extrusions. To illuminate the worm, a custom projector was built by combining a commercial DMD-based light engine (Anhua M5NP, containing a Texas Instruments DLP4500) with a Texas Instrument evaluation control board (DLPLCR4500EVM). The light engine contained red, green and blue LEDs with peaks at 630 nm, 540 nm and 460 nm, respectively (Supplementary Figure S4). The projector cycles sequentially through patterns illuminated by red, green and then blue illumination once per cycle at up to 60 Hz and further modulates the perceived illumination intensity for each pixel within each color by fluttering individual mirrors with varying duty-cycles at 2.8 kHz. The system produced a small image (9 cm wide) from a short distance away (15 cm) such that a single element of the DMD projects light onto a roughly 85 um2 region of agar.
A light engine driven by a separate evaluation board was chosen instead of an all-in-one off-the-shelf projector because the API provided by the evaluation board allowed for more precise timing and control of all aspects of the illumination, including the relative exposure duration and bit-depth of the red, green and blue channels. For example, in this work only the red and green channels are used. So for these experiments the projector was programmed to update at 30 Hz and display a green pattern for 235 us (1 bit depth), followed by a red pattern for 33,098 us (8 bit depth) during each 30 Hz cycle. This choice of timing and bit depth maximizes the range of average intensities available in the red channel for optogenetic stimulation, while restricting the green channel to binary images sufficient for calibration. The choice of 30 Hz is optimized for the 30 Hz camera framerate. To avoid aliasing, camera acquisition was synchronized to the projector by wiring the camera trigger input to the green LED on the light engine. If both red and blue channels are to be used for optogenetic stimulation, a different set of timing parameters can be used.
It is desired that the animal perceives the illumination as continuous and not flickering. The inactivation time constant for Chrimson is 21.41.1 ms [73]. As configured, the 80 uW/mm2 illumination intensity generates a gap in red light illumination of only 235 us from cycle to cycle, well below Chrimson’s inactivation time constant. Therefore the animal will perceive the illumination as continuous. At 20 uW/mm2 the gap in illumination due to the temporal modulation of the micromirrors is nearly 25 ms, similar to the inactivation timescale. Intensities lower than this may be perceived as flickering. The only lower intensities used in this work were 0.5 uW/mm2, for certain control experiments. We were reassured to observe no obvious behavioral response of any kind to 0.5 uW/mm2 illumination, suggesting that in this case the animal perceived no stimulus at all.
A set of bandpass and longpass filters was used in front of the camera to block red and blue light from the projector while passing green light for calibration and IR light for behavior imaging. These were, in series, a 538/40 nm bandpass filter (Semrock, FF01-538/40-35-D), a 550 nm longpass filter (Schott, OG-550), and two color photography filters (Roscolux #318). A 16 mm c-mount lens (Fujinon, CF16ZA-1S) and spacer (CMSP200, Thorlabs) was used to form an image. Barrel distortion is corrected in software.
A PC with a 3.7 GHz CPU (AMD 3970x) containing 32 cores and a GPU (Quadro P620, Nvidia) controlled the instrument and performed all real-time processing. A 6 TB PCIe solid-state drive provided fast writeable storage on which to store high resolution video streams in real-time, Table 3. Images from the camera arrived via USB-C. Drawings were sent to the projector’s evaluation board via HDMI.
A complete parts list is provided in Supplementary Table 2., and additional details are described in [74].
| Video Stream | Resolution | Format | Bandwidth (MB/s) | ||
| Camera video in (real-time) | 2048x1504 @ 30Hz | 8-bit monochrome via USB-C | 85.3 | ||
| Camera video saved (real-time) | 2048x1504 @ 30Hz | 8-bit monochrome TIFF | 85.3 | ||
| Camera video compressed (post-processing) | 2048x1504 @ 30Hz | 8-bit monochrome HEVC | 0.102 | ||
| Projector video out (real-time) | 912x1140 @ 60Hz | 8-bit RGB* via HDMI | 178 | ||
| Projector Video Saved (real-time) | 912x570 @ 30Hz | 8-bit RGB TIFF | 44.5 | ||
|
2048x1504 @ 30Hz | 8-bit RGB PNG | 0.353 |
*The green channel is actually displayed as binary since it is only used for calibration. Single color experiments in red or blue can achieve 8-bit color resolution but runs at 30 Hz. For experiments with both red and blue, the projector can only simultaneously decode 7-bits of color resolution for each channel but it runs at 60 Hz.
Real-time software
Custom LabVIEW software was written to perform all real-time image processing and to control all hardware. Software is available at https://github.com/leiferlab/liu-closed-loop-code. The LabVIEW software is described in detail in [74]. The software is composed of many modules, summarized in Figure 6. These modules run separately and often asynchronously to acquire images from the camera, track worms, draw new stimuli, communicate with the projector and update a GUI shown in Figure 7. The software was designed with parallel processing in mind and contains many parallel loops that run independently to take advantage of the multiple cores.

Camera images and drawn projector images are both saved to disk in real-time as TIFF images, Table 3. In post-processing, they are compressed and converted to H.265 HEVC videos using the GPU.
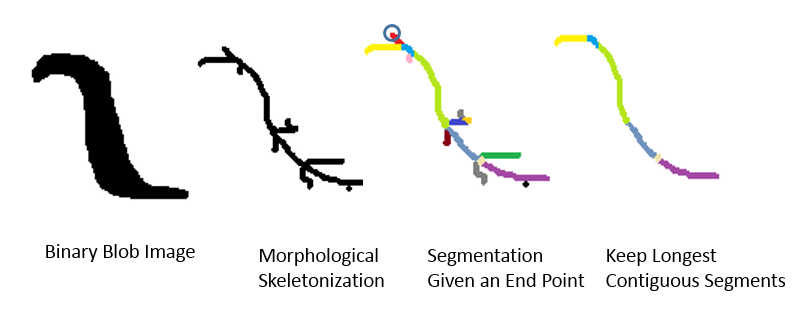
A critical task performed by the software is to track each animals’ centerline in real-time so that targeting can be delivered to different regions of the animal. Many centerline algorithms have been developed [47], including some that can operate on a single animal in real-time, e.g. [27]. The existing algorithms we tested were too slow to run simultaneously on the many animals needed here. Instead we developed a two pass recursive algorithm that is fast and computationally efficient, Figure 8. An image of the worm is binarized and then skeletonized through morphological thinning. Then, in the first pass, the skeleton is traversed recursively to segment all of the distinct branch points in the skeleton. Then in a second pass, the path of the centerline is found by recursively traversing all sets of contiguous segments to identify the longest contiguous path. The longest contiguous path is resampled to 20 points and reported as the centerline. Further details are described in [74].
From the animal’s centerline, other key attributes are calculated in real-time, including the animal’s velocity and eccentricity which are used to determine whether the animal is turning. The software also stitches together images of worms into tracks, using methods adopted from the Parallel Worm Tracker[75] and described in [48] and [74]. To identify the head or tail in real-time, the software assumes that the worm cannot go backwards for more than 10 s, and so the direction of motion for greater than 10 s indicates the orientation of the head.
Registration and Calibration
Te generate a map between locations in a camera image and locations on the agar, images are acquired of a calibration grid of dots. A transformation is then generated that accounts for barrel distortion and other optical aberrations.
To generate a map between the projector mirrors and the image viewed by the camera, the projector draws a spatial calibration pattern in the green channel before each recording. This projector-generated pattern is segmented in software and automatically creates a mapping between projector and camera image. The calibration is also performed at the end of each recording to quantify any drift that occurred between projector and camera during the course of the recording.
To provide temporal calibration and to quantify round-trip latency, a visual frame stamp is projected in the green channel for every frame. The time-stamp appears as a sequence of dots arranged in a circle, each dot representing one binary digit. Any worms inside the circle are all excluded from analysis. Illumination intensity measurements were taken using a powermeter.
Behavior Analysis
After images have been compressed in HEVC format, data is sent to Princeton University’s high performance computing cluster, Della, for post-processing and data analysis. Custom MATLAB scripts based on [48] inspect and classify animal behavior. For example, the real-time centerline algorithm fails when the animal touches itself. Therefore, when analyzing behavior after the fact, a slower centerline algorithm [76], as implemented in [48], is run to track the centerline even through self-touches.
The animal’s velocity is smoothed with 1 s boxcar window and used to define behavior states for the experiments in Figures 2 and 3 according to equal area cutoffs shown in Supplementary Figure S1.
The turning investigation in Figure 4 uses the behavior mapping algorithms from [48] which in turn are based on an approach first described in [77]. The mapping approach classifies the behavior state that the animal occupies at each instance in time. In many instances the classification system decides that the worm is not in a stereotyped behavior, and therefore it declines to classify the behavior. We inspect even the unclassfied behaviors and classify the animal as turning if a) the behavior mapping algorithm from [48] defines it as a turn, or b) if the behavior mapping algorith classifies it as a non-stereotyped behavior that has an eccentricity ratio less than 3.6. In this way we rescue a number of instances of turning that had been overlooked. For turning experiments in Figure 4 additional criteria are also used to determine whether a stimulus landed during the turning onset, and to classify the animal’s behavioral response, as described below.
Nematode handling
Worm preparation was similar to that in [48]. To obtain day 2 adults, animals were bleached four days prior to experiment. To obtain day 1 adults, animals were bleached three days prior to experiments. For optogenetic experiments, bleached worms were placed on plates seeded with 1 ml of 0.5 mM all-trans-retinal (ATR) mixed with OP50 E. coli. Off-retinal control plates lacked ATR. Animals were grown in the dark at 20 C.
To harvest worms for high-throughput experiments, roughly 100 to 200 worms were cut from agar, washed in M9 and then spun-down in a 1.5 ml micro centrifuge tube. For imaging, four small aliquots of worms in M9 were deposited as droplets on the cardinal directions at the edge of the plate. Each droplet typically contained at least 10 worms for a total of approximately 30-50 worms. The droplet was then dried with a tissue.
Anterior vs posterior stimulation experiments
Day 2 adults were used. Every 30 seconds, each tracked animal was given a 500 um diameter red light stimulation to either the head, tail, or both simultaneously. The illumination spot was centered on the tip of the head or tail respectively. The stimulus intensity was randomly drawn independently for the head and the tail from the set of 0, 20, 40, 60 and 80 uW/mm2 intensities.
To calculate the probability of a reversal response for Figure 3, we first record the animal’s behavior 1 second prior to the stimulation to account for any effect the 1 second smoothing window may have on the annotation. Then, for a total of 2 seconds, one second before stimulation and one second during stimulation, we determine if the animal changes behavioral states. The behavioral response is determined to be the most extreme response the animal has in this 2 second time window as compared to the animal’s starting behavior, and it needs to be sustained for more than 0.5 seconds. Note this response may not be the first behavior the animal transitions to, because a paused animal neesd to go through the forward behavior state before it can enter sprint.
Mechanosensory evoked response during turning vs forward locomotion
Open-loop whole-body illumination experiments
Day 1 adults were used. Every 30 s, each tracked worm received a 3 s duration 1.5 mm diameter red light illumination spot centered on its body with illumination intensity randomly selected to be either 80 uW/mm2 or 0.5 uW/mm2. For a subset of plates additional illumination intensities were also used, and/or 1 s and 5 s stimulus duration were also used, but those stimulus events were all excluded from analysis in Figure 4. But stimuli of all intensities and duration were counted for the purposes of throughput calculations in Table 1, so long as they passed our further criteria for turning onset, worm validity and track stability described in the next section.
Open-loop stimulation was used to study response to stimulation of animals during forward locomotion. Therefore only stimulus events that landed when the animal exhibited forward locomotion were included. Forward locomotion was defined primarily by the behavior mapping algorithm, but we also required agreement with our turning onset-detection algorithm, described below.
During post-processing, the following worm stimulation events were excluded from analysis based on track stability and worm validity: Instances in which tracking was lost or the worm exited the field of view 17 seconds before or during the stimulus; instances when the worm collided with another worm before, during, or immediately after stimulation; or stimulations to worms that were stationary, exceedingly fat, oddly shaped, or were shorter than expected (less than 550 um for these experiments).
Closed-loop turn-triggered whole-body illumination experiments
Whenever the real-time software detected that a tracked worm exhibited the onset of a turn, it delivered 3 s of 1.5mm diameter red light illumination centered on the worm with an intensity randomly selected to be either 80 uW/mm2 or 0.5 uW/mm2. A refractory period was imposed to prevent the same animal from being stimulated twice in less than a 30 s interval.
Stimulus delivery was triggered by real-time detection of turning onset by triggering on instances when the ellipsoid ratio of the binarized image of the worm crossed below 3.5. During post-processing, a more stringent set of criteria was applied. To be considered a turn onset, the stimulus was required to land also when the improved behavior mapping pipeline considered the animal to be in a turn. We also required that the stimuli did indeed fall within a 0.33 s window immediately following the ellipse ratio crossing, to account for possible real-time processing errors. We had also observed some instances when tail bends during reversals were incorrectly categorized as turning onset events. We therefore required that turn onsets occur only when the velocity was above -0.05 mm/s in a 0.15 s time window prior to stimulus onset. Finally, the same exclusion criteria regarding worm validity and tracking stability from the open-loop whole-body illumination experiments were also applied.
Calculating probability of reversals
To be classified as exhibiting a reversal in response to a stimulation for experiments shown in Figure 4, the animal’s velocity must decrease below -0.1 mm/s at least once during the 3 s window in which the stimulus is delivered.
Source code
All software are available at https://github.com/leiferlab/liu-closed-loop-code including: real-time instrument control software written in LABVIEW, post-processing behavior analysis written in MATLAB, and experiment-specific analysis scripts written in MATLAB.
Datasets
Datasets for all recordings in this work (Supplementary Table S1.) are being deposited in the IEEE DataPorts public repository, DOI:10.21227/t6b0-bc36, https://dx.doi.org/10.21227/t6b0-bc36.
Supplementary Figures, Tables and Videos
Supplementary Figure S1
![[Uncaptioned image]](/html/2109.05303/assets/Figures_used/AML470_5stimexps_velocity_thesholds_hires.png)
Classifying behavior by velocity distribution. For the analyses performed in Figures 2 and 3, we classify animal behavior to be one of four states using the velocity distribution aggregated from both (+)ATR and (-)ATR head/tail stimulation experiments conducted with AML470. The “Reverse” state has a velocity of less than 0. The three states with positive velocity are divided so they are equally likely. The slowest state is “Pause.” The middle state is “Forward,”and the fastest state is ”Sprint”.
Supplementary Figure S2
![[Uncaptioned image]](/html/2109.05303/assets/x7.png)
Animals that lack the necessary co-factor all-trans-retinal do not exhibit a behavioral response. AML470 worms grown (-)ATR. The fraction of animals belonging to behavioral states segmented by velocity before and after each stimulus condition: a no stimulus, b tail only stimulus, c head only stimulus, and d combined head and tail stimulus. The before time point is taken 2 seconds prior to the stimulus onset, and the after time point is taken at the end of the 1 second stimulation. Significance between before and after is determined by p-values calculated using Wilcoxon rank-sum test. The significance test does not correct for multiple hypothesis testing. Error bars represents 95% confidence intervals estimated using 1000 bootstraps.
Supplementary Figure S3
![[Uncaptioned image]](/html/2109.05303/assets/x8.png)
Strain AML67 exhibits unexpected response to optogenetic stimulation of posterior mechanosensory neurons. Anterior targeted stimuli evoke reversals but posterior stimuli unexpectedly reduce sprints for worms expressing Chrimson in the soft touch mechanosensory neurons in this strain. Strain AML67 grown on retinal (+)ATR. a-d) Select single animal velocity in response to no stimulation, tail only stimulation, head only stimulation, and combined head and tail stimulation respectively. Dotted lines denote the onset and termination of stimulation. The stimulus is a 1 second long 0.5mm diameter circular dot centered at the tip of the animal’s head and/or tail with a red intensity of 80 uW/mm2. e-h) Randomly selected velocity traces for 20 animals in each stimulus condition are color coded red/blue. The traces are sorted by the mean velocity during the 1 second stimulation window. The arrow indicates the selected velocity trace shown in the corresponding column in a-d. i-l) Probability density of all tracked velocities for each stimulus condition. The mean velocity at any given time is overlaid as the black line. The number of stimuli events for this condition are shown below. m-p) The fraction of animals belonging to behavioral states segmented by velocity before and after each stimulus condition. The before time point is taken 2 seconds prior to the stimulus onset, and the after time point is taken at the end of the 1 second stimulation. Significance between before and after is determined by p-values calculated using Wilcoxon rank-sum test. Error bars represents 95% confidence intervals estimated using 1000 bootstraps.
Supplementary Figure S4
![[Uncaptioned image]](/html/2109.05303/assets/x9.png)
Spectral properties of light sources. Emission spectra are shown for the the projector’s a) red b) green and c) blue channels and d) the IR LED ring.
Supplementary Table S1.
List of all recordings in this work.
![[Uncaptioned image]](/html/2109.05303/assets/x10.png)
Supplementary Table 2.
Hardware Partslist. Hardware parts list for the instrument. The frame is made from 1 inch aluminum extrusions and are not included. The unit count is for each instrument.
| Manufacturer | Item | Model/Parts No. | Units | Notes | ||||||
|---|---|---|---|---|---|---|---|---|---|---|
| Camera | ||||||||||
| Basler | Camera | acA4112-30um | 1 | |||||||
| Basler | USB Cable | Basler 2000035994 | 1 | |||||||
| Basler |
|
Basler 2200000191 | 1 | |||||||
| Basler |
|
Basler 2000029411 | 1 | |||||||
| Lens And Filter | ||||||||||
| Fujinon |
|
CF16ZA-1S | 1 | |||||||
| Edmund Optics | M37.5 x 0.5 Empty Filter Mount | 67-684 | 1 | |||||||
| Thorlabs | C-Mount Spacer Ring, 2.00 mm Thick | CMSP200 | 1 | |||||||
| Semrock |
|
FF01-538/40-35-D | 1 |
|
||||||
| SCHOTT | OG-550, 50.8mm Sq., Longpass Filter | OG-550 | 1 | |||||||
| Roscolux |
|
39-418 | 1 |
|
||||||
| Projector | ||||||||||
| Anhua |
|
M5NP | 1 | |||||||
| Wintech |
|
LCR4500 VIS KIT | 1 | |||||||
| Kaga Electronics USA | AC/DC DESKTOP ADAPTER 12V 84W | KTPS90-1207 | 1 | |||||||
| Tripp Lite | 6’ USB A TO MINI-B CABLE M/M | UR030-006 | 1 | |||||||
| Tripp Lite | HDMI TO MINI HDMI CABLE 6’ | P571-006-MINI | 1 | |||||||
| CNC Tech |
|
800-18-39B-BL-0006F | 1 | |||||||
| Molex |
|
874210000 | 50 | |||||||
| Molex |
|
87439-0900 | 1 | |||||||
| Molex |
|
87439-0600 | 3 | |||||||
| Molex | Fan connector | 51021-0300 | 1 | |||||||
| Molex | Fan and optical module terminal crimp | 50079-8100 | 20 | |||||||
| Molex |
|
51021-0600 | 3 | |||||||
| Foxconn | Fan | PVA030E12M | 1 | |||||||
| IR Ring | ||||||||||
| LightingWill |
|
B01DM9BL5I | 1 | |||||||
| DROK |
|
90483 | 1 | |||||||
| CENTROPOWER |
|
CT-DCCORD | 1 | |||||||
| Marshall |
|
”0609722158497” | 1 | |||||||
| TDK-Lambda Americas | AC/DC CONVERTER 24V 27A 600W | 285-1742-ND | 1 | |||||||
| LE PAON |
|
4336933944 | 1 |
|
||||||
| Thorlabs |
|
TB4 | 1 | |||||||
| Computer | ||||||||||
| Origin PC |
|
L-Class | 1 | |||||||
| Sabrant |
|
SB-ROCKET-2TB | 4 |
Supplementary Video S1
Video shows excerpt from recording of animals (AML470) crawling on plate and undergoing head and tail stimulation. Yellow numbered ‘x’ indicates a tracked animal, and its track is shown in yellow. Green inset shows a single tracked individual in detail. Green dot indicates the animal’s head. Its centerline is shown in green. Tracked animals’ heads and tails are occasionally stimulated at various intensities, indicated by red. The dynamic circular pattern in the center of the screen is the visual time stamp projected by the projector and is used for temporal calibration.
Supplementary Video S2
Example responses to control illumination (0 uW/mm2). Strain AML470. The instrument performs all real-time processing to illuminate the head and the tail of each animal for 1 s, but no light is actually delivered to the animal. Targeted regions are shown in light blue. 20 stimulation-events are shown corresponding to the 20 randomly selected stimulation events shown in Figure 2e. The animal with the yellow square corresponds to the stimulation event shown in Figure 2a and denoted with an arrow in Figure 2e. The animal’s centerline is shown in green. The head of the animal is denoted with a green circle. Note the field of view is centered on each animal, so the animal may be moving even though it never exits the field of view.
Supplementary Video S3
Example responses to tail illumination (80 uW/mm2). Posterior mechanosensory neurons are activated by illuminating the tail of animals expression Chrimson int he soft touch mechanosensory neurons (strain AML470). Illumination is indicated by red circles. 20 stimulation-events are shown corresponding to the 20 randomly selected stimulation events shown in Figure 2f. The animal with the yellow square corresponds to the stimulation event shown in Figure 2b and denoted with an arrow in Figure 2f. The animal’s centerline is shown in green. The head of the animal is denoted with a green circle. Note the field of view is centered on each animal, so the animal may be moving even though it never exits the field of view.
Supplementary Video S4
Example responses to head illumination (80 uW/mm2). Similar to Supplementary Video S3. 20 stimulation-events are shown corresponding to the 20 randomly selected stimulation events shown in Figure 2g. The animal with the yellow square corresponds to the stimulation event shown in Figure 2c.
Supplementary Video S5
Example responses to simultaneous head and tail illumination (80 uW/mm2). Similar to Supplementary Video S3. 20 stimulation-events are shown corresponding to the 20 randomly selected stimulation events shown in Figure 2h. The animal with the yellow square corresponds to the stimulation event shown in Figure 2d.
Acknowledgments
Plasmid pCFJ68 was a gift from Erik Jorgensen (University of Utah). We thank Chaogu Zheng (University of Hong Kong) for productive discussions. This work used computing resources from the Princeton Institute for Computational Science and Engineering. Research reported in this work was supported by the Simons Foundation under award SCGB #543003 to AML; and by the National Science Foundation, through an NSF CAREER Award to AML (IOS-1845137) and through the Center for the Physics of Biological Function (PHY-1734030); and by the National Institute of Neurological Disorders and Stroke of the National Institutes of Health under New Innovator award number DP2-NS116768 to AML. Strains from this work are being distributed by the CGC, which is funded by the NIH Office of Research Infrastructure Programs (P40 OD010440). The content is solely the responsibility of the authors and does not represent the official views of any funding agency.
References
- 1. Clark D, Freifeld L, Clandinin T. Mapping and Cracking Sensorimotor Circuits in Genetic Model Organisms. Neuron. 2013;78(4):583–595. doi:10.1016/j.neuron.2013.05.006.
- 2. Boyden E. A history of optogenetics: the development of tools for controlling brain circuits with light. F1000 Biology Reports. 2011;3. doi:10.3410/B3-11.
- 3. Fenno L, Yizhar O, Deisseroth K. The development and application of optogenetics. Annual Review of Neuroscience. 2011;34:389–412. doi:10.1146/annurev-neuro-061010-113817.
- 4. Datta SR, Anderson DJ, Branson K, Perona P, Leifer A. Computational Neuroethology: A Call to Action. Neuron. 2019;104(1):11–24. doi:10.1016/j.neuron.2019.09.038.
- 5. Pereira TD, Shaevitz JW, Murthy M. Quantifying behavior to understand the brain. Nature Neuroscience. 2020;23(12):1537–1549. doi:10.1038/s41593-020-00734-z.
- 6. Calhoun AJ, Murthy M. Quantifying behavior to solve sensorimotor transformations: advances from worms and flies. Current Opinion in Neurobiology. 2017;46:90–98. doi:10.1016/j.conb.2017.08.006.
- 7. Nagel G, Brauner M, Liewald JF, Adeishvili N, Bamberg E, Gottschalk A. Light Activation of Channelrhodopsin-2 in Excitable Cells of Caenorhabditis elegans Triggers Rapid Behavioral Responses. Current Biology. 2005;15(24):2279–2284. doi:10.1016/j.cub.2005.11.032.
- 8. Leifer AM. Optogenetics and Computer Vision for C. elegans Neuroscience and Other Biophysical Applications [Thesis]. Harvard University. Cambridge, MA, USA; 2012. Available from: http://nrs.harvard.edu/urn-3:HUL.InstRepos:9276708.
- 9. Kocabas A, Shen CH, Guo ZV, Ramanathan S. Controlling interneuron activity in Caenorhabditis elegans to evoke chemotactic behaviour. Nature. 2012;490(7419):273–277. doi:10.1038/nature11431.
- 10. Hernandez-Nunez L, Belina J, Klein M, Si G, Claus L, Carlson JR, et al. Reverse-correlation analysis of navigation dynamics in Drosophila larva using optogenetics. eLife. 2015;4. doi:10.7554/eLife.06225.
- 11. Gepner R, Skanata MM, Bernat NM, Kaplow M, Gershow M. Computations underlying Drosophila photo-taxis, odor-taxis, and multi-sensory integration. eLife. 2015;4:e06229. doi:10.7554/eLife.06229.
- 12. Schulze A, Gomez-Marin A, Rajendran VG, Lott G, Musy M, Ahammad P, et al. Dynamical feature extraction at the sensory periphery guides chemotaxis. eLife. 2015;4:e06694. doi:10.7554/eLife.06694.
- 13. Calabrese RL. In search of lost scent. eLife. 2015;4:e08715. doi:10.7554/eLife.08715.
- 14. Gordus A, Pokala N, Levy S, Flavell SW, Bargmann CI. Feedback from network states generates variability in a probabilistic olfactory circuit. Cell. 2015;161(2):215–227. doi:10.1016/j.cell.2015.02.018.
- 15. Claridge-Chang A, Roorda RD, Vrontou E, Sjulson L, Li H, Hirsh J, et al. Writing memories with light-addressable reinforcement circuitry. Cell. 2009;139(2):405–415. doi:10.1016/j.cell.2009.08.034.
- 16. Cho CE, Brueggemann C, L’Etoile ND, Bargmann CI. Parallel encoding of sensory history and behavioral preference during Caenorhabditis elegans olfactory learning. eLife. 2016;5. doi:10.7554/eLife.14000.
- 17. Wen Q, Po MD, Hulme E, Chen S, Liu X, Kwok S, et al. Proprioceptive Coupling within Motor Neurons Drives C. elegans Forward Locomotion. Neuron. 2012;76(4):750–761. doi:10.1016/j.neuron.2012.08.039.
- 18. Donnelly JL, Clark CM, Leifer AM, Pirri JK, Haburcak M, Francis MM, et al. Monoaminergic Orchestration of Motor Programs in a Complex C. elegans Behavior. PLoS Biology. 2013;11(4):e1001529. doi:10.1371/journal.pbio.1001529.
- 19. Kato S, Kaplan HS, Schrödel T, Skora S, Lindsay TH, Yemini E, et al. Global brain dynamics embed the motor command sequence of Caenorhabditis elegans. Cell. 2015;163(3):656–669. doi:10.1016/j.cell.2015.09.034.
- 20. Wang Y, Zhang X, Xin Q, Hung W, Florman J, Huo J, et al. Flexible motor sequence generation during stereotyped escape responses. eLife. 2020;9:e56942. doi:10.7554/eLife.56942.
- 21. Cande J, Namiki S, Qiu J, Korff W, Card GM, Shaevitz JW, et al. Optogenetic dissection of descending behavioral control in Drosophila. eLife. 2018;7:e34275. doi:10.7554/eLife.34275.
- 22. Boulin T. Reporter gene fusions. In: elegans Research Community TC, editor. WormBook; 2006.Available from: http://www.wormbook.org/chapters/www_reportergenefusions/reportergenefusions.html.
- 23. Pfeiffer BD, Jenett A, Hammonds AS, Ngo TTB, Misra S, Murphy C, et al. Tools for neuroanatomy and neurogenetics in Drosophila. Proceedings of the National Academy of Sciences. 2008;105(28):9715–9720. doi:10.1073/pnas.0803697105.
- 24. Jenett A, Rubin GM, Ngo TTB, Shepherd D, Murphy C, Dionne H, et al. A GAL4-Driver Line Resource for Drosophila Neurobiology. Cell Reports. 2012;2(4):991–1001. doi:10.1016/j.celrep.2012.09.011.
- 25. Guo ZV, Hart AC, Ramanathan S. Optical interrogation of neural circuits in Caenorhabditis elegans. Nature methods. 2009;6(12):891–896. doi:10.1038/nmeth.1397.
- 26. Wyart C, Del Bene F, Warp E, Scott EK, Trauner D, Baier H, et al. Optogenetic dissection of a behavioural module in the vertebrate spinal cord. Nature. 2009;461(7262):407–410. doi:10.1038/nature08323.
- 27. Leifer AM, Fang-Yen C, Gershow M, Alkema MJ, Samuel ADT. Optogenetic manipulation of neural activity in freely moving Caenorhabditis elegans. Nature Methods. 2011;8(2):147–152. doi:10.1038/nmeth.1554.
- 28. Stirman JN, Crane MM, Husson SJ, Wabnig S, Schultheis C, Gottschalk A, et al. Real-time multimodal optical control of neurons and muscles in freely behaving Caenorhabditis elegans. Nature methods. 2011;8(2):153–158. doi:10.1038/nmeth.1555.
- 29. Bath DE, Stowers JR, Hörmann D, Poehlmann A, Dickson BJ, Straw AD. FlyMAD: rapid thermogenetic control of neuronal activity in freely walking Drosophila. Nature Methods. 2014;11(7):756–762. doi:10.1038/nmeth.2973.
- 30. Shipley FB, Clark CM, Alkema MJ, Leifer AM. Simultaneous optogenetic manipulation and calcium imaging in freely moving C. elegans. Frontiers in Neural Circuits. 2014;8. doi:10.3389/fncir.2014.00028.
- 31. Porto DA, Giblin J, Zhao Y, Lu H. Reverse-Correlation Analysis of Mechanosensation Circuit in C. elegans Reveals Temporal and Spatial Encoding. bioRxiv. 2017;doi:10.1101/147363.
- 32. Dong X, Kheiri S, Lu Y, Xu Z, Zhen M, Liu X. Toward a living soft microrobot through optogenetic locomotion control of Caenorhabditis elegans. Science Robotics. 2021;6(55). doi:10.1126/scirobotics.abe3950.
- 33. Stephens GJ, Johnson-Kerner B, Bialek W, Ryu WS. Dimensionality and Dynamics in the Behavior of C. elegans. PLoS Computational Biology. 2008;4(4):e1000028. doi:10.1371/journal.pcbi.1000028.
- 34. Faumont S, Rondeau G, Thiele TR, Lawton KJ, McCormick KE, Sottile M, et al. An Image-Free Opto-Mechanical System for Creating Virtual Environments and Imaging Neuronal Activity in Freely Moving Caenorhabditis elegans. PLoS ONE. 2011;6(9):e24666. doi:10.1371/journal.pone.0024666.
- 35. Musso PY, Junca P, Jelen M, Feldman-Kiss D, Zhang H, Chan RC, et al. Closed-loop optogenetic activation of peripheral or central neurons modulates feeding in freely moving Drosophila. eLife. 2019;8:e45636. doi:10.7554/eLife.45636.
- 36. Adamantidis AR, Tsai HC, Boutrel B, Zhang F, Stuber GD, Budygin EA, et al. Optogenetic Interrogation of Dopaminergic Modulation of the Multiple Phases of Reward-Seeking Behavior. Journal of Neuroscience. 2011;31(30):10829–10835. doi:10.1523/JNEUROSCI.2246-11.2011.
- 37. O’Connor DH, Hires SA, Guo ZV, Li N, Yu J, Sun QQ, et al. Neural coding during active somatosensation revealed using illusory touch. Nature Neuroscience. 2013;16(7):958–965. doi:10.1038/nn.3419.
- 38. Clancy KB, Koralek AC, Costa RM, Feldman DE, Carmena JM. Volitional modulation of optically recorded calcium signals during neuroprosthetic learning. Nature Neuroscience. 2014;17(6):807–809. doi:10.1038/nn.3712.
- 39. Grosenick L, Marshel JH, Deisseroth K. Closed-loop and activity-guided optogenetic control. Neuron. 2015;86(1):106–139. doi:10.1016/j.neuron.2015.03.034.
- 40. Krakauer JW, Ghazanfar AA, Gomez-Marin A, MacIver MA, Poeppel D. Neuroscience Needs Behavior: Correcting a Reductionist Bias. Neuron. 2017;93(3):480–490. doi:10.1016/j.neuron.2016.12.041.
- 41. Stirman JN, Brauner M, Gottschalk A, Lu H. High-throughput study of synaptic transmission at the neuromuscular junction enabled by optogenetics and microfluidics. Journal of Neuroscience Methods. 2010;191(1):90–93. doi:10.1016/j.jneumeth.2010.05.019.
- 42. Lee JB, Yonar A, Hallacy T, Shen CH, Milloz J, Srinivasan J, et al. A compressed sensing framework for efficient dissection of neural circuits. Nature Methods. 2019;16(1):126. doi:10.1038/s41592-018-0233-6.
- 43. Wu MC, Chu LA, Hsiao PY, Lin YY, Chi CC, Liu TH, et al. Optogenetic control of selective neural activity in multiple freely moving Drosophila adults. Proceedings of the National Academy of Sciences. 2014;111(14):5367–5372. doi:10.1073/pnas.1400997111.
- 44. Kerr R. Imaging the activity of neurons and muscles. WormBook. 2006;doi:10.1895/wormbook.1.113.1.
- 45. Branson K, Robie AA, Bender J, Perona P, Dickinson MH. High-throughput ethomics in large groups of Drosophila. Nature Methods. 2009;6(6):451–457. doi:10.1038/nmeth.1328.
- 46. Gershow M, Berck M, Mathew D, Luo L, Kane EA, Carlson JR, et al. Controlling airborne cues to study small animal navigation. Nature Methods. 2012;9(3):290–296. doi:10.1038/nmeth.1853.
- 47. Husson SJ. Keeping track of worm trackers. In: elegans Research Community TC, editor. WormBook. WormBook; 2012.Available from: http://www.wormbook.org.
- 48. Liu M, Sharma AK, Shaevitz JW, Leifer AM. Temporal processing and context dependency in Caenorhabditis elegans response to mechanosensation. eLife. 2018;7:e36419. doi:10.7554/eLife.36419.
- 49. DeAngelis BD, Zavatone-Veth JA, Gonzalez-Suarez AD, Clark DA. Spatiotemporally precise optogenetic activation of sensory neurons in freely walking Drosophila. eLife. 2020;9:e54183. doi:10.7554/eLife.54183.
- 50. Meloni I, Sachidanandan D, Thum AS, Kittel RJ, Murawski C. Controlling the behaviour of Drosophila melanogaster via smartphone optogenetics. Scientific Reports. 2020;10(1):17614. doi:10.1038/s41598-020-74448-4.
- 51. Chalfie M, Sulston J. Developmental genetics of the mechanosensory neurons of Caenorhabditis elegans. Developmental Biology. 1981;82(2):358–370.
- 52. Chalfie M, Sulston JE, White JG, Southgate E, Thomson JN, Brenner S. The neural circuit for touch sensitivity in Caenorhabditis elegans. The Journal of Neuroscience: The Official Journal of the Society for Neuroscience. 1985;5(4):956–64. doi:3981252.
- 53. Chiba CM, Rankin CH. A developmental analysis of spontaneous and reflexive reversals in the nematodeCaenorhabditis elegans. Journal of Neurobiology. 1990;21(4):543–554. doi:10.1002/neu.480210403.
- 54. Chalfie M, Hart AC, Rankin CH, Goodman MB. Assaying mechanosensation. In: elegans Research Community TC, editor. WormBook; 2014.Available from: http://doi.org/10.1895/wormbook.
- 55. Wicks SR, Rankin CH. Integration of mechanosensory stimuli in Caenorhabditis elegans. The Journal of Neuroscience: The Official Journal of the Society for Neuroscience. 1995;15(3 Pt 2):2434–2444.
- 56. Petzold BC, Park SJ, Mazzochette EA, Goodman MB, Pruitt BL. MEMS-based force-clamp analysis of the role of body stiffness in C. elegans touch sensation. Integrative Biology. 2013;5(6):853–864. doi:10.1039/c3ib20293c.
- 57. Mazzochette EA, Fang-Yen C, Goodman MB, Pruitt BL. A Real Time Imaging System for Tracking Freely Moving C. elegans in Touch Assays. In: Microtechnologies in Medicine and Biology. Marina del Rey, CA; 2013.Available from: http://microsystems.stanford.edu/microwiki_upload/4/4b/Mazzochette_MMB.pdf.
- 58. Mazzochette EA, Nekimken AL, Loizeau F, Whitworth J, Huynh B, Goodman MB, et al. The tactile receptive fields of freely moving Caenorhabditis elegans nematodes. Integrative Biology. 2018;10(8):450–463. doi:10.1039/c8ib00045j.
- 59. McClanahan PD, Xu JH, Fang-Yen C. Comparing Caenorhabditis elegans gentle and harsh touch response behavior using a multiplexed hydraulic microfluidic device. Integrative Biology. 2017;9(10):800–809. doi:10.1039/C7IB00120G.
- 60. Chalfie M. Neurosensory mechanotransduction. Nature Reviews Molecular Cell Biology. 2009;10(1):44–52. doi:10.1038/nrm2595.
- 61. Gray JM, Hill JJ, Bargmann CI. A circuit for navigation in Caenorhabditis elegans. Proceedings of the National Academy of Sciences of the United States of America. 2005;102(9):3184–3191. doi:10.1073/pnas.0409009101.
- 62. Alkema MJ, Hunter-Ensor M, Ringstad N, Horvitz HR. Tyramine Functions independently of octopamine in the Caenorhabditis elegans nervous system. Neuron. 2005;46(2):247–260. doi:10.1016/j.neuron.2005.02.024.
- 63. Swierczek NA, Giles AC, Rankin CH, Kerr RA. High-throughput behavioral analysis in C. elegans. Nature Methods. 2011;8(7):592–598. doi:10.1038/nmeth.1625.
- 64. Pierce-Shimomura JT, Morse TM, Lockery SR. The Fundamental Role of Pirouettes in Caenorhabditis elegans Chemotaxis. J Neurosci. 1999;19(21):9557–9569.
- 65. Pirri JK, Alkema MJ. The neuroethology of C. elegans escape. Current Opinion in Neurobiology. 2012;22(2):187–193. doi:10.1016/j.conb.2011.12.007.
- 66. Maguire SM, Clark CM, Nunnari J, Pirri JK, Alkema MJ. The C. elegans touch response facilitates escape from predacious fungi. Current biology: CB. 2011;21(15):1326–1330. doi:10.1016/j.cub.2011.06.063.
- 67. Govorunova EG, Sineshchekov OA, Janz R, Liu X, Spudich JL. Natural light-gated anion channels: A family of microbial rhodopsins for advanced optogenetics. Science. 2015;349(6248):647–650. doi:10.1126/science.aaa7484.
- 68. Vierock J, Rodriguez-Rozada S, Dieter A, Pieper F, Sims R, Tenedini F, et al. BiPOLES is an optogenetic tool developed for bidirectional dual-color control of neurons. Nature Communications. 2021;12(1):4527. doi:10.1038/s41467-021-24759-5.
- 69. Croll N. Behavoural analysis of nematode movement. Advances in Parasitology. 1975;13:71–122.
- 70. Croll NA. Components and patterns in the behaviour of the nematode Caenorhabditis elegans. Journal of Zoology. 1975;176(2):159–176. doi:10.1111/j.1469-7998.1975.tb03191.x.
- 71. Kaplan HS, Salazar Thula O, Khoss N, Zimmer M. Nested Neuronal Dynamics Orchestrate a Behavioral Hierarchy across Timescales. Neuron. 2020;105(3):562–576.e9. doi:10.1016/j.neuron.2019.10.037.
- 72. Noma K, Jin Y. Rapid Integration of Multi-copy Transgenes Using Optogenetic Mutagenesis in Caenorhabditis elegans. G3 Genes|Genomes|Genetics. 2018;8(6):2091–2097. doi:10.1534/g3.118.200158.
- 73. Klapoetke NC, Murata Y, Kim SS, Pulver SR, Birdsey-Benson A, Cho YK, et al. Independent optical excitation of distinct neural populations. Nature methods. 2014;11(3):338–346. doi:10.1038/nmeth.2836.
- 74. Liu M. C. elegans behaviors and their mechanosensory drivers. Princeton University. Princeton, United States of America; 2020. Available from: http://arks.princeton.edu/ark:/88435/dsp01tt44pq78z.
- 75. Ramot D, Johnson BE, Berry TL Jr, Carnell L, Goodman MB. The Parallel Worm Tracker: A Platform for Measuring Average Speed and Drug-Induced Paralysis in Nematodes. PLoS ONE. 2008;3(5):e2208. doi:10.1371/journal.pone.0002208.
- 76. Deng Y, Coen P, Sun M, Shaevitz JW. Efficient Multiple Object Tracking Using Mutually Repulsive Active Membranes. PLoS ONE. 2013;8(6):e65769. doi:10.1371/journal.pone.0065769.
- 77. Berman GJ, Choi DM, Bialek W, Shaevitz JW. Mapping the stereotyped behaviour of freely moving fruit flies. Journal of the Royal Society, Interface / the Royal Society. 2014;11(99). doi:10.1098/rsif.2014.0672.