Maser emission from the CO envelope of the asymptotic giant branch star W Hydrae
Abstract
Context. Observation of CO emission around asymptotic giant branch (AGB) stars is the primary method to determine gas mass-loss rates. While radiative transfer models have shown that molecular levels of CO can become mildly inverted, causing maser emission, CO maser emission has yet to be confirmed observationally.
Aims. High-resolution observations of the CO emission around AGB stars now have the brightness temperature sensitivity to detect possible weak CO maser emission.
Methods. We used high angular resolution observations taken with the Atacama Large Millimeter/submillimeter Array (ALMA) to observe the small-scale structure of CO emission around the oxygen-rich AGB star W Hya.
Results. We find CO maser emission amplifying the stellar continuum with an optical depth . The maser predominantly amplifies the limb of the star because CO absorption from the extended stellar atmosphere is strongest towards the centre of the star.
Conclusions. The CO maser velocity corresponds to a previously observed variable component of high-frequency H2O masers and with the OH maser that was identified as the amplified stellar image. This implies that the maser originates beyond the acceleration region and constrains the velocity profile since we find the population inversion primarily in the inner circumstellar envelope. We find that inversion can be explained by the radiation field at 4.6 m and that the existence of CO maser emission is consistent with the estimated mass-loss rates for W Hya. However, the pumping mechanism requires a complex interplay between absorption and emission lines in the extended atmosphere. Excess from dust in the circumstellar envelope of W Hya is not sufficient to contribute significantly to the required radiation field at 4.6 m. The interplay between molecular lines that cause the pumping can be constrained by future multi-level CO observations.
Key Words.:
masers; circumstellar matter, stars: AGB and post-AGB, stars: individual: W Hya1 Introduction
The mass loss of asymptotic giant branch (AGB) stars, with main-sequence masses in the range M⊙, is an important source of interstellar enrichment (Höfner & Olofsson, 2018). The primary method of determining the gas mass-loss rates of these stars is to use observations of CO lines in their circumstellar envelopes (CSEs). Radiative transfer calculations of rotational and vibrational CO transitions in the (sub)millimetre to far-infrared (far-IR) wavelength range are subsequently used to determine the total gas content in the CSE, and thus, indirectly, the AGB mass-loss rate.
It has long been known that, under specific conditions in CSEs, some of the lowest rotational energy levels of CO can become mildly inverted causing weak maser emission (e.g. Goldsmith, 1972; Morris, 1980; Schoenberg, 1988; Piehler et al., 1991). Masing of CO emission could also occur in shocks in molecular clouds (e.g. McKee et al., 1982; Draine & Roberge, 1984). In these models the population inversion is primarily caused by absorption of m photons that will excite CO to the first vibrational level. From this level it decays back to the ground vibrational state in higher rotational states. If the rate of absorption of the m photons is sufficiently high, an inversion in the lowest rotational levels can occur. This requires the m lines to have relatively low optical depth so that the IR emission can reach the region of the CSE where the population is not collisionally quenched. A detailed analysis thus restricts possible maser action to AGB stars that a have low mass-loss rate, a high CO abundance, and a strong IR radiation field (Morris, 1980; Schoenberg, 1988). In particular, it was concluded that the most likely candidate AGB stars where CO maser action could be detected would be carbon stars with low mass-loss rates (Morris, 1980). Because the maser inversion is very sensitive to the IR radiation, CO abundance, and the density in the envelope, observations of CO masers could provide unique constraints on localised regions of the CO envelope and on the IR radiation field coming from the stellar atmosphere.
There have been no confirmed detections of CO maser emission to date. Narrow CO emission around the carbon star V Hydrae was previously thought to be due to maser inversion (Zuckerman & Dyck, 1986). However, later observations revealed that the narrow emission is identical in the line and is more likely a kinematic effect (Zuckerman & Dyck, 1989). There are also no clear detections yet of CO maser emission from molecular clouds.
Here we present the first unambiguous detection of CO maser emission, in the transition, around the oxygen-rich AGB star W Hya. W Hya is a semi-regular variable star located at pc from the Sun (Vlemmings et al., 2003; van Leeuwen, 2007) with a mass-loss rate of M⊙ yr-1 (e.g. Maercker et al., 2008; Khouri et al., 2014) and a main-sequence mass, as constrained by oxygen isotopic ratios between 1.0 and 1.5 M⊙ (Khouri et al., 2014; Danilovich et al., 2017). Continuum observations of the extended stellar atmosphere with ALMA show that, at GHz, the star has a brightness temperature of K and a size of au (Vlemmings et al., 2019). These observations have also revealed strong variable surface hotspots with brightness temperatures sometimes in excess of K (Vlemmings et al., 2017, 2019).
The maser is detected in high angular resolution observations taken at two epochs. We present the observations in §2 and the results in §3. We compare in §4 the results with simple radiative transfer models that investigate the dependence on the continuum radiation field (following Morris, 1980) as well as a simplified implementation of the line overlap pumping described in Piehler et al. (1991). Our conclusions are summarised in §5.
2 Observations and data reduction
The observations of W Hya presented in this paper were previously presented in Vlemmings et al. (2017) and Vlemmings et al. (2019). Here we summarise the observation set-up and calibration steps. The first epoch of observations of W Hya in ALMA band 7, which included the CO transition at GHz, were taken as part of ALMA project 2015.1.01446.S (PI: Takigawa) in three executions between 30 Nov and 5 Dec 2015 for a total on-source time of hr. The second epoch was observed as part of project 2016.A.00029.S (PI: Vlemmings) on 25 Nov 2017 with an on-source observing time of min. All observations were taken in spectral line mode, and the spectral window (spw) that contained the CO transition provided a native spectral resolution of 0.98 MHz ( km s-1) for both epochs. The initial calibration (of the bandpass, amplitude, absolute flux-density scale, and phase) was done using the Common Astronomy Software Applications (CASA) package (McMullin et al., 2007), using the manual calibration scripts provided by the observatory. Further observation details, including the flux and gain calibrators used, are given in Vlemmings et al. (2017) and Vlemmings et al. (2019).
After the initial calibration we performed two rounds of phase self-calibration on the strong stellar continuum. The self-calibration improved the continuum signal-to-noise ratio (S/N) by a factor of three. Imaging of the CO lines was done using Briggs weighting with a robust parameter of and respectively for the two epochs, in order to achieve a similar angular resolution. The resulting beam sizes were mas ( from north) and mas (). The maximum recoverable scale is approximately . Despite the additional observing time for epoch 1, the rms noise near the CO line was mJy beam-1 for both epochs due to the different weighting adopted.
3 Results
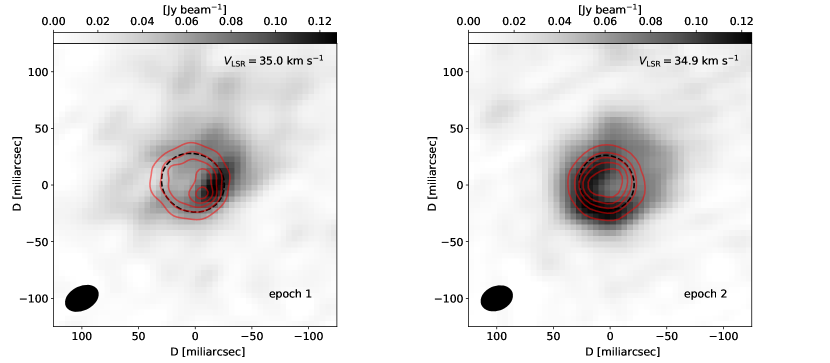
In both observational epochs, bright and relatively compact CO emission is detected. The emission maps of the brightest channels are shown in Fig. 1. After subtracting the K stellar continuum, the peak of the emission has a brightness temperature of K in the two epochs. The emission region is complex and, if it consists of multiple more compact components, the derived presents a lower limit. As the emission is amplifying the underlying stellar continuum, the brightness temperatures imply a maser optical depth of .
The morphology of the bright masing CO emission has markedly changed between the two observing sessions. During the first epoch the emission appears the be dominated by a relatively compact region towards the western hemisphere of the star, close to the bright hotspots observed on the stellar continuum surface (Vlemmings et al., 2017). In the second epoch the emission is more extended and follows along the eastern limb of the stellar continuum.
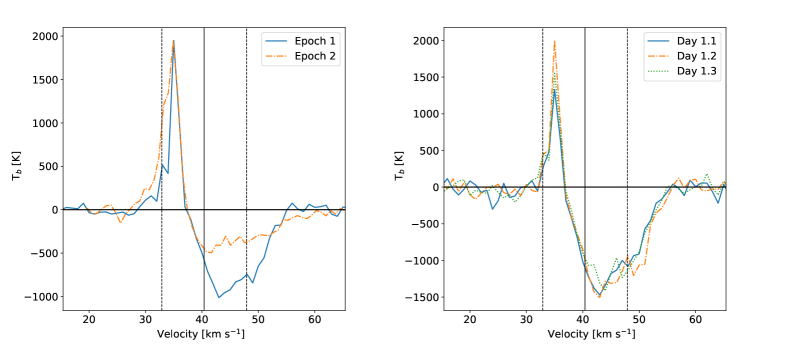
The CO spectra taken in a single beam towards the peak of the maser emission are shown in Fig. 2(left). In both epochs the maser emission is confined to a few velocity channels ( km s-1 in width) between and km s-1 with a peak at km s-1. The brightest spectral component has a full width at half maximum (FWHM) of and km s-1 in the two epochs, respectively. The masers are superimposed on an absorption profile originating from CO in the extended stellar atmosphere. This absorption profile is of very different depth at the position of the CO maser at each epoch. To investigate if there is any short-term variability in the CO maser emission we also individually imaged the three days in epoch 1 (30 Nov, 3 Dec, and 5 Dec). Although the synthesised beams are different, the morphology of the maser emission does not change significantly. The spectra of the three days, taken towards the peak identified in the combined epoch 1 image and convolved to a common beam size, are shown in Fig. 2(right). The emission brightness temperature appears to change from K on 30 Nov to K on 3 Dec and to K on 5 Dec 2015. If the maser emission is more compact than the common beam of mas, these brightness temperature values would correspond to lower limits. This indicates that there could be variability of the order of within only a five-day timescale. For comparison, the continuum flux varies by less than over the three days so the flux variation is not due to an uncertainty in the flux calibration.
4 Discussion
4.1 Morphology and variability
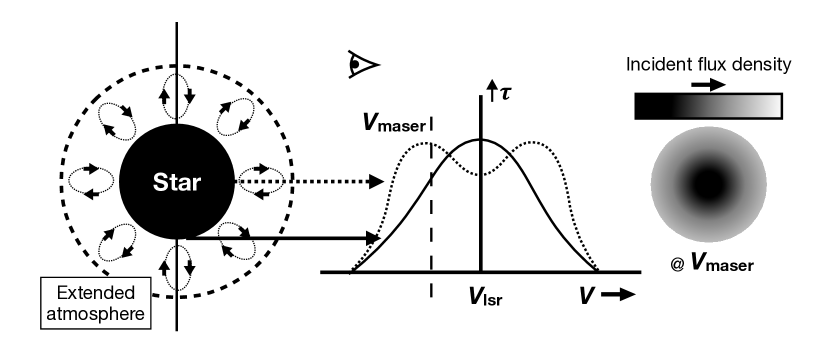
As seen in Fig. 1, a common feature at the two epochs is that the brightest CO maser emission is found projected towards the limb of the stellar continuum. Although CO emission also originates from the extended AGB atmosphere, maser inversion of the ground state CO lines cannot occur there because the density of the collision partners is too high (e.g. Vlemmings et al., 2017; Khouri et al., 2018). Thus, the maser emission has to originate from CO gas beyond the dust formation region where the wind is accelerated. There the CO maser in front of the star will amplify the stellar continuum emission. However, as illustrated in Fig. 3, at the expansion velocity of the large-scale outflow, the CO molecules in the extended atmosphere absorb more efficiently towards the stellar centre than the limbs. Hence, the CO molecules in the outflow see a limb-brightened star, and amplification is naturally strongest towards the limbs. This can also explain the morphological changes between the observing epochs as the maser emission will depend on a combination of stellar surface emission variations (such as the observed hotspots) and the depth of the molecular absorption at the maser velocity. Finally, the maser emission will also be affected by a possible density and velocity structure in the foreground material. However, because the maser inversion is small, this effect will be much less pronounced compared to SiO, H2O, and OH masers. Furthermore, transverse motions of dense clumps across the full stellar disk within two years would, at the distance of W Hya, require a transverse velocity of km s-1, which is much higher than the turbulent velocities estimated in CSEs ( km s-1 for W Hya, Khouri et al. 2014). Thus, we suggest that the changes in the maser emission primarily reflect changes in the underlying structure of the star and extended atmosphere.
The flux variation of observed over five days during the first epoch is likely due to a combination of changes in the extended atmosphere coupled with small changes in foreground masing material. If the maser is amplifying the same background emission, a variability reflects a similar change in the background emission or small variations in the maser optical depth between and . The background continuum emission itself does not change by more than a few percent, which means that it is unlikely that the observed variability is the result of rapid changes in the stellar continuum. As seen in Fig. 2(right), the atmospheric CO absorption itself shows that variations up to could be present. The maser optical depth is also very sensitive to the pumping emission at 4.6 m and the effect of line overlap (see § 4.3.1). Thus, a small change in the background 4.6 m emission and CO absorption of the stellar continuum in the extended atmosphere, together with small-scale turbulence in the masing gas that alters the coherent velocity path length, can cause the observed variation in maser flux.
4.2 Velocity
The velocity of the CO maser remained stable at km s-1 over the two epochs with a FWHM velocity width of km s-1. This means that the maser coincides in velocity with the brightest 1665 and 1667 MHz OH maser at km s-1, observed between 1999 and 2002, which was shown to be amplifying the background stellar radio continuum (Vlemmings et al., 2003). At 183 GHz, H2O masers show a very distinct emission peak at km s-1, with almost the same strength as the main peak (Humphreys et al., 2017). A similar feature, though slightly weaker compared to the peak emission, is seen in the 1.296 THz H2O maser (Neufeld et al., 2017), while observations of the 658 GHz H2O maser show a weak but distinct peak at the same velocity (Baudry et al., 2018). The 321 and 325 GHz H2O maser spectra from Yates et al. (1995) show multiple peaks, but they do not extend to the velocity where we find the CO maser. Similarly, the 22 GHz H2O masers spectra show no emission at around km s-1 (Imai et al., 2019) and imaging with the MERLIN interferometer seems to show that the 22 GHz masers are predominantly found in a tangentially amplified shell between and au from the star (Richards et al., 2012).
Even if all features seen in the various masers around km s-1 are related, it is unlikely that this is due to a physical association in a single maser cloud. The 658 GHz H2O masers require a high temperature ( K) and H2O density ( cm-3), while the 183 GHz H2 masers are found over a larger range of temperatures (between K and K), but with an H2O density cm-3. The conditions for the 1.296 THz masers fall roughly between the other two maser transitions (Gray et al., 2016). Considering an H2O abundance of for W Hya (Maercker et al., 2008), this means that the H2O masers are excited at molecular hydrogen densities of up to cm-3. For the typically assumed mass-loss rate of W Hya this corresponds to a region within au, and hence well within the region where we would expect the amplified stellar image in the OH masers. According to an OH maser shell model of Szymczak et al. (1998), the OH masers occur in a shell with a radius of au and a thickness of au, although the fit of the observations to a thin shell is poor. Furthermore, the time baseline of the various observations spans more than 20 years. It is thus more likely that the velocity of the CO maser and the other features corresponds to the largest coherent velocity path length towards the star, which results in an amplified stellar image in a large number of different maser species and transitions.
4.3 Radiative transfer models
4.3.1 Continuum pumping
| Stellar parameters: | |
|---|---|
| T∗ | 2500 K |
| L∗ | 5400 L⊙ |
| D | 115 pc |
| Envelope parameters: | |
| M⊙ yr-1 | |
| 3.68 au | |
| Abundance and e-folding radius: | |
| 630 au | |
| Gas velocity law: | |
| 5.0 | |
| 3.0 | |
| 7.5 | |
| Turbulent velocity: | |
| 0.8 | |
| Dust: | |
| 0.1 | |
| Type | Silicate |
In order to investigate the occurrence of the CO maser in the transition, we perform one-dimensional radiative transfer models using the Monte Carlo radiative transfer code mcp (Schöier & Olofsson, 2001). We include the CO rotational levels to and the vibrational levels and . The transition frequencies, energy levels, and Einstein coefficients were taken from the CDMS and JPL databases (Müller et al., 2001; Pickett et al., 1998) and the collisional rate coefficients come from (Yang et al., 2010).
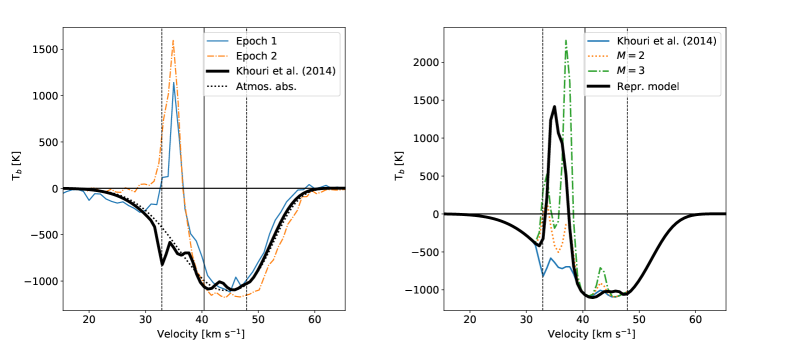
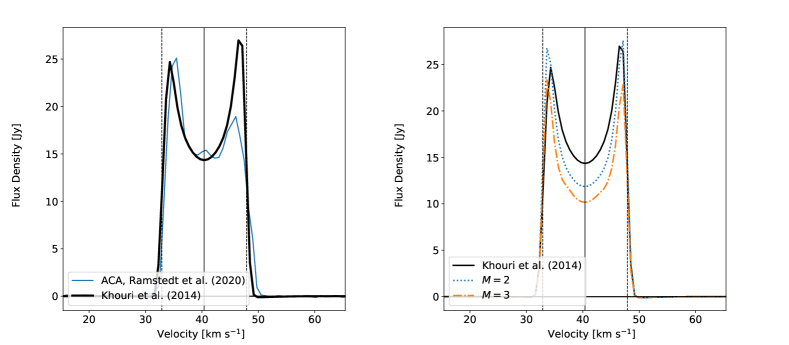
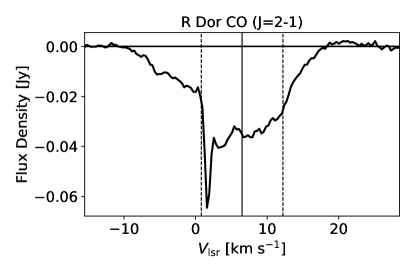
It has long been recognised that mild population inversion of CO can occur for a narrow mass-loss range (e.g. Morris, 1980). The maser range is set by the mass-loss rate (or gas density) and CO abundance as well as the availability of 4.6 m pump photons. At high gas density, the CO is mostly collisionally excited, quenching the maser. A high CO column density also produces a high opacity at the 4.6 m CO transitions reducing the volume over which the maser can operate. Conversely, as the maser requires a sufficiently large negative optical depth, a CO column density that is too low also reduces the maser strength. To investigate the occurrence of the CO maser around W Hya, we model the observations of a single aperture (with a size of ) towards the star using the parameters for the CO envelope given in Table 1 taken from Khouri et al. (2014); we do not adjust the distance and adopt the value used in the model. Since the model is one-dimensional we only compare the emission along the line of sight to the star. In order to include the effect of the broad CO absorption that originates from the extended atmosphere, we include this absorption profile on top of the stellar black body when ray-tracing the solutions of the radiative transfer model. We include a comparison of the model with recent ACA observations (with a beam size of ). The results of this model are shown in Fig. 4(left). The ACA spectrum and corresponding model are shown in Fig. 5(left). No maser emission is generated with these model parameters. Additionally, at the terminal velocity, an absorption component is seen that is the result of observing towards the star through the cool blue-shifted CO envelope in the foreground. Such a narrow absorption component is absent in our observed spectrum, although we do see this effect in high angular resolution observations of the CO emission around the nearby AGB star R Dor (shown in Fig. 6).
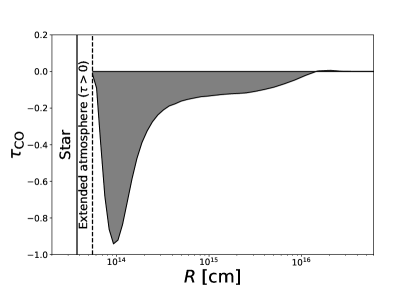
Subsequently, we artificially adjust the strength of the 4.6 m radiation field, following the same method as in Morris (1980), to investigate when maser emission is generated. Specifically, we multiply the radiation field for all wavelengths m by a factor . The result of these models are shown in Figs. 4(right) and 5(right). Several things become apparent from these models. Firstly, a maser of sufficient strength can be generated if the radiation field at 4.6 m is increased by a factor . However, because the inversion mostly occurs in the inner envelope, the maser velocity is too close to the stellar velocity in the adopted model. Finally, the maser width is too narrow. In order to overcome these issues, we require a larger velocity at the inner envelope ( km s-1), a slightly steeper acceleration (), and larger turbulent velocity component ( km s-1). Varying these three parameters, we can reproduce the maser as seen in the representative model in Fig. 4(right). While making these changes, we did not consider further constraints from the lower angular resolution observations. In order to investigate where, in this model, most of the maser emission originates with respect to the star, the extended atmosphere, and the CSE, we present the radial CO optical depth as a function of radius in Fig. 7. Population inversion in the line persists throughout most of the CSE and peaks around au. This can be compared to the stellar radius (at 345 GHz) of au and the approximate size of the extended stellar atmosphere and start of the dust formation zone at au. In the extended atmosphere, no maser emission can occur because of the high densities. As discussed in § 4.1 and illustrated in Fig. 3, the stellar continuum emission is absorbed by CO gas in the extended atmosphere before it is subsequently amplified by the foreground CO maser. The exact shape of the optical depth profile is strongly dependent on the velocity profile and enhanced IR radiation field adopted in the model.
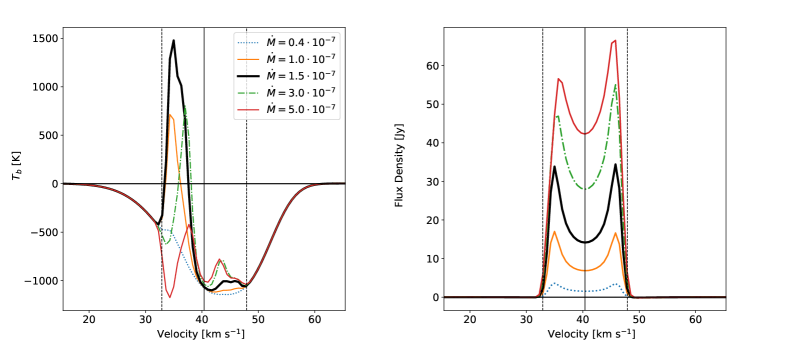
In Fig. 8 we investigate the effect of changing the mass-loss rate on our maser model. Under the assumed conditions we find that maser emission is generated, from different parts of the envelope, for mass-loss rates between M⊙ yr-1. Specifically for W Hya, most of this range can be ruled out by the lower angular resolution observations, limiting the rate to between M⊙ yr-1.
In our models we can reproduce the required continuum excess by including a dust shell with an optical depth at 4.6 m of , which is located closer to the star than the maser-emission region. Such a dust shell would have optical depths greater by at least a factor of five at m and m, affecting the spectral energy distribution in a way that is not supported by the observed infrared spectrum (e.g. Justtanont et al., 2004). Although the model results show that the maser can be reproduced by a general increase in IR radiation field and fine-tuning the model parameters, we conclude that this is not a viable solution. We thus investigate pumping that can occur due to line overlap around 4.6 m.
4.3.2 Line overlap
Line overlap of spectral lines around the pump wavelength at 4.6 m has also been suggested as the cause of CO maser emission (Piehler et al., 1991). Specifically, a combination of absorption and emission lines originating from the stellar atmosphere, can change the relative pumping of the IR lines. Here we focus on the effect on the IR lines of the transitions between the ground state and the first vibrationally excited state for up to . By relative changes of the radiation field seen by these lines, maser inversion can readily be obtained. In Fig. 9 we show the results of changing the stellar radiation field experienced by these transitions. We adopted the CO envelope parameters from Table 1 with the adjustment to the velocity field as discussed previously. Based on observations around 4.6 m (Justtanont et al., 2004) we include an overall decrease in the stellar radiation field around this wavelength, adopting a transmission of 85% of the stellar black body. As expected, the appearance of the CO maser is closely related to the relative pumping into and out of the level. The maser emission in this transition requires a slight overpopulation of the level. This means that an increase in the intensity of the radiation field affecting the transition between the level and the levels will decrease the population in favour of the level. As a consequence, the ratio of to inverts. Similarly, a decrease in the intensity of the radiation field affecting the transition between and will reduce the pumping from the to the level. The subsequent decay of the larger population in the level to the level will result in maser inversion in the CO transition. Our models and the more extensive study involving many spectral components in Piehler et al. (1991) highlight that the maser emission is highly sensitive to the exact profile, including absorption and emission lines, of the stellar atmosphere. The current observations of a single transition can be reproduced by many different combinations of relative pumping in the IR. Still, considering the rich structure known to exist in the spectra originating from the stellar atmosphere, it is highly likely that the line overlap is the main reason for the observed CO maser. In particular, also because pumping due to continuum emission requires an increase in the IR radiation field that is not observed (see § 4.3.1). The range of mass-loss over which a maser can be reproduced using the pumping of a single IR line is similar to that shown in Fig. 8 for the excess continuum IR emission. However, a detailed study of this would involve too many degenerate parameters to be constrained with a single observed maser transition.
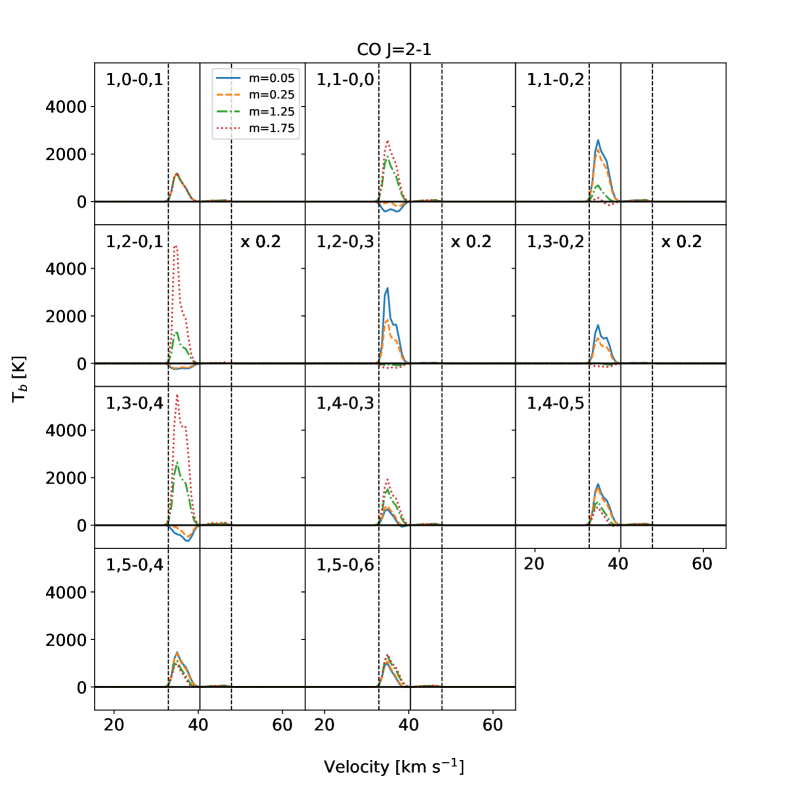
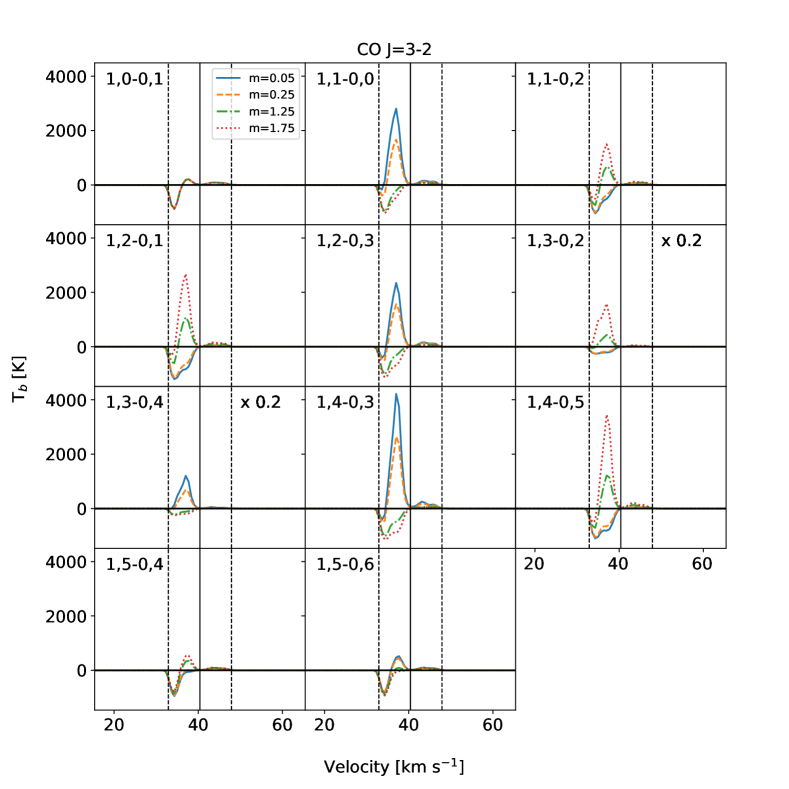
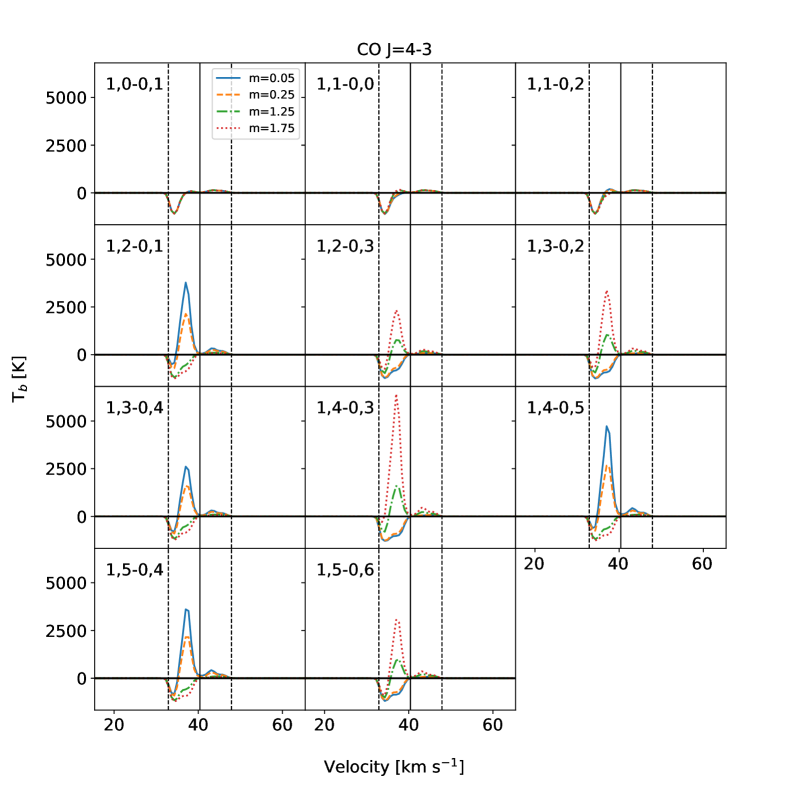
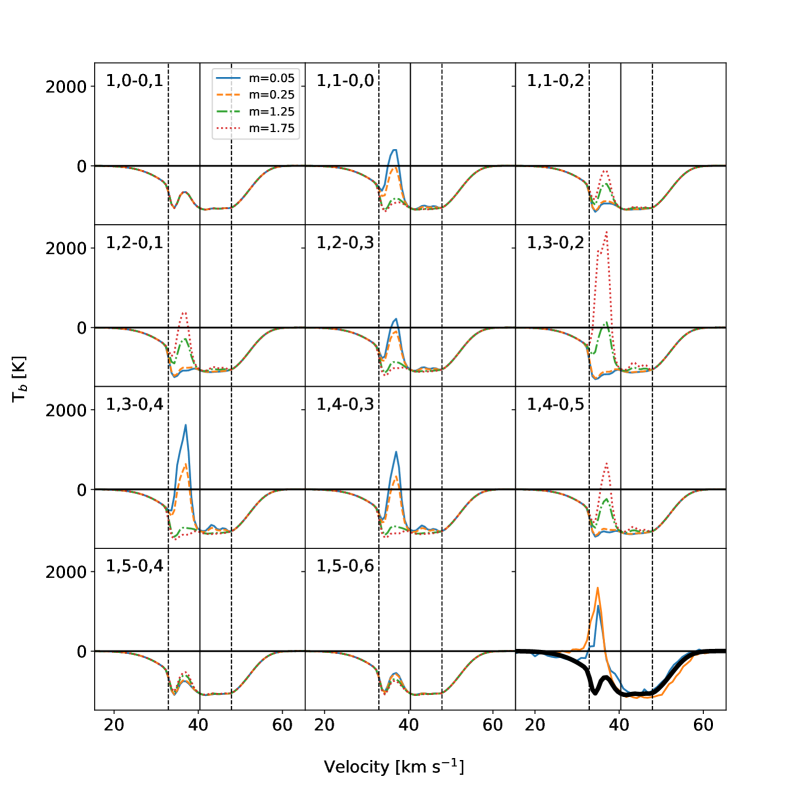
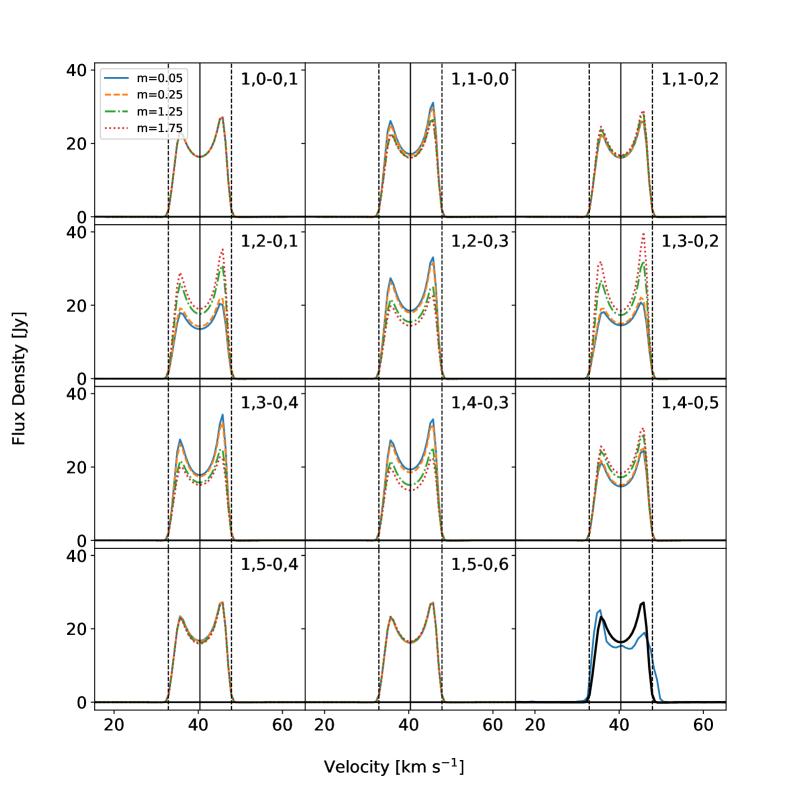
A study involving multiple masing transitions can provide stronger constraints on the contribution of the different IR lines. In Appendix A we investigate the effect of selective pumping of the different IR lines on the CO (Fig. 11) and (Fig. 13) transitions. We also include the CO results without the atmospheric absorption profile in Fig. 12. These model results show that in particular the combination of these three lines can be used to investigate which IR transitions are responsible for the CO maser pumping since all three are affected differently by pumping the different IR lines. For example, the extra absorption between the and levels (which can explain the CO maser of W Hya) would not produce any maser in the transition. This could explain why no maser is observed in the CO transition of R Dor (Fig. 6) even though R Dor has a mass-loss rate similar to that of W Hya.
Similar to the continuum pumping, a change in the relative emission incident on the individual 4.6 m CO transitions also changes the CO emission profile on the larger scales shown in Fig. 10. Because of the large number of degeneracies including the individual line pumping, we did not attempt to adjust the standard CSE model to simultaneously reproduce the larger scale observations. However, it is clear that the models that can reproduce the maser emission also produce changes in the larger scale emission that do not match the observations. The selective pumping our model requires has a different relative effect on each of the low-excitation rotational CO lines. Hence, model parameters such as mass-loss rate, velocity structure, and turbulent velocity will be much better determined when considering constraints from CO maser emission, when present.
5 Conclusions
Using ALMA long baseline observations, we have confirmed that mild maser inversion occurs in the CSE of the AGB star W Hya. The maser emission is shown to occur at a stable velocity in two observational epochs separated by two years. While the flux density of the maser emission is also similar, the morphology has altered significantly in this time. Since the maser is seen to amplify the underlying stellar continuum, the changes in morphology are likely due to a combination of small-scale structure in the masing material and changes in the underlying stellar continuum. The maser emission is found at km s-1, which corresponds, within the spectral resolution, to the velocity of the amplified stellar emission feature seen in the OH 1665 and 1667 MHz masers (Vlemmings et al., 2003). It also corresponds to the velocity of a bright emission peak in the 183 GHz H2O masers (Humphreys et al., 2017) and a weaker feature in the 658 GHz and 1.296 THz H2O masers (Baudry et al., 2018; Neufeld et al., 2017). This implies a large column of material at coherent velocity in front of the star since the excitation conditions of the masers and the CO stretch over a wide range of densities and temperatures.
We can reproduce the CO maser emission assuming a mass-loss rate similar to that typically derived for W Hya ( M⊙ yr-1, e.g. Khouri et al. 2014). We find the CO line can be inverted if the 4.6 m continuum radiation field for the circumstellar dust is significantly enhanced. However, this requires a radiation field at 4.6 m that is inconsistent with observations (e.g. Justtanont et al., 2004). Instead, the likely explanation for the maser emission involves a complex structure of atmospheric emission and absorption lines that produce differential pumping of the IR CO transitions around 4.6 m, between the ground level and the first vibrational level. A more exact determination of the relative pumping of these lines is not possible with the current observations of only one CO maser transition and would require near-simultaneous observations at high angular resolution of multiple rotational transitions. Our models show that the relative IR pumping that gives rise to the maser also introduces an overall uncertainty in the molecular line radiative transfer modelling for stars such as W Hya. A proper inclusion of the IR lines in the AGB atmosphere is thus needed to further reduce uncertainties in mass-loss and radiative transfer modelling.
Acknowledgements.
WV and TK acknowledge support from the Swedish Research Council under grants No. 2014-05713 and 2019-03777. This paper makes use of the following ALMA data: ADS/JAO.ALMA#2015.1.01446.S, ADS/JAO.ALMA#2016.A.00029.S, ADS/JAO.ALMA#2016.2.00025.S, and ADS/JAO.ALMA#2017.1.00824.S. ALMA is a partnership of ESO (representing its member states), NSF (USA) and NINS (Japan), together with NRC (Canada), NSC and ASIAA (Taiwan), and KASI (Republic of Korea), in cooperation with the Republic of Chile. The Joint ALMA Observatory is operated by ESO, AUI/NRAO and NAOJ. We also acknowledge support from the Nordic ALMA Regional Centre (ARC) node based at Onsala Space Observatory. The Nordic ARC node is funded through Swedish Research Council grant No 2017-00648.References
- Baudry et al. (2018) Baudry, A., Humphreys, E. M. L., Herpin, F., et al. 2018, A&A, 609, A25
- Danilovich et al. (2017) Danilovich, T., Lombaert, R., Decin, L., et al. 2017, A&A, 602, A14
- De Beck & Olofsson (2018) De Beck, E. & Olofsson, H. 2018, A&A, 615, A8
- Draine & Roberge (1984) Draine, B. T. & Roberge, W. G. 1984, ApJ, 282, 491
- Goldsmith (1972) Goldsmith, P. F. 1972, ApJ, 176, 597
- Gray et al. (2016) Gray, M. D., Baudry, A., Richards, A. M. S., et al. 2016, MNRAS, 456, 374
- Höfner & Olofsson (2018) Höfner, S. & Olofsson, H. 2018, A&A Rev., 26, 1
- Humphreys et al. (2017) Humphreys, E. M. L., Immer, K., Gray, M. D., et al. 2017, A&A, 603, A77
- Imai et al. (2019) Imai, H., Nakagawa, A., & Takaba, H. 2019, PASJ, 71, 120
- Justtanont et al. (2004) Justtanont, K., de Jong, T., Tielens, A. G. G. M., Feuchtgruber, H., & Waters, L. B. F. M. 2004, A&A, 417, 625
- Khouri et al. (2014) Khouri, T., de Koter, A., Decin, L., et al. 2014, A&A, 570, A67
- Khouri et al. (2018) Khouri, T., Vlemmings, W. H. T., Olofsson, H., et al. 2018, A&A, 620, A75
- Maercker et al. (2008) Maercker, M., Schöier, F. L., Olofsson, H., Bergman, P., & Ramstedt, S. 2008, A&A, 479, 779
- McKee et al. (1982) McKee, C. F., Storey, J. W. V., Watson, D. M., & Green, S. 1982, ApJ, 259, 647
- McMullin et al. (2007) McMullin, J. P., Waters, B., Schiebel, D., Young, W., & Golap, K. 2007, in Astronomical Society of the Pacific Conference Series, Vol. 376, Astronomical Data Analysis Software and Systems XVI, ed. R. A. Shaw, F. Hill, & D. J. Bell, 127
- Morris (1980) Morris, M. 1980, ApJ, 236, 823
- Müller et al. (2001) Müller, H. S. P., Thorwirth, S., Roth, D. A., et al. 2001, A&A, 370, L49
- Neufeld et al. (2017) Neufeld, D. A., Melnick, G. J., Kaufman, M. J., et al. 2017, ApJ, 843, 94
- Pickett et al. (1998) Pickett, H. M., Poynter, R. L., Cohen, E. A., et al. 1998, J. Quant. Spec. Radiat. Transf., 60, 883
- Piehler et al. (1991) Piehler, G., Kegel, W. H., & Tsuji, T. 1991, A&A, 245, 580
- Ramstedt et al. (2020) Ramstedt, S., Vlemmings, W. H. T., Doan, L., et al. 2020, A&A, 640, A133
- Richards et al. (2012) Richards, A. M. S., Etoka, S., Gray, M. D., et al. 2012, A&A, 546, A16
- Schoenberg (1988) Schoenberg, K. 1988, A&A, 195, 198
- Schöier & Olofsson (2001) Schöier, F. L. & Olofsson, H. 2001, A&A, 368, 969
- Szymczak et al. (1998) Szymczak, M., Cohen, R. J., & Richards, A. M. S. 1998, MNRAS, 297, 1151
- van Leeuwen (2007) van Leeuwen, F. 2007, A&A, 474, 653
- Vlemmings et al. (2017) Vlemmings, W., Khouri, T., O’Gorman, E., et al. 2017, Nature Astronomy, 1, 848
- Vlemmings et al. (2019) Vlemmings, W. H. T., Khouri, T., & Olofsson, H. 2019, A&A, 626, A81
- Vlemmings et al. (2003) Vlemmings, W. H. T., van Langevelde, H. J., Diamond, P. J., Habing, H. J., & Schilizzi, R. T. 2003, A&A, 407, 213
- Yang et al. (2010) Yang, B., Stancil, P. C., Balakrishnan, N., et al. 2010, ApJ, 718, 1062
- Yates et al. (1995) Yates, J. A., Cohen, R. J., & Hills, R. E. 1995, MNRAS, 273, 529
- Zuckerman & Dyck (1986) Zuckerman, B. & Dyck, H. M. 1986, ApJ, 311, 345
- Zuckerman & Dyck (1989) Zuckerman, B. & Dyck, H. M. 1989, A&A, 209, 119
Appendix A Other CO maser transitions
In Figs. 11, 12, and 13 we present the same models from § 4.3.2, including different relative radiation fields for the IR transitions, for the CO , and lines. In these models no atmospheric absorption profile was included.