Spectroscopy of an extreme [OIII] emitting active galactic nucleus at : implications for the reionisation era
Abstract
Reionisation-era galaxies often display intense nebular emission lines, both in rest-frame optical ([O III]+H) and ultraviolet (UV; C III], C IV). How such strong nebular emission is powered remains unclear, with both active galactic nuclei (AGN) and hot stars considered equally viable. The UV continuum slopes of these early systems tend to be very blue (), reflecting minimal dust obscuration, young ages, and low metallicities. This contrasts with narrow-lined AGN at , whose UV slopes are significantly redder () than typical star-forming systems in the reionisation era. To investigate the properties of AGN in the reionisation era, we have conducted a search for potential examples of rare analogues with blue continua at intermediate redshift (). Our goals are to determine whether AGN with intense line emission and blue continua exist and thereby to establish the range of rest-frame UV and optical line ratios in this population. In this paper we report the detection of a X-ray luminous AGN at (UDS-24561) with extreme [O III]+H line emission (EW Å) and a blue UV continuum slope (). MMT/Binospec and Keck/MOSFIRE spectra indicate rest-frame UV line ratios consistent with AGN photoionisation models and rest-frame optical lines with both a narrow component (FWHM kms) and extended broad wings (FWHM kms), consistent with outflowing gas. We describe how such objects can be identified in future JWST emission line surveys in the reionisation era, thereby providing a valuable census of AGN activity at and understanding their contribution to cosmic reionisation.
keywords:
cosmology: observations - galaxies: evolution - galaxies: formation - galaxies: high-redshift - galaxies: active1 Introduction
Studying the reionisation of the intergalactic hydrogen is a major frontier in modern astrophysics, and provides important clues to understanding the history of cosmic structure formation (Loeb & Barkana, 2001). The timeline of the reionisation process has been constrained by a series of observations undertaken over the last two decades. Measurement of the optical depth to Thomson scattering of the cosmic microwave background (CMB) radiation by the Planck team indicates a mid-point at (Planck Collaboration et al., 2020). This is supported by a census of Ly emitting galaxies at high redshift suggesting that the intergalactic medium (IGM) has a significant neutral hydrogen fraction ( per cent) at (see Ouchi et al. 2020 for a review). Moreover, the redshift-dependent flux seen in the Ly forest of quasar spectra implies a nearly fully ionised IGM and hence that the reionisation process is effectively complete by (e.g., Fan et al., 2006; McGreer et al., 2015).
However, the nature of the sources responsible for cosmic reionisation is still a matter of debate. Over the last decade, thousands of star-forming galaxies (SFGs) at have been detected in deep Hubble Space Telescope (HST) imaging surveys (e.g., Bouwens et al., 2015a; Finkelstein et al., 2015; Oesch et al., 2018) and a popular view is that such sources provide the major contribution to reionisation (e.g., Bouwens et al., 2015b; Robertson et al., 2015; Stanway et al., 2016; Dayal & Ferrara, 2018). However, if all SFGs contribute equally, (i) the ultraviolet (UV) luminosity function of galaxies must extend to intrinsically feeble systems with , and (ii) the fraction of ionising radiation that escapes into the IGM (the so-called ‘escape fraction’, ) must be as high as per cent (see Stark 2016 for a review). These requirements can be alleviated if rarer, more luminous systems make a more significant contribution, as suggested by the claimed rapid decline of the neutral fraction of the IGM over (e.g., Naidu et al., 2020). A possible explanation for this sudden end to reionisation is that many luminous sources may host active galactic nuclei (AGN) with both harder radiation fields (e.g., Steidel et al., 2014; Stark et al., 2015; Feltre et al., 2016) and larger escape fractions ( per cent; e.g., Cristiani et al. 2016; Grazian et al. 2018).
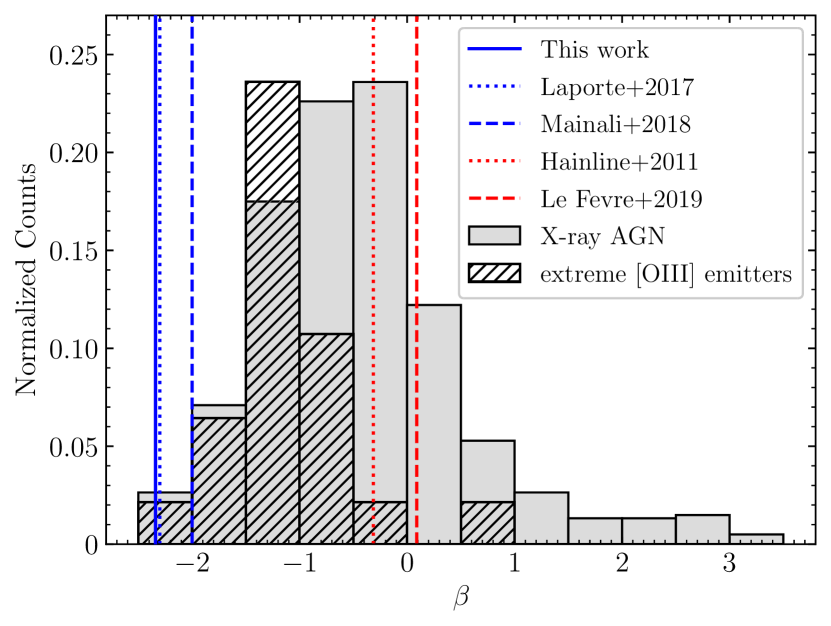
At present, there is only indirect evidence supporting the hypothesis of AGN activity in galaxies at . High ionisation UV emission lines (e.g., N V , C IV ) have been detected in a handful of star-forming galaxies (e.g., Tilvi et al., 2016; Hu et al., 2017; Laporte et al., 2017; Mainali et al., 2018; Sobral et al., 2019; Endsley et al., 2021b; Onoue et al., 2021). Although many AGN have been found in SFGs at (e.g., Hainline et al., 2011), it seems the limited number of corresponding reionisation-era systems with potential AGN signatures show very different properties. This may make it questionable to identify AGN in systems using the predominant spectral features seen in AGN. Specifically, SFGs in the reionisation era often display rest-frame optical emission lines with extremely high equivalent widths (EWs), with an average [O III]+H EW Å at (Labbé et al., 2013; De Barros et al., 2019; Endsley et al., 2021a). Such intense lines are seldom seen in lower redshift SFGs with AGN (e.g., Tang et al., 2019). Likewise, galaxies have very steep UV continuum slopes (; e.g., Bouwens et al. 2012, 2014; Finkelstein et al. 2012) indicating metal-poor stellar populations with little dust. On the other hand, AGN at present much redder UV slopes (, Fig. 1; e.g., Hainline et al. 2011; Le Fèvre et al. 2019), presumably because they are hosted by more massive galaxies with increased dust extinction (e.g., Hainline et al., 2012). A key question is whether these differences suggest that the nature and properties of AGN evolve significantly between and , and that a population of blue, extreme optical line emitting galaxies harbouring AGN are somehow more abundant in the reionisation era.
The above question has motivated us to search for examples of AGN activity in SFGs with blue UV slopes and extreme optical line emission. To accomplish this, we exploit our large spectroscopic survey of extreme [O III] emitting galaxies at at rest-frame optical (Tang et al., 2019, hereafter T19) and UV wavelengths (Tang et al., 2021a, b, hereafter \al@Tang2021a,Tang2021b; \al@Tang2021a,Tang2021b), targeting selected systems for evidence of AGN activity using diagnostic UV and optical emission lines in the context of photoionisation models (e.g., Allen et al., 2008; Feltre et al., 2016; Jaskot & Ravindranath, 2016; Nakajima et al., 2018; Hirschmann et al., 2019; Plat et al., 2019). This enables us to distinguish between spectra powered by AGN and massive stars. In this paper, we present the case of a AGN with extremely large EW [O III] emission with a steep UV continuum slope whose properties are thus similar to SFGs in the reionisation era (e.g., Endsley et al., 2021a). Our ultimate goal is to build a statistical sample of such AGN which may guide future spectroscopic searches for AGN activity in the reionisation era using future facilities such as the James Webb Space Telescope (JWST) or new generation of metre class telescopes which can target the relevant UV and optical nebular emission lines.
The organisation of this paper is as follows. We describe our target selection and the spectroscopic observations in Section 2. The emission line measurements and the associated line ratio diagnostics that support evidence of AGN activity are discussed in Section 3. Finally, we discuss the implications of our results for the contribution of AGN to the reionisation era in Section 4. We adopt a -dominated, flat universe with , , and km s-1 Mpc-1. All magnitudes in this paper are quoted in the AB system (Oke & Gunn, 1983), and all EWs are quoted in the rest frame.
2 Observations
In this work, we aim to locate and study the rest-frame UV and optical spectra of AGN with extremely large EW [O III] line emission and blue UV slopes. Our candidates will be chosen from a parent sample of extreme [O III] emitting AGN at . We describe the pre-selection of targets in Section 2.1, and the spectroscopic observations in Section 2.2, 2.3, and 2.4.
2.1 Pre-selection of extreme line emitting AGN with blue UV continuum slopes at
The first step of this study is to locate AGN candidates with extreme EW [O III] line emission and blue UV slopes for spectroscopic follow-up. In T19, we discuss the selection of a sample of extreme [O III] emitting objects at in the Cosmic Assembly Near-infrared Deep Extragalactic Legacy Survey (CANDELS) fields (Grogin et al., 2011; Koekemoer et al., 2011) and their near-infrared (rest-frame optical) spectra. We direct the reader to T19 for details. In brief, extreme [O III] emitters were selected to have large rest-frame [O III] EWs with values Å chosen to match the range common in reionisation-era sources (e.g., Endsley et al., 2021a). The [O III] EWs were inferred from HST grism spectra (at ; T19) or the -band flux excess (at ; Tang et al. in preparation) using the 3D-HST catalogs (Brammer et al., 2012; Skelton et al., 2014; Momcheva et al., 2016).
To identify which are AGN we cross-match our extreme [O III] emitter sample to deep Chandra X-ray source catalogues in the All-Wavelength Extended Groth Strip International Survey (AEGIS; Nandra et al. 2015), the Cosmic Evolution Survey (COSMOS; Civano et al. 2016), the Great Observatories Origins Deep Survey North (GOODS-N; Xue et al. 2016) and South (GOODS-S; Xue et al. 2011), and the Ultra Deep Survey (UDS; Kocevski et al. 2018) fields. The Chandra X-ray data used in the five CANDELS fields were reduced following the prescription described in Laird et al. (2009) and Nandra et al. (2015). The depths of the X-ray data are ks in AEGIS, ks in COSMOS, Ms in GOODS-N, Ms in GOODS-S, and ks in UDS, resulting in hard band ( keV) flux limits (over per cent of the survey area) of , , , , and erg s-1 cm-2, respectively. We match the coordinates of the extreme [O III] emitting objects (from the 3D-HST catalogs) to the X-ray source catalogs using a arcsec search radius. There are sources in our sample found to have X-ray counterparts within arcsec.
We next examine whether the X-ray luminosities () of the sources are consistent with those of X-ray AGN, which typically have erg s-1 at rest-frame keV. The X-ray luminosities of our sources were estimated by fitting the X-ray spectra assuming a power law with index for intrinsic AGN spectra (AEGIS: Buchner et al. 2015; COSMOS: Marchesi et al. 2016; GOODS-N: Xue et al. 2016; GOODS-S: Xue et al. 2011; UDS: Kocevski et al. 2018). The absorption corrected rest-frame keV luminosities () of the X-ray extreme [O III] emitting sources in our sample range from to erg s-1. Since all the sources have erg s-1, each is consistent with being an AGN.
The UV slope distribution of the extreme [O III] emitting AGN at is compared in Fig. 1 (black hatched histogram) to that of the total X-ray AGN sample in the CANDELS fields (grey histogram). Using the parent extreme [O III] emitter sample in T19, we estimate the fraction of extreme [O III] emitting X-ray AGN as a function of UV slope. About , , , and per cent of the extreme [O III] emitters with UV slopes , to , to , and harbour X-ray AGN, respectively. We note that we do not account for systems such as faint X-ray AGN or infrared AGN which the X-ray luminosities may be below the detection limit of current X-ray surveys, so the AGN fractions could be larger. Although extreme [O III] emitting AGN have relatively red (median ) UV slopes, they are on average bluer than those of the total X-ray AGN sample (median ). As the type II AGN continuum should not contribute significantly at rest-frame UV wavelengths (Assef et al., 2010), it appears that the host galaxies of extreme [O III] emitters are less dusty or more metal-poor than those of the majority of type II AGN at .
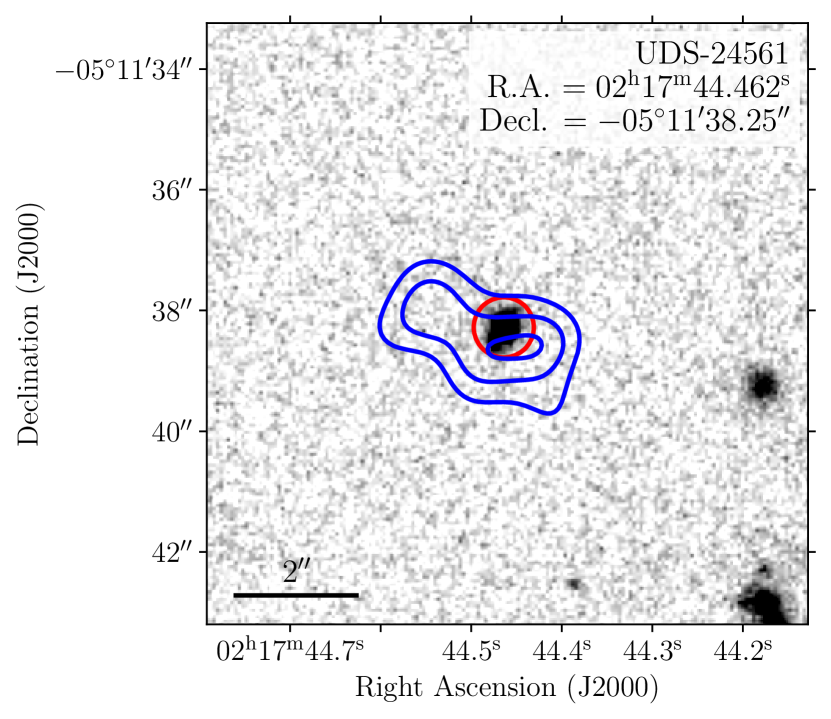
Our goal in this paper is to identify AGN at intermediate redshifts that are similar to the systems thought to harbour AGN in Laporte et al. (2017) and Mainali et al. (2018). Those objects are characterised by even bluer UV continuum slopes (; Fig. 1) and very large [O III]+H EWs ( Å in rest-frame) inferred from their extremely red Spitzer/IRAC colours. Among the sources in our sample, only one object, UDS-24561 (R.A. ::, Decl. ::; Fig. 2), satisfies the joint criteria of and rest-frame EW Å. By measuring the emission lines shown in the low resolution () HST grism spectrum (Momcheva et al. 2016; see Section 3.1), the estimated spectroscopic redshift of UDS-24561 is . We now examine this source in greater detail.
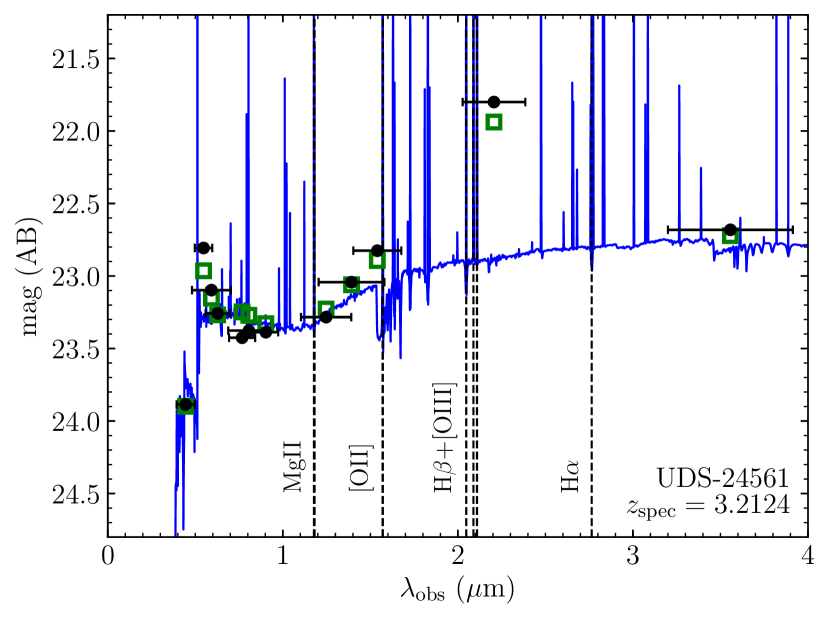
The multi-wavelength spectral energy distribution (SED) of UDS-24561 is presented in Fig. 3, which is extracted from the Skelton et al. (2014) photometry catalogs. This object is extremely luminous with absolute UV magnitude , i.e., about five times brighter than the characteristic at (; see Parsa et al. 2016, and references therein). The UV continuum slope of UDS-24561 is and was computed by fitting a power law () to the broadband fluxes at rest-frame Å (Calzetti et al., 1994). The intense -band flux excess indicates a large rest-frame [O III]+H EW ( Å; see Section 3.1 for more accurate measurements). Both properties are comparable to those of the putative AGN at discussed by Laporte et al. (2017) and Mainali et al. (2018). The absorption corrected of this object in the Kocevski et al. (2018) catalog is erg s-1, indicating that it is extremely luminous. The stellar mass inferred from BEAGLE (Chevallard & Charlot, 2016) SED fitting is . We note that the current version of the BEAGLE code does not permit including an AGN conponent, and since we primarily focus on identifying blue, extreme line emitting systems harbouring AGN in this paper, we do not discuss the SED fitting parameters in detail. We obtained the optical and near-infrared (rest-frame UV and optical) spectra of UDS-24561 via ground-based observations and HST archival data. We discuss the spectroscopic observations in the following subsections.
2.2 MMT/Binospec spectroscopy
The optical spectrum of UDS-24561 was obtained using the multi-slit spectrograph Binospec (Fabricant et al., 2019) on the MMT in order to measure the rest-frame UV emission lines. We designed one mask in the CANDELS/UDS field (centered at R.A. :: and Decl. ::, with position angle PA ) primarily targeting on UDS-24561. We filled the mask with non-AGN extreme [O III] emitting galaxies at , thereby continuing an ongoing survey targeting rest-frame UV metal emission lines (T21a) and the Ly emission line (T21b) in these systems. We observed this mask between 2020 October and November with a total on-target integration time of seconds during average seeing of arcsec. Optical spectra of the targets were taken using the lines mm-1 grism blazed at , with wavelength coverage from to Å. The slit width was set to arcsec, which results in a spectral resolution of . This mask contains two slit stars to compute the absolute flux calibration, and we also observed spectrophotometric standard stars at a similar airmass in order to correct the instrument response.
The Binospec spectra were reduced using the publicly available data reduction pipeline111https://bitbucket.org/chil_sai/binospec (Kansky et al., 2019). The pipeline performs flat-fielding, wavelength calibration, sky subtraction, and then the 2D spectra extraction. We created 1D spectra from the reduced 2D spectra using a boxcar extraction, with the extraction aperture matched to the spatial profile of the object. The atmospheric extinction and instrumental response were corrected using the sensitivity curve derived from observations of standard stars. We performed slit loss correction following the similar procedures in T19. We derived the spatial profile of each target from its HST F814W postage stamp, and computed the fraction of the light within the slit to that of the total spatial profile. The flux of each spectrum was then divided by the in-slit light fraction measured for each object. Finally, the absolute flux calibration was performed using observations of slit stars, by comparing the slit-loss corrected count rates of slit star spectra with the flux in the Skelton et al. (2014) catalogues.
2.3 Keck/MOSFIRE spectroscopy
We also obtained a near-infrared spectrum for UDS-24561 using the Multi-object Spectrometer for Infrared Exploration (MOSFIRE; McLean et al. 2012) on the Keck I telescope. We designed one multi-slit mask (centered at R.A. :: and Decl. ::, with position angle PA ) which primarily targets on UDS-24561. The mask was filled with non-AGN extreme [O III] emitting galaxies at following the survey strategy discussed in T19. We observed this mask on 2021 March 3 and 4, with a total on-target integration time of seconds and an average seeing of arcsec. The spectra were taken in the -band with wavelength coverage from to m, aiming to measure the H and [O III] emission lines for UDS-24561, as well as H or H and [O III] emission lines for the fillers. The slit width was set to arcsec, resulting in a spectral resolution of . We also placed two slit stars on the mask for absolute flux calibration, and observed A0V stars to derive the response spectra and correct for telluric absorption.
The MOSFIRE spectra were reduced using the publicly available PYTHON-based data reduction pipeline222https://keck-datareductionpipelines.github.io/MosfireDRP (DRP). The pipeline performs flat-fielding, wavelength calibration, and background subtraction before 2D spectra extraction. We created 1D spectra from the reduced 2D spectra using a boxcar extraction. The telluric absorption and instrumental response were corrected using observations of A0V stars. Slit loss correction of each target was performed using the in-slit light fraction computed from its HST F160W image. We then performed the absolute flux calibration using observations of slit stars, by comparing the observed fluxes of star spectra with the broadband photometry.
2.4 HST WFC3/G141 spectroscopy
In addition to the MMT/Binospec and the Keck/MOSFIRE -band observations, we use the emission line measurements in the HST Wide Field Camera 3 (WFC3) G141 slitless grism spectrum of UDS-24561 from the 3D-HST survey, which is described in detail in Momcheva et al. (2016). The HST WFC3/G141 grism has spectral coverage from to m (corresponding to ground-based and bands) and a spectral resolution of . The grism images were first reduced by removing satellites trails and earthshine, followed by flat-fielding and background subtraction. Then the exposures were combined by interlacing into output mosaic images used for the spectral extractions. After that a contamination model was created to account for overlapping spectra due to neighboring sources, and the 2D spectra of individual objects were extracted from the interlaced mosaic images and contamination were subtracted. Finally, the 1D spectra were extracted using the optimal extraction procedures (Horne, 1986).
3 Results
The luminous X-ray detection of UDS-24561 reveals that this system hosts an AGN. In this section, we explore the spectral properties of UDS-24561 in more detail with the optical and near-infrared spectra described in Section 2. We first present the emission line identification and measurements (Section 3.1), then compare the observed line ratios to line diagnostics developed from photoionisation models to examine their capability of identifying the nature of the ionising sources (Section 3.2).
3.1 Emission line measurements
The rest-frame UV and optical spectra of UDS-24561 are shown in Fig. 4. We visually inspect the spectra and identify a number of emission lines including O VI , Ly, C IV , He II , Mg II , [O II] , [Ne III] , H, [O III] , [O III] , and tentatively Si (), while N V , Si , O III] , and C III] emission lines are not detected. The systemic redshift of UDS-24561 is determined using the line centers of non-resonant emission lines with spectral resolution , i.e., He II , [O III] , and [O III] emission lines, resulting in .
Emission line fluxes of UDS-24561 are determined from the extracted 1D spectra. For He II , we fit the line profile with a single Gaussian to derive the line flux. For O VI and C IV doublets, we fit two Gaussians to derive the line flux of each individual component of the doublet. For [O III] , we fit two Gaussians with a broad and a narrow component since the emission line cannot be well fitted by a single Gaussian, and the narrow component was used to compute the systemic redshift. The Ly emission line of UDS-24561 shows a double-peak profile and we fit four Gaussians, so that both blue and red Ly components can be fitted by broad and a narrow components. For H and [O III] , we calculate the line flux using direct integration instead of fitting Gaussians since these two emission lines are contaminated by sky lines and thus have low signal-to-noise ratio (S/N ). We also use direct integration to compute the flux of the tentative Si emission line (S/N ). For the blended Mg II , [O II] doublets and [Ne III] which lie in the HST grism spectrum, we use the line flux provided in the Momcheva et al. (2016) catalogs. Previous studies show that the line fluxes measured from HST grism spectra are consistent with the values measured from ground-based observations (e.g., Kriek et al. 2015; T19). For the non-detected N V , Si , O III] , and C III] lines, we derive upper limits by summing the error spectrum in quadrature over kms, a value consistent with the upper bound of line widths found for UV metal lines (e.g., Stark et al., 2014).
We next compute the corresponding rest-frame EW for each emission line. Robust measurements of continuum flux are required to compute EWs. For emission lines (except for Ly) lying in the MMT/Binospec spectrum which shows bright continuum emission (S/N ), we derive the continuum flux density in a clean window of Å near the emission line in the extracted 1D spectrum. For Ly we estimate the continuum flux by averaging the flux over rest-frame Å in order to avoid contamination from nearby features (H I absorption blueward of Ly, and N V, Si II redward of Ly; e.g., Matthee et al. 2021). For Mg II, [O II], and [Ne III] in the HST grism spectrum, we use the EWs provided in the Momcheva et al. (2016) catalogs. We also compute these EWs by measuring the continuum flux from the grism spectrum and they are in agreement with the EWs provided by the 3D-HST team. For H and [O III] in the Keck/MOSFIRE spectrum where a bright continuum emission is not available, we derive the continuum flux by subtracting the emission line fluxes from the total -band flux. We summarise the emission line measurements of UDS-24561 in Table 1, including the deconvolved FWHMs (after subtracting the instrument resolution in quadrature), line fluxes, and EWs.
The most prominent emission line detected in the spectra of UDS-24561 is [O III] , with EW Å. The total [O III]+H EW measured from spectrum is Å, which is consistent with the value inferred from the -band flux excess (EW Å; Fig. 3). Such intense optical line emission is extremely rare at , but becomes more common in the reionisation era (e.g., per cent of the population has [O III]+H EW Å; Endsley et al. 2021a).
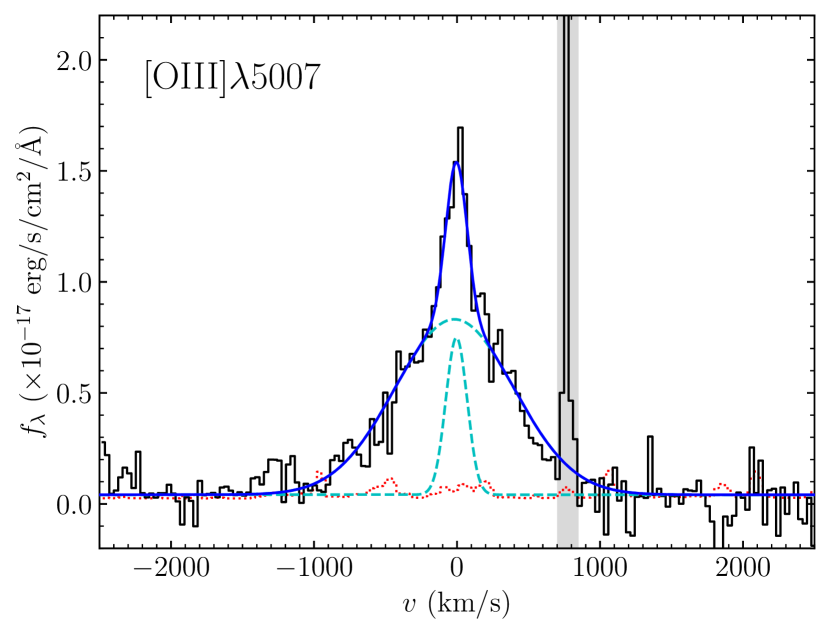
The [O III] doublets and H emission lines show extended profiles (Fig. 4), and the [O III] line is best fitted by two Gaussians: a narrow component with FWHM kms and a broad component with FWHM kms (Fig. 5). A broad line could be due to merger activity, emission from the broad line region of an AGN or AGN-driven outflows. We note that the HST image of UDS-24561 (Fig. 2) does not indicate any evidence of merger activity. Moreover, the broad [O III] line width of UDS-24561 is somewhat less than the typical line width seen in AGN broad line regions (FWHM kms). Although supernova feedback or shock-ionised outflows can also produce broad line emission, the FWHMs ( kms; e.g., Veilleux et al. 2005; Freeman et al. 2019; Matthee et al. 2021) are smaller than that of UDS-24561. On the other hand, the broad optical line velocity of UDS-24561 is in agreement with those of AGN outflows (e.g., Förster Schreiber et al., 2014; Genzel et al., 2014; Leung et al., 2017, 2019). We estimate a lower limit to the broad [O III] ratio using the total flux of H (since we cannot accurately decouple the broad and narrow emission components for H). The line ratio ( at ) is consistent with those of AGN (e.g., Coil et al., 2015; Azadi et al., 2017) and greater than the maximum ratio predicted by starburst models (e.g., Kauffmann et al., 2003; Kewley et al., 2013). Thus we conclude that the broad optical lines of UDS-24561 likely originate from an AGN-driven outflow.
The Ly emission line of UDS-24561 shows a more complex profile (Fig. 6). The emission is double-peaked, and both the blue and red Ly components show extended emission line features. None of the blue and red Ly component could be fitted by a single Gaussian. However, we find that each Ly component is best fitted by two Gaussians including a narrow (FWHM kms) and a broad (FWHM kms) component, indicating the blue and red wings extending to maximal velocities of kms and kms (Fig. 6). The broad wing features, together with the small velocity offset of red peak Ly (which is also consistent with the center of the narrow red Ly line) with respect to the systemic redshift ( kms), suggest conditions that are conducive to leaking Ly photons (e.g., Erb et al., 2014; Hashimoto et al., 2015; Henry et al., 2015; Martin et al., 2015). The total Ly luminosity and EW of UDS-24561 are extremely large, with erg s-1 and EW Å, which the is times the typical Ly luminosity of LAEs at ( erg s-1; e.g., Sobral et al. 2018a). Such luminous and ( times the typical UV luminosity at ; Parsa et al. 2016), together with the blue UV slope, are consistent with the picture that the physics of accretion discs of massive black holes can destroy the dust in very luminous systems and allow Ly and UV photons to escape (e.g., Sobral et al., 2018b).
Intense high ionisation emission lines from O VI,333The spectral resolution of MMT/Binospec allows us to deblend Ly (at rest-frame Å) and O VI lines, Si IV , C IV, and He II have also been detected in the rest-frame UV spectrum of UDS-24561 (Fig. 4), suggesting a hard ionising radiation field powered by an AGN (e.g., Feltre et al., 2016; Volonteri et al., 2017). Unlike Ly, H, or [O III], we do not detect significant broad emission features for these high ionisation lines. As the UV line fluxes are relatively fainter, it could be more difficult to detect broad emission components and deeper spectra are required to measure such features. The line profile of He II is narrow and the line width is comparable to the instrument resolution. We estimate the upper limit of the deconvolved FWHM kms for He II, which is consistent with the FWHM of the narrow [O III] emission line ( kms). Individual components of the O VI and C IV doublets show wider FWHMs ( kms), which could be due to the resonant nature of these emission lines.
The O VI, Si IV , C IV, and He II EWs derived from the spectrum of UDS-24561 are EW Å, EW Å, EW Å and EW Å. Significant stellar or interstellar absorption features are not seen in the vicinity of O VI, Si IV , or C IV emission lines, although we cannot rule out a modest level of absorption and hence these emission line EWs could be even larger. The majority of metal-poor SFGs do not present such large EWs (e.g., Erb et al., 2010; Vanzella et al., 2016; Senchyna et al., 2017; Senchyna et al., 2019; Berg et al., 2018, 2019; Du et al., 2020), except a few sources show similar C IV EWs (Stark et al., 2015; Mainali et al., 2017; Vanzella et al., 2017). On the contrary, the high ionisation line EWs of UDS-24561 are comparable to the values measured in AGN (e.g., Hainline et al., 2011; Le Fèvre et al., 2019; Mignoli et al., 2019; Grazian et al., 2020; Saxena et al., 2020). Using the available UV emission line ratios of UDS-24561, we will test whether the line diagnostics developed to identify ionising sources are capable of distinguishing between spectra powered by blue, extreme optical line emitting AGN and massive stars in Section 3.2.
| Line | FWHM | Flux | EW | |
|---|---|---|---|---|
| (Å) | (kms) | ( erg s-1 cm-2) | (Å) | |
| VI | ||||
| … | ||||
| Ly | ||||
| Ly | ||||
| Ly | … | |||
| Ly | ||||
| Ly | ||||
| Ly | … | |||
| N V | … | |||
| … | … | |||
| Si IV | … | |||
| … | … | |||
| C IV | ||||
| … | ||||
| He II | ||||
| III | … | |||
| … | … | |||
| C III | … | |||
| Mg II | … | |||
| II | … | |||
| Ne III | … | |||
| H | … | |||
| III | … | |||
| III | ||||
| III | ||||
| III | … |
a Narrow component of the blue peak of Ly.
b Broad component of the blue peak of Ly.
c Total of the blue peak of Ly.
d Narrow component of the red peak of Ly.
e Broad component of the red peak of Ly.
f Total of the red peak of Ly.
g Total of the blended C III] .
h Total of the blended Mg II .
i Total of the blended [O II] .
j Narrow component of [O III] .
k Broad component of [O III] .
l Total of [O III] .


3.2 Emission line diagnostics
Various diagnostics involving rest-frame UV emission lines have been developed to determine the nature of the ionising sources (i.e., star formation, nuclear activity, or shocks) using photoionisation models (e.g., Feltre et al., 2016; Nakajima et al., 2018; Hirschmann et al., 2019). The emission line measurements of UDS-24561 provide a unique opportunity to examine the capability of the line diagnostics in identifying AGN in extreme optical line emitting systems with blue UV slopes. Since blue, extreme [O III] emitting sources are common at (e.g., Smit et al., 2015; Endsley et al., 2021a), and UV emission lines will likely remain the most useful diagnostics for studies of the most distant galaxies, our present analysis will provide useful insight into identifying AGN in the reionisation era.
For emission line ratios predicted from photoionisation models, we consider the SFG models taken from Gutkin et al. (2016) and the latest version of Feltre et al. (2016) AGN narrow line region models presented in Mignoli et al. (2019). The nebular emission of both models is computed using the photoionisation code CLOUDY (Ferland et al., 2013). In this work, we focus on emission line ratios involving O III] and C IV , He II . Since the ionising spectra of metal-poor hot stars decline rapidly around eV while those of AGN extend to much higher energies (e.g., Figure 1 in Feltre et al. 2016), the oxygen atoms in AGN are expected to be largely triply ionised while C IV and He II emission is strong compared to SFGs. We thus expect a decrease in O III] to He II or C IV ratio in AGN, and these line ratios can be used to determine the ionising sources.
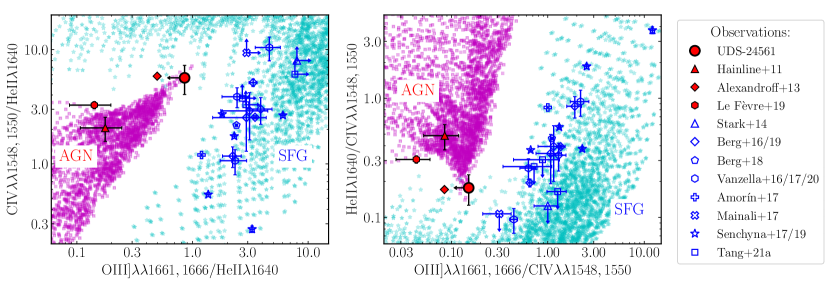
In the left panel of Fig. 7, we show the C IVHe II versus O III]He II diagnostic for both nebular emission from photoionisation models (magenta squares: AGN; cyan stars: SFG) and observations (red solid symbols: AGN; blue open symbols: SFG). Photoionisation models and observations at in literature indicated that narrow-line AGN reach smaller C IVHe II ratios () as well as smaller O III]He II ratios at fixed C IVHe II compared to non-AGN SFGs. The line ratios of the blue, extreme [O III] emitting AGN, UDS-24561, are also consistent with this picture. Using the AGN models in Feltre et al. (2016), we find that the UV line ratios of UDS-24561 are best reproduced by an ionising spectrum with a slope of (assuming at rest-frame wavelength Å) and a very large ionisation parameter (). We also notice that the line ratios of UDS-24561 are located in the AGN SFG region, implying that they can be reproduced by a few SFG models as well. However, for non-AGN SFG models to reproduce the line ratios of UDS-24561, much lower ionisation parameters () and larger gas-phase metallicities () are required, both conditions allowing to reduce the emissivity of O III] relative to He II. SFG models with such conditions are not able to reproduce the large C IV EWs seen in AGN.444Using the BEAGLE tool (Chevallard & Charlot, 2016) which adopted the latest version of stellar population synthesis code in Bruzual & Charlot (2003) and the nebular emission models from Gutkin et al. (2016), the largest predicted C IV EW for models with and is only Å assuming a constant star formation history, which is significantly smaller than the C IV EWs of AGN.
The flux ratio of O III] and C IV provides another way to determine the ionising sources (e.g., Mainali et al., 2017). In the right panel of Fig. 7 we show the He IIC IV versus O III]C IV diagnostic. The O III]C IV ratio of UDS-24561 is consistent with those of UV-selected AGN at similar redshift in literature (Hainline et al., 2011; Alexandroff et al., 2013; Le Fèvre et al., 2019), which are larger than the ratios of non-AGN metal-poor SFGs at fixed He IIC IV ratio. We also notice that the UV-blue AGN UDS-24561 appears to have smaller He IIC IV ratio compared to AGN with red UV continua at similar redshift in Hainline et al. (2011) and Le Fèvre et al. (2019). This may suggest different properties between these two populations (e.g., metallicity or dust content of the host galaxies, see Section 1). The results presented in Fig. 7 demonstrate that emission line diagnostics involving high ionisation lines such as C IV, He II, and O III] are applicable to identifying AGN in extreme optical line emitting galaxies with blue UV continua. Future spectroscopic observations of a larger statistical sample of such systems will help to confirm the capability of the UV diagnostics in determining the ionising sources of reionisation-era galaxies.
4 Discussion
In the foregoing, we have demonstrated that, both from its detailed spectrum and X-ray luminosity, the extreme line emitting galaxy UDS-24561 contains an AGN. Yet it is also a close analogue of sources known to be common in the reionisation era. UDS-24561 displays a very blue UV slope () and a large [O III]+H EW ( Å). Rest-frame optical line emission appears to be prominent at (e.g., Labbé et al., 2013; De Barros et al., 2019; Endsley et al., 2021a) and per cent of this population has extremely large [O III]+H EW of Å (Endsley et al., 2021a), similar to the [O III]+H EW of UDS-24561. The UV continuum slopes of the reionisation-era population () are also bluer than those of star-forming galaxies at lower redshifts (e.g., Bouwens et al., 2012, 2014; Finkelstein et al., 2012). In this section, we consider the implications of UDS-24561 for identifying AGN activity in reionisation-era galaxies and their contribution to the ionising background at .
UDS-24561 provides a detailed glimpse of a population of AGN that may become common in the reionisation era. Its distinct properties relative to more typical AGN at intermediate redshifts may be useful in locating AGN at very high redshift (), leading to a better understanding of their role in contributing to cosmic reionisation. This is further supported by the fact that extreme optical line emitting systems are likely effective ionising agents (e.g., Chevallard et al. 2018; Fletcher et al. 2019; \al@Tang2019,Tang2021b; \al@Tang2019,Tang2021b).
Unfortunately, identifying AGN activity at with traditional means is likely to be difficult with current facilities. Current deep X-ray surveys do not have the sensitivity to locate individual examples. Consider, for example, an X-ray source with the same luminosity as UDS-24561. The full ( keV), soft ( keV), and hard band ( keV) fluxes of UDS-24561 at are , , and erg s-1 cm-2 (Kocevski et al., 2018), respectively. At such a source would have X-ray fluxes of , , and erg s-1 cm-2, respectively, in the full, soft, and hard bands assuming a power-law index of (Brightman et al., 2014). These fluxes are comparable to the sensitivity of the ks deep Chandra X-ray survey in the CANDELS/UDS field (, , and erg s-1 cm-2 in the full, soft, and hard band; Kocevski et al. 2018). Although the Ms Chandra Deep Field-South survey reaches deeper flux limits (Xue et al., 2011), an individual AGN at with erg s-1 would still be undetected. Not surprisingly, no X-ray counterparts have been seen in all the six luminous () N V-emitting galaxies at (Tilvi et al., 2016; Hu et al., 2017; Laporte et al., 2017; Mainali et al., 2018; Sobral et al., 2019; Endsley et al., 2021b). Future X-ray facilities will help accumulate larger AGN samples in the reionisation era (e.g., Vito et al., 2018).
Likewise the broad H and [O III] emission lines of UDS-24561, which likely reflect AGN-driven outflows, cannot readily be revealed in spectra with current facilities. Detecting broad emission in individual lines requires relatively high resolution spectra () of good quality (S/N ). Although the blended [O III]+H luminosities and EWs of systems can be estimated from the Spitzer/IRAC colors (e.g., Labbé et al., 2013; Smit et al., 2014; De Barros et al., 2019; Endsley et al., 2021a), clearly broad emission cannot be discerned. As with studies of the diagnostic line ratios of [N II]H or [S II]H in the mid-infrared, rest-frame optical diagnostics of AGN activity at must await spectroscopy with JWST/NIRSpec.
We then consider the feasibility of detecting broad [O III] emission in the reionisation era with JWST/NIRSpec. To robustly measure the broad feature, a good quality (S/N ) detection of the broad wings is required. If we consider a galaxy at harbouring AGN and with broad [O III] EW Å and FWHM kms (i.e., with parameters similar to those of UDS-24561), the predicted broad [O III] emission line fluxes will be and erg s-1 cm-2 for a source with the rest-frame optical continuum apparent magnitude of and ( and in absolute magnitude; assuming a flat continuum in ), respectively. Using the medium resolution (R ) NIRSpec MSA observations with the G395M/F290LP disperser-filter combination, the JWST exposure time calculator predicts the broad wings at kms away from the line center can be detected with S/N in (continuum magnitude of ) and hours (continuum magnitude of ). The results demonstrates that reionisation-era AGN can be identified in a relatively short integration time with JWST/NIRSpec if they contain broad [O III] emission like in UDS-24561.
Signs of AGN activity in the reionisation era can also be probed by rest-frame UV spectroscopy. The presence of high ionisation emission lines such as O VI or N V, and strong Mg II line emission suggest hard radiation fields that are likely powered by AGN. As discussed in Section 3.2 and earlier work (e.g., Alexandroff et al., 2013; Feltre et al., 2016; Laporte et al., 2017; Mainali et al., 2017; Nakajima et al., 2018; Hirschmann et al., 2019; Mignoli et al., 2019), UV line diagnostics are capable of characterising the shape of the ionising spectrum and hence distinguishing between AGN and star formation. However, this requires relatively high signal-to-noise ratio spectroscopy that can place key constraints on multiple high ionisation UV lines including C IV and He II.
We have argued in this paper that UDS-24561 may provide a possible template for estimating the abundance of galaxies hosting AGN if its combination of intense [O III] emission and blue UV continuum slopes is a key characteristic. Although simply a hypothesis at present given the paucity of examples, the similarity between the properties of UDS-24561 and candidate galaxies with AGN in the reionisation era is striking.
Recently, Naidu et al. (2020) interpreted a rapid conclusion of reionisation over in the context of an additional population of rarer, more massive galaxies. In their Model I, bright galaxies with , which account for less than per cent of the early population, are arranged to account for per cent of the reionising photon budget. Via this hypothetical model, the rapid evolution in the redshift-dependent neutral fraction in the IGM can be matched. Although clearly not an unique interpretation of the data, a possible physical explanation of such a mass-dependent contribution of ionising photons would be the late development of AGN in a subset of massive galaxies, each of which would have more powerful ionising capabilities.
As an illustration of this hypothesis in the context of UDS-24561, we can estimate the additional contribution of ionising photons arising if some proportion of sources with intense [O III] emission and blue UV continuum slopes have a per cent escape fraction due to a powerful AGN. The assumed per cent escape fraction for AGN is often adopted in studies modeling the contribution of AGN to the ionising background (e.g. Madau & Haardt, 2015). Recent works indicate slightly lower escape fraction for AGN (e.g. Romano et al., 2019; Iwata et al., 2021; Trebitsch et al., 2021), with an average value of inferred from observations of bright quasars and faint AGN at (Cristiani et al., 2016; Grazian et al., 2018). If, for example, per cent of such luminous galaxies harbour AGN and the escape fraction assigned to this subset is (), and the remaining sources have , AGN can readily supply the required energy budget of per cent ( per cent) adopted in Model I in Naidu et al. (2020). Indeed, there is room to relax the adopted escape fraction for non-AGN sources to lower values, depending on the adopted luminosity limit for hosting AGN.
Although our adopted AGN fraction of per cent in luminous is arbitrary, we note that Endsley et al. (2021a) find per cent of sources have intense [O III]+H with EW Å and blue UV continua. Furthermore, although we have adopted a constant ionising photon production efficiency (i.e., hydrogen ionising photon production rate per non-ionising UV luminosity at rest-frame Å) for all sources regardless of luminosity, a higher value for AGN would increase their contribution to the ionising photon budget. These findings illustrate the importance of further examining lower redshift analogues such as UDS-24561.
Given its rarity in the parent sample of extreme [O III] emitters we matched with Chandra data, it may be challenging to find further intermediate redshift AGN similar to UDS-24561. On the other hand, it may be fruitful to focus on extreme [O III] emitters with slightly lower EWs and redder UV slopes given the continuity in the population and the contrast with nearby AGN in Figure 1. By expanding such searches to encompass other wide-field surveys, we can hopefully provide the necessary baseline of properties of low redshift AGN for comparison with targets in the reionisation era.
Ultimately the statistical baseline of spectroscopic properties of blue, extreme [O III] galaxies harbouring AGN at intermediate redshift including UDS-24561 will provide useful clues in guiding future JWST emission line surveys in the reionisation era. Since rest-frame UV and optical spectra of galaxies will be obtained by JWST/NIRSpec, AGN activities in these systems could be revealed via broad optical emission features or UV line diagnostics involving high ionisation emission lines like C IV and He II as discussed in Section 3. This will provide a valuable census of AGN at , hence constraining the contribution of AGN to cosmic reionisation.
Acknowledgements
MT and RSE acknowledge funding from the European Research Council under the European Union Horizon 2020 research and innovation programme (grant agreement No. 669253). RE acknowledges funding from JWST/NIRCam contract to the University of Arizona, NAS5-02015. We would like to thank Nicolas Laporte, Jianwei Lyu, and Feige Wang for useful discussions.
This work is based on observations taken by the 3D-HST Treasury Program (GO 12177 and 12328) with the NASA/ESA HST, which is operated by the Association of Universities for Research in Astronomy, Inc., under NASA contract NAS5-26555. Part of the observations reported here were obtained at the MMT Observatory, a joint facility of the University of Arizona and the Smithsonian Institution. We acknowledge the MMT queue observers for assisting with MMT/Binospec observations. Part of the data presented herein were obtained at the W. M. Keck Observatory, which is operated as a scientific partnership among the California Institute of Technology, the University of California and the National Aeronautics and Space Administration. The Observatory was made possible by the generous financial support of the W. M. Keck Foundation. The scientific results reported in this article are based in part on data obtained from the Chandra Data Archive.
Data Availability
The 3D-HST data can be accessed from https://archive.stsci.edu/prepds/3d-hst/. The data underlying this article will be shared on reasonable request to the corresponding author.
References
- Alexandroff et al. (2013) Alexandroff R., et al., 2013, MNRAS, 435, 3306
- Allen et al. (2008) Allen M. G., Groves B. A., Dopita M. A., Sutherland R. S., Kewley L. J., 2008, ApJS, 178, 20
- Amorín et al. (2017) Amorín R., et al., 2017, Nature Astronomy, 1, 0052
- Assef et al. (2010) Assef R. J., et al., 2010, ApJ, 713, 970
- Astropy Collaboration et al. (2013) Astropy Collaboration et al., 2013, A&A, 558, A33
- Azadi et al. (2017) Azadi M., et al., 2017, ApJ, 835, 27
- Barro et al. (2019) Barro G., et al., 2019, ApJS, 243, 22
- Berg et al. (2016) Berg D. A., Skillman E. D., Henry R. B. C., Erb D. K., Carigi L., 2016, ApJ, 827, 126
- Berg et al. (2018) Berg D. A., Erb D. K., Auger M. W., Pettini M., Brammer G. B., 2018, ApJ, 859, 164
- Berg et al. (2019) Berg D. A., Erb D. K., Henry R. B. C., Skillman E. D., McQuinn K. B. W., 2019, ApJ, 874, 93
- Bouwens et al. (2012) Bouwens R. J., et al., 2012, ApJ, 754, 83
- Bouwens et al. (2014) Bouwens R. J., et al., 2014, ApJ, 793, 115
- Bouwens et al. (2015a) Bouwens R. J., et al., 2015a, ApJ, 803, 34
- Bouwens et al. (2015b) Bouwens R. J., Illingworth G. D., Oesch P. A., Caruana J., Holwerda B., Smit R., Wilkins S., 2015b, ApJ, 811, 140
- Brammer et al. (2012) Brammer G. B., et al., 2012, ApJS, 200, 13
- Brightman et al. (2014) Brightman M., Nandra K., Salvato M., Hsu L.-T., Aird J., Rangel C., 2014, MNRAS, 443, 1999
- Bruzual & Charlot (2003) Bruzual G., Charlot S., 2003, MNRAS, 344, 1000
- Buchner et al. (2015) Buchner J., et al., 2015, ApJ, 802, 89
- Calzetti et al. (1994) Calzetti D., Kinney A. L., Storchi-Bergmann T., 1994, ApJ, 429, 582
- Chevallard & Charlot (2016) Chevallard J., Charlot S., 2016, MNRAS, 462, 1415
- Chevallard et al. (2018) Chevallard J., et al., 2018, MNRAS, 479, 3264
- Civano et al. (2016) Civano F., et al., 2016, ApJ, 819, 62
- Coil et al. (2015) Coil A. L., et al., 2015, ApJ, 801, 35
- Cristiani et al. (2016) Cristiani S., Serrano L. M., Fontanot F., Vanzella E., Monaco P., 2016, MNRAS, 462, 2478
- Dayal & Ferrara (2018) Dayal P., Ferrara A., 2018, Phys. Rep., 780, 1
- De Barros et al. (2019) De Barros S., Oesch P. A., Labbé I., Stefanon M., González V., Smit R., Bouwens R. J., Illingworth G. D., 2019, MNRAS, 489, 2355
- Du et al. (2020) Du X., Shapley A. E., Tang M., Stark D. P., Martin C. L., Mobasher B., Topping M. W., Chevallard J., 2020, ApJ, 890, 65
- Endsley et al. (2021a) Endsley R., Stark D. P., Chevallard J., Charlot S., 2021a, MNRAS, 500, 5229
- Endsley et al. (2021b) Endsley R., Stark D. P., Charlot S., Chevallard J., Robertson B., Bouwens R. J., Stefanon M., 2021b, MNRAS, 502, 6044
- Erb et al. (2010) Erb D. K., Pettini M., Shapley A. E., Steidel C. C., Law D. R., Reddy N. A., 2010, ApJ, 719, 1168
- Erb et al. (2014) Erb D. K., et al., 2014, ApJ, 795, 33
- Fabricant et al. (2019) Fabricant D., et al., 2019, PASP, 131, 075004
- Fan et al. (2006) Fan X., et al., 2006, AJ, 132, 117
- Feltre et al. (2016) Feltre A., Charlot S., Gutkin J., 2016, MNRAS, 456, 3354
- Ferland et al. (2013) Ferland G. J., et al., 2013, Rev. Mex. Astron. Astrofis., 49, 137
- Finkelstein et al. (2012) Finkelstein S. L., et al., 2012, ApJ, 756, 164
- Finkelstein et al. (2015) Finkelstein S. L., et al., 2015, ApJ, 810, 71
- Fletcher et al. (2019) Fletcher T. J., Tang M., Robertson B. E., Nakajima K., Ellis R. S., Stark D. P., Inoue A., 2019, ApJ, 878, 87
- Förster Schreiber et al. (2014) Förster Schreiber N. M., et al., 2014, ApJ, 787, 38
- Freeman et al. (2019) Freeman W. R., et al., 2019, ApJ, 873, 102
- Genzel et al. (2014) Genzel R., et al., 2014, ApJ, 796, 7
- Grazian et al. (2018) Grazian A., et al., 2018, A&A, 613, A44
- Grazian et al. (2020) Grazian A., et al., 2020, ApJ, 897, 94
- Grogin et al. (2011) Grogin N. A., et al., 2011, ApJS, 197, 35
- Gutkin et al. (2016) Gutkin J., Charlot S., Bruzual G., 2016, MNRAS, 462, 1757
- Hainline et al. (2011) Hainline K. N., Shapley A. E., Greene J. E., Steidel C. C., 2011, ApJ, 733, 31
- Hainline et al. (2012) Hainline K. N., Shapley A. E., Greene J. E., Steidel C. C., Reddy N. A., Erb D. K., 2012, ApJ, 760, 74
- Hashimoto et al. (2015) Hashimoto T., et al., 2015, ApJ, 812, 157
- Henry et al. (2015) Henry A., Scarlata C., Martin C. L., Erb D., 2015, ApJ, 809, 19
- Hirschmann et al. (2019) Hirschmann M., Charlot S., Feltre A., Naab T., Somerville R. S., Choi E., 2019, MNRAS, 487, 333
- Horne (1986) Horne K., 1986, PASP, 98, 609
- Hu et al. (2017) Hu W., et al., 2017, ApJ, 845, L16
- Hunter (2007) Hunter J. D., 2007, Computing in Science and Engineering, 9, 90
- Iwata et al. (2021) Iwata I., et al., 2021, MNRAS, tmp, 2494I
- Jaskot & Ravindranath (2016) Jaskot A. E., Ravindranath S., 2016, ApJ, 833, 136
- Jones et al. (2001) Jones E., Oliphant T., Peterson P., et al., 2001, SciPy: Open source scientific tools for Python, http://www.scipy.org/
- Kansky et al. (2019) Kansky J., et al., 2019, PASP, 131, 075005
- Kauffmann et al. (2003) Kauffmann G., et al., 2003, MNRAS, 346, 1055
- Kewley et al. (2013) Kewley L. J., Maier C., Yabe K., Ohta K., Akiyama M., Dopita M. A., Yuan T., 2013, ApJ, 774, L10
- Kocevski et al. (2018) Kocevski D. D., et al., 2018, ApJS, 236, 48
- Koekemoer et al. (2011) Koekemoer A. M., et al., 2011, ApJS, 197, 36
- Kriek et al. (2015) Kriek M., et al., 2015, ApJS, 218, 15
- Labbé et al. (2013) Labbé I., et al., 2013, ApJ, 777, L19
- Laird et al. (2009) Laird E. S., et al., 2009, ApJS, 180, 102
- Laporte et al. (2017) Laporte N., Nakajima K., Ellis R. S., Zitrin A., Stark D. P., Mainali R., Roberts-Borsani G. W., 2017, ApJ, 851, 40
- Le Fèvre et al. (2019) Le Fèvre O., et al., 2019, A&A, 625, A51
- Leung et al. (2017) Leung G. C. K., et al., 2017, ApJ, 849, 48
- Leung et al. (2019) Leung G. C. K., et al., 2019, ApJ, 886, 11
- Loeb & Barkana (2001) Loeb A., Barkana R., 2001, ARA&A, 39, 19
- Madau & Haardt (2015) Madau P., Haardt F., 2015, ApJ, 813, L8
- Mainali et al. (2017) Mainali R., Kollmeier J. A., Stark D. P., Simcoe R. A., Walth G., Newman A. B., Miller D. R., 2017, ApJ, 836, L14
- Mainali et al. (2018) Mainali R., et al., 2018, MNRAS, 479, 1180
- Marchesi et al. (2016) Marchesi S., et al., 2016, ApJ, 817, 34
- Martin et al. (2015) Martin C. L., Dijkstra M., Henry A., Soto K. T., Danforth C. W., Wong J., 2015, ApJ, 803, 6
- Matthee et al. (2021) Matthee J., et al., 2021, MNRAS, 505, 1382
- McGreer et al. (2015) McGreer I. D., Mesinger A., D’Odorico V., 2015, MNRAS, 447, 499
- McLean et al. (2012) McLean I. S., et al., 2012, in McLean I. S., Ramsay S. K., Takami H., eds, Society of Photo-Optical Instrumentation Engineers (SPIE) Conference Series Vol. 8446, Ground-based and Airborne Instrumentation for Astronomy IV. p. 84460J, doi:10.1117/12.924794
- Mignoli et al. (2019) Mignoli M., et al., 2019, A&A, 626, A9
- Momcheva et al. (2016) Momcheva I. G., et al., 2016, ApJS, 225, 27
- Naidu et al. (2020) Naidu R. P., Tacchella S., Mason C. A., Bose S., Oesch P. A., Conroy C., 2020, ApJ, 892, 109
- Nakajima et al. (2018) Nakajima K., et al., 2018, A&A, 612, A94
- Nandra et al. (2015) Nandra K., et al., 2015, ApJS, 220, 10
- Oesch et al. (2018) Oesch P. A., Bouwens R. J., Illingworth G. D., Labbé I., Stefanon M., 2018, ApJ, 855, 105
- Oke & Gunn (1983) Oke J. B., Gunn J. E., 1983, ApJ, 266, 713
- Onoue et al. (2021) Onoue M., et al., 2021, arXiv e-prints, p. arXiv:2106.13807
- Ouchi et al. (2020) Ouchi M., Ono Y., Shibuya T., 2020, ARA&A, 58, 617
- Parsa et al. (2016) Parsa S., Dunlop J. S., McLure R. J., Mortlock A., 2016, MNRAS, 456, 3194
- Planck Collaboration et al. (2020) Planck Collaboration et al., 2020, A&A, 641, A6
- Plat et al. (2019) Plat A., Charlot S., Bruzual G., Feltre A., Vidal-García A., Morisset C., Chevallard J., Todt H., 2019, MNRAS, 490, 978
- Robertson et al. (2015) Robertson B. E., Ellis R. S., Furlanetto S. R., Dunlop J. S., 2015, ApJ, 802, L19
- Romano et al. (2019) Romano M., Grazian A., Giallongo E., Cristiani S., Fontanot F., Boutsia K., Fiore F., Menci N., 2019, A&A, 632, A45
- Saxena et al. (2020) Saxena A., et al., 2020, A&A, 636, A47
- Senchyna et al. (2017) Senchyna P., et al., 2017, MNRAS, 472, 2608
- Senchyna et al. (2019) Senchyna P., Stark D. P., Chevallard J., Charlot S., Jones T., Vidal-García A., 2019, MNRAS, 488, 3492
- Skelton et al. (2014) Skelton R. E., et al., 2014, ApJS, 214, 24
- Smit et al. (2014) Smit R., et al., 2014, ApJ, 784, 58
- Smit et al. (2015) Smit R., et al., 2015, ApJ, 801, 122
- Sobral et al. (2018a) Sobral D., Santos S., Matthee J., Paulino-Afonso A., Ribeiro B., Calhau J., Khostovan A. A., 2018a, MNRAS, 476, 4725
- Sobral et al. (2018b) Sobral D., et al., 2018b, MNRAS, 477, 2817
- Sobral et al. (2019) Sobral D., et al., 2019, MNRAS, 482, 2422
- Stanway et al. (2016) Stanway E. R., Eldridge J. J., Becker G. D., 2016, MNRAS, 456, 485
- Stark (2016) Stark D. P., 2016, ARA&A, 54, 761
- Stark et al. (2014) Stark D. P., et al., 2014, MNRAS, 445, 3200
- Stark et al. (2015) Stark D. P., et al., 2015, MNRAS, 454, 1393
- Steidel et al. (2014) Steidel C. C., et al., 2014, ApJ, 795, 165
- Tang et al. (2019) Tang M., Stark D. P., Chevallard J., Charlot S., 2019, MNRAS, 489, 2572
- Tang et al. (2021a) Tang M., Stark D. P., Chevallard J., Charlot S., Endsley R., Congiu E., 2021a, MNRAS, 501, 3238
- Tang et al. (2021b) Tang M., Stark D. P., Chevallard J., Charlot S., Endsley R., Congiu E., 2021b, MNRAS, 503, 4105
- Tilvi et al. (2016) Tilvi V., et al., 2016, ApJ, 827, L14
- Trebitsch et al. (2021) Trebitsch M., et al., 2021, A&A, 653, A154
- Vanzella et al. (2016) Vanzella E., et al., 2016, ApJ, 821, L27
- Vanzella et al. (2017) Vanzella E., et al., 2017, ApJ, 842, 47
- Vanzella et al. (2020) Vanzella E., et al., 2020, MNRAS, 491, 1093
- Veilleux et al. (2005) Veilleux S., Cecil G., Bland-Hawthorn J., 2005, ARA&A, 43, 769
- Vito et al. (2018) Vito F., et al., 2018, MNRAS, 473, 2378
- Volonteri et al. (2017) Volonteri M., Reines A. E., Atek H., Stark D. P., Trebitsch M., 2017, ApJ, 849, 155
- Xue et al. (2011) Xue Y. Q., et al., 2011, ApJS, 195, 10
- Xue et al. (2016) Xue Y. Q., Luo B., Brandt W. N., Alexander D. M., Bauer F. E., Lehmer B. D., Yang G., 2016, ApJS, 224, 15