Low-Dispersive Permittivity Measurement Based on Transmitted Power Only
Abstract
This paper presents a complex permittivity measurement method for low-dispersive materials as a function of frequency. The introduced method relies only on transmitted power signals which are collected using a spectrum analyzer/power meter, removing the need for phase measurements and a vector network analyzer. This method provides a very good accuracy along with easy and inexpensive permittivity measurements.
Index Terms:
Complex Permittivity, Transmitted Power, Low-Dispersive.I Introduction
Permittivity measurements of materials as a function of frequency finds applications in numerous fields, including medical imaging, food sciences, and agriculture [1, 2]. Several techniques have been widely used to determine material permittivities, such as open-ended coaxial, free-space, cavity resonant, and waveguides. The open-ended coaxial method covers a wide range of frequencies and provides easy measurements; however, suffers from low accuracy [3, 4]. Additionally, reports show that this technique cannot provide reliable results for heterogeneous medium [4]. The free-space method provides a wide-band permittivity measurement with high accuracy, but requires costly measurement setups and large sampling preparation. Cavity resonant techniques are among the highest accurate methods, but are very narrow-band and can be only applicable to low-loss materials. Waveguide techniques provide high accuracy and moderate bandwidth of operation but need cumbersome sample preparations [1]. These methods mainly rely on both amplitude and phase measurements which require vector network analyzers. There are only a few amplitude-only techniques reported in the literature that do not need phase information [5]. These methods, however, cannot provide high accuracy because their preciseness rely on a specific amount of loss that should occur in the sample while signals propagate from the source to the receiver. Additionally, some of them still require a vector network analyzer to measure signals’ reflections.
In this paper, we apply our previously introduced single-frequency permittivity reconstruction method [3, 6] to measure the permittivity of low-dispersive materials as a function of frequency. No phase information is used in this method and only transmitted power collected at multiple frequencies are utilized to reconstruct the permittivity values. Therefore, the need for a vector network analyzer is removed. Measurement results acquired from our method are compared with the open-ended coaxial method’s, validating the fidelity of our method.
II Methodology
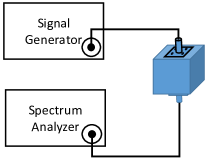
This section briefly discusses our power method applied to a coaxial line structure. The method can be also applied to other permittivity reconstruction setups such as the free-space one. Fig. 1 shows a coaxial line connected to a signal generator with an internal source resistance of and to a spectrum analyzer with a load resistance of . Solving Maxwell equations for the transmitted power delivered to the spectrum analyzer analytically results in:
| (1) |
where , , and are the source voltage, reflection coefficient at the load, and the frequency of excitation, respectively. is the power calculated analytically. is the input impedance seen from the source side toward the load. The coaxial line has an outer radius of 4.1 mm, inner radius of 1.27 mm, and a length of 3.6 cm. The space between the inner and outer is filled with the material under test with the real permittivity of and imaginary part of , (). The material is assumed to be non-magnetic and low-dispersive.
Equation 1 depends non-linearly on the excitation frequency. Therefore, multiple independent equations can be generated by changing the frequency. If material under test is not highly dispersive, its permittivity function varies smoothly versus frequency. Hence, within a finite bandwidth the permittivity can be approximately considered constant. The following equation is then defined as an objective function which compares the transmitted power obtained analytically with the power values obtained from measurements at a specific frequency:
| (2) |
where is the difference between measured power, , and calculated power.
Generating multiple equations based on 2 in a finite bandwidth creates a set of objective functions with two unknowns, and . Multiple power samples, in this paper twenty samples, are selected linearly in this bandwidth and substituted in 2. Solving these objective functions numerically to minimize results in determining a unique pair for and . The obtained permittivity is assigned to the frequency located at the center of this bandwidth, . Readers are referred to our previous works for more details on the permittivity reconstruction procedure [3]. Fig. 2 shows an example of measured power as a function of frequency. The power samples are picked up in a window from to and the permittivity is assigned to .
This method can then be applied to determine the permittivity at other frequencies. If the bandwidth window shown in Fig. 2 is shifted slightly, with the amount of in the frequency domain, and the permittivity reconstruction procedure is repeated, a new permittivity value is obtained and assigned to .

III Measurement Results
To validate the method, a low-dispersive liquid, Cyclohexane, is tested. The coaxial line shown in Fig. 1 is filled with this liquid connected to a signal generator which has an output signal power level of 0 dBm. The frequency of excitation varies from 0.05 to 1.05 GHz. Twenty samples are linearly picked up with a step of 5 MHz within a bandwidth of 95 MHz and the method is applied to reconstruct the permittivity, and . The window of sampling is then shifted 10 MHz in frequency and a new permittivity is measured for the new bandwidth window. Fig. 3 shows the result of this permittivity reconstruction for both the real and imaginary parts.
As a comparison, Cyclohexane liquid is tested with the open-ended coaxial approach. The results of this measurement are also plotted in Fig. 3, and . This measurement is done with a vector network analyzer. It can be seen that the results of these two methods are in close agreement. However, our previous work showed a higher accuracy of our method compared to the open-ended coaxial one [3].

IV Conclusion
This paper introduced a permittivity measurement method for low-dispersive materials without the need for phase measurements and a vector network analyzer. Only the real part of transmitted power values collected by a spectrum analyzer are used. Comparisons with the open-ended coaxial method showed that our method provided a very good accuracy.
References
- [1] L.-F. Chen, C. Ong, C. Neo, V. Varadan, and V. K. Varadan, Microwave electronics: measurement and materials characterization. John Wiley & Sons, Nov. 2004.
- [2] A. Martellosio, M. Pasian, M. Bozzi, L. Perregrini, A. Mazzanti, F. Svelto, P. E. Summers, G. Renne, L. Preda, and M. Bellomi, “Dielectric properties characterization from 0.5 to 50 ghz of breast cancer tissues,” IEEE Transactions on Microwave Theory and Techniques, vol. 65, no. 3, pp. 998–1011, 2016.
- [3] S. H. Mirjahanmardi and O. Ramahi, “Highly accurate liquid permittivity measurement using coaxial lines,” in 2019 IEEE International Symposium on Antennas and Propagation and USNC-URSI Radio Science Meeting. IEEE, 2019, pp. 101–102.
- [4] P. M. Meaney, A. P. Gregory, N. R. Epstein, and K. D. Paulsen, “Microwave open-ended coaxial dielectric probe: interpretation of the sensing volume re-visited,” BMC medical physics, vol. 14, no. 1, p. 3, 2014.
- [5] U. Hasar, “Elimination of the multiple-solutions ambiguity in permittivity extraction from transmission-only measurements of lossy materials,” Microwave and Optical Technology Letters, vol. 51, no. 2, pp. 337–341, Feb. 2009.
- [6] S. H. Mirjahanmardi, A. M. Albishi, and O. M. Ramahi, “Permittivity reconstruction of nondispersive materials using transmitted power at microwave frequencies,” IEEE Transactions on Instrumentation and Measurement, vol. 69, no. 10, pp. 8270–8278, 2020.