Tracking Turbulence Through Financial News During COVID-19
Abstract
Grave human toll notwithstanding, the COVID-19 pandemic created uniquely unstable conditions in financial markets. In this work we uncover and discuss relationships involving sentiment in financial publications during the 2020 pandemic-motivated U.S. financial crash. First, we introduce a set of expert annotations of financial sentiment for articles from major American financial news publishers. After an exploratory data analysis, we then describe a CNN-based architecture to address the task of predicting financial sentiment in this anomalous, tumultuous setting. Our best performing model achieves a maximum weighted F1 score of 0.746, establishing a strong performance benchmark. Using predictions from our top performing model, we close by conducting a statistical correlation study with real stock market data, finding interesting and strong relationships between financial news and the S&P 500 index, trading volume, market volatility, and different single-factor ETFs.
1 Introduction
Recent advancements in fundamental natural language understanding problems Zhang et al. (2019); Raffel et al. (2020); Clark et al. (2020) have generated renewed interest in their downstream deployment in many applications; one such example is extrapolating meaning from large quantities of financial publications. The year 2020 and its accompanying financial unpredictability presents an interesting case study and test bed for financial sentiment models that rely on complex inferences. In this work we tackle that problem, and uncover numerous interesting and important relationships involving sentiment in financial publications during the 2020 pandemic-related U.S. financial crash. This work is unique as we focus not on lexicon scoring, nor developing a trading strategy during normal market conditions, but instead on analyzing the relationship between sentiment and market movement during a financial crisis — a subject seldom studied due to the infrequency of financial crashes and pandemics. Our key contributions are as follows:
-
•
We collect a set of expert annotations for 800 financial article titles and descriptions with COVID-19-specific vocabulary, labeled for negative, neutral, or positive sentiment.
-
•
We introduce CNN-based models to distinguish between sentiment categories in this challenging dataset, achieving a maximum weighted F1 score of 0.746.
-
•
We perform correlation studies between our top model’s predictions and popular market measures: S&P 500 Average, S&P 500 Trading Volume, Cboe Volatility Index, Single-Factor ETFs, and FAANG+ stocks.
Our experiments yield intriguing findings, including a strong relationship between predicted market sentiment and the S&P 500 Average and a notably lower correlation with value stocks compared to other factors.
2 Related Work
Sentiment analysis is a popular NLP task Ribeiro et al. (2016) that has been employed in a variety of practical fields, ranging from product review analyses for marketing purposes Hu and Liu (2004), to tracking online voter sentiment Tumasjan et al. (2011), as well as to financial markets. Current methods for extracting sentiment from bodies of text fall primarily into two categories: lexicon-based and machine learning methods. Lexicon-based approaches ultimately produce dictionaries containing key/value pairs for scoring text. Although simplistic, they have the added benefit of being extremely efficient, requiring user programs to do little more than load a dictionary into memory and perform linear searches.
However, lexicon-based methods tend to fall short compared to modern deep learning techniques, especially in domains with specialized vocabularies. Machine learning methods often outperform lexicons in financial text applications Man et al. (2019). Financial texts not only contain highly specialized language referring to specific actions and outcomes (eg., [Company] prices senior notes announces a type of bond offering), but also exhibit language that can have very different meaning compared to general settings (eg., “bull” may typically have a neutral or negative connotation, but is overwhelmingly positive in a financial context).
A recent surge of work in financial sentiment analysis emerged during SEMEVAL 2017’s Task 5 Cortis et al. (2017), in which participants were asked to create systems capable of predicting article sentiment on a continuous scale from -1 (bearish/negative/price-down) to 1 (bullish/positive/price-up), given a dataset of 1647 annotated financial statements and headlines. The top two performing systems Mansar et al. (2017); Kar et al. (2017) performed within 0.001 points of each other, yet used vastly different techniques. Mansar et al. (2017) utilized three primary input features: pre-trained GloVe embeddings Pennington et al. (2014), DepecheMood scores Staiano and Guerini (2014), and VADER scores Hutto and Gilbert (2014). They paired these with a CNN-based architecture, leveraging the following layers in order: convolution, max pooling, dropout layer, fully connected layer, dropout layer, and fully connected layer.
Conversely, Kar et al. (2017) used pre-trained Word2Vec embeddings Mikolov et al. (2013) as input separately to a CNN and a bidirectional gated recurrent unit (BiGRU), and also generated a set of hand-crafted features which were fed to multiple fully-connected layers. All three of these model outputs were concatenated, before being input to another fully-connected layer which ultimately issued a prediction. We take inspiration from the former paper Mansar et al. (2017), and experiment with a similar CNN-based approach.
3 Data Sources
We collected financial articles using the NewsFilter.IO API.111http://newsfilter.io This service provides straightforward and high quality data access for online articles from most major American publishers of financial news. Articles are provided in a JSON dictionary format with fields corresponding to title, description, publisher name, published time, and stock tickers mentioned, among others. We refer to this dataset from here onward as Fin-Cov-News.
To collect market and share prices, we downloaded publicly available data from Yahoo Finance.222https://finance.yahoo.com/ Yahoo Finance allows users to download daily price data given inputs of a specific stock or instrument symbol and date range.
3.1 Basic Statistics
We collected data from January 1 to December 31, 2020. This yielded 192,154 articles from the following sources: Wall Street Journal, Bloomberg, SeekingAlpha, PR Newswire, CNBC, and Reuters. Considering only article titles, the dataset contains 2,069,244 words, or 1,660,842 words without common stopwords Bird et al. (2009), with a vocabulary size of 118,719 unique words.
| Word | Occurrences | Word | Occurrences |
|---|---|---|---|
| coronavirus | 12427 | results | 5101 |
| u.s. | 12198 | reports | 4966 |
| new | 11620 | billion | 4913 |
| says | 10839 | china | 4872 |
| market | 7808 | stocks | 4835 |
| announces | 7468 | dividend | 4715 |
| 2020 | 7282 | virus | 4232 |
| covid-19 | 6914 | oil | 4041 |
| global | 6659 | declares | 3948 |
The twenty most common words in titles (minus punctuation) are shown in Table 1. The (mean, min, max) set for titles is (8.64, 1, 54), and for article descriptions is (27.35, 1, 1309). As expected, a significant number of COVID words appear in the dataset (e.g., “coronavirus,” “covid-19,” and “virus”), alongside traditional finance words like “dividend.”
3.2 Further Data Analysis
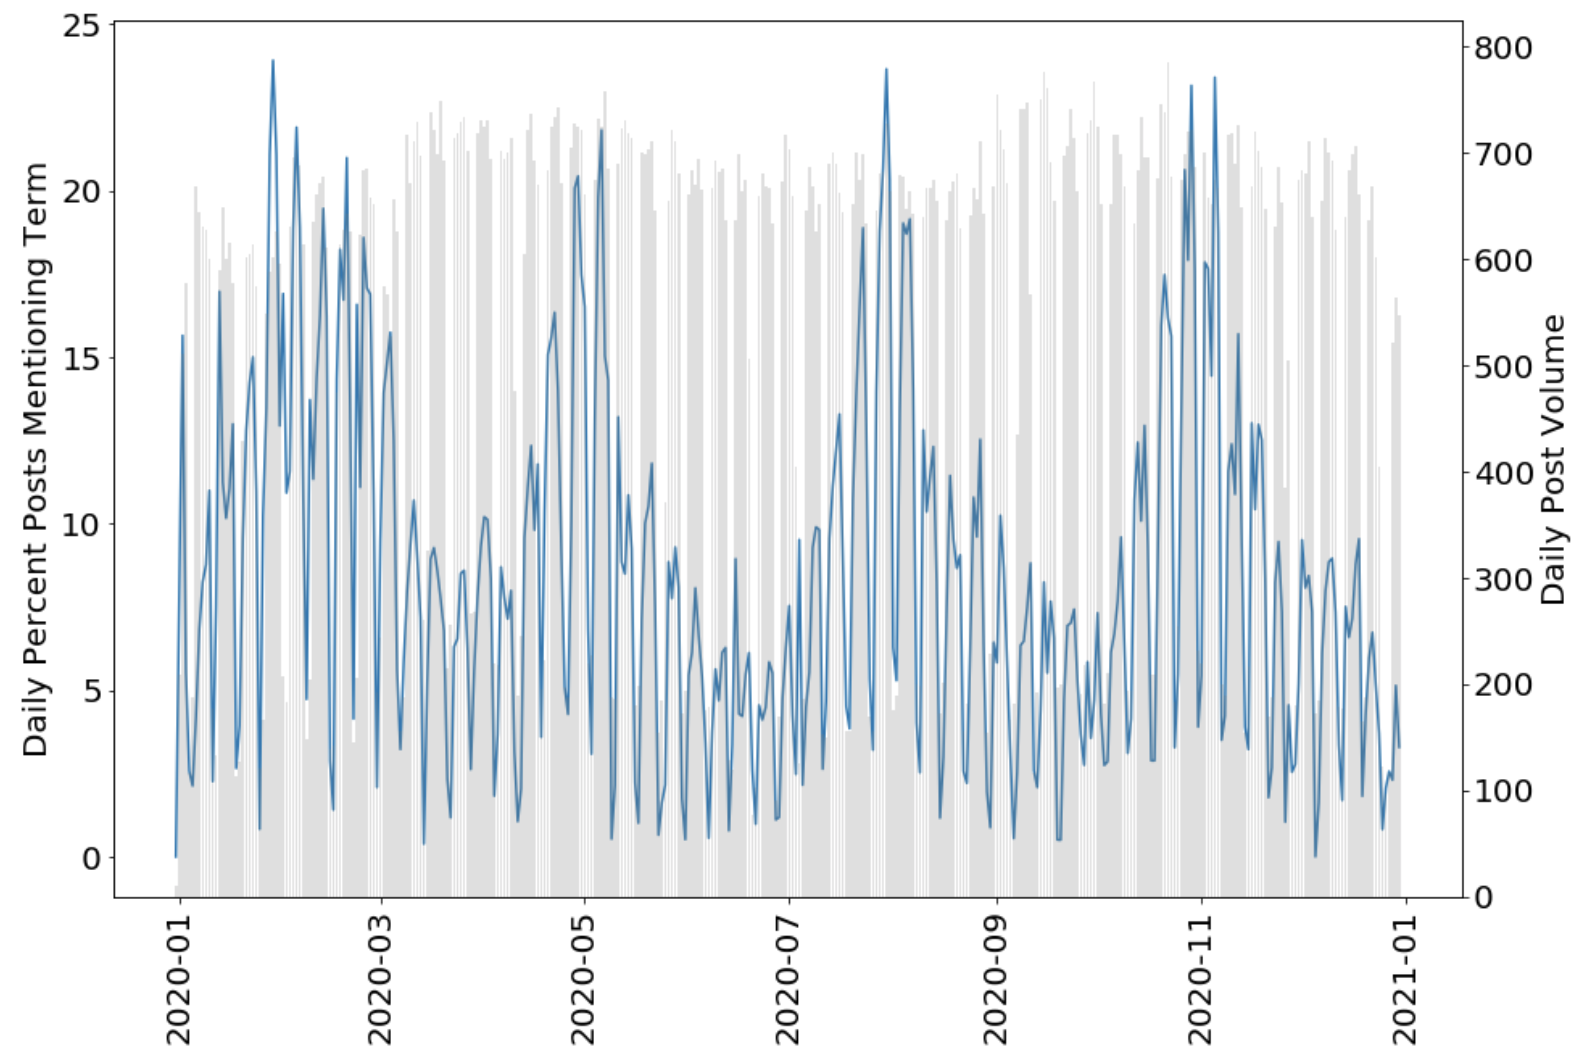
We aggregated articles by daily frequency and computed the occurrences over time for different sets of query words, producing the proportion of all posts published in a given day which contain the query words in the post title or description. Our first plot, shown in Figure 1, uses common “Earnings” query words: {revenue, earnings, dividend, miss, beat, estimates}. These words peak notably near the beginnings and ends of fiscal quarters. The blue line denotes the daily percent of posts mentioning one (or multiple) query terms, and the grey bars denote the daily post volume.
We additionally consider a query of “COVID-19-related” words: {covid, covid19, coronavirus, virus, corona, covid-19, 2019-ncov, 2019ncov, sars-cov-2, sarscov2}. Interestingly, we note a spike of COVID-related keywords before the actual spike of cases in the U.S., and a steady decline between April and June despite the increasing ground truth number of cases and ongoing economic impact. One may also observe that the peak percent of posts mentioning the “COVID-19-related” keywords is around 60% in late-March of 2020, and the lowest percent is in September with around 10%. Figure 2 shows these percentages, again with the blue line denoting the daily percent of posts mentioning one (or multiple) query terms, and the grey bars denoting the daily post volume.
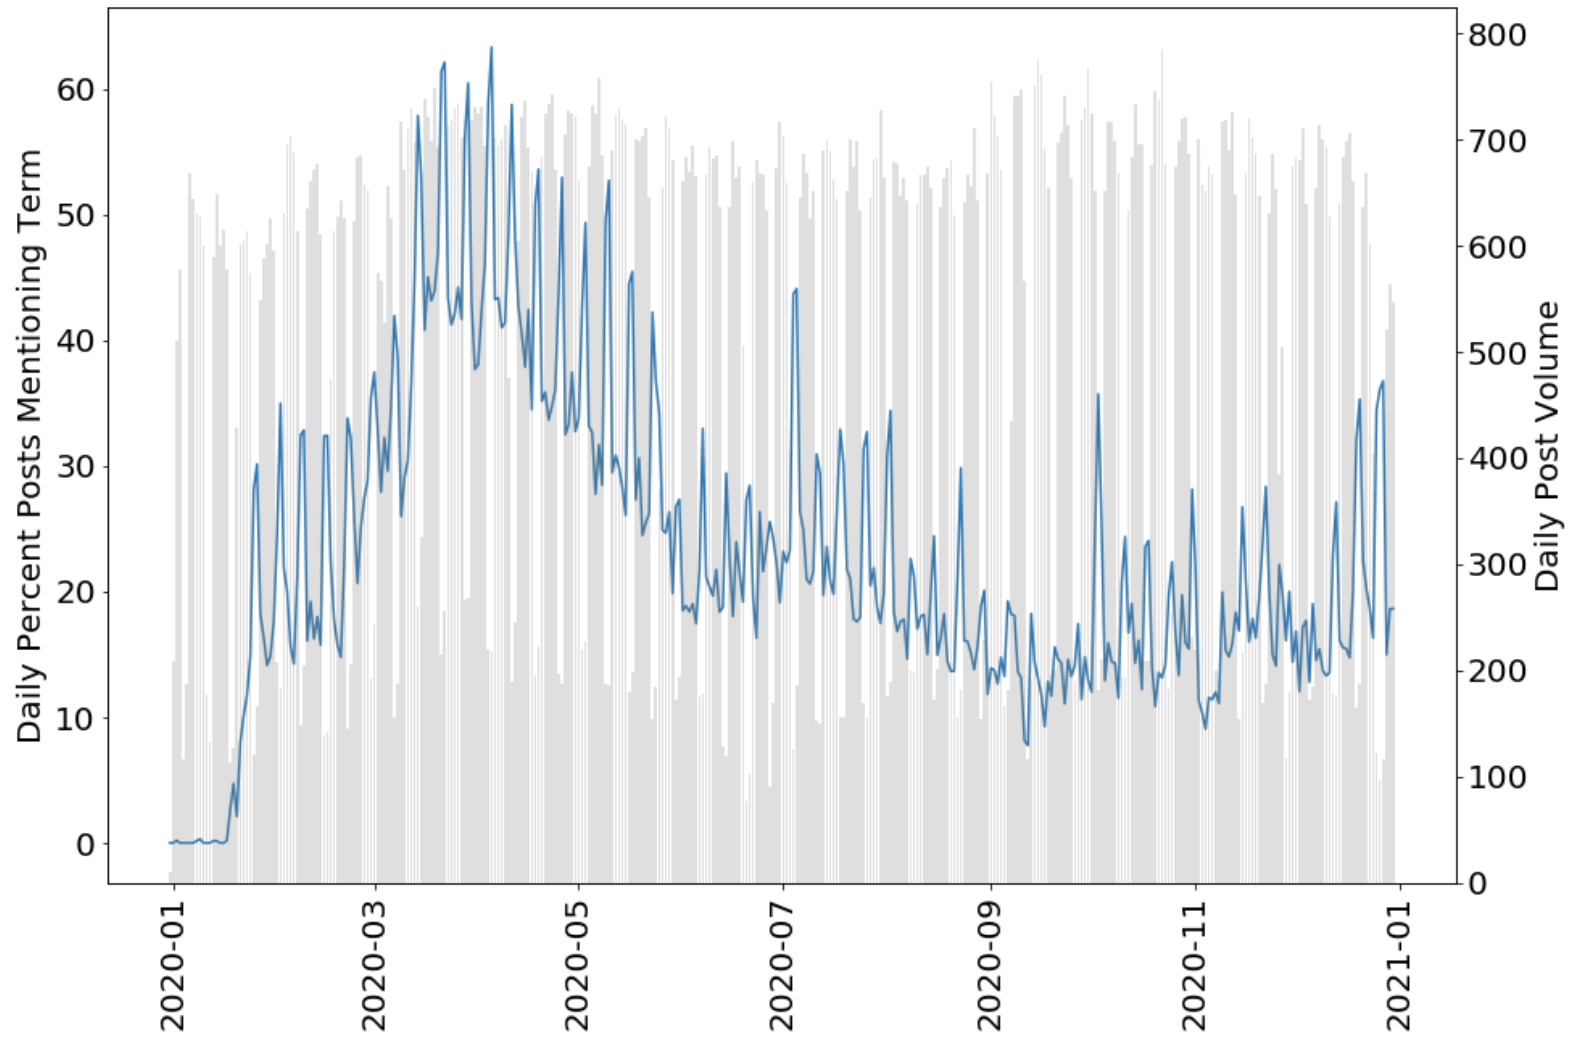
When comparing to the actual COVID-19 statistics as aggregated by the U.S. Centers for Disease Control (CDC), made publicly available via their website,333https://covid.cdc.gov/covid-data-tracker/ we observe a strong initial financial press reaction to the virus, despite the low infection rate. The press decreased its focus on COVID-19 over time, despite its continuing impact on society and the economy.
3.3 Additional External Datasets
While labeling the Fin-Cov-News data was essential for learning COVID-19 related trends, we additionally utilized samples of two external datasets created for similar tasks. For the first (SemEval), from SEMEVAL-2017 Cortis et al. (2017), we sample 750 random articles and use cutoff points at -0.33 and 0.33 to threshold the continuous sentiment labels to the categorical negative, neutral, and positive. This yielded 156 negative articles, 413 neutral, and 181 positive.
We additionally sample 750 random phrases from v1.0 of the Financial Phrase Bank (FinPhraseBank, Malo et al., 2014). This dataset similarly contains news phrases from financial data sources with categorical negative, neutral, and positive labels. We sampled exclusively from the “AllAgree" subset (containing only samples exhibiting a unanimous label decision from the annotators) to ensure the highest possible quality in our training data.
4 Annotation
To train our model to identify language patterns during the 2020 COVID-19 financial crisis, we first acquired labels for a sample from Fin-Cov-News.
4.1 Annotator Information
Annotations were solicited from four annotators (one of our authors and three external experts). Our external annotators (referred to as B, C, and D) were recruited from the quantitative strategy research group of a top Investment Management/Exchange Traded Fund provider, where annotator A (author) worked for a Summer. All three external annotators are full CFA charter444https://www.cfainstitute.org/en/programs/cfa holders and have worked in the investment space for at least three years. The experts completed the labeling task on a volunteer basis, and were given approximately two weeks to complete their labels.
4.2 Labeling Scheme
We selected a basic categorical (negative/neutral/positive) labeling scheme, at the article level. Annotators were provided with XLSX files with each row containing an article title, a truncated article description (25 words), and a label column to be completed. Labeling guidelines are shown in Table 2.
| Label | Description | Examples |
|---|---|---|
| Negative | Article reports news expected to negatively impact the price of a specific company or industry, or market health as a whole, either now or in the future. | COVID-19 cases spread in a country (and it is unclear that specific company or industry stands to gain), a company announces layoffs or bankruptcy, or a news blurb indicates that the price of a share is down. |
| Positive | Article reports news expected to positively impact the price of a specific company or industry, or market health as a whole, either now or in the future. | A company is in talks for a significant new business partnership, COVID-19 vaccine progress is positive, or a news blurb indicates that the price of a share is up. |
| Neutral | Article cannot be placed with any notable degree of certainty in positive or negative categories. | Article mentions a company or event which has no influence on U.S. markets, article mentions multiple companies with multiple sentiments, or annotator is uncertain if the company will benefit from or be hurt by the news. |
4.3 Inter-Annotator Agreement
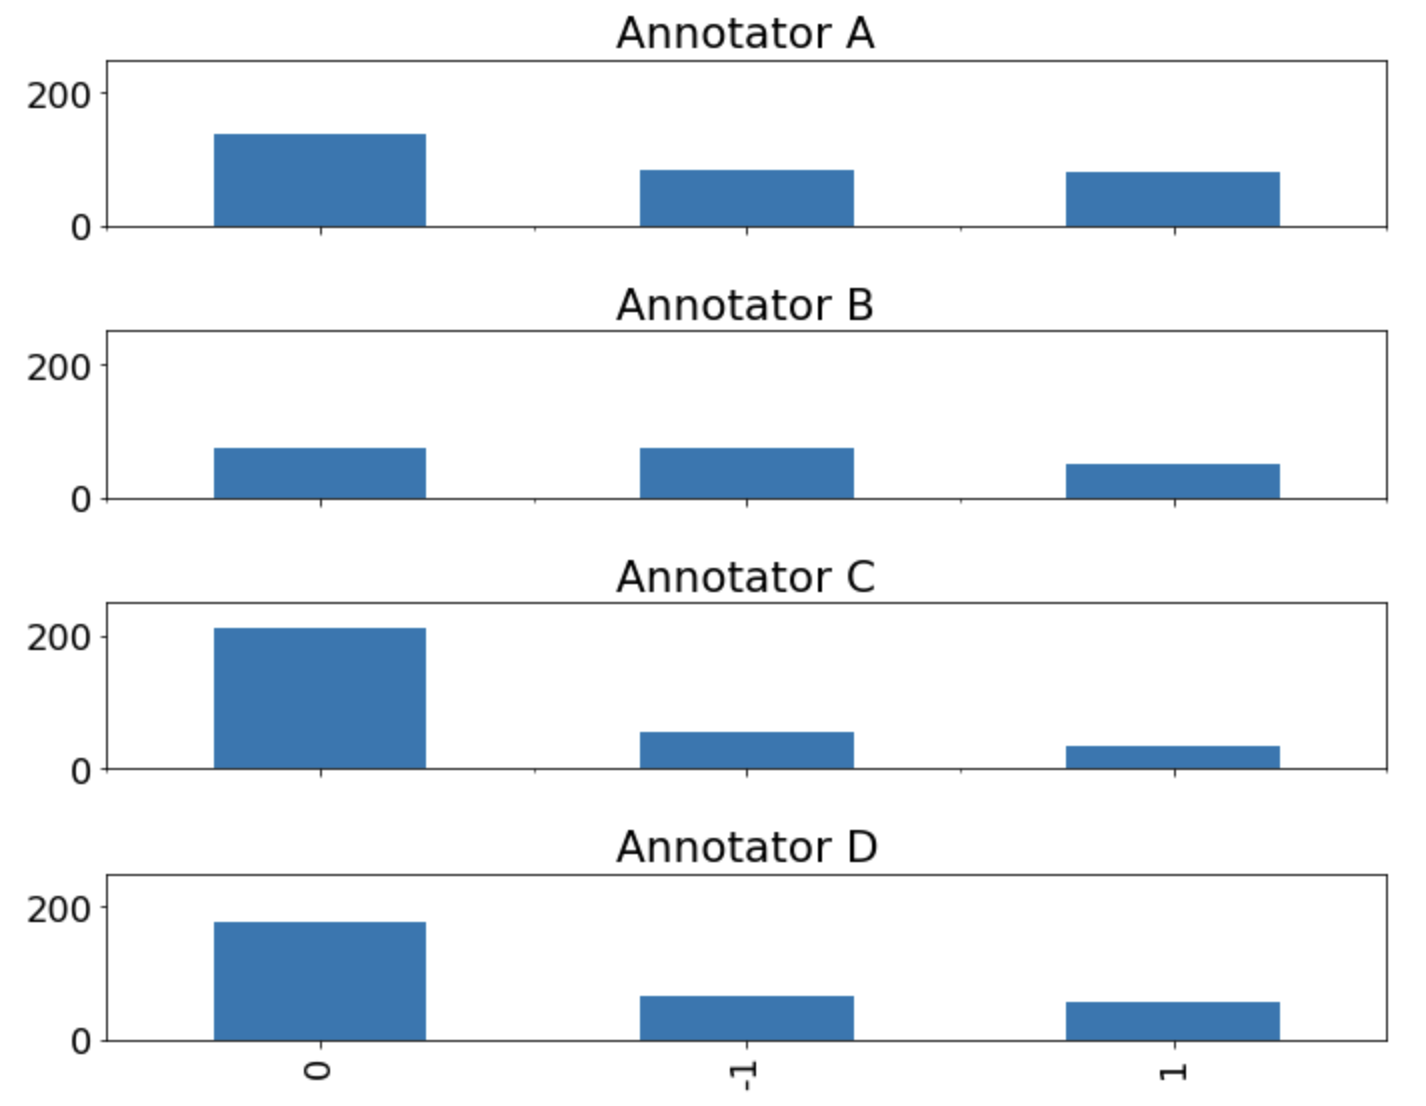
We allowed annotators to volunteer for a round number of articles they felt comfortable labeling, resulting in the following amount of data: (A, 300), (B, 200), (C, 300), (D, 300). Between each set of articles, 50 were shared among all annotators to compute inter-annotator agreement. The distributions of all annotations, separated by annotator, are shown in Figure 3, with -1, 0, and 1 corresponding to negative, neutral, and positive labels. Annotators C and D both leaned heavily towards assigning neutral labels and being selective with good news or bad news, whereas Annotator B had a fairly uniform distribution of labels across their data subset.
Pairwise Cohen’s Kappa Cohen (1960) scores are shown in Table 3. Annotator B was an outlier, exhibiting poor agreement with the other two experts, C and D, likely due to the annotator’s increased willingness to assign positive/negative labels. Experts C and D agreed well with each other at . Following convention Landis and Koch (1977), annotator pairs (A,D) and (C,D) exhibit “substantial” agreement, and annotator pairs (A,B) and (A,C) exhibit high “moderate” agreement. However, Annotator B exhibits only “fair” agreement with Annotator C and barely reaches the bottom threshold of “moderate” with Annotator D.
Based on this analysis, we removed Annotator B from the dataset, leaving 800 labeled articles in Fin-Cov-News. We highlight the inherent uncertainty during the labeling of these financial documents — upon manual inspection, it is not uncommon for “close-misses,” where some annotators thought an article was positive and others thought it was neutral (or some thought it was negative, others neutral). Even when considering exclusively domain experts, it is difficult to obtain complete agreement.
| A | B | C | D | |
|---|---|---|---|---|
| A | 0.574 | 0.574 | 0.709 | |
| B | 0.305 | 0.430 | ||
| C | 0.685 | |||
| D |
5 Methods and Evaluation
We experiment with various models to predict financial sentiment, varying input data and features as well as model structure. To evaluate our models, we report both macro and weighted F1 scores (harmonic mean of precision and recall) as computed by the Scikit-Learn Python library Pedregosa et al. (2011). We include both because although weighted F1 may more effectively reflect performance in real-world settings, it may also skew positive since we observe a slight class imbalance in our training data – roughly 60% of labels are neutral, with the remaining 40% split between positive and negative.
We assessed performance relative to two baseline models, AllNeutral and VADERMax, to establish dataset learnability above chance or naive heuristics. We report performance metrics for these baselines in Table 4. AllNeutral is a majority-class baseline that predicts “neutral” for each instance, and VADERMax is a rule-based heuristic that predicts labels based on the maximum VADER score for any word in the instance. AllNeutral achieves a poor macro F1 score, but a weighted F1 score around 0.5 due to the label imbalance. VADERMax performs comparably, giving evidence that lexicon-based heuristics are insufficient in a financial crisis/recovery context.
| Method | Macro F1 | Weighted F1 |
|---|---|---|
| AllNeutral | 0.264 | 0.519 |
| VADERMax | 0.300 | 0.536 |
5.1 Model Design
To ensure competitive performance, we experiment with different word embeddings, text preprocessing steps, and model inputs and architectures. All experiments were performed in Python 3, using Keras Chollet et al. (2015).
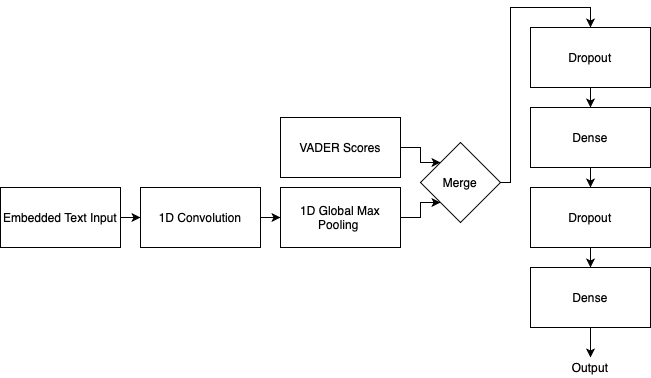
For the model architecture, we adapt a similar Convolutional Neural Network (CNN) design to that of Mansar et al. (2017), shown in Figure 4. We also experimented with a BiGRU-based model, as they have demonstrated competitive performance relative even to Bidirectional LSTMs in comparable tasks Sinha and Khandait (2020). However, despite the 30x increase in training time, upon evaluation the BiGRU performed similarly to the CNN. For this reason, we selected to use the CNN for our model input experiments.555Future work may be able to achieve higher performance using more complex Transformer-based models, such as those by Devlin et al. (2019) and Araci (2019). Since our focus here was on establishing proof of concept in this challenging setting, substantial finetuning experiments remained out of scope but offer intriguing future possibilities. For all model results, maximum F1 scores are reported on the testing data over 100 epochs of training.
We experimented with a variety of input features. All models are trained using a concatenation of article title text and a truncated version (25 words) of the article description. In this subset of experiments, we consider only the 800 labeled samples of Fin-Cov-News in a simple 85/15 train/test split. Our input features and preprocessing steps were as follows:
-
•
COVID-19 Embeddings: We created custom embeddings for the missing words {coronavirus, covid19, 2019ncov, covid, sarscov2}. These embeddings are arrays of length 300, consisting of floating point numbers which would not otherwise have words assigned to them (e.g., coronavirus = [-5.99, -5.99, …]).
-
•
Percent Replacements: We separated commonly seen percentages in the form of: +5% {plus, 5, percent}.
-
•
Dash Removal: We removed hyphens or dash characters (e.g., -, –, or —) from the text.
-
•
Stopword Removal: We removed stopwords using the NLTK stopwords list Bird et al. (2009).
-
•
Punctuation Removal: We removed all punctuation characters in the set {!, ", #, $, %, &, ’, (, ), *, +, \, -, ., , :, ;, , =, , ?, @, [, ], ^, _, ‘, {, , }, } from the text.
The pre-processing steps for each model in Table 5 are defined as follows: M1 - {None}, M2 - {Dash Removal, COVID-19 Embeddings}, M3 - {Dash Removal, COVID-19 Embeddings, Stopword Removal}, M4 - {Dash Removal, COVID-19 Embeddings, Stopword Removal, Percent Replacements}, M5 - {Dash Removal, COVID-19 Embeddings, Stopword Removal, Percent Replacements, Punctuation Removal}. We find that the optimal level of preprocessing occurs with M4. Although the regular expressions incorporated into M5 reduce the number of missing words significantly, the model performance does not improve, and we omit the extra processing step in our final model.
| Method | Words Missing | Max Macro F1 | Max Weighted F1 |
|---|---|---|---|
| M1 | 27.01% | 0.445 | 0.571 |
| M2 | 24.62% | 0.505 | 0.619 |
| M3 | 23.86% | 0.552 | 0.670 |
| M4 | 22.78% | 0.584 | 0.668 |
| M5 | 9.90% | 0.538 | 0.645 |
We compare conditions leveraging pretrained GloVe embeddings, pretrained Word2Vec embeddings, and the inclusion of VADER scores in Table 6, using a 85/15 split of Fin-Cov-News. The model inputs are defined as follows: N1: {300-length GloVe 6B, VADER Scores}, N2: {300-length Google News Word2Vec, VADER Scores}, N3: {300-length Google News Word2Vec, No VADER Scores}. We find that Word2Vec embeddings consistently result in higher performance than GloVe embeddings. This is likely because the GloVe pretraining data is more general-purpose, whereas the Word2Vec model was pretrained on news articles, likely capturing more rich relationships for our use case.
| Method | Words Missing | (Max, Avg.) Macro F1 | (Max, Avg.) Weighted F1 |
|---|---|---|---|
| N1 | 17.18% | 0.502, 0.473 | 0.602, 0.600 |
| N2 | 22.78% | 0.565, 0.552 | 0.667, 0.641 |
| N3 | 22.78% | 0.504, 0.483 | 0.599, 0.598 |
5.2 Expansion to External Data
For the best performing model, we expanded training to a full SemEval + FinPhraseBank + Fin-Cov-News dataset. The macro and weighted evaluation scores are shown in Table 7. Of the 345 test samples, our best performing CNN model predicted 256 articles correctly (74.2%), 77 off-by-one (22.3%), and 12 clear mispredictions (3.5%).
| Method | Precision | Recall | F1 |
|---|---|---|---|
| Macro | 0.666 | 0.679 | 0.670 |
| Weighted | 0.753 | 0.742 | 0.746 |
While still an error, off-by-one errors signify that the model predicted only one label away from the true value. We further decompose these incorrect predictions to gain a better understanding of what the model was missing. We deem errors when the model erred on the side of caution (e.g., predicting neutral when the label was positive or negative) to be acceptable errors, as these errors would likely cause minimal detrimental effects in downstream systems. We report our findings below:
-
•
Predict neutral, true negative [acceptable error] = off-by-ones
-
•
Predict neutral, true positive [acceptable error] = off-by-ones
-
•
Predict negative, true neutral [unacceptable error] = off-by-ones
-
•
Predict positive, true neutral [unacceptable error] = off-by-ones
Shifting perspective to the twelve instances for which the model made clear mispredictions, there were ten instances for which the model predicted positive and the true label was negative, and two instances of the opposite. Upon manual inspection of these errors, we found that the articles in question were indeed fairly ambiguous. For example, when the model saw: one best years bull market erased s&p 500 rose almost 29 percent course 2019, good second best year bull market. took little four weeks fall apart., the algorithm thought this was good news – not able to catch on the subtlety of “little four weeks fall apart.”
6 Market Correlations and Findings
We extend the predictions of our best performing model to the entire year (January 1 – December 31, 2020) of article titles + truncated short descriptions to uncover the relationships between financial articles and actual market movement. We remove weekends (when the market is closed) from our dataset to avoid times when share prices are relatively stable. We compute Pearson correlation coefficients in all cases using the Stats module of Scipy Virtanen et al. (2020).
6.1 S& P500 Averages
We first compare our model predictions and the S&P 500 average,666https://finance.yahoo.com/quote/%5EGSPC?p=%5EGSPC shown in the top two rows of Table 8. Averaged Daily Model Sentiment refers to a simple daily aggregate of the article sentiment. Smoothed Daily Model Sentiment is a 10-day rolling average of the article sentiment. We find that the rolling average has a strong correlation with the S&P 500, at . This information is also presented visually in the first three plots of Figure 5.
| Item | |
|---|---|
| S&P 500 Close vs. Averaged Daily Model Sentiment | 0.770 |
| S&P 500 Close vs. Smoothed Daily Model Sentiment | 0.886 |
| S&P 500 Volume vs. Smoothed Daily Model Sentiment | -0.563 |
| VIX Close vs. Smoothed Daily Model Sentiment | -0.716 |
| S&P 500 Volume vs. VIX Close | 0.713 |
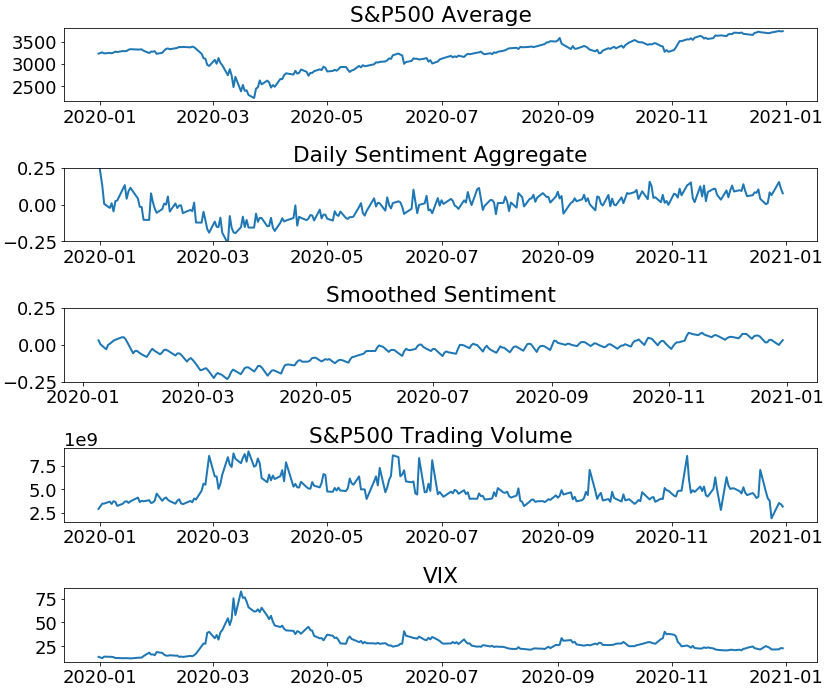
6.2 Trading Volume and the Cboe Volatility Index
We additionally hypothesized that trading volume and market volatility would correlate with predicted financial news sentiment. To assess this, we considered the simple trading volume related to the S&P500, as well as the Cboe Volatility Index (VIX) — a well-regarded way to measure market volatility based on options contracts. These correlations are shown in rows three through five of Table 8. Interestingly, while our smoothed sentiment model outputs exhibit non-zero correlation with both the S&P500 trading volume and the VIX, the magnitude of this correlation is notably higher with the VIX.
6.3 Factor Analysis
Next, we investigated which single factor-based strategies aligned most closely with predicted financial article sentiment. Factor investing is a classical investing technique that seeks to identify certain attributes of securities that are mathematically linked with higher returns. The body of academic work on this topic is extensive (we direct interested readers to Fama and French (1993, 2014)).
For strategy consistency, we selected four single factor exchange traded funds (ETFs) from iShares by BlackRock,777https://www.ishares.com/us/strategies/smart-beta-investing by far the largest ETF provider as of March 16, 2021.888https://www.etf.com/sections/etf-league-tables/etf-league-table-2021-03-16 iShares defines their four factor-based ETFs as follows:
-
•
Value ($VLUE): Stocks discounted relative to fundamentals.
-
•
Quality ($QUAL): Financially healthy companies.
-
•
Momentum ($MTUM): Stocks with an upward price trend.
-
•
Size ($SIZE): Smaller, more nimble companies.
While these are over-simplified definitions of the factors, they provide a basic intuition regarding which companies were pooled into which of the single-factor ETFs. The statistical correlations between these tickers and our model results are shown on Table 9. We note that Value is the clear outlier when compared to the other factors, with a significantly lower correlation ().
| Item | |
|---|---|
| $VLUE Close vs. Smoothed Daily Model Sentiment | 0.625 |
| $QUAL Close vs. Smoothed Daily Model Sentiment | 0.889 |
| $MTUM Close vs. Smoothed Daily Model Sentiment | 0.862 |
| $SIZE Close vs. Smoothed Daily Model Sentiment | 0.850 |
6.4 FAANG+
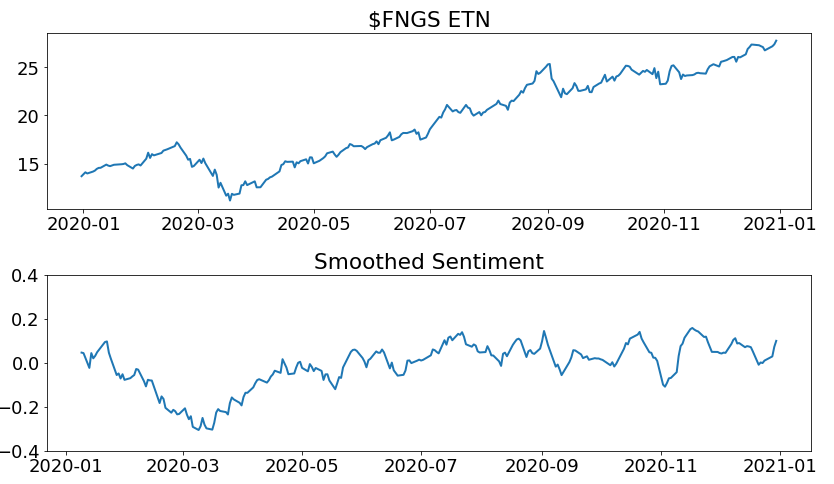
Finally, during the COVID-19 financial crisis and recovery, tech-focused stocks bounced back quickly and even reached all-time highs within 2020. For this reason, we specifically consider how well predicted financial news sentiment correlated with this class of stocks. For our financial data, we used the MicroSectors (BMO Harris) FAANG+ ETN ($FNGS).999https://www.microsectors.com/fang This ETN tracks the performance of top tech companies, weighting Facebook, Apple, Amazon, Netflix, Alphabet, Alibaba, Baidu, NVIDIA, Tesla and Twitter equally. It displayed significantly higher returns than the overall market during our time period of interest. In Fin-Cov-News, 15,701 articles were tagged with one of these FAANG+ companies, accounting for around 8% of overall articles.
We found a correlation of (or with smoothed model sentiment) between the news for these specific companies versus the $FNGS ETN; this was notably lower than the overall market correlations that we found earlier. Figure 6 shows that sentiment tracks market performance fairly well for the initial crash, but while the tech stocks recover quickly and add to their gains, sentiment continues to oscillate around a neutral point. This behavior highlights one of the potential shortcomings of a purely sentiment-driven trading strategy — when market behavior is fairly stable and trending upward, the news sentiment does not always progressively grow to match this trend.
7 Conclusion
In this work, we comprehensively investigated the relationship between financial news sentiment and stock market performance during the 2020 pandemic-induced financial crisis. While comparable works on this subject Zammarchi et al. (2021) focus primarily on the use of social media data in conjunction with lexicons or standard machine learning models, we leveraged a task-specific CNN model to predict financial article sentiment over time, achieving a maximum F1 of 0.746. This enabled us to subsequently perform a correlation study that considered not only the stock market as a whole, but also different factor-based strategies and industry subsets. As part of this work we collected expert annotations of financial sentiment for 800 news articles (a subset of Fin-Cov-News), with strong inter-annotator agreement (averaged pairwise ). We make these annotations available for other interested parties by request.
With a solid deep learning-based sentiment model and an abundance of stock data, there is a high ceiling for where future work could lead. One obvious avenue would be continued improvement of the financial sentiment prediction model, although significant improvements may require more labeled data. Using the current model predictions, more fine-grained analysis could also be performed on other subsets of companies or industries of interest. While it is clear that news sentiment could not completely localize the market crash/bottom, an intriguing extension of our work would be to consider sentiment prediction on a more fine-grained time interval, and investigate whether it could be used to inform higher frequency trading strategies that could weather highly turbulent market conditions.
References
- Araci (2019) Dogu Araci. 2019. FinBERT: Financial Sentiment Analysis with Pre-trained Language Models. arXiv:1908.10063 [cs]. ArXiv: 1908.10063.
- Bird et al. (2009) Steven Bird, Ewan Klein, and Edward Loper. 2009. Natural language processing with Python: analyzing text with the natural language toolkit. " O’Reilly Media, Inc.".
- Chollet et al. (2015) François Chollet et al. 2015. Keras. https://github.com/fchollet/keras.
- Clark et al. (2020) Kevin Clark, Minh-Thang Luong, Quoc V. Le, and Christopher D. Manning. 2020. Electra: Pre-training text encoders as discriminators rather than generators. In International Conference on Learning Representations.
- Cohen (1960) Jacob Cohen. 1960. A Coefficient of Agreement for Nominal Scales. Educational and Psychological Measurement, 20(1):37–46.
- Cortis et al. (2017) Keith Cortis, André Freitas, Tobias Daudert, Manuela Huerlimann, Manel Zarrouk, Siegfried Handschuh, and Brian Davis. 2017. SemEval-2017 task 5: Fine-grained sentiment analysis on financial microblogs and news. In Proceedings of the 11th International Workshop on Semantic Evaluation (SemEval-2017), pages 519–535, Vancouver, Canada. Association for Computational Linguistics.
- Devlin et al. (2019) Jacob Devlin, Ming-Wei Chang, Kenton Lee, and Kristina Toutanova. 2019. BERT: Pre-training of Deep Bidirectional Transformers for Language Understanding. arXiv:1810.04805 [cs]. ArXiv: 1810.04805.
- Fama and French (1993) Eugene F. Fama and Kenneth R. French. 1993. Common risk factors in the returns on stocks and bonds. Journal of Financial Economics, 33(1):3–56.
- Fama and French (2014) Eugene F. Fama and Kenneth R. French. 2014. A Five-Factor Asset Pricing Model. SSRN Scholarly Paper ID 2287202, Social Science Research Network, Rochester, NY.
- Hu and Liu (2004) Minqing Hu and Bing Liu. 2004. Mining and summarizing customer reviews. In Proceedings of the tenth ACM SIGKDD international conference on Knowledge discovery and data mining, KDD ’04, pages 168–177, Seattle, WA, USA. Association for Computing Machinery.
- Hutto and Gilbert (2014) Clayton Hutto and Eric Gilbert. 2014. Vader: A parsimonious rule-based model for sentiment analysis of social media text. In Proceedings of the International AAAI Conference on Web and Social Media.
- Kar et al. (2017) Sudipta Kar, Suraj Maharjan, and Thamar Solorio. 2017. RiTUAL-UH at SemEval-2017 Task 5: Sentiment Analysis on Financial Data Using Neural Networks. In Proceedings of the 11th International Workshop on Semantic Evaluation (SemEval-2017), pages 877–882, Vancouver, Canada. Association for Computational Linguistics.
- Landis and Koch (1977) J. Richard Landis and Gary G. Koch. 1977. The Measurement of Observer Agreement for Categorical Data. Biometrics, 33(1):159–174.
- Malo et al. (2014) Pekka Malo, Ankur Sinha, Pekka Korhonen, Jyrki Wallenius, and Pyry Takala. 2014. Good debt or bad debt: Detecting semantic orientations in economic texts. Journal of the Association for Information Science and Technology, 65(4):782–796.
- Man et al. (2019) X. Man, T. Luo, and J. Lin. 2019. Financial Sentiment Analysis(FSA): A Survey. In 2019 IEEE International Conference on Industrial Cyber Physical Systems (ICPS), pages 617–622.
- Mansar et al. (2017) Youness Mansar, Lorenzo Gatti, Sira Ferradans, Marco Guerini, and Jacopo Staiano. 2017. Fortia-FBK at SemEval-2017 Task 5: Bullish or Bearish? Inferring Sentiment towards Brands from Financial News Headlines. In Proceedings of the 11th International Workshop on Semantic Evaluation (SemEval-2017), pages 817–822, Vancouver, Canada. Association for Computational Linguistics.
- Mikolov et al. (2013) Tomas Mikolov, Kai Chen, Greg Corrado, and Jeffrey Dean. 2013. Efficient Estimation of Word Representations in Vector Space. arXiv:1301.3781 [cs]. ArXiv: 1301.3781.
- Pedregosa et al. (2011) F. Pedregosa, G. Varoquaux, A. Gramfort, V. Michel, B. Thirion, O. Grisel, M. Blondel, P. Prettenhofer, R. Weiss, V. Dubourg, J. Vanderplas, A. Passos, D. Cournapeau, M. Brucher, M. Perrot, and E. Duchesnay. 2011. Scikit-learn: Machine learning in Python. Journal of Machine Learning Research, 12:2825–2830.
- Pennington et al. (2014) Jeffrey Pennington, Richard Socher, and Christopher Manning. 2014. GloVe: Global Vectors for Word Representation. In Proceedings of the 2014 Conference on Empirical Methods in Natural Language Processing (EMNLP), pages 1532–1543, Doha, Qatar. Association for Computational Linguistics.
- Raffel et al. (2020) Colin Raffel, Noam Shazeer, Adam Roberts, Katherine Lee, Sharan Narang, Michael Matena, Yanqi Zhou, Wei Li, and Peter J. Liu. 2020. Exploring the limits of transfer learning with a unified text-to-text transformer. Journal of Machine Learning Research, 21(140):1–67.
- Ribeiro et al. (2016) Filipe N. Ribeiro, Matheus Araújo, Pollyanna Gonçalves, Marcos André Gonçalves, and Fabrício Benevenuto. 2016. SentiBench - a benchmark comparison of state-of-the-practice sentiment analysis methods. EPJ Data Science, 5(1):1–29.
- Sinha and Khandait (2020) Ankur Sinha and Tanmay Khandait. 2020. Impact of News on the Commodity Market: Dataset and Results. arXiv:2009.04202 [cs]. ArXiv: 2009.04202.
- Staiano and Guerini (2014) Jacopo Staiano and Marco Guerini. 2014. DepecheMood: a Lexicon for Emotion Analysis from Crowd-Annotated News. arXiv:1405.1605 [cs]. ArXiv: 1405.1605.
- Tumasjan et al. (2011) Andranik Tumasjan, Timm O. Sprenger, Philipp G. Sandner, and Isabell M. Welpe. 2011. Election Forecasts With Twitter: How 140 Characters Reflect the Political Landscape. Social Science Computer Review, 29(4):402–418.
- Virtanen et al. (2020) Pauli Virtanen, Ralf Gommers, Travis E. Oliphant, Matt Haberland, Tyler Reddy, David Cournapeau, Evgeni Burovski, Pearu Peterson, Warren Weckesser, Jonathan Bright, Stéfan J. van der Walt, Matthew Brett, Joshua Wilson, K. Jarrod Millman, Nikolay Mayorov, Andrew R. J. Nelson, Eric Jones, Robert Kern, Eric Larson, C J Carey, İlhan Polat, Yu Feng, Eric W. Moore, Jake VanderPlas, Denis Laxalde, Josef Perktold, Robert Cimrman, Ian Henriksen, E. A. Quintero, Charles R. Harris, Anne M. Archibald, Antônio H. Ribeiro, Fabian Pedregosa, Paul van Mulbregt, and SciPy 1.0 Contributors. 2020. SciPy 1.0: Fundamental Algorithms for Scientific Computing in Python. Nature Methods, 17:261–272.
- Zammarchi et al. (2021) Gianpaolo Zammarchi, Francesco Mola, and Claudio Conversano. 2021. Impact of the COVID-19 outbreak on Italy’s country reputation and stock market performance: a sentiment analysis approach. arXiv:2103.13871 [cs]. ArXiv: 2103.13871.
- Zhang et al. (2019) Zhengyan Zhang, Xu Han, Zhiyuan Liu, Xin Jiang, Maosong Sun, and Qun Liu. 2019. ERNIE: Enhanced language representation with informative entities. In Proceedings of the 57th Annual Meeting of the Association for Computational Linguistics, pages 1441–1451, Florence, Italy. Association for Computational Linguistics.