Cross DQN: Cross Deep Q Network for Ads Allocation in Feed
Abstract.
22footnotetext: Guogang Liao and Ze Wang are the corresponding authors.33footnotetext: This work was done when Chuhang Zhang was an intern in Meituan.E-commerce platforms usually display a mixed list of ads and organic items in feed. One key problem is to allocate the limited slots in the feed to maximize the overall revenue as well as improve user experience, which requires a good model for user preference. Instead of modeling the influence of individual items on user behaviors, the arrangement signal models the influence of the arrangement of items and may lead to a better allocation strategy. However, most of previous strategies fail to model such a signal and therefore result in suboptimal performance. In addition, the percentage of ads exposed (PAE) is an important indicator in ads allocation. Excessive PAE hurts user experience while too low PAE reduces platform revenue. Therefore, how to constrain the PAE within a certain range while keeping personalized recommendation under the PAE constraint is a challenge.
In this paper, we propose Cross Deep Q Network (Cross DQN) to extract the crucial arrangement signal by crossing the embeddings of different items and modeling the crossed sequence by multi-channel attention. Besides, we propose an auxiliary loss for batch-level constraint on PAE to tackle the above-mentioned challenge. Our model results in higher revenue and better user experience than state-of-the-art baselines in offline experiments. Moreover, our model demonstrates a significant improvement in the online A/B test and has been fully deployed on Meituan feed to serve more than 300 millions of customers.
1. Introduction
Feed, mixed with organic items and ads, is a popular product on many e-commerce platforms nowadays (Ghose and Yang, 2009). Platforms serve users and gain revenue via feed. In general, there are two ways for platforms to get revenue. Firstly, once users consume organic items or ads, the e-commerce platform will gain the platform service fee (hereinafter referred to as fee) according to the orders. Secondly, as an ad is clicked by a user, the platform will charge the corresponding advertiser. For the sake of the platform, displaying more ads is beneficial to ads revenue but harmful to fee since ads are less likely engaging than organic items (Zhao et al., 2018). Usually, the number of ads is limited in feed to ensure good user experience and engagement. Hence, how to allocate limited slots reasonably and effectively to maximize overall revenue has become a very meaningful and challenging problem (Wang et al., 2011; Mehta, 2013; Zhang et al., 2018).
The structure of an industrial ads allocation system is shown in Figure 1. Blending Server takes ads sequence and organic items sequence as input and outputs a mixed sequence of the two. For Blending Server, there are two common strategies: fixed slots strategy and dynamic slots strategy. Most platforms simply allocate ads to pre-determined slots (Ouyang et al., 2020; Li et al., 2020). Such strategies may lead to suboptimal overall performance. Dynamic slots strategy adjusts the number and slots of ads according to the interest of users. For instance, if a user has a higher tendency to consume commercial ads, the platform will allocate more ads at conspicuous slots to maximize possible benefits. Except for personalization, dynamic slots strategies have lower ads blindness (Yan et al., 2020) and better adaptability, significantly outperforming fixed slots strategy and gradually becoming today’s trend.
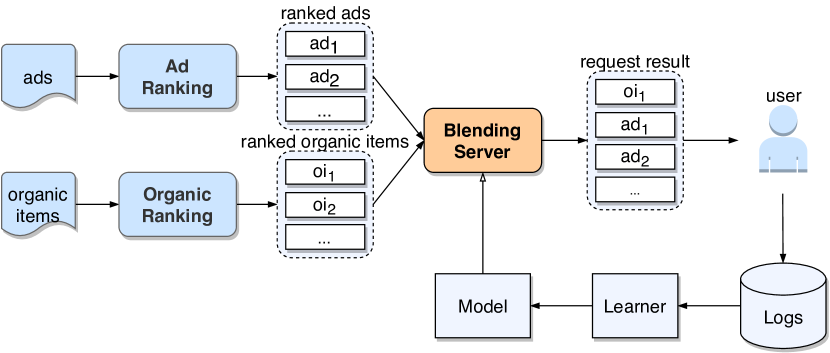
Structure of an ads allocation system. The process of ads allocation takes place in the Blending Server.
Early dynamic slots strategies use some classic algorithms (e.g., Bellman-Ford, unified rank score) to allocate ads slots. Since the feed is presented to the user in a sequence, recent dynamic ads allocation strategies usually model the problem as Markov Decision Process (Sutton et al., 1998) and solve it using reinforcement learning (RL) (Zhang et al., 2018; Feng et al., 2018; Zhao et al., 2020).
 \Description
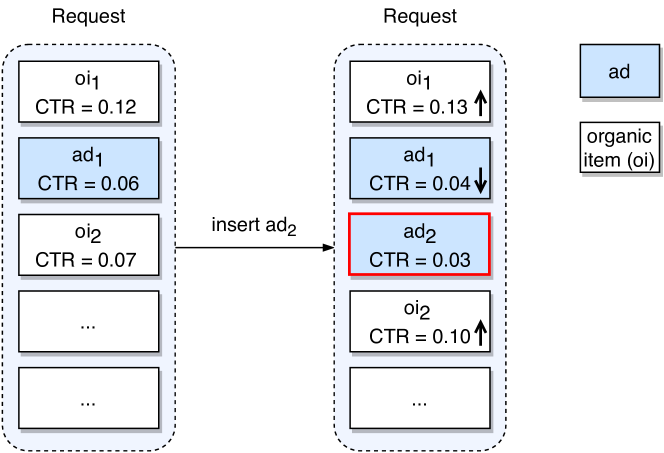
While inserting into feed, the CTR of organic items increases while the CTR of decreases.
However, existing RL-based dynamic slots strategies encounter several major limitations: i) Most approaches ignore the crucial arrangement signal which is the influence of the arrangement of displayed items on user behaviors. For example, as illustrated in Figure 2, once an ad is inserted into feed, the click-through rate (CTR) of surrounding organic items and ads fluctuate. This signal receives attention in the scenario of Re-Rank recently (Carrion et al., 2021; Wei et al., 2020; Feng et al., 2021a, b) but is largely neglected in ads allocation. ii) Most of existing methods lack an efficient balance between the personalization of different requests and the constraint on the percentage of ads exposed (PAE) in a period. PAE is the most important constraint in ads allocation, which balances the user experience and platform revenue. Previous methods constrain all the requests or the requests within the same hour (Wang et al., 2019) with the same target PAE, resulting in a lack of personalization and differentiation in the allocation of ads between different requests.
To address the limitations of existing methods, we present a novel framework called Cross Deep Q Network (Cross DQN) based on deep reinforcement learning. Specifically, we design two novel units called State and Action Crossing Unit (SACU) and Multi-Channel Attention Unit (MCAU) to explicitly extract the arrangement signal. Besides, we propose an auxiliary loss for batch-level constraint to balance the personalization of different requests and the constraint on PAE in a period.
The contributions of our work are summarized as follows:
-
•
A superior ads allocation strategy. In this paper, we propose a novel RL-based framework named Cross DQN111The code and data example are publicly accessible at https://github.com/weberrr/CrossDQN. to dynamically adjust the number and the slots of ads in feed, which can effectively extract the arrangement signal and reasonably balance personalization of different requests and the constraint on PAE.
-
•
Detailed industrial and practical experience. We successfully deploy Cross DQN on the Meituan feed and obtain significant improvements in both platform revenue and user experience.
2. Related Works
Traditional strategy for ads allocation in feed is to display ads at fixed slots. Recently, dynamic ads allocation strategies gains growing attention. According to whether RL is used, existing dynamic ads allocation strategies can be roughly categorized into two categories: non RL-based and RL-based.
Non RL-based methods usually use classical algorithms to allocate ads slots. Koutsopoulos (2016) define ads allocation as a shortest-path problem on a weighted directed acyclic graph where nodes represent ads or slots and edges represent expected revenue. The shortest path can be found by running Bellman-Ford algorithm. Furthermore, Yan et al. (2020) takes the impact of the interval between ads into consideration and re-ranks ads and organic items jointly via a uniform ranking formula.
RL-based methods model the ads allocation problem as an MDP and solved it with different RL techniques. Zhao et al. (2020) proposes a two-level RL framework to jointly optimize the recommending and advertising strategies. Zhao et al. (2021) proposes a DQN architecture to determine the optimal ads and ads position jointly. Xie et al. (2021) proposes a hierarchical RL-based framework to first decide the channel and then determine the specific item for each slot. In contrast to the previous work, we incorporate the arrangement signal into a RL-based dynamic ads allocation model to improve the performance.
3. Problem Formulation
In our scenario, we present slots in one screen and handle the allocation for each screen in the feed of a request sequentially. The ads allocation problem is formulated as a Constrained Markov Decision Process (CMDP) (Altman, 1999) (, , , , , ), the elements of which are defined as follows:
-
•
State space . A state consists of the information of candidate items (i.e., the ads sequence and the organic items sequence which are available on current step ), the user (e.g., age, gender and historical behaviors), and the context (e.g., order time).
-
•
Action space . An action is the decision whether to display an ad on each slot on the current screen, which is formulated as follows:
(1) where , . In our scenario, we do not change the order of ads sequence and organic items sequence in Blending Server.
-
•
Reward . After the system takes an action in one state, a user browses the mixed list and gives a feedback. The reward is calculated based on the feedback and consists of ads revenue , fee and user experience :
(2) -
•
Transition probability . is defined as the state transition probability from to after taking the action , where is the index for the screen/time step. The action taken in the state affects user behaviors. When the user pulls down, the state transits to the state of next screen . The items selected to present by will be removed from the state on the next step . If the user no longer pulls down, the transition terminates.
-
•
Discount factor . The discount factor balances the short-term and long-term rewards.
-
•
Constraint . The platform-level constraint is that the absolute difference between the total PAE in a period and the the target value should be less than a threshold to ensure stable ads revenue. The PAE is formulated as follows:
(3) where is the number of requests in a period, and mean the number of ads and organic items in the -th request. In this work, we choose one week as the period. Consequently, the platform-level constraint can be formulated as follows:
(4)
Given the CMDP formulated as above, the objective is to find an ads allocation policy to maximize the total reward under the platform-level constraint.
4. Methodology
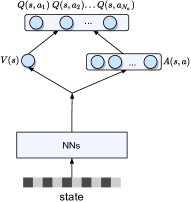
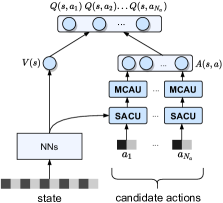
Architectures of Dueling DQN and Cross DQN.
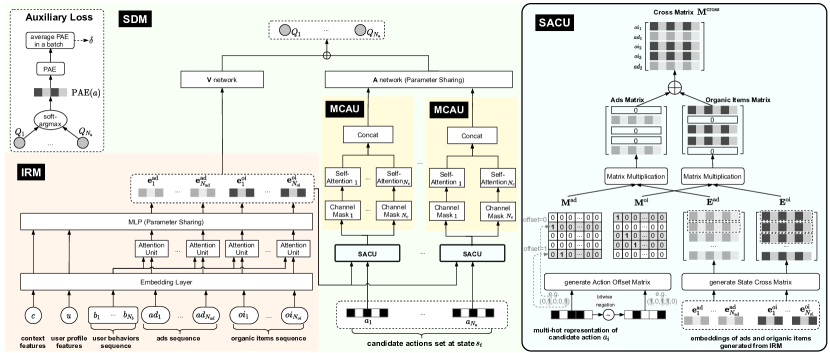
Network architecture of Cross DQN. Item Representation Module (IRM) generates the state embedding based on the raw state. Sequential Decision Module (SDM) generates Q-values of different actions with the help of State and Action Crossing Unit (SACU), Multi-Channel Attention Unit (MCAU) and auxiliary loss for batch-level constraint.
4.1. Architecture Overview
The structure of popular RL model, Dueling DQN, (Wang et al., 2016) is shown in Figure 3(a), which receives the state only as the input. Such a structure fails to extract cross information between the action and the state, making it difficult to model the arrangement signal of mixed lists. A common solution is to concatenate state and action directly, but the model remains hard to extract the information between the items in the mixed list designated by the action. To this end, we propose a novel structure Cross DQN (cf. Figure 3(b)). The State and Action Crossing Unit (SACU) is designed to cross the embeddings of the items in a mixed list designated by the action. The Multi-Channel Attention Unit (MCAU) is designed to effectively extract arrangement signal from different channel combinations.
Specifically, we show the detailed structure of Cross DQN in Figure 4. The model takes a state (including the organic items/ads sequence, context information, etc.) and the corresponding candidate actions as the input. Then, Item Representation Module (IRM) generates the representations (especially the representations of ads and organic items). Next, Sequential Decision Module (SDM) generates Q-values of different actions with the help of SACU, MCAU and an auxiliary loss for batch-level constraint. In SACU, the state embeddings are intersected according to the action to form a unified matrix representation. In MCAU, the crossing matrix generated from SACU are split into different channels to calculate the multi-channel attention weight. Finally, SDM chooses the action with the largest Q-value. We will introduce them in detail in the following subsections.
4.2. Item Representation Module
Item Representation Module (IRM) generates the state embedding from the raw state. To efficiently process the information from different sources, IRM generates two sequences of mixed embeddings: one for ads and one for organic items. The embedding for each item encodes not only the information of the item itself but also the information of the user profile, the context, and the interaction with historical user behaviors.
First, we use embedding layers to extract the embeddings from raw inputs. We denote the embeddings for ads, organic items, historical behaviors of the user, the user profile, the context as , , , , and respectively, where the subscript denotes the index within the sequence and , , and are the number of ads, organic items, and historical behaviors. Then, we use a target attention unit (Vaswani et al., 2017) to encodes the interaction between the historical behaviors of the user and the corresponding item, which is similar to Zhou et al. (2018):
| (5) | ||||
Afterwards, we append the embeddings of the user profile and the context to the embedding of each item:
| (6) | ||||
where denotes concatenation. Notice that there are some strong features for ads and organic items in our scenario (e.g., discount, delivery fee, delivery time), which are concatenated with the embedding of each item and input into SDM.
For ease of notation, we can also write the embeddings for ads and organic items in matrix form, each row of which represents one item in the sequence, i.e.,
| (7) | ||||
Involving several attention units, IRM may be time-consuming upon deployment. However, IRM is an independent module within Cross DQN so that we can invoke IRM in parallel to other modules preceding Cross DQN. See more details in Section 4.8.
4.3. State and Action Crossing Unit
To evaluate the Q-value of a certain state-action pair, we need an efficient representation of the mixed list designated by the corresponding action. State and Action Crossing Unit (SACU) helps us to construct a sequence of embeddings corresponding to the mixed list from the state embedding.
First, given an action, we generate the corresponding action offset matrices for ads and organic items: and , where the -th element represents whether the -th ad/organic item is presented on the -th slot. Recall that is the number of slots in one screen. For example, given the action with , the action offset matrix is
| (8) |
Then, we can calculate the cross matrix , which is the embedding of the mixed list corresponding to the given action, using the action offset matrices.
| (9) |
With SACU, we generate the embedding for the mixed list which enables us to efficiently extract the arrangement signal in the next module.
4.4. Multi-Channel Attention Unit
The user may focus on one or more aspects (e.g., discount, delivery fee, delivery time) of the mixed sequence at the same time. Accordingly, we propose MCAU to simultaneously model the user’s attention to different aspects of the mixed sequence.
The cross matrix generated by SACU contains different channels. Each channel represents an information dimension in the latent space and can be used to model one aspect of the mixed sequence. Meanwhile, the user may pay attention to more than one aspect of the mixed sequence at the same time. So the sequence information of two or more channels need to be combined for modeling. Next we will detail that how the sequence information of multiple channels is combined and modeled.
For channels, we formulate the number of channel combinations as , which is calculated as follows:
| (10) |
We formalize the mask matrix for the -th combination as . For example, the mask matrix for combination of the first channel and the last channel is
| (11) |
Nextly, signal matrix calculated by cross matrix and mask matrix are input into corresponding self-attention network (Vaswani et al., 2017) to model the attention across the items and generate a latent vector, as follows:
| (12) |
| (13) |
Latent vectors output by different self-attention network are concatenated together to represent the arrangement signal extracted from different channels, as follows:
| (14) |
4.5. Sequential Decision Module
With the help of SACU and MCAU, Sequential Decision Module (SDM) takes the embeddings generated by IRM and candidate actions as the input, and outputs Q-values corresponding to different actions.
Given a set of candidate actions , SACU generates a cross matrix for each action and MCAU generates corresponding arrangement signal representation for each action. Subsequently, the outputs of the V network and the A network (Wang et al., 2016) can be calculated as follows:
| (15) |
| (16) |
where pool indicates average pooling over different rows (i.e., different items in the ads/organic items sequence).
Finally, SDM outputs the Q-value corresponding to the -th candidate action on the current screen as follows:
| (17) |
4.6. Auxiliary Loss for Batch-level Constraint
Recall that our objective is to maximize cumulative reward under the constraint on the average ads exposure. The key for a successful strategy is to satisfy the constraint while maintaining a differentiated recommendation for different users/scenarios. For example, if the user is prone to be annoyed by ads, we should expose less ads to the user, and vice versa. Different auxiliary losses to constrain the percentage of ads exposure (PAE) can result in different level of differentiation. A common solution is to use a request-level constraint, i.e., constraining the PAE of each request to be close to the PAE target . Such a solution may result in poor differentiation since the PAE of each request is constrained to the same target regardless of the context. To allow for differentiation, Wang et al. (2019) propose to use an hour-level constraint that allows for using different PAE targets in different hours. However, the level of differentiation is still limited within an hour. To this end, we propose a batch-level constraint to constrain the average PAE of the requests in a batch instead of constraining the PAE of each request.
We denote the PAE associated with the action as . For example, the PAE of is . Given a batch of transitions , our batch-level constraint can be written as:
| (18) |
However, the argmax function is not differentiable. Therefore, we use a soft version of argmax instead, i.e., we use
| (19) |
where is the normalization factor and is the temperature coefficient.
Unlike previous request-level or hour-level constraints that limit the PAE for each request, we only limit the average PAE estimated using randomly sampled batches. Such a weaker form of constraint encourages the model to choose the action with a PAE that is deviated from but may better adapt for the current context.
4.7. Offline Training
We show the process of offline training in Algorithm 1. We train Cross DQN based on an offline dataset generated by an online exploratory policy . For each iteration, we sample a batch of transitions from the offline dataset and update the model using gradient back-propagation w.r.t. the loss:
| (20) |
where is the same loss function as the loss in DQN (Mnih et al., 2015), is the auxiliary loss for the constraint, and is the coefficient to balance the two losses. Specifically,
| (21) |
4.8. Online Serving
We show the process of online serving in Algorithm 2. In the online serving system, Cross DQN selects the action with the highest reward based on current state and converts the action to ads slots set for the output. When the user pulls down, the model receives the state for the next screen, and then makes a decision based on the information on the next screen.
In our scenario, current state will transit to the next state or terminate depending on whether the user pulls down. However, the next possible state corresponding to a given action is deterministic if the interaction does not terminate. Based on this observation, we can cache the decisions for multiple screens and transmit to the client at once to reduce the time cost for the communication between the server and the client.
Model Decomposition. Cross DQN will be called times for one cache, which is time consuming for industrial scenarios where latency is a major concern. Fortunately, the outputs of IRM can be reused across different calls of Cross DQN in one cache, which saves up to about computation time. Since the generation of item representations does not rely on the previous modules (such as ranking and ads bidding), we calculate the representation of the items parallel to the previous modules, which further reduces the latency. As shown in Figure 5, the Cross DQN is decomposed into IRM and SDM for deployment. The two parts are trained end-to-end but deployed on different services for real-time prediction. The IRM is calculated parallel to Ad Ranking and Organic Ranking systems. Hence, it is latency-free for real-time inference of SDM.
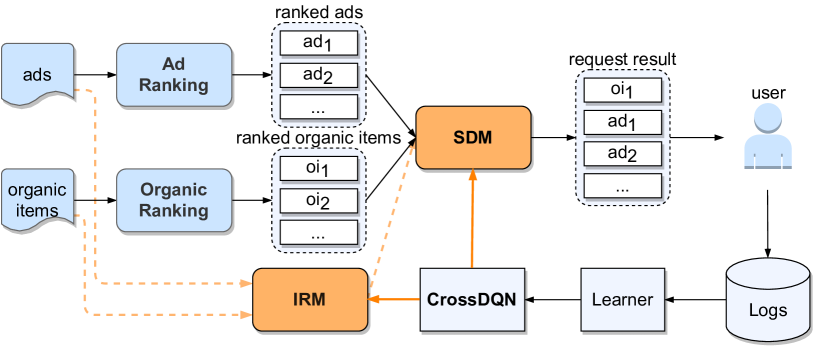
Model decomposition for online service.
Parameter Sharing. Both of IRM and SDM use parameter sharing (cf. Figure 4) across different ads/organic items. As for IRM, we can calculate the representations for all recalled items at the same time without ranking information through parameter sharing and parallel computing. Meanwhile, in SDM, we use parameter sharing across different actions to guarantee the consistency of the reward evaluation of the actions and ensure that the batch-level constraint is effective. In addition, parameter sharing can reduce the scale of parameters, accelerate model training and reduce memory usage.
5. Experiments
We will evaluate Cross DQN model through offline and online experiments in this section. In offline experiments, we will compare Cross DQN with existing baselines and analyze the role of different designs in Cross DQN. In online experiments, we will compare Cross DQN with the previous strategy deployed on the Meituan platform using an online A/B test.
5.1. Experimental Settings
Statistics of the dataset. #requests #users #ads #items 12,729,509 2,000,420 385,383 726,587
5.1.1. Dataset
We collect the dataset by running an exploratory policy on the Meituan platform during March 2021. We present the detailed statistics of the dataset in Table 1. Notice that each request contains several transitions. The features for the ads/organic items include the identity, the category, the comment score, etc. The features for the user profile include the identity, the gender, etc.
The result of Revenue Indicators and Experience Indicators. Each experiment are presented in the form of mean standard deviation. The improvement means the improvements of Cross DQN across the best baselines. model Revenue Indicators Experience Indicators Fixed 0.2211 (0.00252) 0.2476 (0.00686) 0.2148 (0.00342) 0.8823 (0.00730) GEA 0.2372 (0.00035) 0.2564 (0.00096) 0.2457 (0.00061) 0.9493( 0.00012) CTLRL 0.2286 (0.00101) 0.2536 (0.00860) 0.2250 (0.00213) 0.9078 (0.00384) HRL-Rec 0.2380 (0.00287) 0.2660 (0.00132) 0.2530 (0.00021) 0.9526 (0.00123) DEAR 0.2391 (0.00244) 0.2687 (0.00116) 0.2530 (0.00044) 0.9552 (0.00407) Cross DQN 0.2465 (0.00058) 0.2742 (0.00135) 0.2551 (0.00081) 0.9703 (0.00085) -aux 0.2446 (0.00079) 0.2737 (0.00231) 0.2537 (0.00034) 0.9671 (0.00118) -aux-mcau 0.2418 (0.00120) 0.2728 (0.00102) 0.2534 (0.00045) 0.9661 (0.00092) -aux-mcau-sacu 0.2370 (0.00217) 0.2722 (0.00286) 0.2508 (0.00065) 0.9629 (0.00201) Improvement 3.09% 2.05% 0.83% 1.58%
The experimental results on the sensitivity of , and .
5.1.2. Evaluation Metrics
We evaluate the model with revenue indicators and experience indicators. As for revenue indicators, we use ads revenue and service fee in a period to measure platform revenue. Specifically, the ads revenue is gained from advertisers calculated using Generalized Second Price (GSP) (Edelman et al., 2007) and charged per click. The total ads revenue is calculated as . The service fee is charged from merchants’ orders according to a certain percentage. and the total service fee is calculated as . In our platform, user experience is measured by whether the user demand (e.g., finding a satisfying product) can be fulfilled. As for experience indicators, we use the average conversion rate and average experience score to measure user experience. The conversion rate calculated as is the ratio of the number of orders placed by the user to the number of his/her requests. The experience score defined in Section 3 reflects the degree of satisfaction of the user demand.
5.1.3. Hyperparameters
We implement Cross DQN with TensorFlow and apply a gird search for the hyperparameters. The hidden layer sizes of the IRM are and the hidden layer sizes of the SDM are . The learning rate is , the optimizer is Adam (Kingma and Ba, 2014) and the batch size is .
5.2. Offline Experiment
In this section, we train Cross DQN with offline data and evaluate the performance using an offline estimator. Through extended engineering, the offline estimator models the user preference and aligns well with the online service. We conduct experiments to answer the following two questions: i) How does Cross DQN perform compared with other baselines? ii) How do different designs (e.g., SACU, MCAU) and hyperparameter settings (e.g., , ) affect the performance of Cross DQN?
5.2.1. Baselines
We compare Cross DQN with the following five representative methods:
-
•
Fixed. This method displays ads in fixed slots, such as the slot indexed by .
-
•
GEA (Yan et al., 2020). GEA is a non RL-based dynamic ads slots strategy. It takes the impact of ads intervals into consideration and ranks the ads and organic items jointly with a rank score , where charge is the fee paid by advertisers, takerate is the take rate (i.e., the fee charged on each transaction by the platform), and is the interval between two ads.
-
•
CTLRL (Wang et al., 2019). Constrained Two-Level Reinforcement Learning (CTLRL) uses a two-level RL structure to allocate ads. The upper level RL model decomposes the platform-level constraint into hour-level constraints, and the lower level RL model sets the hour-level constraint as the request-level constraint.
-
•
HRL-Rec (Xie et al., 2021). HRL-Rec is an RL-based dynamic ads slots strategy. It divides the integrated recommendation into two levels of tasks and solves using hierarchical reinforcement learning. Specifically, the model first decides the channel (i.e., select an organic item or an ad) and then determine the specific item for each slot.
-
•
DEAR (Zhao et al., 2021). DEAR is also an RL-based dynamic ads slots strategy. It designs a deep Q-network architecture to determine three related tasks jointly, i.e., i) whether to insert an ad to the recommendation list, and if yes, ii) the optimal ad and iii) the optimal location to insert.
5.2.2. Performance Comparison
We present the experiment results under the same PAE level in Table 2 and have the following observations: i) Compared with all these baselines, Cross DQN achieves strongly competitive performance on both the revenue-related metrics and experience-related metrics. Specifically, Cross DQN improves over the best baseline w.r.t. , , and by 3.09%, 2.05%, 0.83% and 1.58% separately. ii) Cross DQN outperforms the fixed slots strategy. A reasonable explanation is that the ads positions calculated by Cross DQN are more personalized, which leads to an increase in revenue as well as an improvement of user experience. iii) Cross DQN outperforms GEA, which indicates that an RL-based method may perform better than a rule-based method. iv) Cross DQN also performs better than CTLRL possible due to the fact that the PAE of different requests of Cross DQN within the same hour are more personalized. v) Compared with the state-of-the-art RL-based methods, i.e., HRL-Rec and DEAR, the superior performance of Cross DQN justifies the explicit modeling of the arrangement signal.
5.2.3. Ablation Study
To verify the impact of different designs (SACU, MCAU, batch-level constraint), we study three ablated variants of Cross DQN which have different components in SDM.
-
•
Cross DQN (-aux) does not use the auxiliary loss of Cross DQN. Notice that without the help of the auxiliary loss, we can adjust the coefficients in the reward function to realize the same PAE as the PAE of other baselines.
-
•
Cross DQN (-aux-mcau) additionally blocks the MCAU and uses one self-attention unit instead on top of the previous ablated version.
-
•
Cross DQN (-aux-mcau-sacu) concatenate the embeddings of the action and the state directly without SACU.
The results shown in Table 2 reveal the following findings: i) The performance gap between Cross DQN (-aux-mcau-sacu) and Cross DQN (-aux-mcau) indicates the effectiveness of SACU. By explicitly crossing the embeddings of the states and the actions, SACU can effectively generate cross matrix representation for subsequent extraction of arrangement signal, therefore improving the overall metrics. ii) The MCAU is an additional process after the crossover to strengthen the mutual interaction. The performance of Cross DQN (-aux) is superior to Cross DQN (-aux-mcau), which verifies the effectiveness of extracting arrangement signal of different channel combinations. iii) Cross DQN outperforms Cross DQN (-aux), resulting from the fact that the batch-level constraint brings a certain revenue increase and makes the PAE in a period more stable.
5.2.4. Hyperparameter Analysis
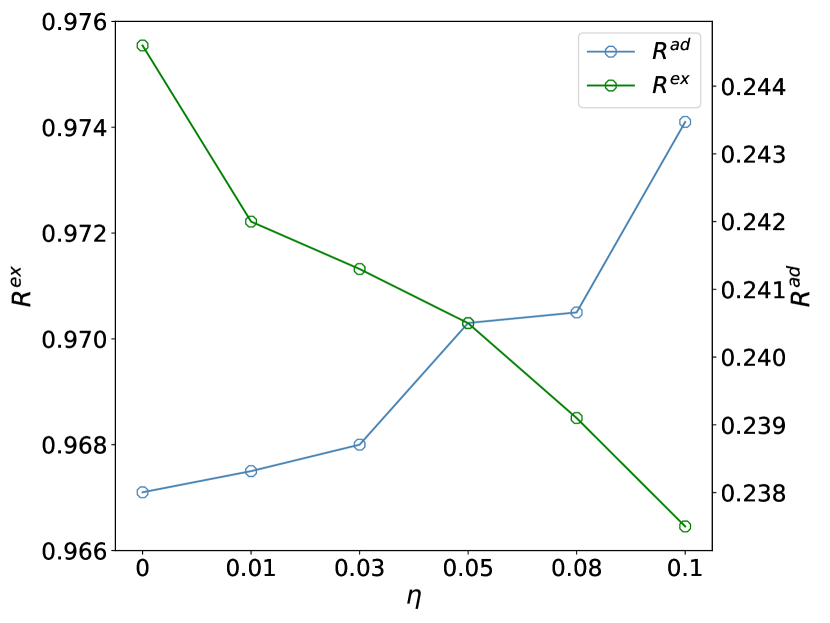
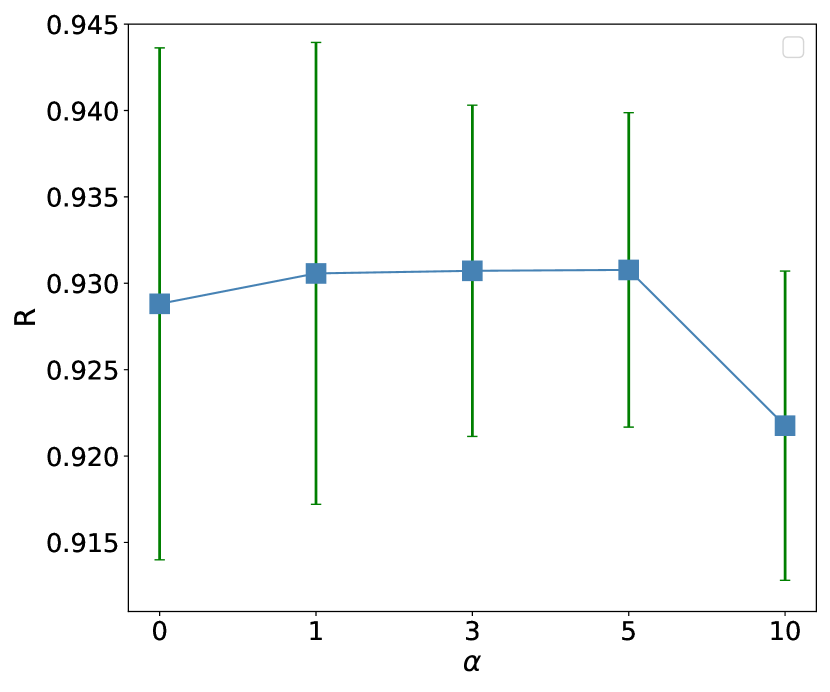
We analyze the sensitivity of these three hyperparameters: , and . is the weight for the user experience in the reward function (cf. Eq. (2)). is the temperature parameter that controls the degree of the approximation in Eq. (19). is the hyperparameter which balances the main loss and auxiliary loss (cf. Eq (20)).
Hyperparameter . The experimental results of different values of are presented in Figure 6(c)a. As increases, increases but decreases. A reasonable explanation is that the system of dynamic ads allocation tends to insert fewer ads when becomes larger, which has a beneficial impact on user experience and fee.
Hyperparameter . As shown in Figure 6(c)b, we find that the auxiliary loss for batch-level constraint has greater influence on return. When increases, the standard deviation of reward decreases. This phenomenon shows that the PAE and revenue are more stable under batch-level constraint. It is worth noticing that the mean of reward increases when changes from 0 to 1. One possible explanation is that the ads allocation under a certain batch-level constraint of PAE will be more reasonable, which ensures the quality of display results and improves the revenue and user experience. However, if is too large, it will deviate from the learning goal, resulting in a decline in reward.
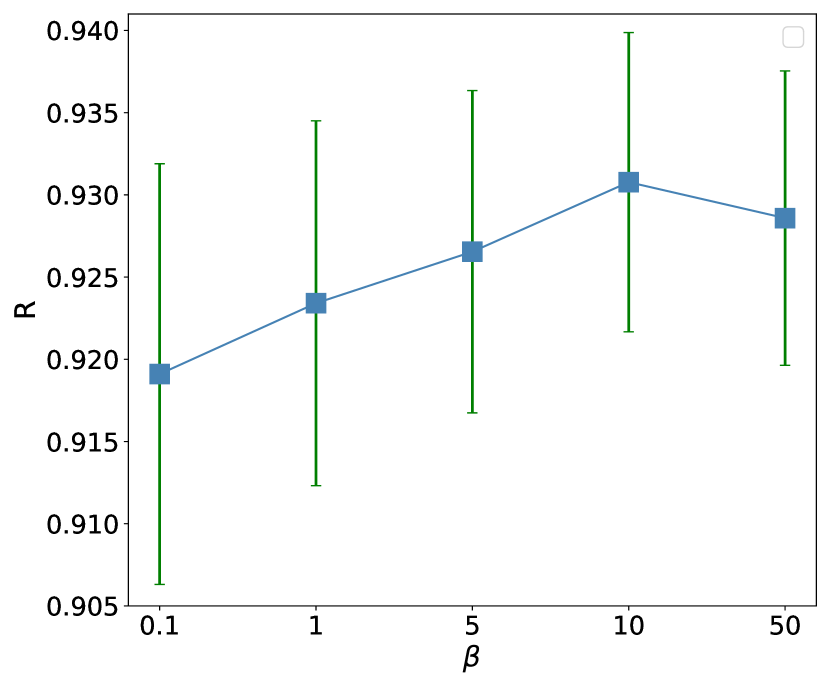
Hyperparameter . The right curve in Figure 6(c) reveals that the mean of reward increases and the standard deviation of reward decreases as increases within a certain range. This phenomenon demonstrates that accurate calculation of PAE results in stable and high reward. On the contrary, the reward may decrease when exceeds a certain threshold, suggesting the necessity to carefully tune this parameter in practice.
5.3. Online Results
We compare Cross DQN with fixed ads positions and both strategies are deployed on the Meituan platform through online A/B test. We keep total PAE the same for all methods for a fair comparison. As a result, we find that , and increase by 12.9%, 10.2% and 9.1%, which demonstrates that our Cross DQN not only significantly increases the platform revenue, but also improves user experience. It is worth noting that this increase values are 11.5%, 10.7% and 10.0% in offline experiments. One possible reason for this difference in absolute value is the differences in data distribution.
6. Conclusion and Future Work
In this paper, we propose Cross DQN to optimize ads allocation in feed. In Cross DQN, we design State and Action Cross Unit and Multi-Channel Attention Unit to explicitly extract the arrangement signal that is the influence of the arrangement of items in mixed list on user behaviors. In addition, we introduce an auxiliary loss for batch-level constraint to achieve the personalization for different requests as well as the platform-level constraint. Practically, both offline experiments and online A/B test have demonstrated the superior performance and efficiency of our solution.
In our scenario, user experience is also an important objective for the long-term growth of the platform since the improvement of user experience directly increases the retention rate and enhances the reputation of the platform. In the future, it is beneficial to optimize for more user experience metrics and pay more attention to the modeling of long-term benefits. In addition, it is worth noting that our method follows the offline reinforcement learning paradigm. Compared with online reinforcement learning, offline reinforcement learning faces additional challenges (such as the distribution shift problem). The impact of these challenges to the ads allocation problem is also a potential research direction in the future.
References
- (1)
- Altman (1999) Eitan Altman. 1999. Constrained Markov decision processes. Vol. 7. CRC Press.
- Carrion et al. (2021) Carlos Carrion, Zenan Wang, Harikesh Nair, Xianghong Luo, Yulin Lei, Xiliang Lin, Wenlong Chen, Qiyu Hu, Changping Peng, Yongjun Bao, and Weipeng P. Yan. 2021. Blending Advertising with Organic Content in E-Commerce: A Virtual Bids Optimization Approach. ArXiv abs/2105.13556 (2021).
- Edelman et al. (2007) Benjamin Edelman, Michael Ostrovsky, and Michael Schwarz. 2007. Internet advertising and the generalized second-price auction: Selling billions of dollars worth of keywords. American economic review 97, 1 (2007), 242–259.
- Feng et al. (2018) Jun Feng, H. Li, Minlie Huang, Shichen Liu, Wenwu Ou, Zhirong Wang, and Xiaoyan Zhu. 2018. Learning to Collaborate: Multi-Scenario Ranking via Multi-Agent Reinforcement Learning. Proceedings of the 2018 World Wide Web Conference (2018).
- Feng et al. (2021a) Yufei Feng, Yu Gong, Fei Sun, Qingwen Liu, and Wenwu Ou. 2021a. Revisit Recommender System in the Permutation Prospective. ArXiv abs/2102.12057 (2021).
- Feng et al. (2021b) Yufei Feng, Binbin Hu, Yu Gong, Fei Sun, Qingwen Liu, and Wenwu Ou. 2021b. GRN: Generative Rerank Network for Context-wise Recommendation. ArXiv abs/2104.00860 (2021).
- Ghose and Yang (2009) A. Ghose and Sha Yang. 2009. An Empirical Analysis of Search Engine Advertising: Sponsored Search in Electronic Markets. Manag. Sci. 55 (2009), 1605–1622.
- Kingma and Ba (2014) Diederik P Kingma and Jimmy Ba. 2014. Adam: A method for stochastic optimization. arXiv preprint arXiv:1412.6980 (2014).
- Koutsopoulos (2016) Iordanis Koutsopoulos. 2016. Optimal advertisement allocation in online social media feeds. In Proceedings of the 8th ACM International Workshop on Hot Topics in Planet-scale mObile computing and online Social neTworking. 43–48.
- Li et al. (2020) Xiang Li, Chao Wang, Bin Tong, Jiwei Tan, Xiaoyi Zeng, and Tao Zhuang. 2020. Deep Time-Aware Item Evolution Network for Click-Through Rate Prediction. In Proceedings of the 29th ACM International Conference on Information & Knowledge Management. 785–794.
- Mehta (2013) Aranyak Mehta. 2013. Online Matching and Ad Allocation. Found. Trends Theor. Comput. Sci. 8 (2013), 265–368.
- Mnih et al. (2015) Volodymyr Mnih, Koray Kavukcuoglu, David Silver, Andrei A Rusu, Joel Veness, Marc G Bellemare, Alex Graves, Martin Riedmiller, Andreas K Fidjeland, Georg Ostrovski, et al. 2015. Human-level control through deep reinforcement learning. nature 518, 7540 (2015), 529–533.
- Ouyang et al. (2020) Wentao Ouyang, Xiuwu Zhang, Lei Zhao, Jinmei Luo, Yu Zhang, Heng Zou, Zhaojie Liu, and Yanlong Du. 2020. MiNet: Mixed Interest Network for Cross-Domain Click-Through Rate Prediction. In Proceedings of the 29th ACM International Conference on Information & Knowledge Management. 2669–2676.
- Sutton et al. (1998) Richard S Sutton, Andrew G Barto, et al. 1998. Introduction to reinforcement learning. Vol. 135. MIT press Cambridge.
- Vaswani et al. (2017) Ashish Vaswani, Noam Shazeer, Niki Parmar, Jakob Uszkoreit, Llion Jones, Aidan N Gomez, Lukasz Kaiser, and Illia Polosukhin. 2017. Attention is all you need. arXiv preprint arXiv:1706.03762 (2017).
- Wang et al. (2011) B. Wang, Zhaonan Li, Jie Tang, Kuo Zhang, Songcan Chen, and Liyun Ru. 2011. Learning to Advertise: How Many Ads Are Enough?. In PAKDD.
- Wang et al. (2019) Weixun Wang, Junqi Jin, Jianye Hao, Chunjie Chen, Chuan Yu, Weinan Zhang, Jun Wang, Xiaotian Hao, Yixi Wang, Han Li, et al. 2019. Learning Adaptive Display Exposure for Real-Time Advertising. In Proceedings of the 28th ACM International Conference on Information and Knowledge Management. 2595–2603.
- Wang et al. (2016) Ziyu Wang, Tom Schaul, Matteo Hessel, Hado Hasselt, Marc Lanctot, and Nando Freitas. 2016. Dueling network architectures for deep reinforcement learning. In International conference on machine learning. PMLR, 1995–2003.
- Wei et al. (2020) Jianxiong Wei, Anxiang Zeng, Yueqiu Wu, Pengxin Guo, Q. Hua, and Qingpeng Cai. 2020. Generator and Critic: A Deep Reinforcement Learning Approach for Slate Re-ranking in E-commerce. ArXiv abs/2005.12206 (2020).
- Xie et al. (2021) Ruobing Xie, Shaoliang Zhang, Rui Wang, Feng Xia, and Leyu Lin. 2021. Hierarchical Reinforcement Learning for Integrated Recommendation. In Proceedings of AAAI.
- Yan et al. (2020) Jinyun Yan, Zhiyuan Xu, Birjodh Tiwana, and Shaunak Chatterjee. 2020. Ads Allocation in Feed via Constrained Optimization. In Proceedings of the 26th ACM SIGKDD International Conference on Knowledge Discovery & Data Mining. 3386–3394.
- Zhang et al. (2018) Weiru Zhang, Chao Wei, Xiaonan Meng, Yi Hu, and Hao Wang. 2018. The whole-page optimization via dynamic ad allocation. In Companion Proceedings of the The Web Conference. 1407–1411.
- Zhao et al. (2018) Mengchen Zhao, Z. Li, Bo An, Haifeng Lu, Yifan Yang, and Chen Chu. 2018. Impression Allocation for Combating Fraud in E-commerce Via Deep Reinforcement Learning with Action Norm Penalty. In IJCAI.
- Zhao et al. (2021) Xiangyu Zhao, Changsheng Gu, Haoshenglun Zhang, Xiwang Yang, Xiaobing Liu, Hui Liu, and Jiliang Tang. 2021. DEAR: Deep Reinforcement Learning for Online Advertising Impression in Recommender Systems. In Proceedings of the AAAI Conference on Artificial Intelligence, Vol. 35. 750–758.
- Zhao et al. (2020) Xiangyu Zhao, Xudong Zheng, Xiwang Yang, Xiaobing Liu, and Jiliang Tang. 2020. Jointly learning to recommend and advertise. In Proceedings of the 26th ACM SIGKDD International Conference on Knowledge Discovery & Data Mining. 3319–3327.
- Zhou et al. (2018) Guorui Zhou, Xiaoqiang Zhu, Chenru Song, Ying Fan, Han Zhu, Xiao Ma, Yanghui Yan, Junqi Jin, Han Li, and Kun Gai. 2018. Deep interest network for click-through rate prediction. In Proceedings of the 24th ACM SIGKDD International Conference on Knowledge Discovery & Data Mining. 1059–1068.