Supplemental Materials
Quality-Diversity Meta-Evolution: customising behaviour spaces to a meta-objective
David M. Bossens and Danesh Tarapore
1 Effect of population size on meta-evolution in the Rastrigin function optimisation benchmark
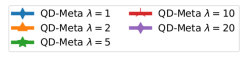
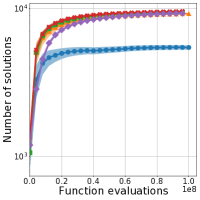
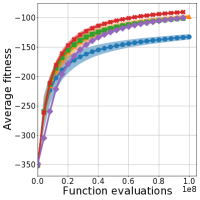
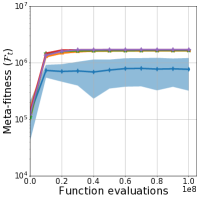
Manipulation of the population size demonstrates that using yields meta-fitness of only 900,000, which is about 50% of the other settings with , which have nearly 2,000,000 in meta-fitness. Similarly, the average fitness and number of solutions are also decreased when taking . Between different settings of , is consistently ranked on top.
(a) Number of solutions
(b) Average fitness
(c) Global fitness
(d) Meta-fitness
Fig. S1: Effect of meta-population size, , on meta-fitness (Mean SE) in Rastrigin function optimisation. -axis is the number of function evaluations. -axis is the meta-fitness average across the archives in the meta-population, with the mean and standard error being aggregated across 20 replicates.
2 RHex hexapod robot locomotion benchmark
2.1 Full set of obstacle courses
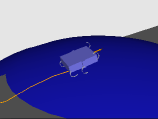
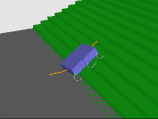
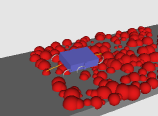
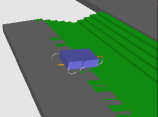
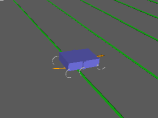
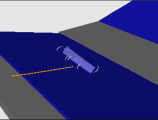
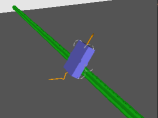
Fig. S2 shows the full set of obstacle courses. For each evolutionary replicate, one partition of the set is used for meta-fitness evaluation in the QD-Meta Obstacle condition while the remaining partition of the set is used for the test phase of all algorithms.
(a) Sphere
(b) Stairs
(c) Slope
(d) Rubble
(e) Down-and-up stairs
(f) Many pipes
(g) Ditch
(h) Thick pipe
(i) Thin pipe
Fig. S2: All obstacles used for the simulated obstacle course. At the start of an evolutionary run of QD-Meta, 5 of these obstacle courses are selected randomly to be used in the meta-fitness evaluation. For each run, the remaining 4 obstacle courses, which are not experienced during (meta-)evolution, are used in the test phase.
2.2 Results for dynamic parameter control in QD-Meta
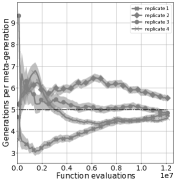
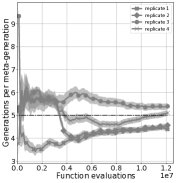
Below results provide further results on the effect of the RL-based dynamic parameter control of the number of generations per meta-generation. This includes the QD-metrics (see Fig. S3), the meta-fitness evolution (see Fig. S4), and the relation of the number of generations per meta-generation with the meta-fitness over time (see Fig. S5).
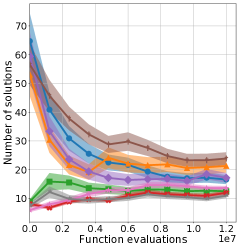
(a) Number of solutions
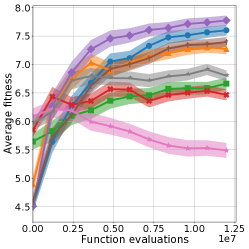
(b) Average fitness
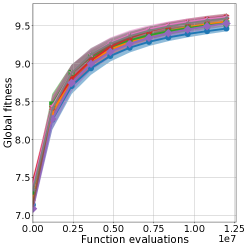
(c) Global fitness
Fig. S3: Quality-diversity statistics (Mean SE) of the different QD-Meta conditions across 4 replicates on the RHex robot platform, including (a) the total number of solutions in the archive; (b) the average fitness across the archive; and (c) the maximal fitness across the archive. Dynamic parameter control with RL is used by default while the suffix static indicates that no dynamic parameter control is used.
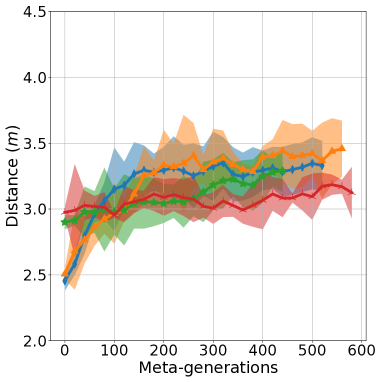
(a) Obstacle
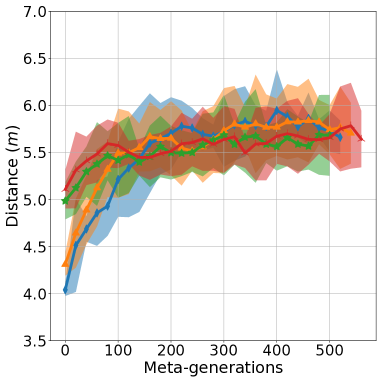
(b) Damage
Fig. S4: Meta-fitness (Mean SE) evolution of different QD-Meta conditions over meta-generations. -axis is the number of meta-generations and -axis is the meta-fitness average across the archives in the meta-population, with the mean and standard error being aggregated across 4 replicates. The meta-fitness represents a change of environment in the RHex robot platform: in the QD-Meta Obstacle condition (left), the archive is assessed on various obstacle courses; in the QD-Meta Damage condition (right), the archive is assessed on different kinds of damages injected to the robot’s legs one-by-one. To better display the trend over time, the meta-fitness is further smoothed over time by computing the running average. Dynamic parameter control with RL is used by default while the suffix static indicates that no dynamic parameter control is used.
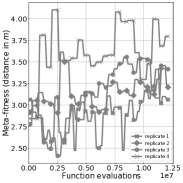
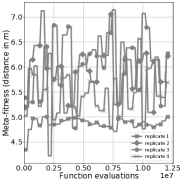
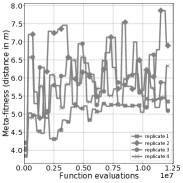
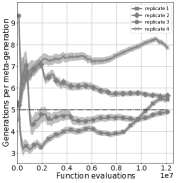
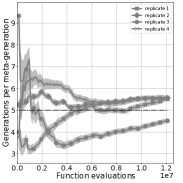
(a) Obstacle Trajectory
(b) Obstacle Feature-sets
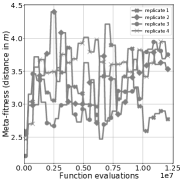
(c) Damage Trajectory
(d) Damage Feature-sets
Fig. S5: The relation between the dynamically controlled generations per meta-generation parameter and the meta-fitness is shown for different QD-Meta conditions on the Rhex hexapod robot locomotion benchmark. Top panels show for each replicate the average meta-fitness across the meta-population while bottom panels show the corresponding changes to the number of generations per meta-generation (Mean SE aggregated over the meta-generations within the time bin).