Room-Temperature Intrinsic and Extrinsic Damping in Polycrystalline Fe Thin Films
Abstract
We examine room-temperature magnetic relaxation in polycrystalline Fe films. Out-of-plane ferromagnetic resonance (FMR) measurements reveal Gilbert damping parameters of 0.0024 for Fe films with thicknesses of 4-25 nm, regardless of their microstructural properties. The remarkable invariance with film microstructure strongly suggests that intrinsic Gilbert damping in polycrystalline metals at room temperature is a local property of nanoscale crystal grains, with limited impact from grain boundaries and film roughness. By contrast, the in-plane FMR linewidths of the Fe films exhibit distinct nonlinear frequency dependences, indicating the presence of strong extrinsic damping. To fit our in-plane FMR data, we have used a grain-to-grain two-magnon scattering model with two types of correlation functions aimed at describing the spatial distribution of inhomogeneities in the film. However, neither of the two correlation functions is able to reproduce the experimental data quantitatively with physically reasonable parameters. Our findings advance the fundamental understanding of intrinsic Gilbert damping in structurally disordered films, while demonstrating the need for a deeper examination of how microstructural disorder governs extrinsic damping.
I Introduction
In all magnetic materials, magnetization has the tendency to relax toward an effective magnetic field. How fast the magnetization relaxes governs the performance of a variety of magnetic devices. For example, magnetization relaxation hinders efficient precessional dynamics and should be minimized in devices such as precessional magnetic random access memories, spin-torque oscillators, and magnonic circuitsDiao et al. (2007); Zhu and Zhu (2007); Yu et al. (2014); Rowlands et al. (2019). From the technological perspective, it is important to understand the mechanisms behind magnetic relaxation in thin-film materials that comprise various nanomagnetic device applications. Among these materials, bcc Fe is a prototypical elemental ferromagnet with attractive properties, including high saturation magnetization, soft magnetismKanada et al. (2017), and large tunnel magnetoresistanceParkin et al. (2004); Ando et al. (2005). Our present study is therefore motivated by the need to uncover magnetic relaxation mechanisms in Fe thin films – particularly polycrystalline films that can be easily grown on arbitrary substrates for diverse applications.
To gain insights into the contributions to magnetic relaxation, a common approach is to examine the frequency dependence of the ferromagnetic resonance (FMR) linewidth. The most often studied contribution is viscous Gilbert dampingGilbert (1955, 2004); Heinrich et al. (1967); Kamberský (1976); Tserkovnyak et al. (2004); Rossi et al. (2005), which yields a linear increase in FMR linewidth with increasing precessional frequency. In ferromagnetic metals, Gilbert damping arises predominately from “intrinsic” mechanisms Schoen et al. (2016); Gilmore et al. (2007); Mankovsky et al. (2013) governed by the electronic band structure111Eddy-current damping Scheck et al. (2006) and radiative damping Schoen et al. (2015) can also contribute to viscous damping, but they typically constitute a small correction that is 10% of intrinsic Gilbert damping in ferromagnetic thin films (i.e., 20 nm thick) for nanomagnetic devices Khodadadi et al. (2020); Smith et al. (2020), which are thought to be rooted in the electronic band structure of the ferromagnetic metal Schoen et al. (2016); Gilmore et al. (2007); Mankovsky et al. (2013). Indeed, a recent experimental study by Khodadadi et al.Khodadadi et al. (2020) has shown that intrinsic, band-structure-based Gilbert damping dominates magnetic relaxation in high-quality crystalline thin films of Fe, epitaxially grown on lattice-matched substrates. However, it is yet unclear how intrinsic damping is impacted by the microstructure of polycrystalline Fe films.
Microstructural disorder in polycrystalline Fe films can also introduce extrinsic magnetic relaxation. A well-known extrinsic relaxation mechanism is two-magnon scattering, where the uniform precession mode with zero wave vector scatters into a degenerate magnon mode with a finite wave vector Geschwind and Clogston (1957); LeCraw et al. (1958); Schlömann (1958); Patton et al. (1967). Two-magnon scattering generally leads to a nonlinear frequency dependence of the FMR linewidth, governed by the nature of magnon scattering centers at the surfaces Arias and Mills (1999, 2000) or in the bulk of the filmMcMichael and Krivosik (2004); Woltersdorf and Heinrich (2004); Mo et al. (2005); Kalarickal et al. (2009). While some prior experiments point to the prominent roles of extrinsic magnetic relaxation in polycrystalline ferromagnetic films Lindner et al. (2009); Jiang et al. (2017); Edwards et al. (2019), systematic studies of extrinsic relaxation (e.g., two-magnon scattering) on polycrystalline Fe thin films are still lacking.
Here, we investigate both the intrinsic and extrinsic contributions to magnetic relaxation at room temperature in polycrystalline Fe films. We have measured the frequency dependence of the FMR linewidth with (1) the film magnetized out-of-plane (OOP), where two-magnon scattering is suppressed McMichael and Krivosik (2004) such that intrinsic Gilbert damping is quantified reliably, and (2) the film magnetized in-plane (IP), where two-magnon scattering is generally expected to coexist with intrinsic Gilbert damping.
From OOP FMR results, we find that the intrinsic Gilbert damping of polycrystalline Fe films at room temperature is independent of their structural properties and almost identical to that of epitaxial films. Such insensitivity to microstructure is in contrast to disorder-sensitive Gilbert damping recently shown in epitaxial Fe at cryogenic temperature Khodadadi et al. (2020). Our present work implies that Gilbert damping at a sufficiently high temperature becomes a local property of the metal, primarily governed by the structure within nanoscale crystal grains rather than grain boundaries or interfacial disorder. This implication refutes the intuitive expectation that intrinsic Gilbert damping should depend on structural disorder in polycrystalline films.
In IP FMR results, the frequency dependence of the FMR linewidth exhibits strong nonlinear trends that vary significantly with film microstructure. To analyze the nonlinear trends, we have employed the grain-to-grain two-magnon scattering model developed by McMichael and KrivosikMcMichael and Krivosik (2004) with two types of correlation functions for capturing inhomogeneities in the film. However, neither of the correlation functions yields quantitative agreement with the experimental results or physically consistent, reasonable parameters. This finding implies that a physical, quantitative understanding of extrinsic magnetic relaxation requires further corrections of the existing two-magnon scattering model, along with much more detailed characterization of the nanoscale inhomogeneities of the magnetic film. Our study stimulates opportunities for a deeper examination of fundamental magnetic relaxation mechanisms in structurally disordered ferromagnetic metal films.
II Film deposition and structural properties
Polycrystalline Fe thin films were deposited using DC magnetron sputtering at room temperature on Si substrates with a native oxide layer of SiO2. The base pressure of the chamber was below Torr and all films were deposited with 3 mTorr Ar pressure. Two sample series with different seed layers were prepared in our study: subs./Ti(3 nm)/Cu(3 nm)/Fe(2-25 nm)/Ti(3 nm) and subs./Ti(3 nm)/Ag(3 nm)/Fe(2-25 nm)/Ti(3 nm). In this paper we refer to these two sample series as Cu/Fe and Ag/Fe, respectively. The layer thicknesses are based on deposition rates derived from x-ray reflectivity (XRR) of thick calibration films. The Ti layer grown directly on the substrate ensures good adhesion of the film, whereas the Cu and Ag layers yield distinct microstructural properties for Fe as described below. We note that Cu is often used as a seed layer for growing textured polycrystalline ferromagnetic metal films Ghosh et al. (2012); Schoen et al. (2017). Our initial motivation for selecting Ag as an alternative seed layer was that it might promote qualitatively different Fe film growth Bürgler et al. (1997), owing to a better match in bulk lattice parameter between Fe ( Å) and Ag ( Å) compared to Fe and Cu ( Å).
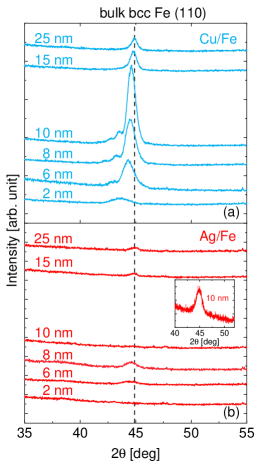


We performed x-ray diffraction (XRD) measurements to compare the structural properties of the Cu/Fe and Ag/Fe films. Figure 1(a,b) shows symmetric - XRD scan curves for several films from both the Cu/Fe and Ag/Fe sample series. For all Cu/Fe films, the (110) body-center-cubic (bcc) peak can be observed around °(Fig. 1(a)). This observation confirms that the Fe films grown on Cu are polycrystalline and textured, where the crystal grains predominantly possess (110)-oriented planes that are parallel to the sample surface. For Ag/Fe (Fig. 1(b)), the (110) bcc peak is absent or extremely weak, from which one might surmise that the Fe films grown on Ag are amorphous or only possess weak crystallographic texture. However, we find that the Ag/Fe films are, in fact, also polycrystalline with evidence of (110) texturing. In the following, we elaborate on our XRD results, first for Cu/Fe and then Ag/Fe.
We observe evidence for a peculiar, non-monotonic trend in the microstructural properties of the Cu/Fe films. Specifically, the height of the - diffraction peak (Fig. 1(a)) increases with Fe film thickness up to 10 nm but then decreases at higher Fe film thicknesses. While we do not have a complete explanation for this peculiar nonmonotonic trend with film thickness, a closer inspection of the XRD results (Fig. 1) provides useful insights. First, the Fe film diffraction peak shifts toward a higher 2 value with increasing film thickness. This signifies that thinner Fe films on Cu are strained (with the Fe crystal lattice tetragonally distorted), whereas thicker Fe films undergo structural relaxation such that the out-of-plane lattice parameter converges toward the bulk value of 2.86 Å, as summarized in Fig. 1(e). Second, as the Fe film thickness approaches 10 nm, additional diffraction peaks appear to the left of the tall primary peak. We speculate that these additional peaks may originate from Fe crystals that remain relatively strained (i.e., with an out-of-plane lattice parameter larger than the bulk value), while the primary peak arises from more relaxed Fe crystals (i.e., with a lattice parameter closer to the bulk value). The coexistence of such different Fe crystals appears to be consistent with the rocking curve measurements (Fig. 1(c)), which exhibit a large broad background peak in addition to a small sharp peak for Cu/Fe films with thicknesses near 10 nm. As we describe in Sec. IV, these 10 nm thick Cu/Fe samples also show distinct behaviors in extrinsic damping (highly nonlinear frequency dependence of the FMR linewidth) and static magnetization reversal (enhanced coercivity), which appear to be correlated with the peculiar microstructural properties evidenced by our XRD results. On the other hand, it is worth noting that the estimated crystal grain size (Fig. 1(f)) – derived from the width of the - diffraction peak – does not exhibit any anomaly near the film thickness of 10 nm, but rather increases monotonically with film thickness.
Unlike the Cu/Fe films discussed above, the Ag/Fe films do not show a strong (110) bcc peak in the - XRD results. However, the lack of pronounced peaks in the symmetric - scans does not necessarily signify that Ag/Fe is amorphous. This is because symmetric - XRD is sensitive to crystal planes that are nearly parallel to the sample surface, such that the diffraction peaks capture only the crystal planes with out-of-plane orientation with a rather small range of misalignment (within 1°, dictated by incident X-ray beam divergence). In fact, from asymmetric grazing-incidence XRD scans that are sensitive to other planes, we are able to observe a clear bcc Fe (110) diffraction peak even for Ag/Fe samples that lack an obvious diffraction peak in - scans (see e.g. inset of Fig. 1(b)). Furthermore, rocking curve scans (conducted with fixed to the expected position of the (110) Fe film diffraction peak) provide orientation information over an angular range much wider than 1°. As shown in Fig. 1(d), a clear rocking curve peak is observed for each Ag/Fe sample, suggesting that Fe films grown on Ag are polycrystalline and (110)-textured – albeit with the (110) crystal planes more misaligned from the sample surface compared to the Cu/Fe samples. The out-of-plane lattice parameters of Ag/Fe films (with discernible - diffraction film peaks) show the trend of relaxation towards the bulk value with increasing Fe thickness, similar to the Cu/Fe series. Yet, the lattice parameters for Ag/Fe at small thicknesses are systematically closer to the bulk value, possibly because Fe is less strained (i.e., better lattice matched) on Ag than on Cu. We also find that the estimation of the crystal grain size for Ag/Fe – although made difficult by the smallness of the diffraction peak – yields a trend comparable to Cu/Fe, as shown in Fig. 1(f).

We also observe a notable difference between Cu/Fe and Ag/Fe in the properties of film interfaces, as revealed by XRR scans in Fig. 2. The oscillation period depends inversely on the film thickness. The faster decay of the oscillatory reflectivity signal at high angles for the Ag/Fe films suggests that the Ag/Fe films may have rougher interfaces compared to the Cu/Fe films. Another interpretation of the XRR results is that the Ag/Fe interface is more diffuse than the Cu/Fe interface – i.e., due to interfacial intermixing of Ag and Fe. By fitting the XRR results Vignaud and Gibaud (2019), we estimate an average roughness (or the thickness of the diffuse interfacial layer) of 1 nm for the Fe layer in Cu/Fe, while it is much greater at 2-3 nm for Ag/Fe 222Here, the “average roughness” is the average of the roughness of the top and bottom interfaces of the Fe layer..
Our structural characterization described above thus reveals key attributes of the Cu/Fe and Ag/Fe sample series. Both film series are polycrystalline, exhibit (110) texture, and have grain sizes of order film thickness. Nevertheless, there are also crucial differences between Cu/Fe and Ag/Fe. The Cu/Fe series overall exhibits stronger - diffraction peaks than the Ag/Fe series, suggesting that the (110) bcc crystal planes of Fe grown on Cu are aligned within a tighter angular range than those grown on Ag. Moreover, Fe grown on Cu has relatively smooth or sharp interfaces compared to Fe grown on Ag. Although identifying the origin of such structural differences is beyond the scope of this work, Cu/Fe and Ag/Fe constitute two qualitatively distinct series of polycrystalline Fe films for exploring the influence of microstructure on magnetic relaxation.
III Intrinsic Gilbert Damping Probed by Out-of-plane FMR
Having established the difference in structural properties between Cu/Fe and Ag/Fe, we characterize room-temperature intrinsic damping for these samples with OOP FMR measurements. The OOP geometry suppresses two-magnon scattering McMichael and Krivosik (2004) such that the Gilbert damping parameter can be quantified in a straightforward manner. We use a W-band shorted waveguide in a superconducting magnet, which permits FMR measurements at high fields ( 4 T) that completely magnetize the Fe films out of plane. The details of the measurement method are found in Refs. Khodadadi et al. (2020); Smith et al. (2020). Figure 3(a) shows the frequency dependence of half-width-at-half-maximum (HWHM) linewidth for selected thicknesses from both sample series. The linewidth data of 25 nm thick epitaxial Fe film from a previous studyKhodadadi et al. (2020) is plotted in Fig. 3 (a) as well. The intrinsic damping parameter can be extracted from the linewidth plot using
| (1) |
where is the inhomogeneous broadening 333The magnitude of the inhomogenous broadening seen in OP FMR ranges from 10 to 50 Oe with no clear systematic dependence on Fe film thickness or seed layer material., is the gyromagnetic ratio ( 2.9 MHz/Oe [Ref. 444 2.9 MHz/Oe corresponds to a spectroscopic -factor of , in line with Ref. Schoen et al. (2017).], obtained from the frequency dependence of resonance field Smith et al. (2020)), and is the measured viscous damping parameter. In general, can include not only intrinsic Gilbert damping, parameterized by , but also eddy-current, radiative damping, and spin pumping contributionsSchoen et al. (2015), which all yield a linear frequency dependence of the linewidth. Damping due to eddy current is estimated to make up less than 10% of the total measured damping parameterSmith et al. (2020) and is ignored here. Since we used a shorted waveguide in our setup, the radiative damping does not apply here. Spin pumping is also negligible for most of the samples here because the materials in the seed and capping layers (i.e., Ti, Cu, and Ag) possess weak spin-orbit coupling and are hence poor spin sinks Edwards et al. (2019); Wang et al. (2014); Du et al. (2014). We therefore proceed by assuming that the measured OOP damping parameter is equivalent to the intrinsic Gilbert damping parameter.

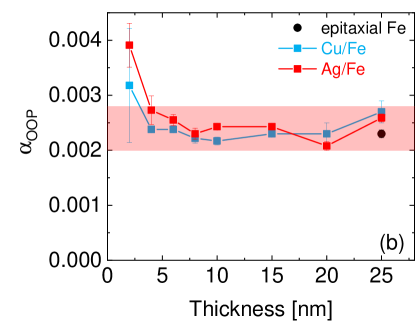
The extracted damping parameter is plotted as a function of Fe film thickness in Fig. 3(b). The room-temperature damping parameters of all Fe films with thicknesses of 4-25 nm fall in the range of 0.0024 0.0004, which is shaded in red in Fig. 3(b). This damping parameter range is quantitatively in line with the value reported for epitaxial Fe (black symbol in Fig. 3(b)) Khodadadi et al. (2020). For 2 nm thick samples, the damping parameter is larger likely due to an additional interfacial contribution Heinrich et al. (1987); Celinski and Heinrich (1991); Chen et al. (2018) – e.g., spin relaxation through interfacial Rashba spin-orbit coupling Chen and Shufeng (0157) that becomes evident only for ultrathin Fe. The results in Fig. 3(b) therefore indicate that the structural properties of the 4 nm thick polycrystalline bcc Fe films have little influence on their intrinsic damping.
It is remarkable that these polycrystalline Cu/Fe and Ag/Fe films – with different thicknesses and microstructural properties (as revealed in Sec. II) – exhibit essentially the same room-temperature intrinsic Gilbert damping parameter as single-crystalline bcc Fe. This finding is qualitatively distinct from a prior report Khodadadi et al. (2020) on intrinsic Gilbert damping in single-crystalline Fe films at cryogenic temperature, which is sensitive to microstructural disorder. In the following, we discuss the possible differences in the mechanisms of intrinsic damping between these temperature regimes.
Intrinsic Gilbert damping in ferromagnetic metals is predominantly governed by transitions of spin-polarized electrons between electronic states, within a given electronic band (intraband scattering) or in different electronic bands (interband scattering) near the Fermi level Gilmore et al. (2007). For Fe, previous studies Khodadadi et al. (2020); Gilmore et al. (2007); Gilmore (2007) indicate that intraband scattering tends to dominate at low temperature where the electronic scattering rate is low (e.g., 1013 s-1); by contrast, interband scattering likely dominates at room temperature where the electronic scattering rate is higher (e.g., 1014 s-1). According to our results (Fig. 3(b)), intrinsic damping at room temperature is evidently unaffected by the variation in the structural properties of the Fe films. Hence, the observed intrinsic damping is mostly governed by the electronic band structure within the Fe grains, such that disorder in grain boundaries or film interfaces has minimal impact.
The question remains as to why interband scattering at room temperature leads to Gilbert damping that is insensitive to microstructural disorder, in contrast to intraband scattering at low temperature yielding damping that is quite sensitive to microstructure Khodadadi et al. (2020). This distinction may be governed by what predominantly drives electronic scattering – specifically, defects (e.g., grain boundaries, rough or diffuse interfaces) at low temperature, as opposed to phonons at high temperature. That is, the dominance of phonon-driven scattering at room temperature may effectively diminish the roles of microstructural defects in Gilbert damping. Future experimental studies of temperature-dependent damping in polycrystalline Fe films may provide deeper insights. Regardless of the underlying mechanisms, the robust consistency of (Fig. 3(b)) could be an indication that the intrinsic Gilbert damping parameter at a sufficiently high temperature is a local property of the ferromagnetic metal, possibly averaged over the ferromagnetic exchange length of just a few nm Abo et al. (2013) that is comparable or smaller than the grain size. In this scenario, the impact on damping from grain boundaries would be limited in comparison to the contributions to damping within the grains.
Moreover, the misalignment of Fe grains evidently does not have much influence on the intrinsic damping. This is reasonable considering that intrinsic Gilbert damping is predicted to be nearly isotropic in Fe at sufficiently high electronic scattering rates Gilmore et al. (2010) – e.g., 1014 s-1 at room temperature where interband scattering is expected to be dominant Khodadadi et al. (2020); Gilmore et al. (2007); Gilmore (2007). It is also worth emphasizing that remains unchanged for Fe films of various thicknesses with different magnitudes of strain (tetragonal distortion, as evidenced by the variation in the out-of-plane lattice parameter in Fig. 1(e)). Strain in Fe grains is not expected to impact the intrinsic damping, as Ref. Khodadadi et al. (2020) suggests that strain in bcc Fe does not significantly alter the band structure near the Fermi level. Thus, polycrystalline Fe films exhibit essentially the same magnitude of room-temperature intrinsic Gilbert damping as epitaxial Fe, as long as the grains retain the bcc crystal structure.
The observed invariance of intrinsic damping here is quite different from the recent study of polycrystalline \ceCo_25Fe_75 alloy filmsEdwards et al. (2019), reporting a decrease in intrinsic damping with increasing structural disorder. This inverse correlation between intrinsic damping and disorder in Ref. Edwards et al. (2019) is attributed to the dominance of intraband scattering, which is inversely proportional to the electronic scattering rate. It remains an open challenge to understand why the room-temperature intrinsic Gilbert damping of some ferromagnetic metals might be more sensitive to structural disorder than others.
IV Extrinsic Magnetic Relaxation Probed by In-plane FMR
Although we have shown via OOP FMR in Sec. III that intrinsic Gilbert damping is essentially independent of the structural properties of the Fe films, it might be expected that microstructure has a pronounced impact on extrinsic magnetic relaxation driven by two-magnon scattering, which is generally present in IP FMR. IP magnetized films are more common in device applications than OOP magnetized films, since the shape anisotropy of thin films tends to keep the magnetization in the film plane. What governs the performance of such magnetic devices (e.g., quality factorHou and Liu (2019); Li et al. (2019)) may not be the intrinsic Gilbert damping parameter but the total FMR linewidth. Thus, for many magnetic device applications, it is essential to understand the contributions to the IP FMR linewidth.
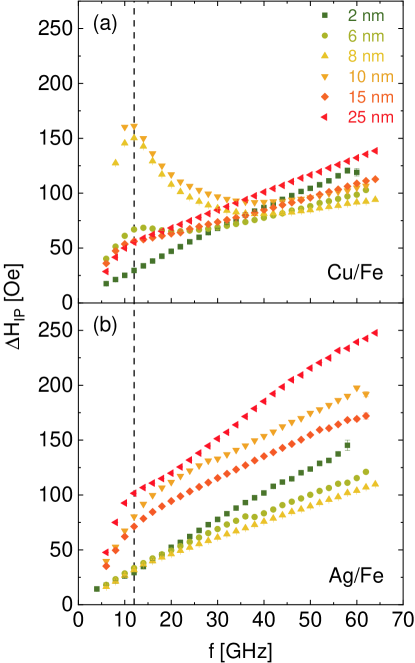
IP FMR measurements have been performed using a coplanar-waveguide-based spectrometer, as detailed in Refs. Khodadadi et al. (2020); Smith et al. (2020). Examples of the frequency dependence of IP FMR linewidth are shown in Fig. 4. In contrast to the linear frequency dependence that arises from intrinsic Gilbert damping in Fig. 3(a), a nonlinear hump is observed for most of the films in the vicinity of 12 GHz. In some films, e.g., 10 nm thick Cu/Fe film, the hump is so large that its peak even exceeds the linewidth at the highest measured frequency. Similar nonlinear IP FMR linewidth behavior has been observed in Fe alloy filmsKalarickal et al. (2008) and epitaxial Heusler filmsPeria et al. (2020) in previous studies, where two-magnon scattering has been identified as a significant contributor to the FMR linewidth. Therefore, in the following, we attribute the nonlinear behavior to two-magnon scattering.

To gain insight into the origin of two-magnon scattering, we plot the linewidth at 12 GHz – approximately where the hump is seen in Fig. 4 – against the Fe film thickness in Fig. 5(a). We do not observe a monotonic decay in the linewidth with increasing thickness that would result from two-magnon scattering of interfacial origin Azevedo et al. (2000). Rather, we observe a non-monotonic thickness dependence in Fig. 5(a), which indicates that the observed two-magnon scattering originates within the bulk of the films. We note that Ag/Fe with greater interfacial disorder (see Sec. II) exhibits weaker two-magnon scattering than Cu/Fe, particularly in the lower thickness regime (10 nm). This observation further corroborates that the two-magnon scattering here is not governed by the interfacial roughness of Fe films. The contrast between Cu/Fe and Ag/Fe also might appear counterintuitive, since two-magnon scattering is induced by defects and hence might be expected to be stronger for more “defective” films (i.e., Ag/Fe in this case). The counterintuitive nature of the two-magnon scattering here points to more subtle mechanisms at work.
To search for a possible correlation between static magnetic properties and two-magnon scattering, we have performed vibrating sample magnetometry (VSM) measurements with a Microsense EZ9 VSM. Coercivity extracted from VSM measurements is plotted as a function of film thickness in Fig. 5(b), which shows a remarkably close correspondence with linewidth vs thickness (Fig. 5(a)). In particular, a pronounced peak in coercivity is observed for Cu/Fe around 10 nm, corresponding to the same thickness regime where the 12 GHz FMR linewidth for Cu/Fe is maximized. Moreover, the 10 nm Cu/Fe sample (see Sec. II) exhibits a tall, narrow bcc (110) diffraction peak, which suggests that its peculiar microstructure plays a possible role in the large two-magnon scattering and coercivity (e.g., via stronger domain wall pinning).
While the trends shown in Fig. 5 provide some qualitative insights, we now attempt to quantitatively analyze the frequency dependence of FMR linewidth for the Cu/Fe and Ag/Fe films. We assume that the Gilbert damping parameter for IP FMR is equal to that for OOP FMR, i.e., . This assumption is physically reasonable, considering that Gilbert damping is theoretically expected to be isotropic in Fe films near room temperature Gilmore et al. (2010). While a recent study has reported anisotropic Gilbert damping that scales quadratically with magnetostriction Peria et al. (2021), this effect is likely negligible in elemental Fe whose magnetostriction is several times smaller Clark et al. (2003); Summers et al. (2007) than that of the Fe0.7Ga0.3 alloy in Ref. Peria et al. (2021).
Thus, from the measured IP linewidth , the extrinsic two-magnon scattering linewidth can be obtained by
| (2) |
where is the Gilbert damping contribution. Figure 6 shows the obtained and fit attempts using the “grain-to-grain” two-magnon scattering model developed by McMicheal and KrivosikMcMichael and Krivosik (2004). This model captures the inhomogeneity of the effective internal magnetic field in a film consisting of many magnetic grains. The magnetic inhomogeneity can arise from the distribution of magnetocrystalline anisotropy field directions associated with the randomly oriented crystal grains Kalarickal et al. (2008). In this model the two-magnon scattering linewidth is a function of the Gilbert damping parameter , the effective anisotropy field of the randomly oriented grain, and the correlation length within which the effective internal magnetic field is correlated. Further details for computing are provided in the Appendix and Refs. McMichael and Krivosik (2004); Kalarickal et al. (2008); Peria et al. (2020). As we have specified above, is set to the value derived from OOP FMR results (i.e., in Fig. 3(b)). This leaves and as the only free parameters in the fitting process.
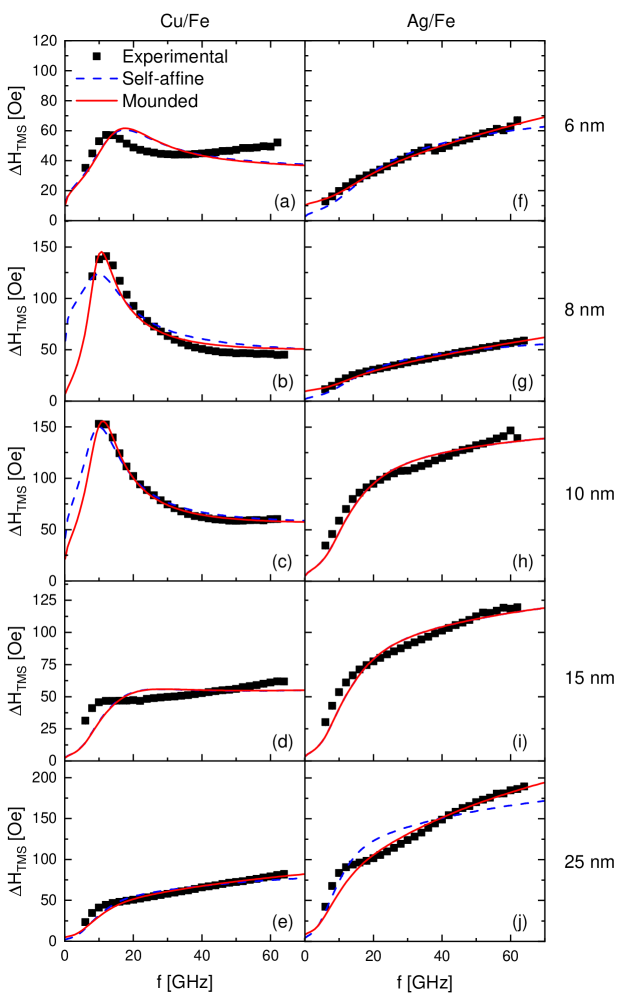
The modeling results are dependent on the choice of the correlation function , which captures how the effective internal magnetic field is correlated as a function of lateral distance in the film plane. We first show results obtained with a simple exponentially decaying correlation function, as done in prior studies of two-magnon scattering McMichael and Krivosik (2004); Kalarickal et al. (2008); Peria et al. (2020), i.e.,
| (3) |
Equation 3 has the same form as the simplest correlation function used to model rough topographical surfaces (when they are assumed to be “self-affine”) Pelliccione and Lu (2008). Fit results with Eq. (3) are shown in dashed blue curves in Fig. 6. For most samples, the fitted curve does not reproduce the experimental data quantitatively. Moreover, the fitted values of and often reach physically unrealistic values, e.g., with Oe and nm (see Table 1). These results suggest that the model does not properly capture the underlying physics of two-magnon scattering in our samples.
A possible cause for the failure to fit the data is that the simple correlation function (Eq. 3) is inadequate. We therefore consider an alternative correlation function by again invoking an analogy between the spatially varying height of a rough surface Pelliccione and Lu (2008) and the spatially varying effective internal magnetic field in a film. Specifically, we apply a correlation function (i.e., a special case of Eq. (4.3) in Ref. Pelliccione and Lu (2008) where short-range roughness ) for the so-called “mounded surface,” which incorporates the average distance between peaks in topographical height (or, analogously, effective internal magnetic field):
| (4) |
where and are the Bessel function of the first kind of order zero and the modified Bessel function of the second kind of order one, respectively. This oscillatory decaying function is chosen because its Fourier transform (see Appendix) does not contain any transcendental functions, which simplifies the numerical calculation. We also stress that while Eq. (4) in the original context (Ref. Pelliccione and Lu (2008)) was used to model topographical roughness, we are applying Eq. (4) in an attempt to model the spatial fluctuations (“roughness”) of the effective internal magnetic field – rather than the roughness of the film topography.
The fitted curves using the model with Eq. (4) are shown in solid red curves in Fig. 6. Fit results for some samples show visible improvement, although this is perhaps not surprising with the introduction of as an additional free parameter. Nevertheless, the fitted values of or still diverge to unrealistic values of Oe or nm in some cases (see Table 1), which means that the new correlation function (Eq. (4)) does not fully reflect the meaningful underlying physics of our samples either. More detailed characterization of the microstructure and inhomogeneities, e.g., via synchrotron x-ray and neutron scattering, could help determine the appropriate correlation function. It is also worth pointing out that for some samples (e.g. 15 nm Cu/Fe and Ag/Fe films), essentially identical fit curves are obtained regardless of the correlation function. This is because when , the Fourier transform of Eq. (4) has a very similar form as the Fourier transform of Eq. (3), as shown in the Appendix. In such cases, the choice of the correlation function has almost no influence on the behavior of the two-magnon scattering model in the fitting process.
| Self-affine | Mounded | |||||
| Sample Series | Thickness (nm) | (nm) | (Oe) | (nm) | (Oe) | (nm) |
| Cu/Fe | 6 | 70 10 | 170 10 | 80 90 | 24 3 | > |
| 8 | 200 100 | 150 20 | 700 1000 | 25 2 | 900 100 | |
| 10 | 140 40 | 200 20 | 160 50 | 33 1 | 800 200 | |
| 15 | 9 2 | 800 100 | 10 20 | 100 80 | > | |
| 25 | 0 5 | > | 60 30 | > | 10.41 0.01 | |
| Ag/Fe | 6 | 0 40 | > | 150 40 | > | 11.7 0.7 |
| 8 | 0 30 | > | 170 50 | > | 12 4 | |
| 10 | 6 1 | 1500 300 | 8 40 | 200 500 | > | |
| 15 | 2 2 | 4000 3000 | 3 9 | 500 900 | > | |
| 25 | 0 6 | > | 140 50 | > | 15 6 | |
V Summary
We have examined room-temperature intrinsic and extrinsic damping in two series of polycrystalline Fe thin films with distinct structural properties. Out-of-plane FMR measurements confirm constant intrinsic Gilbert damping of 0.0024, essentially independent of film thickness and structural properties. This finding implies that intrinsic damping in Fe at room temperature is predominantly governed by the crystalline and electronic band structures within the grains, rather than scattering at grain boundaries or film surfaces. The results from in-plane FMR, where extrinsic damping (i.e., two-magnon scattering) plays a significant role, are far more nuanced. The conventional grain-to-grain two-magnon scattering model fails to reproduce the in-plane FMR linewidth data with physically reasonable parameters – pointing to the need to modify the model, along with more detailed characterization of the film microstructure. Our experimental findings advance the understanding of intrinsic Gilbert damping in polycrystalline Fe, while motivating further studies to uncover the mechanisms of extrinsic damping in structurally disordered thin films.
Acknowledgments
S.W. acknowledges support by the ICTAS Junior Faculty Program. D.A.S. and S.E. acknowledge support by the National Science Foundation, Grant No. DMR-2003914. P. N. would like to acknowledge support through NASA Grant NASA CAN80NSSC18M0023. A. R. would like to acknowledge support through the Defense Advanced Research Project Agency (DARPA) program on Topological Excitations in Electronics (TEE) under Grant No. D18AP00011. This work was supported by NanoEarth, a member of National Nanotechnology Coordinated Infrastructure (NNCI), supported by NSF (ECCS 1542100).
Appendix A Details of the Two-Magnon Scattering Model
In the model developed by McMichael and Krivosik, the two-magnon scattering contribution to the FMR linewidth is given byMcMichael and Krivosik (2004); Kalarickal et al. (2008); Peria et al. (2020)
| (5) |
where is correlation length, is the effective anisotropy field of the randomly oriented grain. accounts for the conversion between the frequency and field swept linewidth. represents the averaging of the anisotropy axis fluctuations over the sample. It also takes into account the ellipticity of the precession for both the uniform FMR mode and the spin wave modeKalarickal et al. (2008). The detailed expression of can be found in the Appendix of Ref. Kalarickal et al. (2008). The coefficients in the expression of depend on the type of anisotropy of the system. Here, we used first-order cubic anisotropy for bcc Fe. selects all the degenerate modes, where represents the FMR mode frequency and represents the spin wave mode frequency. The detailed expression of can be found in Ref. McMichael and Krivosik (2004). In the ideal case where Gilbert damping is 0, is the Dirac delta function. For a finite damping, is replaced by a Lorentzian function , which is centered at and has the width of .
Finally, (or ) is the Fourier transform of the grain-to-grain internal field correlation function, Eq. (3) (or Eq. (4)). For the description of magnetic inhomogeneity analogous to the simple self-affine topographical surface Pelliccione and Lu (2008), the Fourier transform of the correlation function, Eq. (3), is
| (6) |
as also used in Refs. McMichael and Krivosik (2004); Kalarickal et al. (2008); Peria et al. (2020). For the description analogous to the mounded surface, the Fourier transform of the correlation function, Eq. (4), isPelliccione and Lu (2008)
| (7) |
When , Eq. (7) becomes
| (8) |
which has a similar form as Eq. (6). This similarity can also be demonstrated graphically. Figure 7 plots a self-affine curve (Eq. (6)) at nm and three mounded curves (Eq. (7)) at 10, 100, 1000 nm. in mounded curves is set as 100 nm as well. It is clearly shown in Fig. 7 that when nm, the peak appearing in and 100 nm mounded curves disappears and the curve shape of mounded resembles that of self-affine .

The hump feature in Fig. 4 is governed by both and (see Eq. 5). has the shape of in reciprocal space ( space), as shown in our videos in the Supplemental Material as well as Fig. 5(b) of Ref. Peria et al. (2020) and Fig 2 (b) of Ref. McMichael and Krivosik (2004). The size of the contour of the degenerated spin wave modes in space increases as the microwave frequency increases, which means the number of available degenerate spin wave modes increases as increases. As shown in Fig. 7, self-affine is nearly constant with the wavenumber until reaches . This suggests that the system becomes effectively more uniform (i.e. weaker inhomogeneous perturbation) when the length scale falls below the characteristic correlation length (i.e., ). Because inhomogeneities serve as the scattering centers of two-magnon scattering process, degenerate spin wave modes with are less likely to be scattered into.
Now we consider the dependence of the two-magnon scattering rate. When is small, the two-magnon scattering rate increases as increases because more degenerate spin wave modes become available as increases. When further increases, the wavenumber of some degenerate spin wave modes exceeds . This will decrease the overall two-magnon scattering rate because the degenerate spin wave modes with are less likely to be scattered into, as discussed above. Furthermore, the portion of degenerate spin wave modes with increases as continues to increase. When the impact of decreasing two-magnon scattering rate for degenerate spin wave modes with high surpasses the impact of increasing available degenerate spin wave modes, the overall two-magnon scattering rate will start to decrease as increases. Consequently, the nonlinear trend – i.e., a “hump” – in FMR linewidth vs appears in Fig. 4.
However, the scenario discussed above can only happen when is large enough, because the wavenumber of degenerate spin wave modes saturates (i.e., reaches a limit) as approaches infinity. If the limit value of is smaller than , the two-magnon scattering rate will increase monotonically as increases. In that case the hump feature will not appear. See our videos in the Supplemental Material that display the dependence of , , , , and for various values.
Previous discussions of the hump feature are all based on the self-affine correlation function (Eq. 3). The main difference between the mounded correlation function (Eq. 4) and the self-affine correlation function (Eq. 3) is that the mounded correlation function has a peak when is not much larger than as shown in Fig. 7. This means when the wavenumber of degenerate spin wave modes enters (leaves) the peak region, two-magnon scattering rate will increase (decrease) much faster compared to the self-affine correlation function. In other words, the mounded correlation function can generate a narrower hump compared to the self-affine correlation function in the two-magnon linewidth vs plot, which is shown in Fig. 6 (b, c).
References
- Diao et al. (2007) Z. Diao, Z. Li, S. Wang, Y. Ding, A. Panchula, E. Chen, L.-C. Wang, and Y. Huai, J. Phys. Condens. Matter 19, 165209 (2007).
- Zhu and Zhu (2007) X. Zhu and J.-G. Zhu, IEEE Transactions on Magnetics 43, 2349 (2007).
- Yu et al. (2014) H. Yu, O. d'Allivy Kelly, V. Cros, R. Bernard, P. Bortolotti, A. Anane, F. Brandl, R. Huber, I. Stasinopoulos, and D. Grundler, Sci. Rep. 4 (2014), 10.1038/srep06848.
- Rowlands et al. (2019) G. E. Rowlands, C. A. Ryan, L. Ye, L. Rehm, D. Pinna, A. D. Kent, and T. A. Ohki, Sci. Rep. 9 (2019), 10.1038/s41598-018-37204-3.
- Kanada et al. (2017) I. Kanada, A. Cruce, T. Mewes, S. Wu, C. Mewes, G. Mankey, and T. Suzuki, AIP Adv. 7, 056105 (2017).
- Parkin et al. (2004) S. S. P. Parkin, C. Kaiser, A. Panchula, P. M. Rice, B. Hughes, M. Samant, and S.-H. Yang, Nat. Mater. 3, 862 (2004).
- Ando et al. (2005) Y. Ando, T. Miyakoshi, M. Oogane, T. Miyazaki, H. Kubota, K. Ando, and S. Yuasa, Appl. Phys. Lett. 87, 142502 (2005).
- Gilbert (1955) T. L. Gilbert, Phys. Rev., 100, 1243 (1955).
- Gilbert (2004) T. Gilbert, IEEE Transactions on Magnetics 40, 3443 (2004).
- Heinrich et al. (1967) B. Heinrich, D. Fraitová, and V. Kamberský, Phys. Status Solidi B 23, 501 (1967).
- Kamberský (1976) V. Kamberský, Czech. J. Phys. 26, 1366 (1976).
- Tserkovnyak et al. (2004) Y. Tserkovnyak, G. A. Fiete, and B. I. Halperin, Appl. Phys. Lett. 84, 5234 (2004).
- Rossi et al. (2005) E. Rossi, O. G. Heinonen, and A. H. MacDonald, Phys. Rev. B 72, 174412 (2005).
- Schoen et al. (2016) M. A. W. Schoen, D. Thonig, M. L. Schneider, T. J. Silva, H. T. Nembach, O. Eriksson, O. Karis, and J. M. Shaw, Nat. Phys. 12, 839 (2016).
- Gilmore et al. (2007) K. Gilmore, Y. U. Idzerda, and M. D. Stiles, Phys. Rev. Lett. 99, 027204 (2007).
- Mankovsky et al. (2013) S. Mankovsky, D. Ködderitzsch, G. Woltersdorf, and H. Ebert, Phys. Rev. B 87, 014430 (2013).
- Note (1) Eddy-current damping Scheck et al. (2006) and radiative damping Schoen et al. (2015) can also contribute to viscous damping, but they typically constitute a small correction that is 10% of intrinsic Gilbert damping in ferromagnetic thin films (i.e., 20 nm thick) for nanomagnetic devices Khodadadi et al. (2020); Smith et al. (2020), which are thought to be rooted in the electronic band structure of the ferromagnetic metal Schoen et al. (2016); Gilmore et al. (2007); Mankovsky et al. (2013).
- Khodadadi et al. (2020) B. Khodadadi, A. Rai, A. Sapkota, A. Srivastava, B. Nepal, Y. Lim, D. A. Smith, C. Mewes, S. Budhathoki, A. Hauser, M. Gao, J.-F. Li, D. Viehland, Z. Jiang, J. Heremans, P. Balachandran, T. Mewes, and S. Emori, Phys. Rev. Lett. 124, 157201 (2020).
- Geschwind and Clogston (1957) S. Geschwind and A. M. Clogston, Phys. Rev. 108, 49 (1957).
- LeCraw et al. (1958) R. C. LeCraw, E. G. Spencer, and C. S. Porter, Phys. Rev. 110, 1311 (1958).
- Schlömann (1958) E. Schlömann, J. Phys. Chem. Solids 6, 257 (1958).
- Patton et al. (1967) C. E. Patton, C. H. Wilts, and F. B. Humphrey, J. Appl. Phys. 38, 1358 (1967).
- Arias and Mills (1999) R. Arias and D. L. Mills, Phys. Rev. B 60, 7395 (1999).
- Arias and Mills (2000) R. Arias and D. L. Mills, J. Appl. Phys. 87, 5455 (2000).
- McMichael and Krivosik (2004) R. McMichael and P. Krivosik, IEEE Transactions on Magnetics 40, 2 (2004).
- Woltersdorf and Heinrich (2004) G. Woltersdorf and B. Heinrich, Phys. Rev. B 69, 184417 (2004).
- Mo et al. (2005) N. Mo, Y.-Y. Song, and C. E. Patton, J. Appl. Phys. 97, 093901 (2005).
- Kalarickal et al. (2009) S. S. Kalarickal, N. Mo, P. Krivosik, and C. E. Patton, Phys. Rev. B 79, 094427 (2009).
- Lindner et al. (2009) J. Lindner, I. Barsukov, C. Raeder, C. Hassel, O. Posth, R. Meckenstock, P. Landeros, and D. L. Mills, Phys. Rev. B 80, 224421 (2009).
- Jiang et al. (2017) S. Jiang, L. Sun, Y. Yin, Y. Fu, C. Luo, Y. Zhai, and H. Zhai, AIP Adv. 7, 056029 (2017).
- Edwards et al. (2019) E. R. Edwards, H. T. Nembach, and J. M. Shaw, Phys. Rev. Appl 11, 054036 (2019).
- Ghosh et al. (2012) A. Ghosh, S. Auffret, U. Ebels, and W. E. Bailey, Phys. Rev. Lett. 109, 127202 (2012).
- Schoen et al. (2017) M. A. W. Schoen, J. Lucassen, H. T. Nembach, T. J. Silva, B. Koopmans, C. H. Back, and J. M. Shaw, Phys. Rev. B 95, 134410 (2017).
- Bürgler et al. (1997) D. E. Bürgler, C. M. Schmidt, D. M. Schaller, F. Meisinger, R. Hofer, and H.-J. Güntherodt, Phys. Rev. B 56, 4149 (1997).
- Vignaud and Gibaud (2019) G. Vignaud and A. Gibaud, J. Appl. Crystallogr. 52, 201 (2019).
- Note (2) Here, the “average roughness” is the average of the roughness of the top and bottom interfaces of the Fe layer.
- Smith et al. (2020) D. A. Smith, A. Rai, Y. Lim, T. Q. Hartnett, A. Sapkota, A. Srivastava, C. Mewes, Z. Jiang, M. Clavel, M. K. Hudait, D. D. Viehland, J. J. Heremans, P. V. Balachandran, T. Mewes, and S. Emori, Phys. Rev. Appl 14, 034042 (2020).
- Note (3) The magnitude of the inhomogenous broadening seen in OP FMR ranges from 10 to 50 Oe with no clear systematic dependence on Fe film thickness or seed layer material.
- Note (4) 2.9 MHz/Oe corresponds to a spectroscopic -factor of , in line with Ref. Schoen et al. (2017).
- Schoen et al. (2015) M. A. W. Schoen, J. M. Shaw, H. T. Nembach, M. Weiler, and T. J. Silva, Phys. Rev. B 92, 184417 (2015).
- Wang et al. (2014) H. Wang, C. Du, Y. Pu, R. Adur, P. Hammel, and F. Yang, Physical Review Letters 112, 197201 (2014).
- Du et al. (2014) C. Du, H. Wang, F. Yang, and P. C. Hammel, Physical Review B 90, 140407 (2014).
- Heinrich et al. (1987) B. Heinrich, K. B. Urquhart, A. S. Arrott, J. F. Cochran, K. Myrtle, and S. T. Purcell, Phys. Rev. Lett. 59, 1756 (1987).
- Celinski and Heinrich (1991) Z. Celinski and B. Heinrich, J. Appl. Phys. 70, 5935 (1991).
- Chen et al. (2018) L. Chen, S. Mankovsky, S. Wimmer, M. A. W. Schoen, H. S. Korner, M. Kronseder, D. Schuh, D. Bougeard, H. Ebert, D. Weiss, and C. H. Back, Nature Phys. 14, 490–494 (2018).
- Chen and Shufeng (0157) K. Chen and Z. Shufeng, Phys. Rev. LettIEEE Trans. Magn. 11453, 126602 (20157).
- Gilmore (2007) K. Gilmore, Precession damping in itinerant ferromagnets, Ph.D. thesis, Montana State University-Bozeman, College of Letters & Science (2007).
- Abo et al. (2013) G. S. Abo, Y.-K. Hong, J. Park, J. Lee, W. Lee, and B.-C. Choi, IEEE Transactions on Magnetics 49, 4937 (2013).
- Gilmore et al. (2010) K. Gilmore, M. D. Stiles, J. Seib, D. Steiauf, and M. Fähnle, Phys. Rev. B 81, 174414 (2010).
- Hou and Liu (2019) J. T. Hou and L. Liu, Phys. Rev. Lett. 123, 107702 (2019).
- Li et al. (2019) Y. Li, T. Polakovic, Y.-L. Wang, J. Xu, S. Lendinez, Z. Zhang, J. Ding, T. Khaire, H. Saglam, R. Divan, J. Pearson, W.-K. Kwok, Z. Xiao, V. Novosad, A. Hoffmann, and W. Zhang, Phys. Rev. Lett. 123, 107701 (2019).
- Kalarickal et al. (2008) S. S. Kalarickal, P. Krivosik, J. Das, K. S. Kim, and C. E. Patton, Phys. Rev. B 77, 054427 (2008).
- Peria et al. (2020) W. K. Peria, T. A. Peterson, A. P. McFadden, T. Qu, C. Liu, C. J. Palmstrøm, and P. A. Crowell, Phys. Rev. B 101, 134430 (2020).
- Azevedo et al. (2000) A. Azevedo, A. B. Oliveira, F. M. de Aguiar, and S. M. Rezende, Phys. Rev. B 62, 5331 (2000).
- Peria et al. (2021) W. K. Peria, X. Wang, H. Yu, S. Lee, I. Takeuchi, and P. A. Crowell, Phys. Rev. B 103, L220403 (2021).
- Clark et al. (2003) A. E. Clark, K. B. Hathaway, M. Wun-Fogle, J. B. Restorff, T. A. Lograsso, V. M. Keppens, G. Petculescu, and R. A. Taylor, J. Appl. Phys. 93, 8621 (2003).
- Summers et al. (2007) E. M. Summers, T. A. Lograsso, and M. Wun-Fogle, J Mater Sci 42, 9582 (2007).
- Pelliccione and Lu (2008) M. Pelliccione and T.-M. Lu, in Springer Series in Materials Science, Vol. 108 (Springer, 2008).
- Scheck et al. (2006) C. Scheck, L. Cheng, and W. E. Bailey, Appl. Phys. Lett. 88, 252510 (2006).