The impact of realistic red supergiant mass-loss on stellar evolution
Abstract
Accurate mass-loss rates are essential for meaningful stellar evolutionary models. For massive single stars with initial masses between 8 - 30⊙the implementation of cool supergiant mass loss in stellar models strongly affects the resulting evolution, and the most commonly used prescription for these cool-star phases is that of de Jager. Recently, we published a new prescription calibrated to RSGs with initial masses between 10 - 25⊙, which unlike previous prescriptions does not over estimate for the most massive stars. Here, we carry out a comparative study to the MESA-MIST models, in which we test the effect of altering mass-loss by recomputing the evolution of stars with masses 12-27⊙ with the new -prescription implemented. We show that while the evolutionary tracks in the HR diagram of the stars do not change appreciably, the mass of the H-rich envelope at core-collapse is drastically increased compared to models using the de Jager prescription. This increased envelope mass would have a strong impact on the Type II-P SN lightcurve, and would not allow stars under 30⊙ to evolve back to the blue and explode as H-poor SN. We also predict that the amount of H-envelope around single stars at explosion should be correlated with initial mass, and we discuss the prospects of using this as a method of determining progenitor masses from supernova light curves.
1 Introduction
The mass-loss rates () of massive single stars above 8⊙ have long been considered a fundamental influence in stellar evolution, with the potential to change the end fate of a star by peeling away the hydrogen envelope111Due to the high fraction of interacting binaries among massive stars (Gies, 1987; Kobulnicky & Fryer, 2007; Sana et al., 2012; Kiminki & Kobulnicky, 2012), stripping of the H envelope to produce Type Ibc and Type IIb SNe is most often accomplished by binary Roche-lobe overflow (RLOF, Claeys et al., 2011; Götberg et al., 2018; Sana et al., 2012; Smith et al., 2011; Smith, 2014). In this paper, however, we focus on single-star models where the mass loss is dominated by winds. (see reviews by Chiosi & Maeder, 1986; Heger et al., 2003; Langer, 2012; Smith, 2014; Meynet & Maeder, 2003). Stellar evolutionary models incorporate mass-loss by utilizing empirical and analytical -prescriptions, and ultimately make predictions about which initial masses of stars are expected to end their lives as certain flavours of supernovae (SNe). Importantly, the usefulness of these predictions depends on how accurately the input physics reflects observations of real stars.
For massive stars with initial masses 30⊙, winds during the main sequence (MS) are minimal (removing only 0.8M⊙), so the only opportunity to significantly impact onward evolution via mass-loss is during the cool supergiant phases ( 10,000K). At present, there is no first-principles model for cool supergiant mass-loss in this region of the Hertzsprung-Russel diagram (although considerable progress is being made, see e.g. Kee et al., 2021). Evolutionary models such as Geneva (Meynet & Maeder, 2000; Ekström et al., 2012) and BPASS (Eldridge & Stanway, 2009) have therefore been forced to choose from a number of empirical prescriptions (e.g. Nieuwenhuijzen & de Jager, 1990; van Loon et al., 2005; Kudritzki & Reimers, 1978; Reimers, 1975; Goldman et al., 2017; de Jager et al., 1988), with s spanning up to an order of magnitude for a given luminosity (see Fig. 1 within Mauron & Josselin, 2011). The most commonly used prescription is that of de Jager et al. (1988), but this prescription contains large amounts of internal scatter (Mauron & Josselin, 2011) and has recently been shown to vastly overestimate the total amount of mass lost post-MS for the highest mass objects (Beasor et al., 2020). Further, the de Jager et al. prescription contains and bol measurements for only a handful of 15 RSGs. The sample itself is heterogeneous in terms of both mass and metallicity, as well as the method used to determine , and relies on highly uncertain distances, corresponding to a large source of error in the luminosities. Beasor & Davies (2016) suggested the scatter in these relations is due to a lack of constraint on the initial masses of the stars used to derive the -bol relation222Evolutionary tracks for different masses can overlap in the RSG phase. For the same and , a more massive star may have a lower due to a higher surface gravity, for example.. When measuring -bol relations for RSGs in clusters, where the RSGs can be assumed to be the same age, metalliciy and initial mass, the dispersion on the relation is greatly reduced (Beasor & Davies, 2016, 2018). Recently, we have combined the -bol relations for RSGs in 4 Galactic and LMC clusters of different ages, and derived a new initial mass-dependent -prescription (Beasor et al., 2020). This -prescription is calibrated to RSGs with initial masses between 10 - 25⊙, covering the observed mass range for Type II-P SN progenitors. 333The upper end of this mass limit is particularly important (where the de Jager -prescription more drastically over-predicts mass-loss, see Beasor et al., 2020) since the upper mass cut-off for Type II-P SN production is debated. Observational studies have suggested that the maximum RSG progenitor mass is 17⊙(Smartt et al., 2009; Smartt, 2015), though the statistical significance of this result may be low (see e.g. Davies & Beasor, 2018, 2020a; Kochanek, 2020; Davies & Beasor, 2020b).
Once a prescription has been selected, further complication can arise in the way in which it is implemented in evolutionary models. For example, the most recent Geneva models (Ekström et al., 2012) utilise a combination of both de Jager et al. (1988) and van Loon et al. (2005), both of which been shown to overestimate RSG mass loss (Beasor et al., 2020). The van Loon et al. (2005) prescription is calibrated using stars with extreme mass loss (10-4⊙yr-1) that are very rarely seen in unbiased RSG samples, and this prescription therefore is likely not applicable for normal RSG evolution (Beasor & Davies, 2016, 2018; Beasor et al., 2020, Beasor & Smith in prep). Ekström et al. also take the additional step of increasing by a factor of 3 when the luminosity of a star exceeds the Eddington luminosity. While this strategy has been duplicated in other studies (e.g. Dorn-Wallenstein et al., 2020) there is no observationally motivated reason for this increase in during the RSG phase (e.g. Beasor et al., 2020). The result of artificially enhancing the RSG mass-loss rates in this way is to force single stars with masses 20⊙ back to the blue, where they die as H-poor SNe (e.g. Ekström et al., 2012).
Recently, Beasor et al. (2020, hereafter B20) derived a new -prescription for RSGs, calibrated to objects with initial masses between 10 - 25⊙. This prescription benefits from a number of improvements upon the dJ88 prescription. Firstly, B20 measured the mid-IR excess444The warm dust that contributes to the mid-IR excess is sensitive to the last 100s of years of mass-loss, and so is not an instantaneous measurement. of RSGs in clusters rather than relying on field stars, providing a sample that is unbiased towards high objects. Secondly, accurate luminosities allow stringent constraints to be placed on both the age of the cluster and therefore the initial masses of the stars (see Beasor et al., 2019). Further, this new prescription is calibrated from a larger sample of RSGs. In total, Beasor et al. (2020) measured and bol for 34 RSGs in 4 different clusters (2 Galactic, 2 LMC), whereas the dJ88 prescription is calibrated using only 15. Finally, whereas previous studies relied on field stars with uncertain distances, Beasor et al. (2020) use only RSGs in clusters for which distance is more accurately known. For two of the three Galactic clusters, new Gaia (Gaia Collaboration et al., 2018) measurements are available, leading to more precise bol measurements (Davies & Beasor, 2019).
In this current paper, we investigate the effect of implementing the new -prescription from Beasor et al. (2020) for the cool supergiant (CSG) phase, using the Modules for Experiments in Stellar Astrophysics (MESA) stellar evolution code (Paxton et al., 2010, 2013, 2015), and from this we make predictions about the progenitors of Type II SN. The paper will be organised as follows: in Section 2 we describe the model grid incorporating the new -prescription, in Section 3 we briefly describe our results and in Section 4 we discuss the implications of our finding on massive star evolution and SN characterisation.
2 Method
2.1 The model grid
We compute a new grid of stellar models using MESA (Paxton et al., 2010, 2013, 2015). For the input physics, we utilise the inlists for the MIST models from Choi et al. (2016) using MESA vr7503, therefore our work can be considered a comparative study with that of Choi et al. In this work, we consider only the effect of changing mass-loss during the CSG phase, defined as where 10,000K (see below for full description), all other parameters remain identical to that of the MIST models. As the B20 -prescription is calibrated using clusters where is between 10-25⊙, we compute models for stars with initial masses 12, 15, 18, 21 and 24⊙. This also covers the observationally inferred mass range for Type II-P SN progenitors (e.g. Maund et al., 2004; Fraser et al., 2011; Smartt, 2015).
In the MIST models, the mass-loss rates for high mass stars (defined as objects with 10⊙) are implemented using a combination of wind mass-loss prescriptions named Dutch. This combination includes prescriptions for hot phases (Vink et al., 2000, 2001), cool phases (de Jager et al., 1988, hereafter dJ88) and another for Wolf-Rayet phases (Nugis & Lamers, 2000). When stars reach 10,000K, the Dutch recipe switches on the cool phase , for which the empirically derived prescription of de Jager et al. (1988) is utilised,
| (1) |
Below, we discuss the new -prescription from Beasor et al. (2020).
2.2 The updated -prescription
Beasor et al. (2020) derived an -prescription that is dependent on the initial mass of the object as well as luminosity, given by,
| (2) | |||||
where , and . Importantly, Beasor et al. (2020) demonstrated that prescriptions that are based on field stars, e.g. dJ88, vastly over predict the mass-loss particularly for the highest luminosity objects, i.e. the highest initial mass stars. For example, the dJ88 prescription overpredicts the mass-loss of 25⊙ RSGs by a factor of 40 (see Fig. 4 within Beasor et al., 2020)555Though not explored here, it is important to note that mass-loss rates during the hot phases are also thought to be lower than previously derived prescriptions suggest, see Sundqvist et al. (2019).
We now take the B20 prescription and investigate the effect of lower across the CSG phase on the final fate of massive stars. We compute the models using the same inlists as for the MESA MIST models (Choi et al., 2016) until the cool supergiant phase, where the Dutch prescription kicks in. At this point, we switch the mass-loss to the prescription presented in B20, Eqn 2.
3 Results and discussion
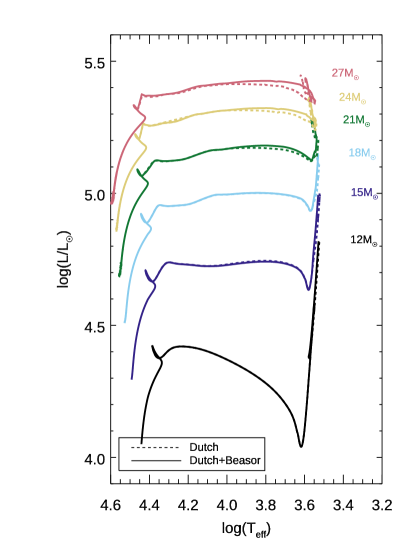
In Fig. 1 we show the HRDs for each set of models; those with standard MIST parameters, i.e. utilising the Dutch recipe only (dashed tracks); and those where the cool phase uses the B20 prescription (solid tracks). The -prescriptions switch from the hot star regime to the cool star regime at 10,000K (log = 4.0). As can be seen, the effects of switching the mass-loss recipes has a minimal effect on the location of tracks in the HRD, indeed there are only slight temperature changes for the higher mass stars. Renzo et al. (2017) and Sukhbold et al. (2018) also showed that even dramatic downward revisions in CSG mass-loss have minimal effect on the HRD and the final luminosity of RSGs. In the mass range 12-27⊙, there is no noticeable difference between the end point for RSGs between the models employing only the Dutch prescription (dashed lines), and the new models utilising a combination of Dutch and B20 (solid lines). We also do not see any significant difference in the luminosity time evolution of the two model grids.
Though the final temperatures and luminosities of the stars do not change significantly when the new law is implemented, the terminal envelope mass is substantially altered. The amount of H-envelope at the end of a star’s life is an important parameter in determining the rates of various flavours of SNe. For example, should a star retain a large amount of H-envelope (mass) it will appear as a H-rich Type II supernovae, likely a Type II-P. On the other hand, if a star sheds nearly all of its H envelope, it may appear as a Type IIb and the progenitor may appear as a yellow or blue supergiant instead of a RSG. In Fig. 2 we show the mass of H-envelope remaining at core carbon burning for the standard implementation (dJ88) and for the new B20 prescription. While the evolutionary paths of the RSGs do not change (i.e. in both model grids the stars would all explode in the RSG phase) the amount of H-envelope remaining changes drastically.
3.1 Low mass-loss rates prevent RSGs returning to the blue
How much hydrogen a star loses during the CSG phases is thought to be a primary driver in the evolution of single stars below 40⊙ to WRs. For example, in the Geneva models (Ekström et al., 2012) a star with an initial mass of 20⊙ loses a large enough fraction of its envelope through quiescent mass-loss that the star is forced to evolve back to the blue side of the HR diagram (see earlier discussion). This has been suggested as a single star evolutionary pathway for producing WR stars, and even low-luminosity LBVs in a post-RSG phase (e.g. Groh et al., 2013).
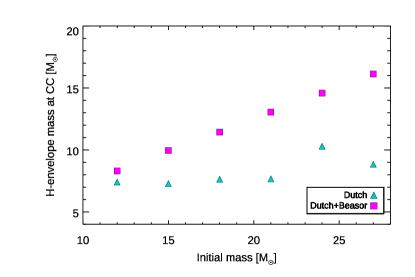
Here, we focus only on the MIST models. In Fig. 2 we show the amount of H-envelope left shortly before core-collapse (in this case, at the end of core-carbon burning) for both the Dutch prescription models and for models incorporating the B20 prescription. Though the MIST models do not artificially enhance the in the same way as the Ekström et al. (2012) models, the figure clearly demonstrates that the amount of H-envelope left at core-collapse is significantly higher when using the lower s across all initial masses included here. The discrepancy between the two model sets is most apparent for the highest mass objects, i.e. the stars that are missing from progenitor studies, and whose fate is the most debated (see e.g. Smartt et al., 2009; Davies & Beasor, 2018, 2020a; Kochanek, 2020; Davies & Beasor, 2020b). When incorporating either the B20 prescription or the unaltered dJ88 prescription, the resulting evolutionary calculations show that these high mass objects would not lose enough mass through quiescent winds to evolve to the blue of the HR diagram, and hence would likely die as H-rich RSGs, in contrast to the predictions of Ekström et al. (2012).
Here, our evolutionary calculations predict a large H-envelope mass remaining prior to core-collapse, in contrast with previous models. If correct, it means that steady wind mass loss is not a viable way to make stripped envelope SNe (Types Ibc and IIb) from single stars, and the evolution of stars between 20-30⊙ to stripped SNe cannot explain the apparent lack of high mass Type IIP SN progenitors.
Note, however, that the B20 prescription used here does not account for any possible late-phase pre-SN mass loss in the final 104 years before core-collapse. If such high mass-loss phase were to operate, it is unlikely that the resulting SN would be a SNe Ibc or IIb. Shedding many solar masses of material within such a short timeframe would likely lead to strong CSM interaction, creating a Type IIn event (e.g. Smith et al., 2009). While there is ample evidence for strong pre-SN episodic mass loss from SNe IIn (for a review, see Smith, 2014), there is currently no prescription for including that mass loss in evolutionary models.
3.2 Correlation of H-envelope with initial mass
An interesting outcome of this work is the near-linear correlation at solar metallicity of initial mass with H-envelope mass at core collapse, see Fig. 2. This is the first time such a correlation has been predicted. In the MIST models (which use the dJ88 prescription), the envelope mass at core-collapse appears to plateau, with the H-envelope mass peaking at 10⊙ for the 24⊙ model, before declining again for the 27⊙ model (where the dJ88 prescription most severely overestimates , see Beasor et al., 2020). However, when using the B20 prescription, we do not see this leveling off of envelope mass at higher initial masses. Instead, we find a direct correlation between initial mass and envelope mass (though the exact slope may be sensitive to details of stellar evolution that determine the core mass as a function of total mass).
This raises the question of whether measuring the mass of the envelope at SN could provide another constraint on the initial mass of the progenitor666The mass of the core may be necessary to determine an initial mass. The core mass can be estimated from the pre-SN luminosity of a star, see relations within Farrell et al. (2020) and Zapartas et al. (2021). If envelope mass is correlated with initial mass, there may be a signature of this in the SN light curve. Many groups use hydrodynamical modelling of SN light curves to determine initial masses of SN progenitors (e.g. Morozova et al., 2017; Dessart et al., 2017; Eldridge et al., 2018; Utrobin et al., 2017), however none of these studies have allowed the envelope mass to be a free parameter777Some semi-analytic studies have been completed to study the effect of varying parameters on the SN lightcurve, see e.g. Nagy et al. (2014)..
Hydrodynamical modelling of SN light curves requires input initial conditions, usually taken from the end points of stellar evolution models 888though it is also possible to avoid using stellar models and rely on initial conditons, see (e.g. Bersten et al., 2011). While the precise initial model varies from group to group, in all cases, the progenitor models used as the starting point have all been evolved using the dJ88 prescription during the CSG phases. Dessart & Hillier (2019) take progenitor models from MESA (Paxton et al., 2010, 2013, 2015) at initial masses of 12, 15, 20 and 25⊙, including the standard Dutch prescription for CSG mass-loss. The authors find that all models reach the end of the RSG phase with roughly the same envelope mass, 8–9⊙. This means that when these progenitor models are exploded and the resulting light-curve calculated, envelope mass is essentially fixed at 10⊙ regardless of initial stellar mass. This raises the question of whether measuring the mass of the envelope at SN could provide another constraint on the initial mass of the progenitor.
A high envelope mass at core-collapse may not be in conflict with observations of SN. In SNe II-P, the length of the plateau is controlled by recombination, and hence there may be degeneracy between envelope mass and 56Ni mass. A higher envelope mass with a lower 56Ni mass may show the same plateau length as a lower envelope mass with a higher 56Ni mass999For example, SN 2009ib had a particularly long plateau phase (130 days), which may be indicative of a higher envelope mass. We will explore this degeneracy further in future work.
3.2.1 Impacts of a high H-envelope mass on pulsational instability
Retaining a high envelope mass may also prevent an RSG from experiencing possible late-phase pulsational instability. RSGs are known to be pulsationally unstable (e.g. Heger et al., 1997), and it has been suggested that strong winds may lead to a “superwind” phase, capable of significantly stripping the H-envelope prior to SN. While these superwinds have not been observed, Yoon & Cantiello (2010) investigated the potential impact of a pulsationally driven superwind (PDSW) phase on the appearance of SN progenitors. In this work, the authors found the PDSW kicks in when the / ratio reaches a critically high value, i.e. when the mass of the star is low. For this to be possible a star would have to lose a significant fraction of its mass prior to a PDSW phase. While Yoon & Cantiello (2010) predicted the PDSW phase would be achieved by RSGs where 17⊙, they adopted the dJ88 prescription in their stellar models, which (as shown here) overestimates RSG mass-loss. The lower and higher remaining H envelope mass may push the instability threshold to a higher mass, or even prevent high mass RSGs from reaching the critical L/M ratio necessary to drive a PDSW phase.
If some other mechanism (i.e. wave driving or other energy deposition in late nuclear burning phases; Quataert & Shiode, 2012; Fuller, 2017; Smith & Arnett, 2014) can trigger instability and episodic mass loss, then there are important implications. Namely, if lower s for steady winds throughout the RSG phase leave a progenitor with higher H envelope mass, then there is potentially more envelope mass to lose in the final years of the star’s life. This may give rise to more massive CSM shells immediately surrounding the star at the time of core collapse, and hence, more luminous SNe IIn from RSGs because they can experience stronger CSM interaction.
3.3 Metallicity
In this work we have only explored the implications of a reduced on Solar metallicity () models. We note that observational studies of RSG mass-loss suggest is only weakly dependent on Z (Goldman et al., 2017; Beasor et al., 2020). In addition, at lower metallicities (e.g. LMC and SMC) mass-loss rates are weaker than at Solar , and therefore would have an even smaller impact on the evolution of an RSG than the Solar models presented here (e.g. Mauron & Josselin, 2011).
4 Conclusions
In this work, we have explored the impact of incorporating the Beasor et al. (2020) RSG mass-loss rates into stellar evolution calculations. Our main findings are as follows:
-
1.
We confirm the results of previous studies, that even vastly reducing mass-loss during the CSG phases has a minimal effect on the final position of the star on the HRD, and the - relation remains unchanged.
-
2.
The amount of H-envelope lost due to cool supergiant mass-loss is not enough to cause a star to evolve back to the blue, effectively ruling out the single star pathway for the production of WRs and stripped-envelope SNe at masses below 27⊙.
-
3.
We find a clear correlation of initial mass with envelope mass at core-collapse for single RSGs. We discuss several implications of the higher H envelope mass for SNe and SN progenitors.
References
- Beasor & Davies (2016) Beasor, E. R., & Davies, B. 2016, Monthly Notices of the Royal Astronomical Society, 463, 1269
- Beasor & Davies (2018) —. 2018, Monthly Notices of the Royal Astronomical Society, 475, 55
- Beasor et al. (2019) Beasor, E. R., Davies, B., Smith, N., & Bastian, N. 2019, MNRAS, 486, 266, doi: 10.1093/mnras/stz732
- Beasor et al. (2020) Beasor, E. R., Davies, B., Smith, N., et al. 2020, MNRAS, 492, 5994
- Bersten et al. (2011) Bersten, M. C., Benvenuto, O., & Hamuy, M. 2011, ApJ, 729, 61, doi: 10.1088/0004-637X/729/1/61
- Chiosi & Maeder (1986) Chiosi, C., & Maeder, A. 1986, Annual Review of Astronomy and Astrophysics, 24, 329
- Choi et al. (2016) Choi, J., Dotter, A., Conroy, C., et al. 2016, ApJ, 823, 102, doi: 10.3847/0004-637X/823/2/102
- Claeys et al. (2011) Claeys, J. S. W., de Mink, S. E., Pols, O. R., Eldridge, J. J., & Baes, M. 2011, A&A, 528, A131, doi: 10.1051/0004-6361/201015410
- Davies & Beasor (2019) Davies, B., & Beasor, E. 2019, arXiv e-prints. https://arxiv.org/abs/1903.12506
- Davies & Beasor (2018) Davies, B., & Beasor, E. R. 2018, Monthly Notices of the Royal Astronomical Society, 474, 2116
- Davies & Beasor (2020a) Davies, B., & Beasor, E. R. 2020a, MNRAS, 493, 468, doi: 10.1093/mnras/staa174
- Davies & Beasor (2020b) —. 2020b, MNRAS, 496, L142, doi: 10.1093/mnrasl/slaa102
- de Jager et al. (1988) de Jager, C., Nieuwenhuijzen, H., & Van Der Hucht, K. 1988, Astronomy and Astrophysics Supplement Series, 72, 259
- Dessart & Hillier (2019) Dessart, L., & Hillier, D. J. 2019, A&A, 625, A9, doi: 10.1051/0004-6361/201834732
- Dessart et al. (2017) Dessart, L., John Hillier, D., & Audit, E. 2017, A&A, 605, A83, doi: 10.1051/0004-6361/201730942
- Dorn-Wallenstein et al. (2020) Dorn-Wallenstein, T. Z., Levesque, E. M., Neugent, K. F., et al. 2020, ApJ, 902, 24, doi: 10.3847/1538-4357/abb318
- Ekström et al. (2012) Ekström, S., Georgy, C., Eggenberger, P., et al. 2012, Astronomy & Astrophysics, 537, A146
- Eldridge & Stanway (2009) Eldridge, J. J., & Stanway, E. R. 2009, Monthly Notices of the Royal Astronomical Society, 400, 1019
- Eldridge et al. (2018) Eldridge, J. J., Xiao, L., Stanway, E. R., Rodrigues, N., & Guo, N. Y. 2018, PASA, 35, 49, doi: 10.1017/pasa.2018.47
- Farrell et al. (2020) Farrell, E. J., Groh, J. H., Meynet, G., et al. 2020, MNRAS, 495, 4659, doi: 10.1093/mnras/staa1360
- Fraser et al. (2011) Fraser, M., Ergon, M., Eldridge, J., et al. 2011, Monthly Notices of the Royal Astronomical Society, 417, 1417
- Fuller (2017) Fuller, J. 2017, MNRAS, 470, 1642, doi: 10.1093/mnras/stx1314
- Gaia Collaboration et al. (2018) Gaia Collaboration, Brown, A., Vallenari, A., Prusti, T., et al. 2018, Astronomy & astrophysics, 616, A1
- Gies (1987) Gies, D. R. 1987, ApJS, 64, 545, doi: 10.1086/191208
- Goldman et al. (2017) Goldman, S. R., van Loon, J. T., Zijlstra, A. A., et al. 2017, Monthly Notices of the Royal Astronomical Society, 465, 403
- Götberg et al. (2018) Götberg, Y., de Mink, S. E., Groh, J. H., et al. 2018, A&A, 615, A78, doi: 10.1051/0004-6361/201732274
- Groh et al. (2013) Groh, J. H., Meynet, G., & Ekström, S. 2013, A&A, 550, L7, doi: 10.1051/0004-6361/201220741
- Heger et al. (2003) Heger, A., Fryer, C. L., Woosley, S. E., Langer, N., & Hartmann, D. H. 2003, ApJ, 591, 288, doi: 10.1086/375341
- Heger et al. (1997) Heger, A., Jeannin, L., Langer, N., & Baraffe, I. 1997, arXiv preprint astro-ph/9705097
- Kee et al. (2021) Kee, N. D., Sundqvist, J. O., Decin, L., de Koter, A., & Sana, H. 2021, A&A, 646, A180, doi: 10.1051/0004-6361/202039224
- Kiminki & Kobulnicky (2012) Kiminki, D. C., & Kobulnicky, H. A. 2012, ApJ, 751, 4, doi: 10.1088/0004-637X/751/1/4
- Kobulnicky & Fryer (2007) Kobulnicky, H. A., & Fryer, C. L. 2007, ApJ, 670, 747, doi: 10.1086/522073
- Kochanek (2020) Kochanek, C. S. 2020, MNRAS, 493, 4945, doi: 10.1093/mnras/staa605
- Kudritzki & Reimers (1978) Kudritzki, R., & Reimers, D. 1978, Astronomy and Astrophysics, 70, 227
- Langer (2012) Langer, N. 2012, ARA&A, 50, 107, doi: 10.1146/annurev-astro-081811-125534
- Maund et al. (2004) Maund, J. R., Smartt, S. J., Kudritzki, R. P., Podsiadlowski, P., & Gilmore, G. F. 2004, Nature, 427, 129
- Mauron & Josselin (2011) Mauron, N., & Josselin, E. 2011, Astronomy & Astrophysics, 526, A156
- Meynet & Maeder (2000) Meynet, G., & Maeder, A. 2000, A&A, 361, 101
- Meynet & Maeder (2003) Meynet, G., & Maeder, A. 2003, Astronomy & Astrophysics, 404, 975
- Morozova et al. (2017) Morozova, V., Piro, A. L., & Valenti, S. 2017, The Astrophysical Journal, 838, 28
- Nagy et al. (2014) Nagy, A. P., Ordasi, A., Vinkó, J., & Wheeler, J. C. 2014, A&A, 571, A77, doi: 10.1051/0004-6361/201424237
- Nieuwenhuijzen & de Jager (1990) Nieuwenhuijzen, H., & de Jager, C. 1990, Astronomy and Astrophysics, 231, 134
- Nugis & Lamers (2000) Nugis, T., & Lamers, H. J. G. L. M. 2000, A&A, 360, 227
- Paxton et al. (2010) Paxton, B., Bildsten, L., Dotter, A., et al. 2010, The Astrophysical Journal Supplement Series, 192, 3
- Paxton et al. (2013) Paxton, B., Cantiello, M., Arras, P., et al. 2013, The Astrophysical Journal Supplement Series, 208, 4
- Paxton et al. (2015) Paxton, B., Marchant, P., Schwab, J., et al. 2015, The Astrophysical Journal Supplement Series, 220, 15
- Quataert & Shiode (2012) Quataert, E., & Shiode, J. 2012, MNRAS, 423, L92, doi: 10.1111/j.1745-3933.2012.01264.x
- Reimers (1975) Reimers, D. 1975, Memoires of the Societe Royale des Sciences de Liege, 8, 369
- Renzo et al. (2017) Renzo, M., Ott, C. D., Shore, S. N., & de Mink, S. E. 2017, A&A, 603, A118, doi: 10.1051/0004-6361/201730698
- Sana et al. (2012) Sana, H., de Mink, S. E., de Koter, A., et al. 2012, Science, 337, 444, doi: 10.1126/science.1223344
- Smartt (2015) Smartt, S. 2015, Publications of the Astronomical Society of Australia, 32, e016
- Smartt et al. (2009) Smartt, S., Eldridge, J., Crockett, R., & Maund, J. R. 2009, Monthly Notices of the Royal Astronomical Society, 395, 1409
- Smith (2014) Smith, N. 2014, Annual Review of Astronomy and Astrophysics, 52, 487
- Smith & Arnett (2014) Smith, N., & Arnett, W. D. 2014, ApJ, 785, 82, doi: 10.1088/0004-637X/785/2/82
- Smith et al. (2009) Smith, N., Hinkle, K. H., & Ryde, N. 2009, The Astronomical Journal, 137, 3558
- Smith et al. (2011) Smith, N., Li, W., Filippenko, A. V., & Chornock, R. 2011, MNRAS, 412, 1522, doi: 10.1111/j.1365-2966.2011.17229.x
- Sukhbold et al. (2018) Sukhbold, T., Woosley, S. E., & Heger, A. 2018, ApJ, 860, 93, doi: 10.3847/1538-4357/aac2da
- Sundqvist et al. (2019) Sundqvist, J. O., Björklund, R., Puls, J., & Najarro, F. 2019, A&A, 632, A126, doi: 10.1051/0004-6361/201936580
- Utrobin et al. (2017) Utrobin, V. P., Wongwathanarat, A., Janka, H. T., & Müller, E. 2017, ApJ, 846, 37, doi: 10.3847/1538-4357/aa8594
- van Loon et al. (2005) van Loon, J. T., Cioni, M.-R., Zijlstra, A. A., & Loup, C. 2005, Astronomy & Astrophysics, 438, 273
- Vink et al. (2000) Vink, J. S., de Koter, A., & Lamers, H. J. G. L. M. 2000, A&A, 362, 295. https://arxiv.org/abs/astro-ph/0008183
- Vink et al. (2001) —. 2001, A&A, 369, 574, doi: 10.1051/0004-6361:20010127
- Yoon & Cantiello (2010) Yoon, S.-C., & Cantiello, M. 2010, The Astrophysical Journal Letters, 717, L62
- Zapartas et al. (2021) Zapartas, E., de Mink, S. E., Justham, S., et al. 2021, A&A, 645, A6, doi: 10.1051/0004-6361/202037744