44306 Nantes, France
PageRank computation for Higher-Order Networks
Abstract
Higher-order networks are efficient representations of sequential data. Unlike the classic first-order network approach, they capture indirect dependencies between items composing the input sequences by the use of memory-nodes. We focus in this study on the variable-order network model introduced in [12, 10]. Authors suggested that random-walk-based mining tools can be directly applied to these networks. We discuss the case of the PageRank measure. We show the existence of a bias due to the distribution of the number of representations of the items. We propose an adaptation of the PageRank model in order to correct it. Application on real-world data shows important differences in the achieved rankings.
keywords:
Higher-order Networks, Sequential data, Random walks, PageRank1 Introduction
Network representation of real-world sequential data is an effective way to model complexity of interactions between items constituting them (flow of vessels between ports, city traffic, transfers between airports, etc.). A classic network model to represent sequential data is the pairwise interactions aggregation, extracted from the input data. This leads to a first-order Markov model of the sequences which can be represented by a first-order network (denoted on). However, the input sequences might reveal higher-order dependencies between items (see Fig. 1). Recent works [12, 11] suggest that the on representation is not sufficient since it doesn’t capture indirect dependencies in the underlying system. Indeed, if such dependencies exist, a random walk performed on on may result in poor approximations of the flow of movements observed in the system.
Higher-order network (Hon) models are an alternative to the first-order Markov model approach. In Hon, a node (or memory-node) encodes a subsequence of varying length of items rather than a single item. Most of the studied Hon are fixed-order networks (Fonk) where the probability to reach the next item depends on the last visited ones [11, 9]. Other studies consider variable-order models leading to variable-order network (Von) models [12, 10]. Random walks performed on Hon lead to better simulations of input sequences. One can therefore expect the results of random-walk-based network analysis tools such as PageRank (PR) [3] to be more relevant. In the context of Von, [12] argue that such algorithms could be directly applied on variable-order network as they are still defined as weighted graphs. Nevertheless, authors have not investigated a possible bias in the resulting algorithm output due to the presence of memory-nodes.
In this study, we investigate the existence and nature of such bias when using the PR centrality measure. We start by listing related works and discussing the ambiguity of the term higher-order which is used for different purposes in the literature (Section 2). We then describe Von’s construction [10] (Section 3). In Section 4, we introduce the standard PR model and its direct application to Von. We show that the teleportation mechanism used for computing PR values introduced a bias when applying it to Von networks. We introduce a correction as a bias-free PR model adapted for Von. In order to assess the effect of the bias (and of our correction) in practice, we compare the various PR models on real-world sequential datasets (described in Section 5). In section 6, we show that a direct application of PageRank on Von networks leads to an overestimation of the centrality of highly represented items. We also discuss the effect on ranking and its stability with a change of the damping factor parameter . Finally, future works perspective are given in Section 7.
2 Related Works
In the network science and data mining literature, the terms higher-order or high-order may relate to different concepts. For instance, in network clustering analysis, the term higher-order used in [13] refers to network motifs such as triangles and cycles. Authors designed a clustering algorithm preserving such motifs. In our study the term higher-order refers as a network representation of a sequential data aiming to infer the indirect dependencies occurring in the sequences. In [14], such dependencies were also considered, however, they are not been inferred from sequential data.
Rosvall et al. [9] introduced a fixed-order network of order 2 (Fon2) and generalizations of PR and clustering algorithm to this new model. As an order of is limited for many real world applications, Scholtes [11] introduces to infer an optimal order leading to the most accurate fixed-order network. As PR computation may prove cumbersome on fixed-order networks, a Hon PR model called Multilinear PageRank was introduced in [7]. This model is based on a spacey surfer whose next step doesn’t depend on the previous one but on the most frequently visited ones. We focus in this study on variable-order networks (Von) [12, 10]. In this context, the PR computation of the items differs from the fixed-order model.
3 Variable-order network representation
We detail in this section the method to build variable-order networks (Von) from input sequential data, as well as some important definitions and notations. We note the set of sequences representing the input data. Each consists of a sequence of items (ports, airports, or any locations). The set of all items is denoted . The order of a sequence denoted corresponds to its length. For two sequences and , the sequence is a concatenation of and we say that is a prefix of and that is a suffix of . For a sequence , we call the number of occurrences of in the dataset . The probability of finding item next to sequence is estimated using relative frequencies
| (1) |
where is read ”probability to find having as context ”. We define as the distribution of items following .
Extraction of relevant extensions.
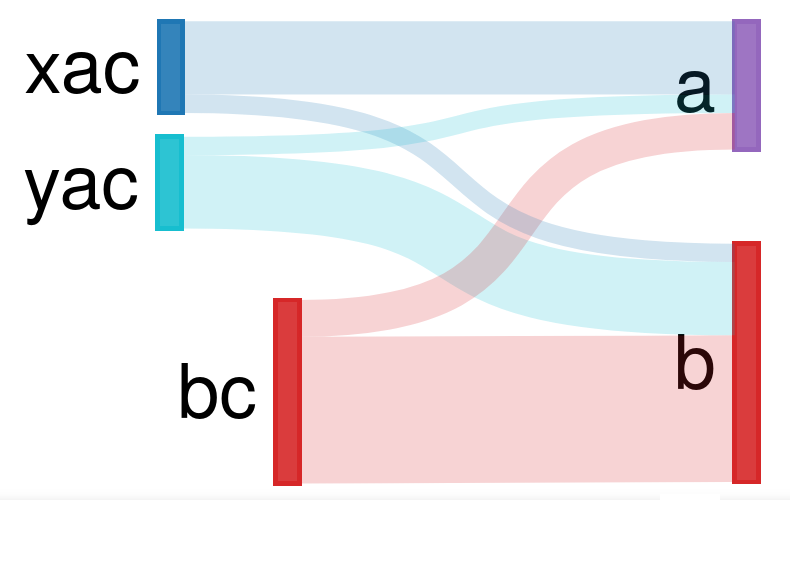
Memory-nodes are added according to relevant extensions found in . The method we used was introduced in [10]. We say is an extension of if and if is a suffix of . The extension of is said to be relevant [10] if
| (2) |
where denotes the Kullback-Leibler divergence. Figure 1(b) shows the distributions for the relevant extensions found in a toy example. The threshold used (right side of Eq. 2) make sit harder for longer and sparsely observed extensions to be found relevant. The process used for relevant extensions extraction starts from the first-order sub-sequences. The condition in Eq. 2 is recursively applied to extension of already detected extensions. An upper-bound of is used to stop the recursion. The construction of Von is therefore parameter-free.
Network construction.
Von is constructed in a way that a memory-less random walk performed on it is a good approximation of the input sequential data . This network is noted , where is the set of nodes. These nodes represent all relevant extensions and all their prefixes (see Fig. 1(c)). This ensures that any node representing a relevant extension of an item is reachable during a random walk. We note the set of nodes representing item and the number of such representations.
For each pair (), where is a relevant extension and an item such that , a directed link is added to the network. The node represents the longest suffix of such that . The weight of this link is .
4 Application of PageRank to variable-order networks
In this section, we first introduce the PageRank (PR) measure and its direct application on Von. We discuss the effect of the distribution of on PR probabilities distribution. In order to isolate this effect, we introduced a biased onPR model. A bias-free model called Unbiased Von PR model is then introduced.
Standard PageRank model (onPR).
The PR measure is an efficient eigenvector centrality measure in the context of directed networks. It was implemented in Google’s search engine by its inventors Brin and Page [3]. PR definition of node’s importance can be interpreted as follows: the more a node is pointed by important nodes, the more it is important. PR is equivalent to the steady state of a random surfer (RS) following a memory-less Markov process. The RS can follow links of the network with probability or teleport uniformly towards a node of the network with probability (it will also teleport from any sink node). These teleportations ensure that RS cannot be stuck in a sub-region of the network and that the steady state probability distribution is unique. The PR probability associated to the node is denoted . As item is represented by a single node in on, the PR probability associated to item () is equal to . One can sort items by the decreasing order of their PR probabilities. We note their ranks associated to values.
Variable-order network PageRank (VonPR).
In the case of Vons, the memory-less Markov process actually simulates the variable-order model as memory is indeed encoded into the nodes. Therefore, [12] suggests that standard PR directly applied to Von will better reflect dependencies between items in the system than . Since more than one nodes represent items in Von, [12] defined the PageRank of an item as the probability for the RS to reach at least one of its representations (see Eq. 3).
| (3) |
We denote by and the PR values and ranking issued from VonPR model.
Since we use a random surfer, the more representations item has, the higher is the probability to teleport to one of them. As Eq. 3 sums over representations of item , this translates to a bias that is solely due to the teleportation mechanism. We can illustrate this effect with a simple example (see Fig. 2). The value of is always greater than or equal to in the situation illustrated in Fig. 2(b) while it is always lower than or equal to in Fig. 2(a). Equality is achieved when (i.e. when there is no teleportation). Although order dependencies exist in 2(b), it is hard to justify why item should be “more central” in this case.
()-biased PageRank model (Biased onPR)
In order to isolate the bias due to teleportations, we assume the transition probabilities associated to representation of item are all equal to i.e. the representations of do not encode any different behaviour. This is equivalent to computing PR on on using a preferential teleportation vector depending on as expressed in Eq. 4.
Unbiased Von PageRank model.
In order to remove the bias discussed above, a modification of the teleportation vector is also used (see Eq. 5). Although several corrections are possible, the one chosen corresponds to the following random surfing process: teleportation is assumed to be the beginning of a new journey. It is therefore only possible to teleport uniformly to first-order nodes (see Eq. 5).
| (5) |
It is easy to show that each node is reachable during the Markov process and therefore that the RS steady state is still unique using this teleportation vector. The item PR values associated to this model and its resulting ranking are noted and respectively.
5 Datasets and Experimental settings
Datasets.
The three datasets used correspond to spatial trajectories. They differ however in terms of length, number of sequences, number of items, etc.. For each dataset and each sequence, we removed any repetition of items. The code used and the datasets are available at https://github.com/ccoquide/unbiased-von-pr/.
-
•
Maritime : Sequences of ports visited by shipping vessels, from April the 1st to July the 31st 2009. Data are extracted from the Lloyd’s Maritime Intelligence Unit. A variable-order network (Von) analysis of maritime is presented in [12].
- •
-
•
Taxis : Taxis rides into Porto City from July the 1st of 2013 to June the 30th of 2014. A sequence reports the succession of positions (recorded every 15 seconds) during a ride. The original data set [1] was part of the ECML/PKDD challenge of 2015. Each GPS location composing the sequences is reported onto the nearest police station as it is suggested in [10].
Sequences and networks statistics are reported in Table 1. We can observe that a large proportion of items have a large number of representations . The values are far from being uniformly distributed.
| Dataset | order | Avg. | ||||||
|---|---|---|---|---|---|---|---|---|
| Maritime | 4K | 909 | 18K | 47K | 8 | 20 | 50 | 674 |
| Airports | 2751K | 446 | 443K | 1292K | 6 | 995 | 1K | 34K |
| Taxis | 1514K | 41 | 4K | 15K | 14 | 99 | 250 | 382 |
Experimental settings.
For a given dataset, we compute PR values according to the different models with along with the corresponding rankings (see Section 4). Items having the same PR probabilities are ranked using the same order. In addition to the four models described in the previous section, we also report the following measures.
-
•
ranking () is the ranking of items by decreasing order of . We quantify how -biased are other PR models by comparing them with this benchmark.
-
•
Visit rank () is the ranking based on the probability of each item to occur in the input sequences.
The visit rank is used as “ground truth” in [11, Eq. 9] for validation of the author’s selection of fix-order model. However, we argue that this characterization is limited. For example, in the extreme situation where sequences are composed of only two items and can be viewed as a list of directed arcs, would correspond to the ranking made from node degrees. More generally, using the item count as a centrality measure assumed an underlying symmetry in the system i.e. every place is as much a destination as it is a departure.
6 Results
We show here that the bias effect is indeed important when looking at values or the resulting rankings. Moreover, this is still true when using alternative damping factor values.
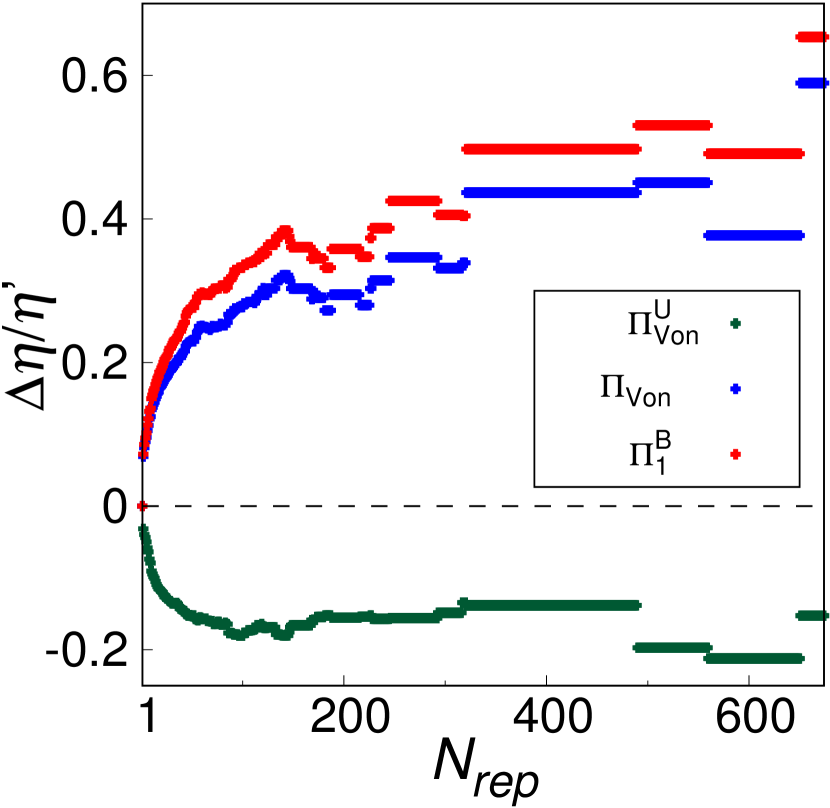
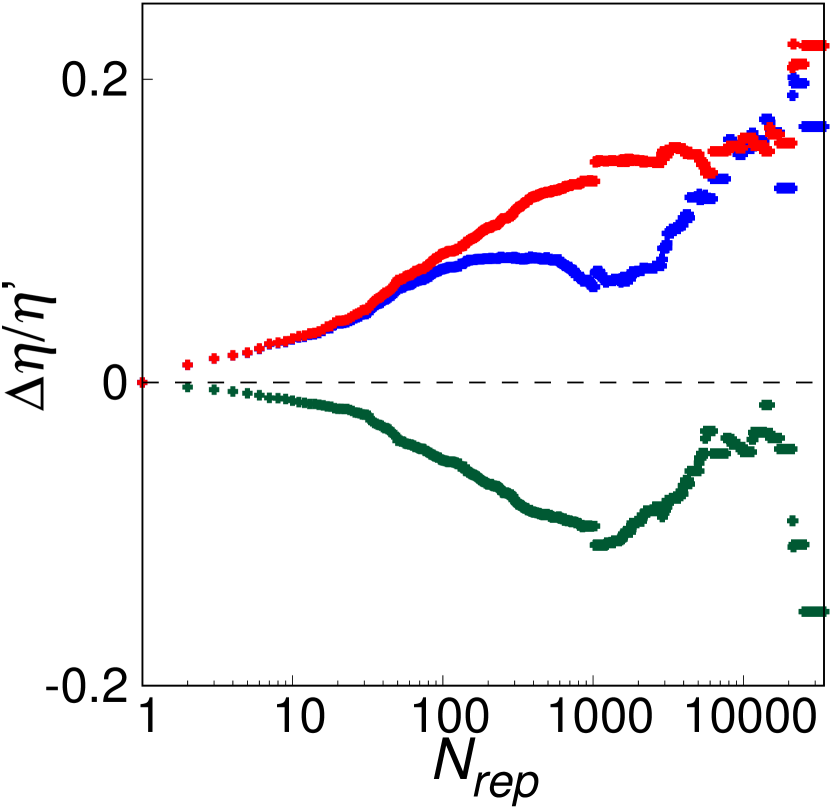
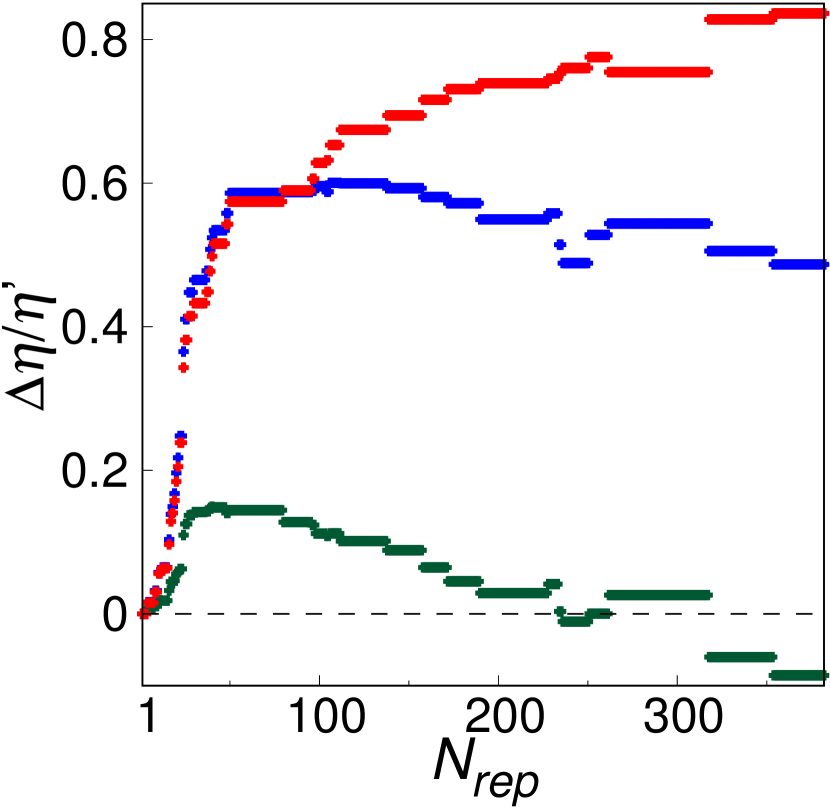
Evolution of values with .
We note the probability that a random surfer (RS) visits any item having at least representations such as
| (6) |
The impact of on PR probabilities is quantified by the relative PR boost where is related to the onPR model. We show the evolution of with in Fig. 3 for each dataset. Both VonPR () and Biased onPR () models are the ones with the highest relative PR boosts. For example, in case of Maritime dataset (see Fig. 3(a)), the relative PR boosts, at , equal to and respectively for these models (compared to onPR probabilities ). Moreover, we see that the PR boosts relative to fit well with ones. The Unbiased VonPR probabilities () are impacted very differently. For the Airports and Taxis datasets, the distributions shape of boosts is similar to VonPR’s but with lower boost values. Although relative PR boosts are the lowest for our model, the higher-order dependencies it encodes still lead to differences with onPR. However, the fact that PR probabilities are boosted for highly represented items doesn’t necessarily lead to resulting biased PR rankings. Therefore, we investigate the changes in rankings when using the different models.
Rankings comparison.
We quantified similarities between pairs of PR rankings by using both Spearman and Kendall correlation coefficients. Table 2 displays similarities for each dataset. We observe high similarity between VonPR () and Biased onPR () rankings. On the other hand, correlation coefficients between Unbiased VonPR rankings () and are lower. We also observe overall lower correlation coefficients with Taxis dataset which are probably due to the lower number of items. Note that the visit rank () is closer to or (for Taxis). If we were to use as a PR selection method, we would likely select our biased onPR model which does not include any higher order dependencies. This highlights the fact that is not an efficient benchmark in the context of Von.
| a) Maritime | ||||||||
| - | - | |||||||
| - | - | - | - | |||||
| 0. | ||||||||
| b) Airports | ||||||||
| - | - | |||||||
| - | - | - | - | |||||
| 0.99 | ||||||||
| c) Taxis | ||||||||
| - | - | |||||||
| - | - | - | - | |||||
The -bias also affects the Top 10s ranking which is a popular usage of PR ranking. The Top 10s related to Maritime are displayed in Table 3. Ports with bold name are new entries when compared to the previous ranking. Although of entries are common to all Top 10s, the differences come from reordering. Both and fit almost perfectly with the ten most represented ports (). On the other hand, may capture items with bad e.g. the port of Surabaya ( and ).
| Rank | Port | Port | Port | Port | ||||||||
|---|---|---|---|---|---|---|---|---|---|---|---|---|
| 1 | Singapore | 2 | 2 | Singapore | 2 | 2 | Hong Kong | 1 | 1 | Singapore | 2 | 2 |
| 2 | Hong Kong | 1 | 1 | Hong Kong | 1 | 1 | Singapore | 2 | 2 | Busan | 4 | 4 |
| 3 | Rotterdam | 5 | 7 | Shanghai | 3 | 3 | Shanghai | 3 | 3 | Hong Kong | 1 | 1 |
| 4 | Busan | 4 | 4 | Busan | 4 | 4 | Busan | 4 | 4 | Rotterdam | 5 | 7 |
| 5 | Shanghai | 3 | 3 | Rotterdam | 5 | 7 | Rotterdam | 5 | 7 | Shanghai | 3 | 3 |
| 6 | Hamburg | 8 | 10 | Port Klang | 6 | 6 | Port Klang | 6 | 6 | Hamburg | 8 | 10 |
| 7 | Port Klang | 6 | 6 | Kaohsiung | 7 | 5 | Kaohsiung | 7 | 5 | Antwerp | 10 | 12 |
| 8 | Antwerp | 10 | 12 | Hamburg | 8 | 10 | Hamburg | 8 | 10 | Bremerhaven | 12 | 19 |
| 9 | Bremerhaven | 12 | 19 | Antwerp | 10 | 12 | Antwerp | 10 | 12 | Surabaya | 45 | 36 |
| 10 | Kaohsiung | 7 | 5 | Jebel Ali | 9 | 11 | Jebel Ali | 9 | 11 | Port Klang | 6 | 6 |
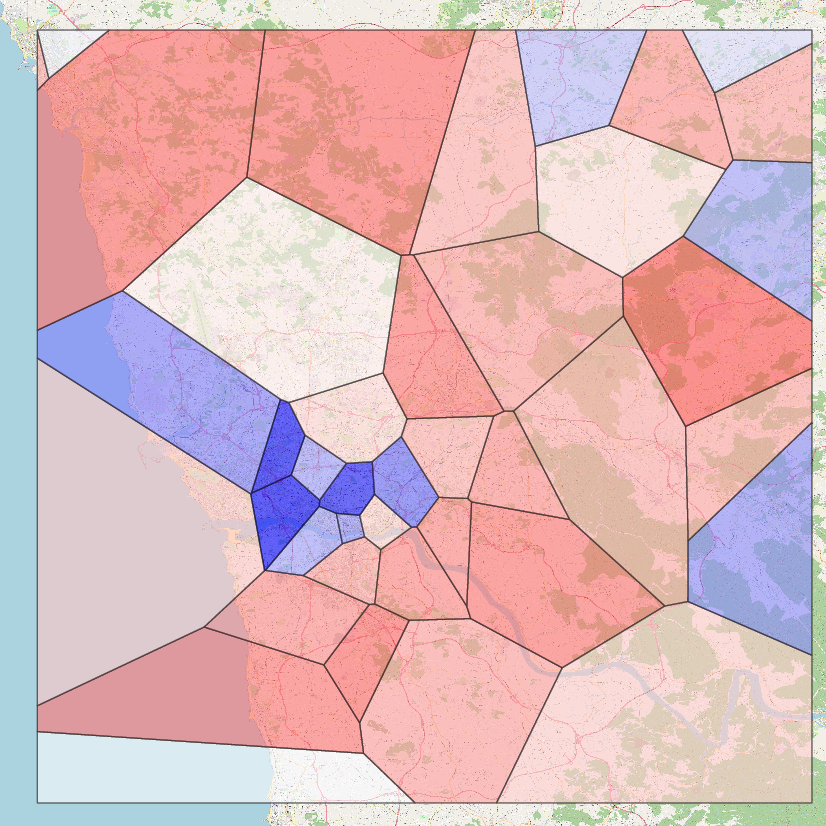
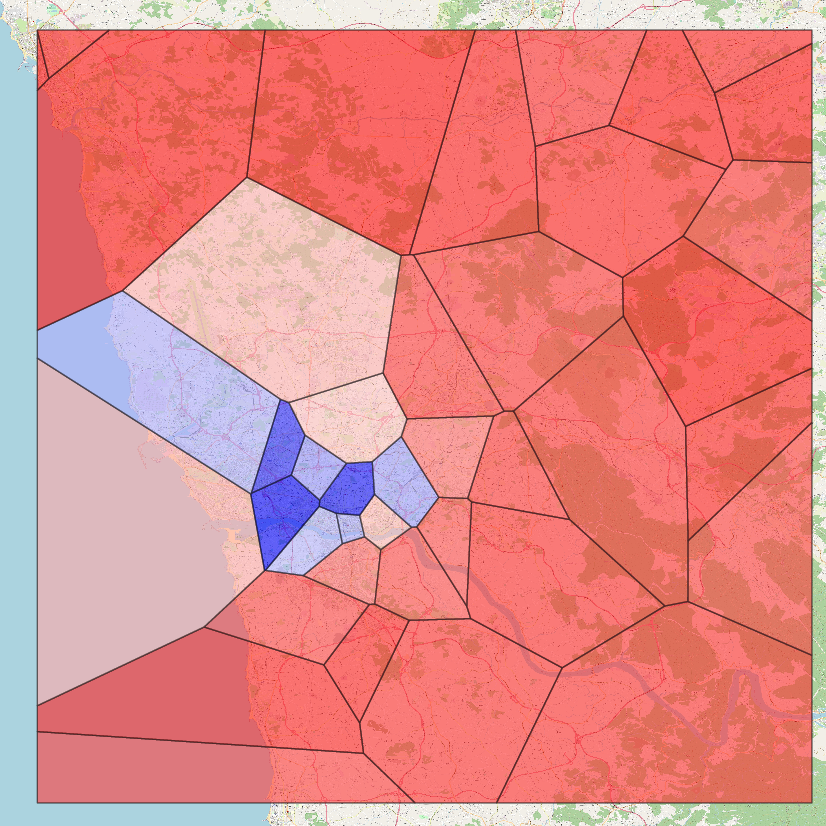
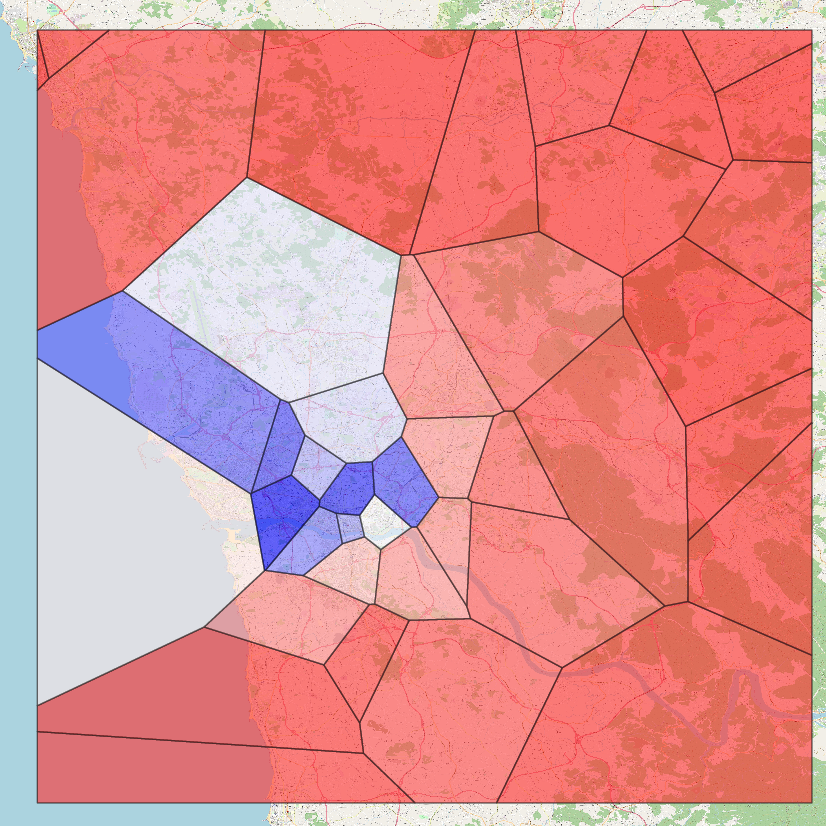
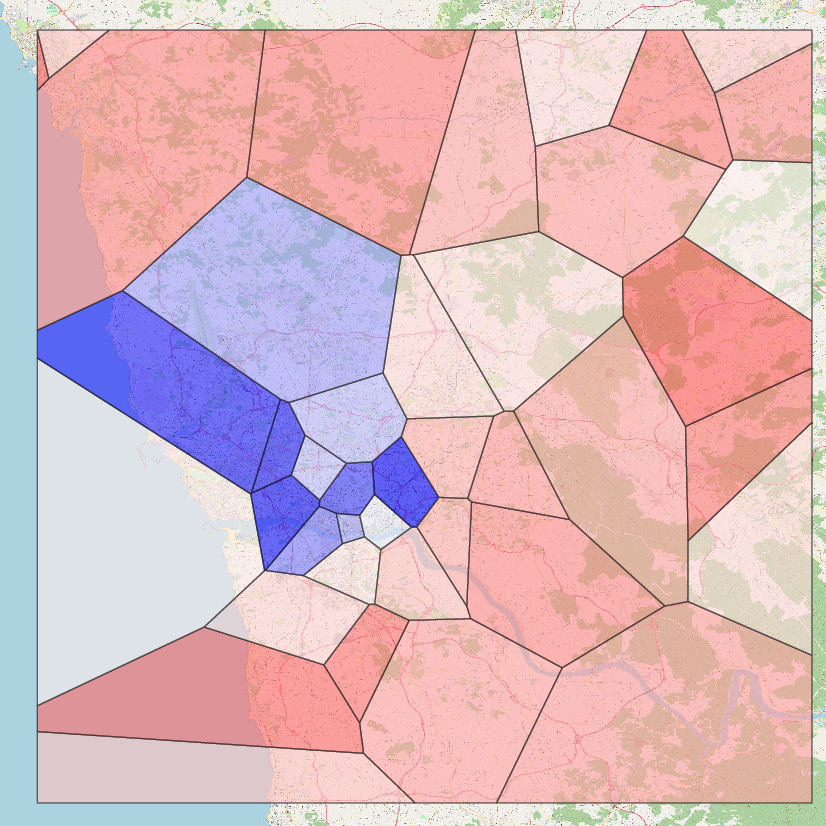
Since the number of items composing Taxis dataset (corresponding to subareas of Porto) is small enough, the PR scores of all items are given in Fig. 4. Both and give bad ranks to peripherals. Only onPR and Unbiased VonPR models give importance to peripheral neighborhoods. Finally, central regions have similar rankings whatever the model used.
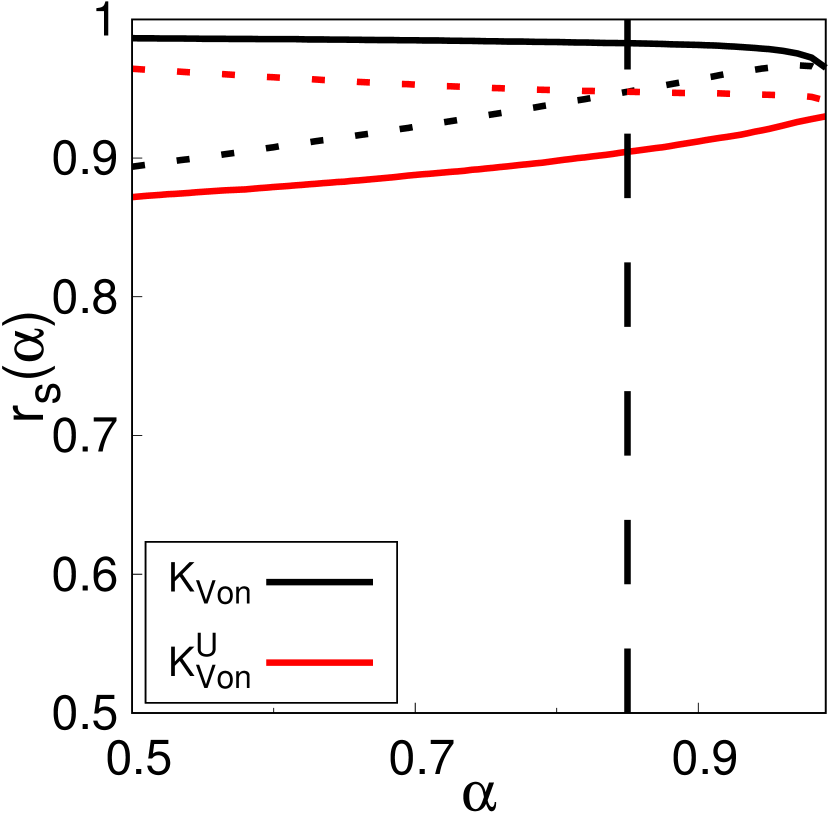
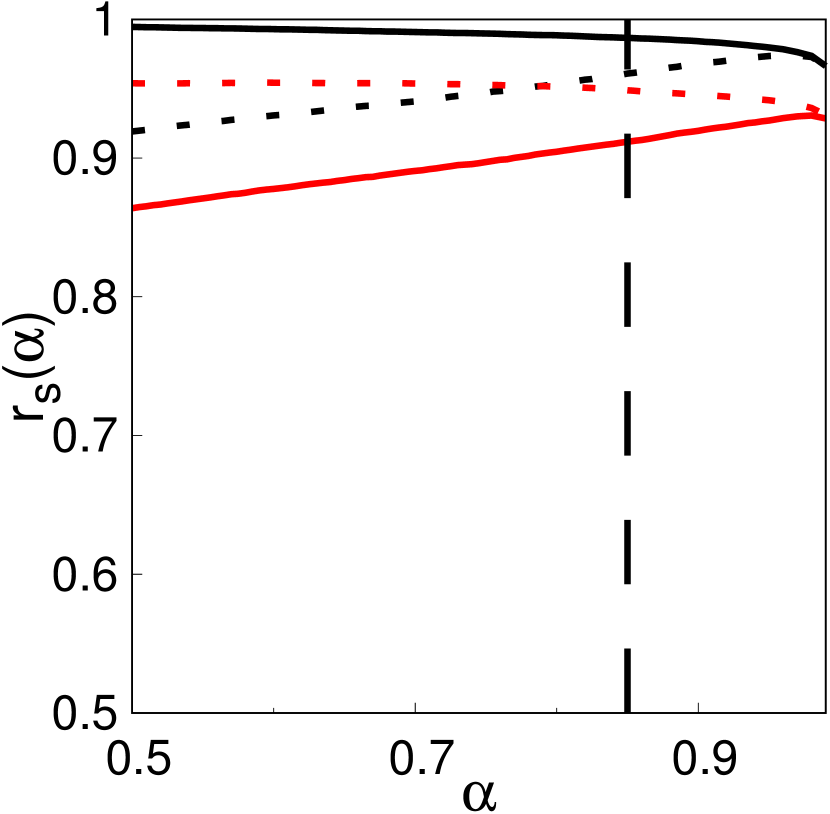
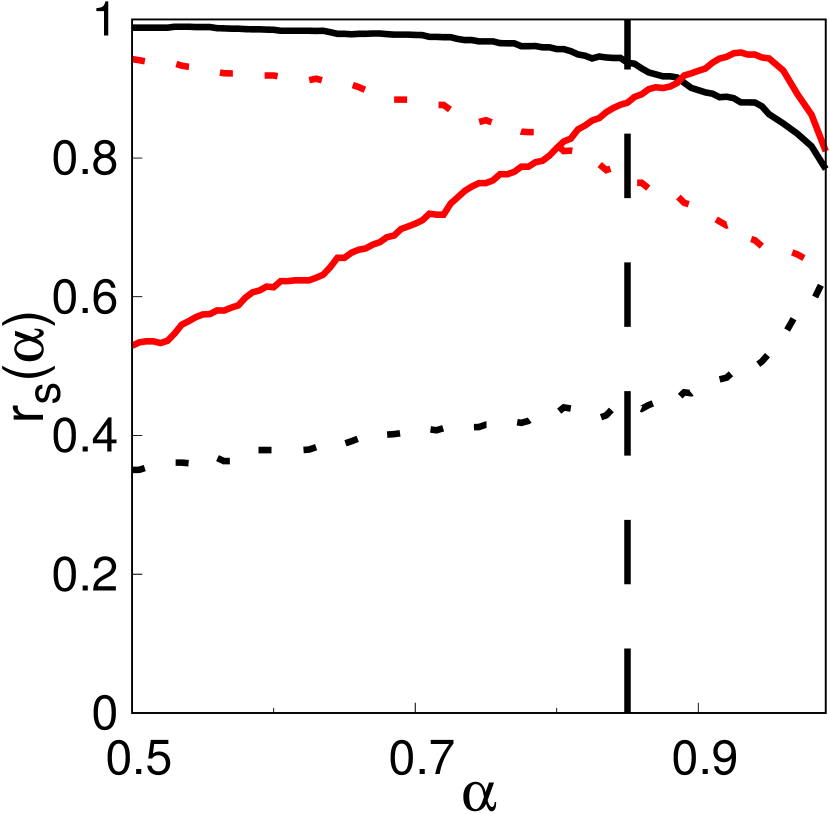
Dependence of the -bias with the damping factor .
Since in the literature an alternative value of the damping factor could be used (as in [4]), we investigated similarities between rankings regarding its choice. The evolution of Spearman correlation coefficient with respect to changes in is present in Fig. 5 for . Results related to the Kendall correlation coefficient evolution are not reported since they are similar. For , the observations made earlier are still valid. When teleportations are less frequent, different changes occur. Indeed, for Maritime and Airports, becomes closer to than is to (dashed lines). Overall the pairs - and - get closer as tends to due to the poor contribution of teleportations. For the taxis, we notice a switch at for (solid lines). We think this is due to the low amount of items related to Taxis dataset. In order to understand this behaviour, we need to further investigate other similar datasets.
7 Future works
This study shows that the application of network measures to the new objects that are Vons are not trivial. We believe the adaptation of other analysis tools is an important challenge for the network science community. We are currently investigating the application of clustering algorithms such as Infomap [8] to Vons. This algorithm indeed uses PR in order to compare clustering qualities. However, [12] also suggests that such algorithm can be directly applied to Vons with no modifications. The PR centrality measure has other applications. A recent method based on the Google matrix (the stochastic matrix which models the random surfer), called reduced Google matrix, has shown its efficiency in inferring hidden links between a set of nodes of interests [6] for example with studying Wikipedia networks [5].Using user traces on website rather than usual hypertext click statistics, we will also study the generalization of this tool to Vons.
References
- [1] Porto taxis Trajectories Data, https://kaggle.com/crailtap/taxi-trajectory
- [2] Rita tansstat database, https://www.transtats.bts.gov/
- [3] Brin, S., Page, L.: The anatomy of a large-scale hypertextual Web search engine. Computer Networks and ISDN Systems 30(1), 107–117 (Apr 1998), https://www.sciencedirect.com/science/article/pii/S016975529800110X
- [4] Coquidé, C., Ermann, L., Lages, J., Shepelyansky, D.L.: Influence of petroleum and gas trade on EU economies from the reduced Google matrix analysis of UN COMTRADE data. The European Physical Journal B 92(8), 171 (Aug 2019), https://doi.org/10.1140/epjb/e2019-100132-6
- [5] Coquidé, C., Lages, J., Shepelyansky, D.L.: World influence and interactions of universities from Wikipedia networks. The European Physical Journal B 92(1), 3 (Jan 2019), https://doi.org/10.1140/epjb/e2018-90532-7
- [6] Frahm, K.M., Jaffrès-Runser, K., Shepelyansky, D.L.: Wikipedia mining of hidden links between political leaders. The European Physical Journal B 89(12), 269 (Dec 2016), https://doi.org/10.1140/epjb/e2016-70526-3
- [7] Gleich, D.F., Lim, L.H., Yu, Y.: Multilinear PageRank. SIAM Journal on Matrix Analysis and Applications 36(4), 1507–1541 (Jan 2015), https://epubs.siam.org/doi/10.1137/140985160, publisher: Society for Industrial and Applied Mathematics
- [8] Rosvall, M., Axelsson, D., Bergstrom, C.T.: The map equation. The European Physical Journal Special Topics 178(1), 13–23 (Nov 2009), https://doi.org/10.1140/epjst/e2010-01179-1
- [9] Rosvall, M., Esquivel, A.V., Lancichinetti, A., West, J.D., Lambiotte, R.: Memory in network flows and its effects on spreading dynamics and community detection. Nature Communications 5(1), 4630 (Aug 2014), https://www.nature.com/articles/ncomms5630, number: 1 Publisher: Nature Publishing Group
- [10] Saebi, M., Xu, J., Kaplan, L.M., Ribeiro, B., Chawla, N.V.: Efficient modeling of higher-order dependencies in networks: from algorithm to application for anomaly detection. EPJ Data Science 9(1), 1–22 (Dec 2020), https://epjdatascience.springeropen.com/articles/10.1140/epjds/s13688-020-00233-y, number: 1 Publisher: SpringerOpen
- [11] Scholtes, I.: When is a Network a Network? Multi-Order Graphical Model Selection in Pathways and Temporal Networks. In: Proceedings of the 23rd ACM SIGKDD International Conference on Knowledge Discovery and Data Mining. pp. 1037–1046. KDD ’17, Association for Computing Machinery, New York, NY, USA (Aug 2017), https://doi.org/10.1145/3097983.3098145
- [12] Xu, J., Wickramarathne, T.L., Chawla, N.V.: Representing higher-order dependencies in networks. Science Advances 2(5), e1600028 (May 2016), https://advances.sciencemag.org/content/2/5/e1600028, publisher: American Association for the Advancement of Science Section: Research Article
- [13] Yin, H., Benson, A.R., Leskovec, J., Gleich, D.F.: Local Higher-Order Graph Clustering. In: Proceedings of the 23rd ACM SIGKDD International Conference on Knowledge Discovery and Data Mining. pp. 555–564. KDD ’17, Association for Computing Machinery, New York, NY, USA (Aug 2017), https://doi.org/10.1145/3097983.3098069
- [14] Zhang, Z., Xu, W., Zhang, Z., Chen, G.: Opinion Dynamics Incorporating Higher-Order Interactions. In: 2020 IEEE International Conference on Data Mining (ICDM). pp. 1430–1435 (Nov 2020), https://doi.org/10.1109/ICDM50108.2020.00189, iSSN: 2374-8486