Improving Dietary Assessment Via
Integrated Hierarchy Food Classification
††thanks: ⋆These authors contributed equally.
Abstract
Image-based dietary assessment refers to the process of determining what someone eats and how much energy and nutrients are consumed from visual data. Food classification is the first and most crucial step. Existing methods focus on improving accuracy measured by the rate of correct classification based on visual information alone, which is very challenging due to the high complexity and inter-class similarity of foods. Further, accuracy in food classification is conceptual as description of a food can always be improved. In this work, we introduce a new food classification framework to improve the quality of predictions by integrating the information from multiple domains while maintaining the classification accuracy. We apply a multi-task network based on a hierarchical structure that uses both visual and nutrition domain specific information to cluster similar foods. Our method is validated on the modified VIPER-FoodNet (VFN) food image dataset by including associated energy and nutrient information. We achieve comparable classification accuracy with existing methods that use visual information only, but with less error in terms of energy and nutrient values for the wrong predictions.
Index Terms:
Food Classification, Hierarchical Structure, Multi-Task Learning, Dietary AssessmentI Introduction
Assessing dietary intake accurately is challenging, yet an accurate profile of foods consumed is of paramount importance to reveal the true relationship of diet to health [1]. Traditional dietary assessment is comprised of written and orally reported methods that can be time consuming and tedious and are not feasible for everyday monitoring [2, 3]. Error is introduced primarily due to memory [4] and the human inability to accurately estimate food portion size [5].
Recently, modern deep learning techniques [6, 7, 8] have enabled advances of image-based dietary assessment methods [9, 10, 11, 12, 13, 14, 15, 16, 17] which take only food or eating scene images as input and output the food types in the images. However, existing methods only focus on improving food classification accuracy measured by the rate of correctly classified foods based on visual information alone, which is very challenging due to the high complexity and inter-class similarity of foods. Therefore, under the circumstance of noticeable classification error rate, a better mistake will enable a more accurate match of the food to a similar food within a food and nutrient database to improve the estimation of energy or dietary components within the food compared with a ground truth. Figure 1 shows an example of a misclassified food image where our proposed method gives the best prediction result in terms of energy and macronutrients values compared with flat (non-hierarchical) CNN and visual based hierarchy method [9].
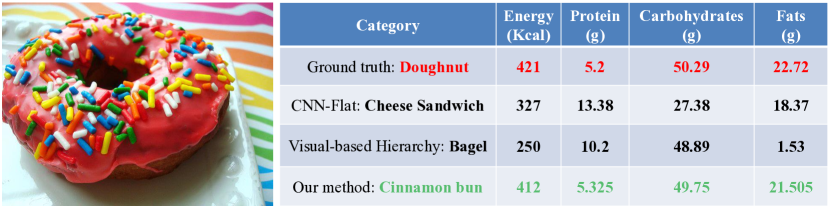
The concept of hierarchy has been studied in deep learning based image classification [19, 20], which showed promising results. For food image classification, both [9, 10] proposed hierarchy based multi-task learning to improve the classification accuracy. However, a number of challenges remain to be addressed. Wu et al. [10] proposed to use semantic hierarchy to learn the relationship between food categories. A better mistake is defined to have closer semantic meaning to the ground truth food category. However, the semantic hierarchical structure is manually generated for a specific food dataset [21], which cannot be generalized to other foods easily. In addition, food names are not unique for different geographic regions and are deeply rooted in local culture, making it challenging to build an adaptive semantic hierarchical structure. Recently, Mao et al. [9] proposed to build a visual hierarchical structure by extracting the visual features from CNNs and then measure the similarity score between food categories, which can be easily applied to different food image datasets. However, both methods achieved better mistakes measured by using visual information only, which is not sufficient for assessing dietary intake as illustrated in Figure 1.
In this work, we introduce a novel cross-domain food classification framework to improve the quality of incorrect predictions in nutrition domain. We tackle both nutrition and visual domain information and embed them into a hierarchical structure for multi-task learning. Without losing the classification accuracy, our method is the first work to include nutrition domain information in food image classification. Our method is evaluated on the modified version of the VIPER-FoodNet (VFN) food image dataset [9]. The original VFN dataset contains more than 20k images of some of the most commonly consumed foods in the United States. We further enhanced this dataset by including the associated energy and macronutrients information (100g food sample) for each food category obtained from USDA Food and Nutrient Database for Dietary Studies (FNDDS) database [18].
II Our Proposed Method
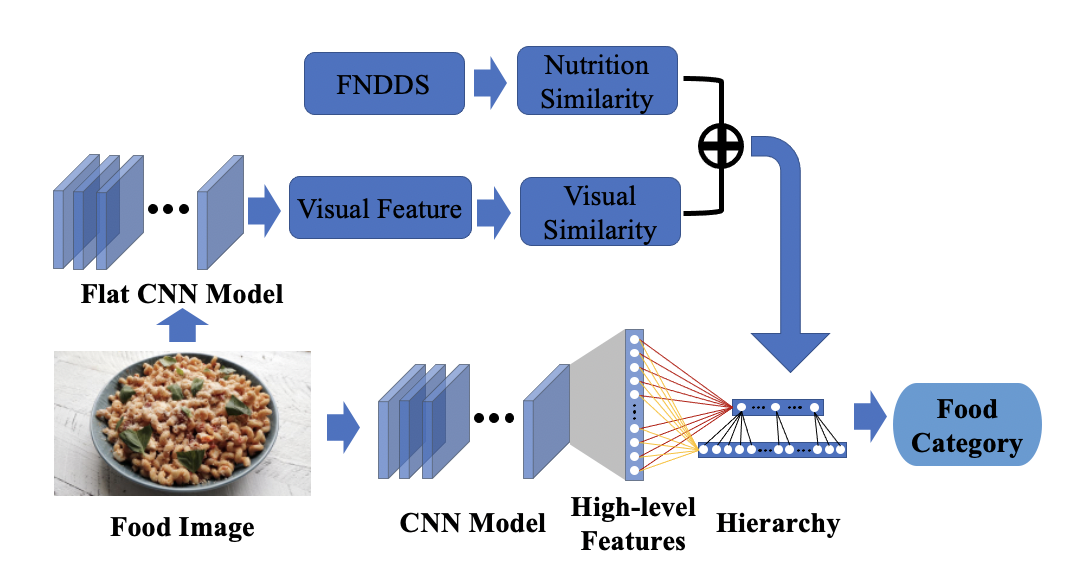
An overview of our proposed method is illustrated in Figure 2. We first extract the visual feature map for each food image by training a flat CNN model using cross-entropy loss. Next, we calculate the similarity matrix based on both visual and nutrition domain information. Affinity Propagation (AP) is used to build a two-level hierarchy. Finally, we apply a multi-task network based on the obtained hierarchical structure for classification.
II-A Cross-Domain Similarity Measure
Systems of food classification have traditionally been defined based on the convention of how foods are included in a diet [22]. For example, there is not a scientific definition of a vegetable. Each food is comprised of a panel of nutrients and the same nutrient may have significantly different distributions for different foods. In addition, dietary assessment often focuses on particular nutrients to evaluate the nutrition status of targeted population. For example, a low sodium diet and a fat-restricted diet weight the importance of sodium and fat differently. Accordingly, a good similarity measure based on nutrients should unify cross-domain nutrition information, and provide a fusion mechanism that can adapt to different dietary assessment needs. In this work, we propose a similarity matrix to measure different nutrition information, e.g., energy, carbohydrate, fat and protein, and an adaptive parameter that can prioritize each contributing nutrient for a specific dietary assessment goal.
Due to the wide range of nutritional values, the inter-class standard deviation is used as a scaling factor in the similarity measure as shown in Table I. We use the RBF kernel, Equation 1, to measure the similarity between different foods for each selected nutrition domain information, which is denoted by the nutrient value , and the inter-class standard deviation . This results in a single similarity score normalized in the range (0,1] for each nutrient. We adopt the weighted harmonic mean, Equation 2, to dynamically unify different nutrition domain information for similarity measure. The similarity score of each nutrient is denoted as and weighted by parameter . The final nutrient similarity score can be tuned for different dietary purposes by adjusting the parameter .
| (1) |
| (2) |
| Energy (kcal) | Carb. (g) | Fat (g) | Protein (g) | |
|---|---|---|---|---|
| Std | 119.48 | 16.96 | 8.37 | 7.71 |
| Range | [34.0, 595] | [0.71, 68.1] | [0.15, 51.7] | [0.16, 30.5] |
To integrate the visual feature for similarity measure, we follow the procedure mentioned in [9] which uses the output of the last feature extraction layer of the backbone network as the visual feature. We fit the histogram of each feature dimension to a Gaussian distribution, and calculate the overlapped coefficient (OVL) [23] to represent the similarity between food classes. Therefore, the visual similarity score, is also in the range (0,1]. We then normalize both the visual similarity matrix and nutrition similarity matrix to represent the overall inter-class similarity as the equally weighted harmonic mean:
| (3) |
Therefore, the clustering result based on this similarity matrix could group food categories that are not only visually similar but also have similar nutrition values.
II-B Clustering and Hierarchical Multi-task Learning
For food classification, as described in previous works [10, 9], the hierarchical structure can be combined with a multi-task model to improve the performance by leveraging the inter-class relations embedded in the hierarchy. To build the hierarchical structure for our system, we needed to cluster similar food categories first. Based on the similarity matrix described in II-A, many clustering methods can be applied. In this paper, we choose the Affinity Propagation (AP) [24] since it does not require a pre-defined number of clusters. We use AP to cluster similar food categories and generate a multi-level hierarchical structure. AP treats all food categories as candidates and selects candidates as exemplars to represent the clusters respectively. Such selection is iteratively refined until convergance.
Once the hierarchical structure is built, the multi-task model is employed for joint feature learning. In our implementation, we build a two level hierarchy where the upper-level nodes represent food clusters and the bottom level nodes represent food categories. Therefore, we have two tasks assigned to the multi-task model, i.e., -level category predication and -level cluster prediction. The multi-task loss is formulated as:
| (4) |
where is the corresponding class/cluster label for the hierarchical level. represent the network parameters for the output layer, and denote the parameters for the feature extraction layers. is the hyperparameter that controls the weight of these two cross-entropy losses. The joint feature learning will help the network extract the feature not only valuable for food category classification but also benefit cluster classification.
III Experimental Results
We select four nutrition information including Energy, Carbohydrate, Fat, and Protein calculated using 100g food samples and embed one or multiple of them in our food classification system. Since energy is not a nutrient, we do not combine it with other nutrient information in our classification system. In all experiments, we fixed as 1 for nutrition similarity measure and set for multi-task learning.
III-A Dataset Preprocessing
Since existing public food image datasets [21, 25, 26, 27, 28, 29] do not contain information about the associated nutrient information for each food category, we build a unique dataset in this paper. We select the food images from the VIPER FoodNet (VFN) food image dataset [9], which contains 82 of the most frequently consumed foods in the U.S. based on What We Eat in America (WWEIA) food category classification [30]. Each food category can map to multiple food codes and nutrient information in the Food and Nutrient Database for Dietary Studies (FNDDS) database [18]. Based on the FNDDS database, we made the following modifications to the VFN dataset. We combined ‘taco’ and ‘tostada’, ‘cake’ and ‘cupcake’ as they share the same nutrient information. Beverages were removed since they are typically assessed differently than foods. A total of 74 food categories are selected for visual recognition. We collected 1,869 food items in FNDDS that belong to these food categories. Since a single food category contains multiple food items, we take the average of the nutrient values and energy information of all food items to represent the food category.
III-B Clustering Evaluation
We evaluate the proposed clustering strategy based on the intra-cluster and inter-cluster relations from both nutrition and visual perspectives. Based on all the nutrition information we found in Section III-A, we calculate the intra-cluster and inter-cluster variances for each nutrition information,
| (5) |
| (6) |
where is the total number of images in the dataset. is the total number of images in the cluster . is the nutrition information of food category in cluster . is the mean value of cluster , and is the mean value of selected nutrition information on the entire dataset.
Table II summarizes the intra-cluster and inter-cluster variances of clustering results based on different nutrition information. Clustering solely based on the visual feature does not give good clustering results from nutrition perspective since the intra-cluster variance is very large and some are quite close to the inter-cluster variance. For other clustering results, we highlight the variances corresponding to the selected nutrition information. For example, “F+P+V” means that the similarity measure for clustering considers fat, protein, and visual information and the results show that it has low intra-class variance and high inter-cluster variance for fat and protein. Note that it is not meaningful to compare the unselected nutrition information since it is not embedded in the clusters.
| intra | inter | |||||
| V | 9245.0 | 5029.5 | ||||
| E+V | 1748.8 | 12525.7 | ||||
| intra | inter | intra | inter | intra | inter | |
| V | 187.8 | 99.9 | 56.5 | 13.5 | 28.3 | 31.1 |
| C+V | 16.4 | 271.3 | 55.5 | 14.5 | 26.7 | 32.7 |
| F+V | 163.6 | 124.1 | 6.2 | 63.8 | 27.0 | 32.4 |
| P+V | 143.7 | 144.0 | 51.8 | 18.2 | 3.3 | 56.1 |
| C+F+V | 77.5 | 210.2 | 8.6 | 61.3 | 18.2 | 41.2 |
| C+P+V | 49.8 | 238.9 | 42.1 | 27.9 | 3.7 | 55.7 |
| F+P+V | 98.1 | 189.6 | 17.2 | 52.8 | 7.8 | 51.6 |
| C+F+P+V | 53.0 | 234.7 | 22.3 | 47.7 | 8.6 | 50.8 |
To evaluate the visual similarity of the clustering results, we first generate a visual distance matrix where is the visual similarity matrix containing similarity score in range (0,1]. The inter-cluster distance and intra-cluster distance are formulated as:
| (7) |
| (8) |
where is the total food category number in cluster and is the visual distance between category and in cluster . For intra-cluster distance, we choose the maximum distance, assuming worst case scenario. For inter-cluster distance, we choose the exemplar determined by Affinity Propagation (AP) as the centroid to represent the cluster. in Equation 8 is the distance between centroids of cluster and cluster . is the total number of clusters. Table III summarizes visual distance of the intra-cluster, inter-cluster and the ratios between them for different clustering results. Clustering based on visual similarity alone has the best ratio. All other cases, which embed nutrition information, have higher ratio but still smaller than 1, indicating nutrition and visual information are successfully balanced and combined during clustering.
| Visual Distance | |||
|---|---|---|---|
| intra | inter | intra/inter | |
| V | 0.4345 | 0.5302 | 0.8195 |
| E+V | 0.4320 | 0.5026 | 0.8595 |
| C+V | 0.4299 | 0.4803 | 0.8949 |
| F+V | 0.4625 | 0.4673 | 0.9896 |
| P+V | 0.4456 | 0.5222 | 0.8534 |
| C+F+V | 0.4255 | 0.4995 | 0.8519 |
| C+P+V | 0.4514 | 0.4913 | 0.9189 |
| F+P+V | 0.4781 | 0.4993 | 0.9574 |
| C+F+P+V | 0.4320 | 0.5072 | 0.8517 |
III-C Nutrition Analysis
Since our proposed method is the first to consider cross-domain food classification by integrating nutrition-domain information, there is no previous methods that can be used for comparison. We implement two baselines for comparison in this section: (1) Flat training model: without considering the nutrient information and treat the food classification problem similar to image classification; (2) Visual based hierarchical classification [9]: a previous work that considers visual similarity among foods to improve the prediction accuracy. For all methods, we use pre-trained ResNet-50 [6] as the backbone classification network, and train our model with the Adam optimizer [31]. The learning rate starts at 0.0001 and drops by a factor of 2 after every 5 epochs for a total of 50 epochs. As shown in Table IV, we found flat training classification and all hierarchy based classifications have comparable accuracy between . This shows the integration of visual and nutrient information is well balanced and does not degrade the classification performance.
| flat | V | E+V | C+V | F+V | |
| Accuracy | 70.13% | 70.33% | 70.31% | 70.68% | 70.54% |
| P+V | C+F+V | C+P+V | F+P+V | C+F+P+V | |
| Accuracy | 70.91% | 70.84% | 70.70% | 70.73% | 70.70% |
In addition, we use the Mean Absolute Error (MAE) to evaluate whether our system makes better mistakes from nutrition perspective.
| (9) |
where is the nutrition value of the predicted food class, is the nutrition value of the ground-truth category. The average results of hierarchy based food classification with nutrition information is shown in Figure 3(a) - 3(d). We treat the flat training and visual-based hierarchical classifications as baselines (blue bars) and compare with those that with nutrition information embedded (orange bars and red bar which is the worst case scenario). Our nutrition embedded hierarchy classification method performs better compared with the baselines for all four nutrition information.
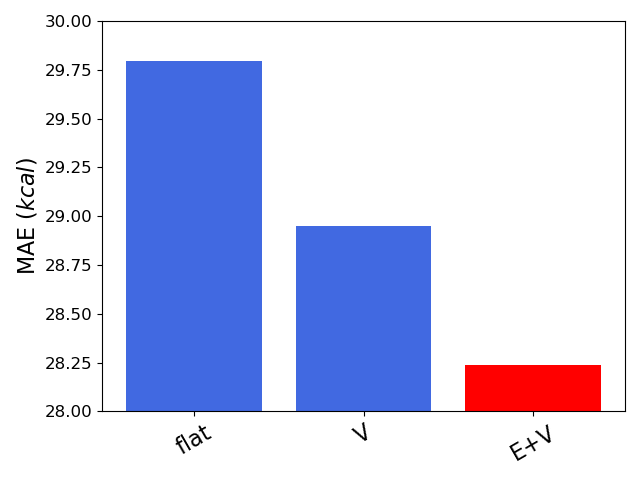
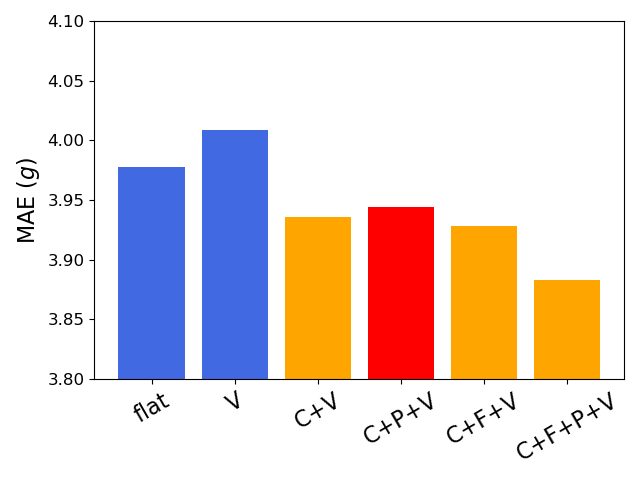
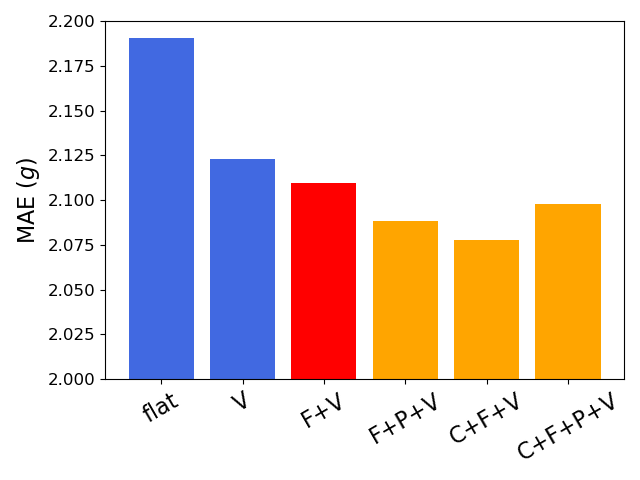
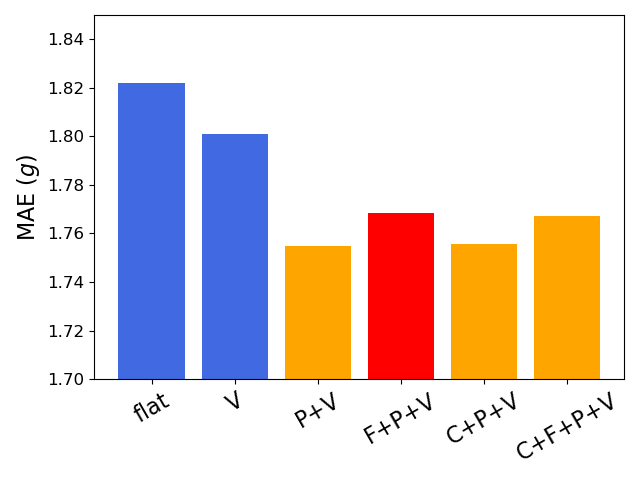
To better understand the improvement from nutrition domain information, we calculate the change in nutrition error compared to the flat training.
| (10) |
where is nutrient error of hierarchy based classification and is the nutrient error of flat training model. Considering the worst case scenarios of our method, red bars in Figure 3: energy+visual, carbohydrate+protein+visual, fat+visual, and fat+protein+visual, the proposed method still achieves 5.2%, 0.8%, 3.7%, and 2.9% relative error reduction, respectively. Although the three nutrients have similar range, carbohydrate is more challenging since its standard deviation is twice as large as shown in Table I. All four methods using carbohydrate still achieves 1.4% error reduction on average and the best case scenario shows 2.4% improvement.
IV Conclusion
In this paper, we present a novel hierarchy based food classification framework to minimize prediction error by integrating both visual and nutrition domain information to improve the performance of food image classification. Our method is evaluated on an enhanced version of the VIPER FoodNet (VFN) food image dataset which includes associated energy and nutrient information for each food classes. We show that our method achieves similar classification accuracy compared with existing methods using visual information only, but minimized prediction error in terms of smaller MAE for the corresponding domain specific information, which shows great potential for assessing dietary intake with a focus on optimizing the accuracy of the nutrient panel information.
References
- [1] J. Reedy, S. M. Krebs-Smith, P. E. Miller, A. D. Liese, L. L. Kahle, Y. Park, and A. F. Subar, “Higher diet quality is associated with decreased risk of all-cause, cardiovascular disease, and cancer mortality among older adults,” The Journal of Nutrition, vol. 144, no. 6, pp. 881–889, 2014.
- [2] K. Poslusna, J. Ruprich, J. H. de Vries, M. Jakubikova, and P. van’t Veer, “Misreporting of energy and micronutrient intake estimated by food records and 24 hour recalls, control and adjustment methods in practice,” British Journal of Nutrition, vol. 101, no. S2, pp. S73–S85, 2009.
- [3] S. I. Kirkpatrick, A. F. Subar, D. Douglass, T. P. Zimmerman, F. E. Thompson, L. L. Kahle, S. M. George, K. W. Dodd, and N. Potischman, “Performance of the automated self-administered 24-hour recall relative to a measure of true intakes and to an interviewer-administered 24-h recall,” The American Journal of Clinical Nutrition, vol. 100, no. 1, pp. 233–240, 2014.
- [4] F. E. Thompson and A. F. Subar, “Dietary assessment methodology,” in Nutrition in the Prevention and Treatment of Disease. Elsevier, 2017, pp. 5–48.
- [5] T. E. Schap, B. L. Six, E. J. Delp, D. S. Ebert, D. A. Kerr, and C. J. Boushey, “Adolescents in the united states can identify familiar foods at the time of consumption and when prompted with an image 14 h postprandial, but poorly estimate portions,” Public Health Nutrition, vol. 1, no. 1, pp. 1–8, July 2011.
- [6] K. He, X. Zhang, S. Ren, and J. Sun, “Deep residual learning for image recognition,” Proceeding of the IEEE Conference on Computer Vision and Pattern Recognition, pp. 770–778, June 2016, Las Vegas, NV.
- [7] G. Huang, Z. Liu, L. van der Maaten, and K. Q. Weinberger, “Densely connected convolutional networks,” Proceedings of the IEEE Conference on Computer Vision and Pattern Recognition, July 2017, Honolulu, HI.
- [8] K. Simonyan and A. Zisserman, “Very deep convolutional networks for large-scale image recognition,” arXiv preprint arXiv:1409.1556, 2014.
- [9] R. Mao, J. He, Z. Shao, S. K. Yarlagadda, and F. Zhu, “Visual aware hierarchy based food recognition,” arXiv preprint arXiv:2012.03368, 2020.
- [10] H. Wu, M. Merler, R. Uceda-Sosa, and J. R. Smith, “Learning to make better mistakes: Semantics-aware visual food recognition,” Proceedings of the 24th ACM International Conference on Multimedia, pp. 172–176, 2016.
- [11] Z. Shao, S. Fang, R. Mao, J. He, J. Wright, D. Kerr, C. Boushey, and F. Zhu, “Towards learning food portion from monocular images with cross-domain feature adaptation,” arXiv preprint arXiv:2103.07562, 2021.
- [12] K. Yanai and Y. Kawano, “Food image recognition using deep convolutional network with pre-training and fine-tuning,” Proceedings of the IEEE International Conference on Multimedia & Expo Workshops, pp. 1–6, July 2015.
- [13] C. Liu, Y. Cao, Y. Luo, G. Chen, V. Vokkarane, and Y. Ma, “Deepfood: Deep learning-based food image recognition for computer-aided dietary assessment,” International Conference on Smart Homes and Health Telematics, pp. 37–48, 2016.
- [14] J. He, R. Mao, Z. Shao, J. Wright, D. Kerr, C. Boushey, and F. Zhu, “An end-to-end food image analysis system,” arXiv preprint arXiv:2102.00645, 2021.
- [15] P. Pandey, A. Deepthi, B. Mandal, and N. B. Puhan, “Foodnet: Recognizing foods using ensemble of deep networks,” IEEE Signal Processing Letters, vol. 24, no. 12, pp. 1758–1762, 2017.
- [16] M. Bolaños and P. Radeva, “Simultaneous food localization and recognition,” 23rd International Conference on Pattern Recognition, pp. 3140–3145, 2016.
- [17] J. He, Z. Shao, J. Wright, D. Kerr, C. Boushey, and F. Zhu, “Multi-task image-based dietary assessment for food recognition and portion size estimation,” IEEE Conference on Multimedia Information Processing and Retrieval, pp. 49–54, aug 2020.
- [18] “USDA food and nutrient database for dietary studies 2017-2018,” Food Surveys Research Group Home Page, http://www.ars.usda.gov/nea/bhnrc/fsrg, jan, 2021.
- [19] Z. Yan, H. Zhang, R. Piramuthu, V. Jagadeesh, D. DeCoste, W. Di, and Y. Yu, “Hd-cnn: hierarchical deep convolutional neural networks for large scale visual recognition,” Proceedings of the IEEE International Conference on Computer Vision, pp. 2740–2748, 2015.
- [20] L. Bertinetto, R. Mueller, K. Tertikas, S. Samangooei, and N. A. Lord, “Making better mistakes: Leveraging class hierarchies with deep networks,” Proceedings of the IEEE Conference on Computer Vision and Pattern Recognition, pp. 12 506–12 515, 2020.
- [21] L. Bossard, M. Guillaumin, and L. V. Gool, “Food-101 – mining discriminative components with random forests,” Proceedings of European Conference on Computer Vision, vol. 8694, pp. 446–461, September 2014, Zurich, Switzerland.
- [22] “What we eat in America, NHANES 2015-2016,” U.S. Department of Agriculture, Agricultural Research Service, Beltsville Human Nutrition Research Center, Food Surveys Research Group (Beltsville, MD) and U.S. Department of Health and Human Services, Centers for Disease Control and Prevention, National Center for Health Statistics (Hyattsville, MD).
- [23] M. Vijaymeena and K. Kavitha, “A survey on similarity measures in text mining,” Machine Learning and Applications: An International Journal, vol. 3, no. 2, pp. 19–28, 2016.
- [24] B. J. Frey and D. Dueck, “Clustering by passing messages between data points,” Science, vol. 315, no. 5814, pp. 972–976, 2007.
- [25] X. Wang, D. Kumar, N. Thome, M. Cord, and F. Precioso, “Recipe recognition with large multimodal food dataset,” 2015 IEEE International Conference on Multimedia & Expo Workshops, pp. 1–6, 2015.
- [26] Y. Matsuda, H. Hoashi, and K. Yanai, “Recognition of multiple-food images by detecting candidate regions,” Proceedings of IEEE International Conference on Multimedia and Expo, pp. 25–30, July 2012, Melbourne, Australia.
- [27] Y. Kawano and K. Yanai, “Automatic expansion of a food image dataset leveraging existing categories with domain adaptation,” Proceedings of European Conference on Computer Vision Workshops, pp. 3–17, September 2014, Zurich, Switzerland.
- [28] G. Ciocca, P. Napoletano, and R. Schettini, “Food recognition: a new dataset, experiments and results,” IEEE Journal of Biomedical and Health Informatics, vol. 21, no. 3, pp. 588–598, 2017.
- [29] L. Deng, J. Chen, Q. Sun, X. He, S. Tang, Z. Ming, Y. Zhang, and T. S. Chua, “Mixed-dish recognition with contextual relation networks,” Proceedings of the 27th ACM International Conference on Multimedia, pp. 112–120, 2019.
- [30] H. Eicher-Miller and C. J. Boushey, “How Often and How Much? Differences in Dietary Intake by Frequency and Energy Contribution Vary among U.S. Adults in NHANES 2007–2012,” Nutrients, vol. 9, no. 1, p. 86, Jan 2017.
- [31] D. P. Kingma and J. Ba, “Adam: A method for stochastic optimization,” arXiv preprint arXiv:1412.6980, 2014.